

Submitted:
27 August 2026
Posted:
28 August 2026
You are already at the latest version
Abstract
Sodium–glucose cotransporter-2 (SGLT2) inhibitors reduce cardiorenal events, but their association with insulin resistance in routine care is incompletely characterised, particularly where medication records cannot exclude exogenous insulin use. In this prospective, single-arm, single-centre cohort study, 54 adults with type 2 diabetes initiating an SGLT2 inhibitor were assessed at baseline, 3 and 6 months. Outcomes were HOMA-IR and the insulin-independent triglyceride–glucose (TyG) index within a family of 15 metabolic and laboratory variables, tested by Wilcoxon signed-rank test with Benjamini–Hochberg control and summarised as the rank-biserial correlation. Median HOMA-IR fell from 8.38 (IQR 3.47–13.26) to 3.14 (2.19–4.39), −62.6% (r = −0.79, adjusted p < 0.001), and the TyG index from 9.45 to 9.04 (−4.3%, r = −0.63, adjusted p < 0.001). Haemoglobin rose 5.0%, consistent with plasma-volume contraction. Change in HOMA-IR did not track change in HbA1c (ρ = −0.15, p = 0.27). An exploratory kidney-disease × time interaction was nominally significant for TyG (β = +0.31, p = 0.040) but not log-HOMA-IR (β = +0.39, p = 0.077). Because the design was single-arm and confounders unrecorded, these are associations observed during therapy, not treatment effects. The divergence between insulin-dependent and insulin-independent indices is relevant to endpoint selection in controlled studies.
Keywords:
SGLT2 inhibitor
; insulin resistance
; HOMA‐IR
; triglyceride–glucose index
; C‐peptide
; type 2 diabetes
; reduced kidney function
1. Introduction
Insulin resistance is a fundamental pathophysiological abnormality underlying the development and progression of type 2 diabetes mellitus (T2DM) and contributes substantially to cardiovascular disease, chronic kidney disease (CKD), and premature mortality [1,2,3]. Although glycemic control remains a principal therapeutic target, residual cardiometabolic risk frequently persists despite improvements in glycated hemoglobin (HbA1c), suggesting that mechanisms beyond glucose lowering influence long-term clinical outcomes [4]. Consequently, improving insulin resistance has emerged as an important therapeutic objective alongside conventional glycemic management.
Accurate assessment of insulin resistance is therefore essential for evaluating metabolic risk and treatment response in patients with T2DM. The Homeostatic Model Assessment of Insulin Resistance (HOMA-IR) is a well-established surrogate marker of hepatic insulin resistance but requires fasting insulin measurements, limiting its routine clinical applicability [2,5]. In contrast, the triglyceride–glucose (TyG) index is derived from routinely available laboratory parameters and has emerged as a simple, reproducible surrogate marker associated with insulin resistance, metabolic syndrome, and adverse cardiovascular outcomes [6,7,8,9,10,11,12]. Insulin resistance surrogates have also been independently associated with long-term cardiovascular mortality in large cohorts [13,14]. Because these indices reflect complementary aspects of metabolic dysfunction, their combined longitudinal assessment may provide a more comprehensive evaluation of treatment response than either marker alone.
Large randomized clinical trials have established that sodium–glucose cotransporter-2 (SGLT2) inhibitors reduce cardiovascular events, slow CKD progression, and improve survival in patients with T2DM [15,16,17,18,19,20,21,22,23,31]. These benefits are reflected in current consensus recommendations positioning SGLT2 inhibitors as foundational therapy in type 2 diabetes [24], with meta-analytic evidence confirming consistent cardiovascular protection across the cardiometabolic disease spectrum [25]. Beyond their glucose-lowering properties, accumulating evidence suggests that these agents favorably influence body composition, systemic inflammation, oxidative stress, hepatic steatosis, and cellular energy metabolism [26,27,28,29,30]. Nevertheless, prospective real-world data evaluating longitudinal changes in validated surrogate markers of insulin resistance remain limited, particularly regarding the complementary behavior of HOMA-IR and the TyG index and the potential influence of kidney function on these metabolic responses.
To address these gaps, we conducted a prospective six-month single-arm cohort study in adults with T2DM initiating SGLT2 inhibitor therapy in routine care, to describe longitudinal changes in HOMA-IR and the insulin-independent TyG index alongside an extended panel of metabolic and laboratory measures. Because the design is single-arm and observational, our objective was descriptive and hypothesis-generating rather than causal: we sought to quantify the magnitude and time course of these changes and, in particular, to compare an insulin-dependent index (HOMA-IR) with an insulin-independent index (TyG) in a setting where medication records could not exclude exogenous insulin use, so that endpoint choice can inform future controlled studies. The translational question we address is practical rather than mechanistic: which surrogate of insulin resistance remains interpretable when it is carried from the controlled trial setting into routine clinical practice, where fasting insulin is not always measurable and concomitant insulin therapy cannot always be excluded.
2. Materials and Methods
2.1. Study Design and Population
This prospective, single-center, real-world cohort study was conducted at Osmaniye Training and Research Hospital, Osmaniye, Türkiye. Consecutive adults (≥18 years) with established type 2 diabetes mellitus (T2DM) who initiated sodium–glucose cotransporter-2 inhibitor (SGLT2i) therapy between January and February 2026 were prospectively enrolled and followed for six months. Final six-month follow-up assessments were completed in July 2026. Consecutive enrollment was used to minimize selection bias and enhance the external validity of the findings by reflecting routine clinical practice.
Eligible participants had a confirmed diagnosis of T2DM and initiated SGLT2 inhibitor therapy according to the clinical judgment of their treating physician and current international guideline recommendations. Exclusion criteria included type 1 diabetes mellitus, pregnancy, active acute illness, previous SGLT2 inhibitor use within the preceding three months, and missing primary outcome data.
Of 61 consecutive patients assessed for eligibility, 54 were enrolled, completed all three study visits and constitute the analytical cohort; 7 were not enrolled; the individual reasons for non-enrolment were not captured in the study dataset and are therefore not reported, which is acknowledged as a limitation of retrospective screening documentation. Participant flow, including per-variable data availability, is shown in Figure 1. Participants received dapagliflozin 10 mg (n = 46, 85.2%) or empagliflozin 25 mg (n = 8, 14.8%) as part of routine clinical care. No participant was lost to follow-up. Analyses were complete-case, without imputation.
2.2. Baseline Kidney-Disease Criterion and Subgroup Classification
Baseline kidney disease was defined according to the Kidney Disease: Improving Global Outcomes (KDIGO) 2022 Clinical Practice Guideline as an estimated glomerular filtration rate (eGFR) <60 mL/min/1.73 m2 and/or a spot urinary albumin-to-creatinine ratio (UACR) >=30 mg/g creatinine. This classification rests on a single baseline assessment and therefore cannot establish chronicity as the guideline requires: among participants flagged at baseline, reduced eGFR persisted at all three visits in a minority. The variable is accordingly reported throughout as the baseline kidney-disease criterion being present or absent, rather than as chronic kidney disease, and the corresponding analyses are exploratory. The criterion was derived directly from the baseline eGFR and UACR values in the analysed dataset by the analysis script (Script S1), so the classification can be reproduced exactly.
2.3. Variables and Derived Indices
Venous blood samples were obtained after an overnight fast of at least 8 hours at each study visit. The following biochemical parameters were measured: fasting serum insulin (µU/mL), C-peptide (ng/mL), fasting plasma glucose (mg/dL), glycated hemoglobin (HbA1c, %), total cholesterol, triglycerides, high-density lipoprotein cholesterol (HDL-C), low-density lipoprotein cholesterol (LDL-C), uric acid (mg/dL), aspartate aminotransferase (AST), alanine aminotransferase (ALT), gamma-glutamyl transferase (GGT) (U/L), serum albumin (g/dL), serum creatinine (mg/dL), estimated glomerular filtration rate (eGFR), urinary albumin-to-creatinine ratio (UACR) (mg/g), hemoglobin (g/dL), and platelet count (10³/µL).
Validated metabolic indices were calculated from fasting laboratory measurements obtained at each study visit as follows: HOMA-IR = (fasting plasma glucose [mg/dL] × fasting serum insulin [µU/mL]) / 405; TyG index = ln [fasting triglycerides (mg/dL) × fasting plasma glucose (mg/dL) / 2]; and FIB-4 = (age × AST) / (platelet count × √ALT). HOMA-IR and the TyG index were selected as complementary surrogate markers of insulin resistance because they reflect different aspects of metabolic dysfunction and have been extensively validated in patients with T2DM. FIB-4 was included as a validated non-invasive marker of hepatic fibrosis to explore potential changes in liver-related metabolic status during follow-up.
2.4. Statistical Analysis
All analyses were performed in Python 3.11 (pandas, NumPy, SciPy, statsmodels); the complete analysis code is provided as Script S1 and the analysed dataset as Data S1, with all variable definitions in Table S1. Distributional assumptions were assessed with the Shapiro-Wilk test and quantile-quantile plots. Because the outcome variables were non-normally distributed, continuous data are summarised as median (interquartile range) and paired baseline-to-6-month changes were tested with the Wilcoxon signed-rank test, with within-pair zero differences excluded; the reported n for each test is therefore the number of non-tied pairs and may be smaller than the number of measured pairs. Effect size is the paired rank-biserial correlation computed from the signed-rank sums, r = (W+ - W-) / (W+ + W-), which ranges from -1 to +1; this quantity is distinct from Z/sqrt(n), which is not reported. Multiplicity was controlled with the Benjamini-Hochberg procedure applied across a single family of 15 metabolic and laboratory variables comprising all metabolic and laboratory outcomes collected in the study; unadjusted and adjusted p values are both reported. Longitudinal modelling used linear mixed-effects models with time entered as a categorical factor (baseline, 3 months, 6 months) and participant-specific random intercepts; a linear time slope was not assumed. HOMA-IR was analysed on the natural-logarithmic scale because residuals of the untransformed model departed markedly from normality (Shapiro-Wilk W = 0.55), so its coefficients are multiplicative; TyG index residuals were approximately normal and that model was fitted on the original scale. Subgroup analyses by baseline kidney disease status are exploratory and were not pre-specified in a dated protocol; they are interpreted on the basis of the group x time interaction term and a direct between-group comparison of within-participant change (Mann-Whitney U test), not on whether an effect reached significance within one group and not the other. The relationship between changes in HOMA-IR and HbA1c was assessed with Spearman’s rank correlation. Two-sided p < 0.05 was considered statistically significant. The de-identified participant-level dataset, a data dictionary and the complete analysis script are provided as Supplementary Material. The script reproduces every reported statistic, the baseline values in Table 1 for the metabolic and laboratory variables, and Figure 2, Figure 3, Figure 4 and Figure 5. Diabetes duration, the specific agent received and background glucose-lowering therapy are not contained in the de-identified dataset, and neither is the screening-log flow in Figure 1; those parts of Table 1 and Figure 1 therefore cannot be regenerated from it. The use of generative artificial-intelligence tools in the analysis and preparation of this work is disclosed in the back matter.
2.5. Sample Size and Power Analysis
No sample-size calculation was performed in advance. As an investigator-initiated prospective exploratory study, the cohort comprised all consecutive eligible patients enrolled during the recruitment window, and the planned sample size was considered adequate to detect within-participant longitudinal changes in metabolic indices and to generate effect-size estimates for future multicentre confirmatory studies. A post hoc power calculation is not reported, because computing power from the observed effect is circular and provides no information beyond the reported confidence intervals. Precision should be judged from the confidence intervals and effect sizes accompanying each result; the modest sample size and the exploratory subgroup analyses are acknowledged as limitations.
2.6. Ethics
The study was approved by the Health Sciences Research Ethics Committee of Osmaniye Korkut Ata University (approval no. 13; 25 December 2025), and all participants provided written informed consent. The study was conducted in accordance with the Declaration of Helsinki. All procedures complied with the ethical standards of the institutional research committee and the Declaration of Helsinki and its subsequent amendments.
2.7. Data Quality Assurance
Clinical and laboratory data were collected prospectively using standardized institutional protocols. Laboratory measurements were performed in the same certified hospital laboratory throughout the study using routine quality-control procedures. Data completeness was verified before statistical analysis, and all analyses were conducted using complete-case data without imputation.
3. Results
3.1. Baseline Characteristics
A total of 54 participants completed the six-month follow-up and were included in the final analysis. The mean age was 61.8 ± 9.2 years, and 31 participants (57.4%) were female. The baseline kidney-disease criterion (eGFR <60 mL/min/1.73 m2 and/or UACR ≥30 mg/g) was met by 22 participants (40.7%), whereas 32 (59.3%) did not meet it. Dapagliflozin was prescribed to 46 participants (85.2%), while 8 (14.8%) received empagliflozin.
At baseline, participants had substantial insulin resistance, with a median HOMA-IR of 8.38 (IQR 3.47-13.26) and a median TyG index of 9.45 (IQR 9.16-9.99). Baseline demographic, clinical and biochemical characteristics are summarised in Table 1.
3.2. Longitudinal Metabolic Changes
HOMA-IR decreased over the six-month follow-up. Median HOMA-IR was 8.38 (IQR 3.47-13.26) at baseline, 3.37 (2.27-6.17) at month 3 and 3.14 (2.19-4.39) at month 6, a 62.6% reduction from baseline to month 6 (Wilcoxon signed-rank test on 54 non-tied pairs, r = -0.79, unadjusted p < 0.001, Family A FDR-adjusted p < 0.001). The insulin-independent TyG index declined in parallel, from 9.45 (9.16-9.99) to 9.10 (8.77-9.48) at month 3 and 9.04 (8.76-9.38) at month 6 (-4.3%, r = -0.63, FDR-adjusted p < 0.001). Because the TyG index does not incorporate an insulin measurement, it is not affected by exogenous insulin exposure and is reported here as the primary insulin-independent metabolic outcome.
Changes across the remaining metabolic variables are summarised in Table 2 and Figure 2, Figure 3 and Figure 4. After Benjamini-Hochberg adjustment within the 15-variable metabolic family, significant baseline-to-6-month changes were observed for fasting insulin (-50.0%, r = -0.71), C-peptide (-33.2%, r = -0.61), fasting plasma glucose (-20.7%, r = -0.63), HbA1c (-2.0%, r = -0.51), triglycerides (-5.7%, r = -0.46), serum uric acid (-14.0%, r = -0.53) [48], gamma-glutamyl transferase (-17.5%, r = -0.41) and haemoglobin (+5.0%, r = +0.69). Changes in ALT (-7.5%), the FIB-4 index - a marker reported to respond to SGLT2 inhibition over longer exposure [42] -, eGFR (+2.8%), UACR and BNP did not reach significance after adjustment. The rise in haemoglobin is an expected consequence of plasma volume contraction during SGLT2 inhibition. Unadjusted and adjusted p values for all 15 variables are given in Table 2.
3.3. Relationship Between Change in HOMA-IR and Change in HbA1c
Change in HOMA-IR did not correlate with change in HbA1c from baseline to month 6 (Spearman’s rho = -0.15, p = 0.27; Figure 5). This absence of a detectable correlation is not evidence that the two are independent: with 54 participants the confidence interval around rho is wide, and a null correlation between two change scores does not establish that the metabolic change occurred through a glycaemia-independent pathway. The observation is reported as descriptive and is not interpreted mechanistically.
In the linear mixed-effects model with time as a categorical factor and participant random intercepts, log-transformed HOMA-IR was lower than baseline at both follow-up visits (month 3: beta = -0.76, SE 0.13, p < 0.001, corresponding to a multiplicative change of 0.47; month 6: beta = -0.94, SE 0.13, p < 0.001, multiplicative change 0.39). The TyG index showed the same pattern on the original scale (month 3: beta = -0.45, SE 0.08; month 6: beta = -0.57, SE 0.08; both p < 0.001). Full coefficient tables, including confidence intervals and residual diagnostics, are provided in the Supplementary Material.
3.4. Metabolic Changes by Baseline Kidney Disease Status (Exploratory)
Exploratory analyses by baseline kidney-disease criterion (22 participants meeting the criterion, 32 not meeting it) were based on the group x time interaction term and on a direct between-group comparison of within-participant change, rather than on whether an effect reached significance within either group separately.
For the TyG index, the interaction between the baseline kidney-disease criterion and time reached nominal significance at month 6 (beta = +0.308, SE 0.150, p = 0.040), while the direct between-group comparison of within-participant change did not (median change -0.570 in those not meeting the criterion versus -0.218 in those meeting it; Mann-Whitney p = 0.089, r = -0.28). For log-transformed HOMA-IR, neither the interaction (beta = +0.393, SE 0.222, p = 0.077) nor the between-group comparison of change (median -0.763 versus -0.422 log units; p = 0.235, r = -0.19) reached significance.
These subgroup results should be read with four constraints in mind. First, the classification rests on a single baseline assessment and cannot establish chronicity. Second, the interaction estimates are imprecise at this sample size. Third, the analyses were not pre-specified in a dated protocol. Fourth, the nominal TyG interaction (p = 0.040) is not supported by the corresponding between-group comparison of change (p = 0.089), and no multiplicity adjustment was applied across these exploratory tests; the two approaches disagree, which is itself an indication of instability. These findings are hypothesis-generating and require confirmation in an adequately powered study. Group-level summaries are given in Table 3 and trajectories in Figure 6.
3.5. Robustness of the Insulin Resistance Finding: Sensitivity Analysis
HOMA-IR presupposes endogenous insulin secretion, so participants receiving exogenous insulin would have fasting-insulin values that do not reflect endogenous secretion and could inflate baseline HOMA-IR. Patient-level medication records were not available for this cohort, and a fasting-insulin value cannot identify who is receiving insulin: high concentrations occur in severe endogenous insulin resistance, assays differ in their cross-reactivity with insulin analogues, and the result depends on the timing of the last dose. We therefore performed an exploratory - not pre-specified - robustness check in which participants with a fasting insulin above two arbitrary thresholds at any visit were removed. Excluding values >100 microU/mL (n = 4 participants) the reduction was -60.9% (r = -0.75, p < 0.001), and excluding values >50 microU/mL (n = 8) it was -50.0% (r = -0.71, p < 0.001), compared with -62.6% in the full cohort (Table 4). These thresholds are a proxy for possible insulin exposure and cannot verify it; the analysis shows only that the direction and approximate magnitude of the HOMA-IR change do not depend on the participants with the highest fasting insulin values. The insulin-independent TyG index, which requires no insulin measurement, provides the more secure evidence and is reported as the primary metabolic outcome.
4. Discussion
In this prospective single-arm cohort of 54 adults with type 2 diabetes initiating SGLT2 inhibitor therapy in routine care, indices of insulin resistance decreased over six months. The insulin-independent TyG index, which does not require an insulin measurement and is therefore the more secure of the two metabolic outcomes, fell by 4.3%; HOMA-IR fell by 62.6%. Because the study had no control group and did not systematically capture concurrent changes in weight, blood pressure, diet, physical activity or background medication, these are associations observed during a treatment period and cannot be attributed to SGLT2 inhibition. The discussion below is framed accordingly.
4.1. Magnitude of the Observed HOMA-IR Change in Context
The HOMA-IR change in this cohort is larger than that reported in most randomised trials and meta-analyses of SGLT2 inhibitor therapy [32,33,34,38]. Rather than indicating a stronger drug effect, this discrepancy most plausibly reflects features of the present design. Baseline insulin resistance was high (median HOMA-IR 8.38), so regression to the mean acts strongly on a single-arm cohort selected at treatment initiation; treatment initiation in routine care is typically accompanied by intensified lifestyle counselling, whose metabolic contribution can be substantial [43], and by adjustment of other glucose-lowering agents, neither of which was recorded here; and HOMA-IR is computed from a single fasting insulin measurement, which has substantial within-person variability. The insulin-independent TyG index changed by a far more modest 4.3%, and the discrepancy between the two indices is itself an argument for treating the HOMA-IR magnitude with caution rather than as the headline result (Figure 4).
4.2. Relationship Between Change in Insulin Resistance and Glycaemic Change
Change in HOMA-IR was not correlated with change in HbA1c (rho = -0.15, p = 0.27; Figure 5). We deliberately refrain from interpreting this as evidence of a glycaemia-independent mechanism. A non-significant correlation between two change scores in 54 participants has a wide confidence interval and is compatible with a real association of moderate size; both variables also carry measurement error, fasting insulin especially so [41], which attenuates any observed correlation. Mechanistic evidence that SGLT2 inhibitors improve peripheral insulin sensitivity comes from hyperinsulinaemic-euglycaemic clamp studies [36,37], which the present design cannot replicate or extend. The observation is reported descriptively.
4.3. Mechanistic Interpretation
Several mechanisms reported for SGLT2 inhibition could in principle contribute to changes of the kind observed here, although the present design cannot test any of them. Sustained glucosuria reduces glucotoxicity, which has been linked to improved beta-cell function and peripheral insulin sensitivity, and in our cohort fasting insulin and C-peptide fell in parallel with HOMA-IR [36]. A shift from glucose towards lipid and ketone utilisation has been associated with altered substrate handling [40]. Natriuresis with plasma volume contraction alters intravascular volume and has been proposed as a contributor to organ protection [47], and the 5.0% rise in haemoglobin in this cohort is consistent with haemoconcentration. These mechanisms are cited as context for the observed associations, not as explanations established by this study.
Anti-inflammatory and mitochondrial effects of SGLT2 inhibitors have been described in experimental models, including inhibition of NLRP3 inflammasome activation, attenuation of NF-kappaB signalling and reduced production of interleukin-6 and tumour necrosis factor-alpha [44,45,46], together with AMPK- and sirtuin-related pathways of metabolic control [39]. No inflammatory, mitochondrial or molecular markers were measured in this study, so these pathways cannot be linked to our observations and are mentioned only to indicate the mechanisms that a controlled study with appropriate biomarkers could test.
4.4. Interpretation of the Exploratory Subgroup Finding
In the exploratory subgroup analysis, the group x time interaction reached nominal significance for the TyG index (beta = +0.308, p = 0.040) but not for log-transformed HOMA-IR (beta = +0.393, p = 0.077), and the direct between-group comparison of within-participant change was not significant for either index (TyG p = 0.089; log HOMA-IR p = 0.235). Taken together these results are weak and internally inconsistent, and we do not interpret them as establishing an attenuated metabolic response in participants meeting the baseline kidney-disease criterion. Mechanisms that could plausibly attenuate a response - reduced glucosuric efficacy at lower eGFR [35] and the metabolic milieu of kidney disease [49,50,51,52,53,54,55] - would be consistent with the direction of the point estimates, and current KDIGO guidance addresses the same population [56,57,58], but the present data cannot support that inference. The classification rests on a single baseline assessment and cannot establish chronicity, the analyses were not pre-specified, and no multiplicity adjustment was applied. This finding is hypothesis-generating only and should be regarded as a question for a controlled study rather than a result.
4.5. Clinical Implications
Because this study cannot establish causality, it does not support changes to clinical practice. Its contribution is methodological: it demonstrates that paired metabolic endpoints can be collected in a routine diabetes clinic across three visits with complete follow-up, and it provides effect-size estimates and variability for those endpoints that can inform the design and sample-size calculation of controlled studies. The observation that HOMA-IR and the insulin-independent TyG index behaved differently, both in magnitude and in the subgroup analysis, is directly relevant to endpoint selection in such studies and argues for reporting an insulin-independent index whenever medication records cannot exclude exogenous insulin use.
4.6. Strengths of the Study
The strengths of the study are its prospective design with three pre-defined assessment points and complete six-month follow-up with no participant lost, the use of an insulin-independent index alongside HOMA-IR, multiplicity control applied across the full family of metabolic and laboratory outcomes, and full analytical transparency: the de-identified participant-level dataset, a data dictionary and the analysis script that reproduces every reported statistic and Figure 2, Figure 3, Figure 4 and Figure 5 are provided as Supplementary Material.
4.7. Limitations
The limitations are substantial and constrain interpretation. First, and most importantly, the study is single-arm and uncontrolled: without a comparator group, the observed changes cannot be attributed to SGLT2 inhibitor therapy, and regression to the mean is expected to contribute materially given the high baseline insulin resistance of the cohort. Second, potential confounders were not systematically recorded - body weight and body-mass index, waist circumference, blood pressure, diet, physical activity, and changes to concomitant glucose-lowering, lipid-lowering and antihypertensive medication - so their contribution to the observed changes cannot be estimated or adjusted for; weight loss and diuresis during SGLT2 inhibition could plausibly account for a substantial part of the metabolic findings. Third, patient-level medication records were unavailable, so exogenous insulin use could not be identified; HOMA-IR is not interpretable in participants receiving insulin, and the fasting-insulin threshold analysis is an exploratory proxy that cannot verify exposure. Fourth, the single-centre setting and the modest sample size limit generalisability and render subgroup estimates imprecise; the kidney-disease classification rests on one baseline assessment and does not meet the chronicity requirement of current guidance, and because it depends on a threshold applied to two baseline measurements it is sensitive to the definition chosen - a point borne out by the disagreement between the interaction test and the between-group comparison of change. Fifth, no sample-size calculation was performed in advance, and the subgroup and sensitivity analyses were not pre-specified in a dated protocol; the outcome family used for multiplicity control was defined at the analysis stage from the variables collected, not registered beforehand. Sixth, the reasons for non-enrolment of the seven patients who were assessed but not enrolled were not captured in the study dataset, so the STROBE flow diagram cannot report them and the potential for selection at the screening stage cannot be characterised. Finally, six months is too short to assess clinical outcomes.
4.8. Clinical Perspective
The findings should be tested in a controlled study with a comparator arm - active comparators such as GLP-1 receptor agonists being one option [60] -, systematic capture of weight, blood pressure, diet, activity and concomitant medication, verified medication records permitting valid use of insulin-based indices, and a follow-up long enough for clinical outcomes.
4.9. Future Directions
Building on the findings reported here, future multicentre randomised studies with longer follow-up, body-composition analyses, continuous glucose monitoring, and verified medication records are needed to confirm the metabolic response and to determine whether early changes in insulin resistance indices predict long-term cardiovascular and renal outcomes, which insulin resistance indices have been reported to prognosticate [59], during SGLT2 inhibitor therapy.
4.10. Take-Home Message
In this single-arm cohort, indices of insulin resistance decreased over six months of SGLT2 inhibitor therapy; because there was no control group and confounders were not recorded, these are associations rather than treatment effects, and the insulin-independent endpoint strategy merits formal evaluation in controlled studies.
5. Conclusions
In this prospective single-arm six-month cohort study of adults with type 2 diabetes initiating SGLT2 inhibitor therapy in routine care, indices of insulin resistance decreased over six months. The insulin-independent TyG index, the more secure of the two metabolic outcomes given that medication records were unavailable, decreased by 4.3%. Because the design was uncontrolled and concurrent changes in weight, blood pressure, lifestyle and background medication were not recorded, these changes cannot be attributed to SGLT2 inhibition. The study demonstrates the feasibility of paired metabolic endpoints in routine practice and provides effect-size estimates to inform controlled studies designed to test these associations. The translational implication is confined to measurement strategy rather than to therapeutic claims: where exogenous insulin use cannot be excluded from the clinical record, an insulin-independent index such as TyG offers a more transportable endpoint for trials and for routine metabolic monitoring than HOMA-IR, and this proposition is directly testable in a controlled design.
Supplementary Materials
The following supporting information can be downloaded with this article: Table S1 (data dictionary for all analysed variables); Data S1 (de-identified participant-level dataset, n = 54, comprising coded identifiers, age, sex and laboratory values); Script S1 (analysis script that regenerates every reported statistic, the age, sex and laboratory baseline values in Table 1, and Figure 2, Figure 3, Figure 4 and Figure 5 from Data S1). Diabetes duration, the agent received, background therapy and the screening-log flow shown in Figure 1 are not part of the dataset and cannot be regenerated from it. Together these permit independent verification of every statistical result reported here.
Author Contributions
Conceptualization, M.T.Ö. and A.A.; methodology, M.T.Ö.; formal analysis, M.T.Ö. and A.A.; investigation, A.A., Ö.T. and A.S.; data curation, A.A. and A.S.; writing—original draft preparation, M.T.Ö.; writing—review and editing, all authors; visualization, M.T.Ö.; supervision, M.T.Ö. All authors have read and agreed to the published version of the manuscript.
Funding
This research received no external funding.
Institutional Review Board Statement
The study was conducted in accordance with the Declaration of Helsinki and approved by the Health Sciences Research Ethics Committee of Osmaniye Korkut Ata University (approval number: 13; date: 25 December 2025).
Informed Consent Statement
Written informed consent was obtained from all participants involved in the study.
Data Availability Statement
The de-identified participant-level dataset, the data dictionary and the complete analysis code are published with this article as Data S1, Table S1 and Script S1, and are additionally available from the corresponding author. The dataset contains coded participant identifiers, age, sex and laboratory values only; no names, hospital record numbers, dates or free-text fields are included, and no participant is aged over 89 years. Together these materials permit independent regeneration of every statistical result reported here, the age and sex distributions and metabolic and laboratory baseline values in Table 1, and Figure 2, Figure 3, Figure 4 and Figure 5. Diabetes duration, the specific agent received and background glucose-lowering therapy are not included in the dataset, and neither is the screening-log information underlying Figure 1; those parts of Table 1 and Figure 1 cannot be regenerated from Data S1.
Acknowledgments
The authors thank the clinical and laboratory staff of the participating centre for their assistance with participant scheduling and sample handling.
Use of Generative Artificial Intelligence
The authors used an AI-assisted computational research environment (Claude, Anthropic) during preparation of this manuscript. Its use extended beyond grammatical and stylistic editing: it was used to execute and verify the statistical analyses from the participant-level dataset, to generate and regenerate figures, to audit internal numerical consistency between the dataset, tables, figures and text, and to draft and revise manuscript text. All statistical output was regenerated from the primary data and is reproducible via Script S1. The authors reviewed, verified and take full responsibility for all content, all reported values and all interpretations presented here.
Conflicts of Interest
The authors declare no conflicts of interest.
References
- Reaven, G.M. Insulin resistance: the link between obesity and cardiovascular disease. Med. Clin. North Am. 2011, 95, 875–892. [Google Scholar] [CrossRef]
- Li, M.; Chi, X.; Wang, Y.; Setrerrahmane, S.; Xie, W.; Xu, H. Trends in insulin resistance: insights into mechanisms and therapeutic strategy. Signal Transduct. Target. Ther. 2022, 7, 216. [Google Scholar] [CrossRef]
- Zhao, X.; An, X.; Yang, C.; Sun, W.; Ji, H.; Lian, F. The crucial role and mechanism of insulin resistance in metabolic disease. Front. Endocrinol. 2023, 14, 1149239. [Google Scholar] [CrossRef]
- Ndumele, C.E.; Rangaswami, J.; Chow, S.L.; Neeland, I.J.; Tuttle, K.R.; Khan, S.S.; et al. Cardiovascular-Kidney-Metabolic Health: A Presidential Advisory From the American Heart Association. Circulation 2023, 148, 1606–1635. [Google Scholar] [CrossRef]
- Matthews, D.R.; Hosker, J.P.; Rudenski, A.S.; Naylor, B.A.; Treacher, D.F.; Turner, R.C. Homeostasis model assessment: insulin resistance and beta-cell function from fasting plasma glucose and insulin concentrations in man. Diabetologia 1985, 28, 412–419. [Google Scholar] [CrossRef]
- Simental-Mendía, L.E.; Rodríguez-Morán, M.; Guerrero-Romero, F. The product of fasting glucose and triglycerides as surrogate for identifying insulin resistance in apparently healthy subjects. Metab. Syndr. Relat. Disord. 2008, 6, 299–304. [Google Scholar] [CrossRef]
- Wang, A.; Tian, X.; Zuo, Y.; Chen, S.; Meng, X.; Wu, S.; Wang, Y. Change in triglyceride-glucose index predicts the risk of cardiovascular disease in the general population: a prospective cohort study. Cardiovasc Diabetol. 2021, 20. [Google Scholar] [CrossRef]
- Khan, S.H.; Sobia, F.; Niazi, N.K.; Manzoor, S.M.; Fazal, N.; Ahmad, F. Metabolic clustering of risk factors: evaluation of Triglyceride-glucose index (TyG index) for evaluation of insulin resistance. Diabetol. Metab. Syndr. 2018, 10. [Google Scholar] [CrossRef]
- Zheng, R.; Mao, Y. Triglyceride and glucose (TyG) index as a predictor of incident hypertension: a 9-year longitudinal population-based study. Lipids Health Dis. 2017, 16. [Google Scholar] [CrossRef]
- Yu, C.; Shi, Y.; Wang, T.; Zhu, L.; Zhou, W.; Bao, H.; Cheng, X. Triglyceride–glucose index change and chronic kidney disease progression in a Chinese hypertensive population. Front. Endocrinol. 2024, 15. [Google Scholar] [CrossRef]
- Sun, Y.; Ji, H.; Sun, W.; An, X.; Lian, F. Triglyceride glucose (TyG) index: A promising biomarker for diagnosis and treatment of different diseases. Eur. J. Intern. Med. 2024, 131, 3–14. [Google Scholar] [CrossRef]
- Li, C.; Zhang, Z.; Luo, X.; Xiao, Y.; Tu, T.; Liu, C.; et al. The triglyceride–glucose index and its obesity-related derivatives as predictors of all-cause and cardiovascular mortality in hypertensive patients: insights from NHANES data with machine learning analysis. Cardiovasc. Diabetol. 2025, 24, 47. [Google Scholar] [CrossRef]
- Hou, X.; Lv, Y.; Li, Y.; Wu, Q.; Lv, Q.; Yang, Y.; et al. Association between different insulin resistance surrogates and all-cause mortality in patients with coronary heart disease and hypertension: NHANES longitudinal cohort study. Cardiovasc. Diabetol. 2024, 23, 86. [Google Scholar] [CrossRef]
- Duan, M.; Zhao, X.; Zhao, X.; Li, S.; Miao, G.; Bai, L.; et al. Metabolic score for insulin resistance (METS-IR) predicts all-cause and cardiovascular mortality in the general population: evidence from NHANES 2001–2018. Cardiovasc. Diabetol. 2024, 23, 243. [Google Scholar] [CrossRef]
- Wiviott, S.D.; Raz, I.; Bonaca, M.P.; Mosenzon, O.; Kato, E.T.; Cahn, A.; et al. Dapagliflozin and cardiovascular outcomes in type 2 diabetes. N. Engl. J. Med. 2019, 380, 347–357. [Google Scholar] [CrossRef]
- Perkovic, V.; Jardine, M.J.; Neal, B.; Bompoint, S.; Heerspink, H.J.L.; Charytan, D.M.; et al. Canagliflozin and renal outcomes in type 2 diabetes and nephropathy. N. Engl. J. Med. 2019, 380, 2295–2306. [Google Scholar] [CrossRef]
- Heerspink, H.J.L.; Stefánsson, B.V.; Correa-Rotter, R.; Chertow, G.M.; Greene, T.; Hou, F.F.; et al. Dapagliflozin in patients with chronic kidney disease. N. Engl. J. Med. 2020, 383, 1436–1446. [Google Scholar] [CrossRef]
- The EMPA-KIDNEY Collaborative Group. Empagliflozin in patients with chronic kidney disease. N. Engl. J. Med. 2023, 388, 117–127. [Google Scholar] [CrossRef]
- Bhatt, D.L.; Szarek, M.; Pitt, B.; Cannon, C.P.; Leiter, L.A.; McGuire, D.K.; et al. Sotagliflozin in patients with diabetes and chronic kidney disease. N. Engl. J. Med. 2021, 384, 129–139. [Google Scholar] [CrossRef]
- Perkovic, V.; Koitka-Weber, A.; Cooper, M.E.; Schernthaner, G.; Pfarr, E.; Woerle, H.J.; von Eynatten, M.; Wanner, C. Choice of endpoint in kidney outcome trials: considerations from the EMPA-REG OUTCOME® trial. Nephrol. Dial. Transplant. 2019, 35, 2103–2111. [Google Scholar] [CrossRef]
- ElSayed, N.A.; McCoy, R.G.; Aleppo, G.; Bajaj, M.; Balapattabi, K.; Beverly, E.A.; et al. 9. Pharmacologic Approaches to Glycemic Treatment: Standards of Care in Diabetes—2025. Diabetes Care 2024, 48, S181–S206. [Google Scholar] [CrossRef]
- ElSayed, N.A.; McCoy, R.G.; Aleppo, G.; Balapattabi, K.; Beverly, E.A.; Early, K.B.; et al. 10. Cardiovascular Disease and Risk Management: Standards of Care in Diabetes—2025. Diabetes Care 2024, 48, S207–S238. [Google Scholar] [CrossRef]
- ElSayed, N.A.; McCoy, R.G.; Aleppo, G.; Balapattabi, K.; Beverly, E.A.; Early, K.B.; et al. 11. Chronic Kidney Disease and Risk Management: Standards of Care in Diabetes—2025. Diabetes Care 2024, 48, S239–S251. [Google Scholar] [CrossRef]
- Davies, M.J.; Aroda, V.R.; Collins, B.S.; Gabbay, R.A.; Green, J.; Maruthur, N.M.; et al. Management of Hyperglycemia in Type 2 Diabetes, 2022. A Consensus Report by the American Diabetes Association (ADA) and the European Association for the Study of Diabetes (EASD). Diabetes Care 2022, 45, 2753–2786. [Google Scholar] [CrossRef]
- Usman, M.; Bhatt, D.L.; Hameed, I.; Anker, S.D.; Cheng, A.; Hernandez, A.F.; et al. Effect of SGLT2 inhibitors on heart failure outcomes and cardiovascular death across the cardiometabolic disease spectrum: a systematic review and meta-analysis. Lancet Diabetes Endocrinol. 2024, 12, 447–461. [Google Scholar] [CrossRef]
- Mudaliar, S.; Henry, R.R.; Boden, G.; Smith, S.; Chalamandaris, A.G.; Duchesne, D.; Iqbal, N.; List, J. Changes in Insulin Sensitivity and Insulin Secretion with the Sodium Glucose Cotransporter 2 Inhibitor Dapagliflozin. Diabetes Technol. Ther. 2014, 16, 137–144. [Google Scholar] [CrossRef]
- Cherney, D.Z.I.; Zinman, B.; Inzucchi, S.E.; Koitka-Weber, A.; Mattheus, M.; von Eynatten, M.; et al. Effects of empagliflozin on urinary albumin-to-creatinine ratio. Lancet Diabetes Endocrinol. 2017, 5, 610–621. [Google Scholar] [CrossRef]
- Inzucchi, S.E.; Zinman, B.; Fitchett, D.; Wanner, C.; Ferrannini, E.; Schumacher, M.; Schmoor, C.; Ohneberg, K.; Johansen, O.E.; George, J.T.; et al. How Does Empagliflozin Reduce Cardiovascular Mortality? Insights From a Mediation Analysis of the EMPA-REG OUTCOME Trial. Diabetes Care 2017, 41, 356–363. [Google Scholar] [CrossRef]
- Preda, A.; Montecucco, F.; Carbone, F.; Camici, G.G.; Lüscher, T.F.; Kraler, S.; et al. SGLT2 inhibitors: from glucose-lowering to cardiovascular benefits. Cardiovasc. Res. 2024, 120, 443–460. [Google Scholar] [CrossRef]
- Lu, X.; Xie, Q.; Pan, X.; Zhang, R.; Zhang, X.; Peng, G.; et al. Type 2 diabetes mellitus in adults: pathogenesis, prevention and therapy. Signal Transduct. Target. Ther. 2024, 9, 262. [Google Scholar] [CrossRef]
- Zinman, B.; Wanner, C.; Lachin, J.M.; Fitchett, D.; Bluhmki, E.; Hantel, S.; et al. Empagliflozin, cardiovascular outcomes, and mortality in type 2 diabetes. N. Engl. J. Med. 2015, 373, 2117–2128. [Google Scholar] [CrossRef]
- IMRE, E.; GUNHAN, H.G.; EREL, P.; USTAY, O. SGLT2 inhibitors improve plasma atherogenic biomarkers in patients with type 2 diabetes: a real-world retrospective observational study. Minerva Endocrinol. 2023, 48. [Google Scholar] [CrossRef]
- Voziki, D.; Dimakopoulos, G.; Stergiou, I.; Zografou, I.; Rizzo, M.; Liberopoulos, E.N.; Kotsa, K.; Koufakis, T. The effects of SGLT2 inhibitors and GLP-1 receptor agonists on the triglyceride to HDL cholesterol ratio and the triglyceride-glucose index in patients with type 2 diabetes. J. Diabetes Its Complicat. 2025, 39, 109044. [Google Scholar] [CrossRef]
- Chai, S.; Zhang, R.; Ning, Z.; Zheng, Y.; Swapnil, R.; Ji, L. Sodium-glucose co-transporter 2 inhibitors improve insulin resistance and β-cell function in type 2 diabetes: A meta-analysis. World J. Diabetes 2025, 16, 107335. [Google Scholar] [CrossRef]
- Cao, M.J.; Liang, T.T.; Xu, L.; Shi, F.H. Evaluating the overall renal outcomes of sodium-glucose cotransporter-2 (SGLT2) inhibitors in patients with chronic kidney disease (CKD). Diabetol. Metab. Syndr. 2025, 17. [Google Scholar] [CrossRef]
- Ferrannini, E.; Mark, M.; Mayoux, E. CV protection in the EMPA-REG OUTCOME trial: a “thrifty substrate” hypothesis. Diabetes Care 2016, 39, 1108–1114. [Google Scholar] [CrossRef]
- Pereira, M.J.; Eriksson, J.W. Emerging role of SGLT2 inhibitors for the treatment of obesity. Drugs 2019, 79, 219–230. [Google Scholar] [CrossRef]
- Goto, Y.; Otsuka, Y.; Ashida, K.; Nagayama, A.; Hasuzawa, N.; Iwata, S.; Hara, K.; Tsuruta, M.; Wada, N.; Motomura, S.; et al. Improvement of skeletal muscle insulin sensitivity by 1 week of SGLT2 inhibitor use. Endocr. Connect. 2020, 9, 599–606. [Google Scholar] [CrossRef]
- Gerhart-Hines, Z.; Rodgers, J.T.; Bare, O.; Lerin, C.; Kim, S.; Mostoslavsky, R.; Alt, F.W.; Wu, Z.; Puigserver, P. Metabolic control of muscle mitochondrial function and fatty acid oxidation through SIRT1/PGC-1α. EMBO J. 2007, 26, 1913–1923. [Google Scholar] [CrossRef]
- Mudaliar, S.; Alloju, S.; Henry, R.R. Can a shift in fuel energetics explain the beneficial cardiorenal outcomes in the EMPA-REG OUTCOME study? Diabetes Care 2016, 39, 1115–1122. [Google Scholar] [CrossRef]
- Lonardo, A.; Loria, P.; Leonardi, F.; Borsatti, A.; Neri, P.; Bertolotti, M.; Modenese, S.; Cimino, L.; Carulli, N. Fasting insulin and uric acid levels but not indices of iron metabolism are independent predictors of non-alcoholic fatty liver disease. A case-control study. Dig. Liver Dis. 2002, 34, 204–211. [Google Scholar] [CrossRef]
- Kuchay, M.S.; Krishan, S.; Mishra, S.K.; Farooqui, K.J.; Singh, M.K.; Wasir, J.S.; et al. Effect of empagliflozin on liver fat in patients with type 2 diabetes and NAFLD. Diabetes Care 2018, 41, 1801–1808. [Google Scholar] [CrossRef]
- Zhang, L.; Lin, H.; Yang, X.; Shi, J.; Sheng, X.; Wang, L.; et al. Effects of dapagliflozin monotherapy and combined aerobic exercise on skeletal muscle mitochondrial quality control and insulin resistance in type 2 diabetes mellitus rats. Biomed. Pharmacother. 2023, 169, 115852. [Google Scholar] [CrossRef]
- Lim, V.G.; Bell, R.M.; Arjun, S.; Kolatsi-Joannou, M.; Long, D.A.; Yellon, D.M. SGLT2 inhibitor, canagliflozin, attenuates myocardial infarction. JACC Basic Transl. Sci. 2019, 4, 15–26. [Google Scholar] [CrossRef]
- Santos-Gallego, C.G.; Requena-Ibanez, J.A.; San Antonio, R.; Ishikawa, K.; Watanabe, S.; Picatoste, B.; et al. Empagliflozin ameliorates adverse left ventricular remodeling in nondiabetic heart failure. J. Am. Coll. Cardiol. 2019, 73, 1931–1944. [Google Scholar] [CrossRef]
- Vergara, A.; Jacobs-Cachá, C.; Soler, M.J. Sodium-glucose cotransporter inhibitors: beyond glycaemic control. Clin. Kidney J. 2019, 12, 322–325. [Google Scholar] [CrossRef]
- Marton, A.; Kaneko, T.; Kovalik, J.P.; Yasui, A.; Nishiyama, A.; Kitada, K.; Titze, J. Organ protection by SGLT2 inhibitors: role of metabolic energy and water conservation. Nat. Rev. Nephrol. 2020, 17, 65–77. [Google Scholar] [CrossRef]
- Johnson, R.J.; Nakagawa, T.; Jalal, D.; Sánchez-Lozada, L.G.; Kang, D.H.; Ritz, E. Uric acid and chronic kidney disease: which is chasing which? Nephrol. Dial. Transplant. 2013, 28, 2221–2228. [Google Scholar] [CrossRef]
- Spoto, B.; Pisano, A.; Zoccali, C. Insulin resistance in chronic kidney disease: a systematic review. Am. J. Physiol. Ren. Physiol. 2016, 311, F1087–F1108. [Google Scholar] [CrossRef]
- Koppe, L.; Fouque, D.; Kalantar-Zadeh, K. Kidney cachexia or protein-energy wasting in chronic kidney disease: facts and numbers. J. Cachexia Sarcopenia Muscle 2019, 10, 479–484. [Google Scholar] [CrossRef]
- Neuen, B.L.; Young, T.; Heerspink, H.J.L.; Neal, B.; Perkovic, V.; Billot, L.; et al. SGLT2 inhibitors for the prevention of kidney failure in patients with type 2 diabetes. Lancet Diabetes Endocrinol. 2019, 7, 845–854. [Google Scholar] [CrossRef]
- Nagahisa, T.; Saisho, Y. Cardiorenal Protection: Potential of SGLT2 Inhibitors and GLP-1 Receptor Agonists in the Treatment of Type 2 Diabetes. Diabetes Ther. 2019, 10, 1733–1752. [Google Scholar] [CrossRef]
- Cai, W.; Chong, K.; Huang, Y.; Huang, C.; Yin, L. Empagliflozin improves mitochondrial dysfunction in diabetic cardiomyopathy by modulating ketone body metabolism and oxidative stress. Redox Biol. 2024, 69, 103010. [Google Scholar] [CrossRef]
- Vallon, V.; Thomson, S.C. The tubular hypothesis of nephron filtration and diabetic kidney disease. Nat. Rev. Nephrol. 2020, 16, 317–336. [Google Scholar] [CrossRef]
- De Nicola, L.; Cozzolino, M.; Genovesi, S.; Gesualdo, L.; Grandaliano, G.; Pontremoli, R. Can SGLT2 inhibitors answer unmet therapeutic needs in chronic kidney disease? J. Nephrol. 2022, 35, 1605–1618. [Google Scholar] [CrossRef]
- Stevens, P.E.; Ahmed, S.B.; Carrero, J.J.; Foster, B.J.; Francis, A.; Hall, R.K.; et al. KDIGO 2024 Clinical Practice Guideline for the Evaluation and Management of Chronic Kidney Disease. Kidney Int. 2024, 105, S117–S314. [Google Scholar] [CrossRef]
- Levin, A.; Ahmed, S.B.; Carrero, J.J.; Foster, B.J.; Francis, A.; Hall, R.K.; et al. Executive summary of the KDIGO 2024 Clinical Practice Guideline for the Evaluation and Management of Chronic Kidney Disease: known knowns and known unknowns. Kidney Int. 2024, 105, 684–701. [Google Scholar] [CrossRef]
- Rossing, P.; Caramori, M.L.; Chan, J.C.; Heerspink, H.J.; Hurst, C.; Khunti, K.; et al. KDIGO 2022 Clinical Practice Guideline for Diabetes Management in Chronic Kidney Disease. Kidney Int. 2022, 102, S1–S127. [Google Scholar] [CrossRef]
- Rokicka, D.; Hudzik, B.; Wróbel, M.; Stołtny, T.; Stołtny, D.; Nowowiejska-Wiewióra, A.; et al. The prognostic impact of insulin resistance surrogates in patients with acute myocardial infarction with and without type 2 diabetes. Cardiovasc. Diabetol. 2024, 23, 147. [Google Scholar] [CrossRef]
- Nauck, M.A.; Quast, D.R.; Wefers, J.; Meier, J.J. GLP-1 receptor agonists in the treatment of type 2 diabetes. Mol. Metab. 2021, 46, 101102. [Google Scholar] [CrossRef]
Figure 1.
Participant flow (STROBE). Of 61 patients assessed for eligibility, 54 were enrolled and completed all three visits (baseline, 3 months, 6 months) with no loss to follow-up. Seven patients were not enrolled; their individual reasons were not recorded in the study dataset and cannot be reported, which is acknowledged as a reporting limitation. Per-variable data availability and the distribution of the baseline kidney-disease criterion in the analysed cohort are summarised in the lower box; Wilcoxon signed-rank tests exclude within-pair zero differences, so the test n may be smaller than the number of measured pairs. Created by the authors using original study data.
Figure 1.
Participant flow (STROBE). Of 61 patients assessed for eligibility, 54 were enrolled and completed all three visits (baseline, 3 months, 6 months) with no loss to follow-up. Seven patients were not enrolled; their individual reasons were not recorded in the study dataset and cannot be reported, which is acknowledged as a reporting limitation. Per-variable data availability and the distribution of the baseline kidney-disease criterion in the analysed cohort are summarised in the lower box; Wilcoxon signed-rank tests exclude within-pair zero differences, so the test n may be smaller than the number of measured pairs. Created by the authors using original study data.
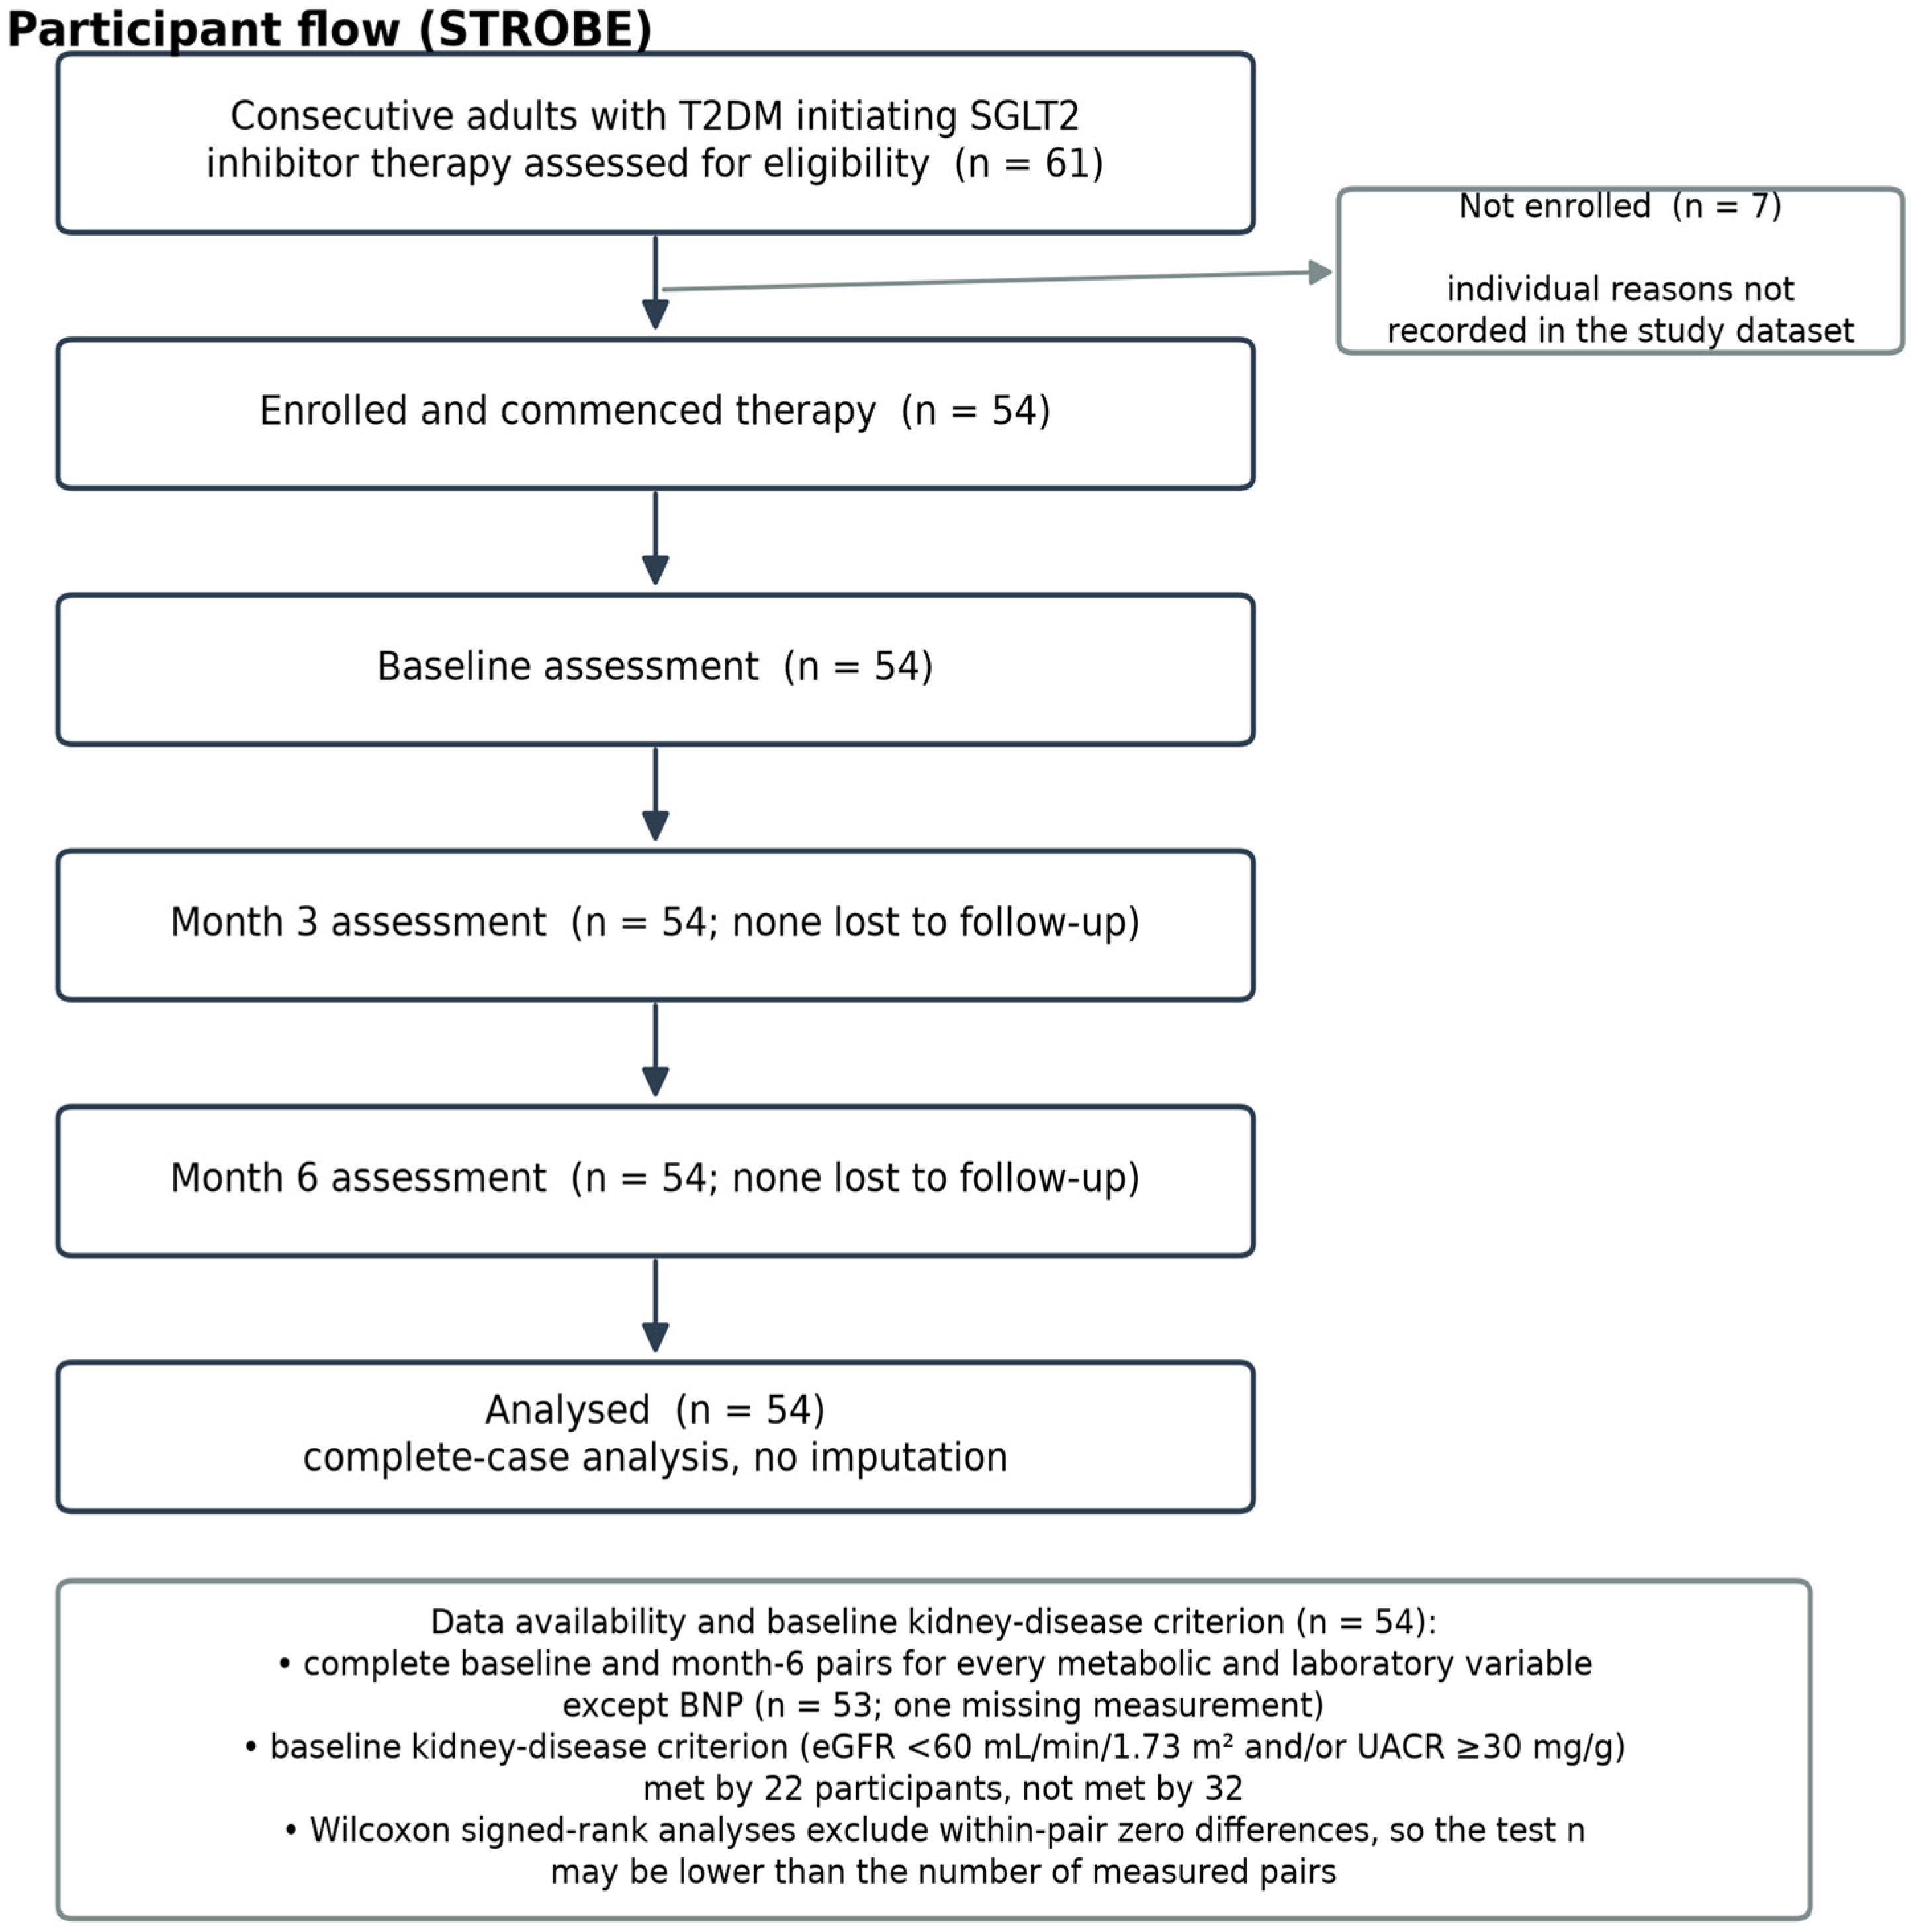
Figure 2.
Boxplot distribution of HOMA-IR and TyG index at baseline, month 3, and month 6 (n = 54). Boxes represent the interquartile range; horizontal lines indicate medians; whiskers extend to 1.5×IQR; individual data points and outliers are plotted. *** FDR p < 0.001; ** FDR p < 0.01; * FDR p < 0.05; ns, not significant. Abbreviations: FDR, false discovery rate; HOMA-IR, Homeostatic Model Assessment of Insulin Resistance; TyG, triglyceride–glucose index. Created by the authors using original study data.
Figure 2.
Boxplot distribution of HOMA-IR and TyG index at baseline, month 3, and month 6 (n = 54). Boxes represent the interquartile range; horizontal lines indicate medians; whiskers extend to 1.5×IQR; individual data points and outliers are plotted. *** FDR p < 0.001; ** FDR p < 0.01; * FDR p < 0.05; ns, not significant. Abbreviations: FDR, false discovery rate; HOMA-IR, Homeostatic Model Assessment of Insulin Resistance; TyG, triglyceride–glucose index. Created by the authors using original study data.
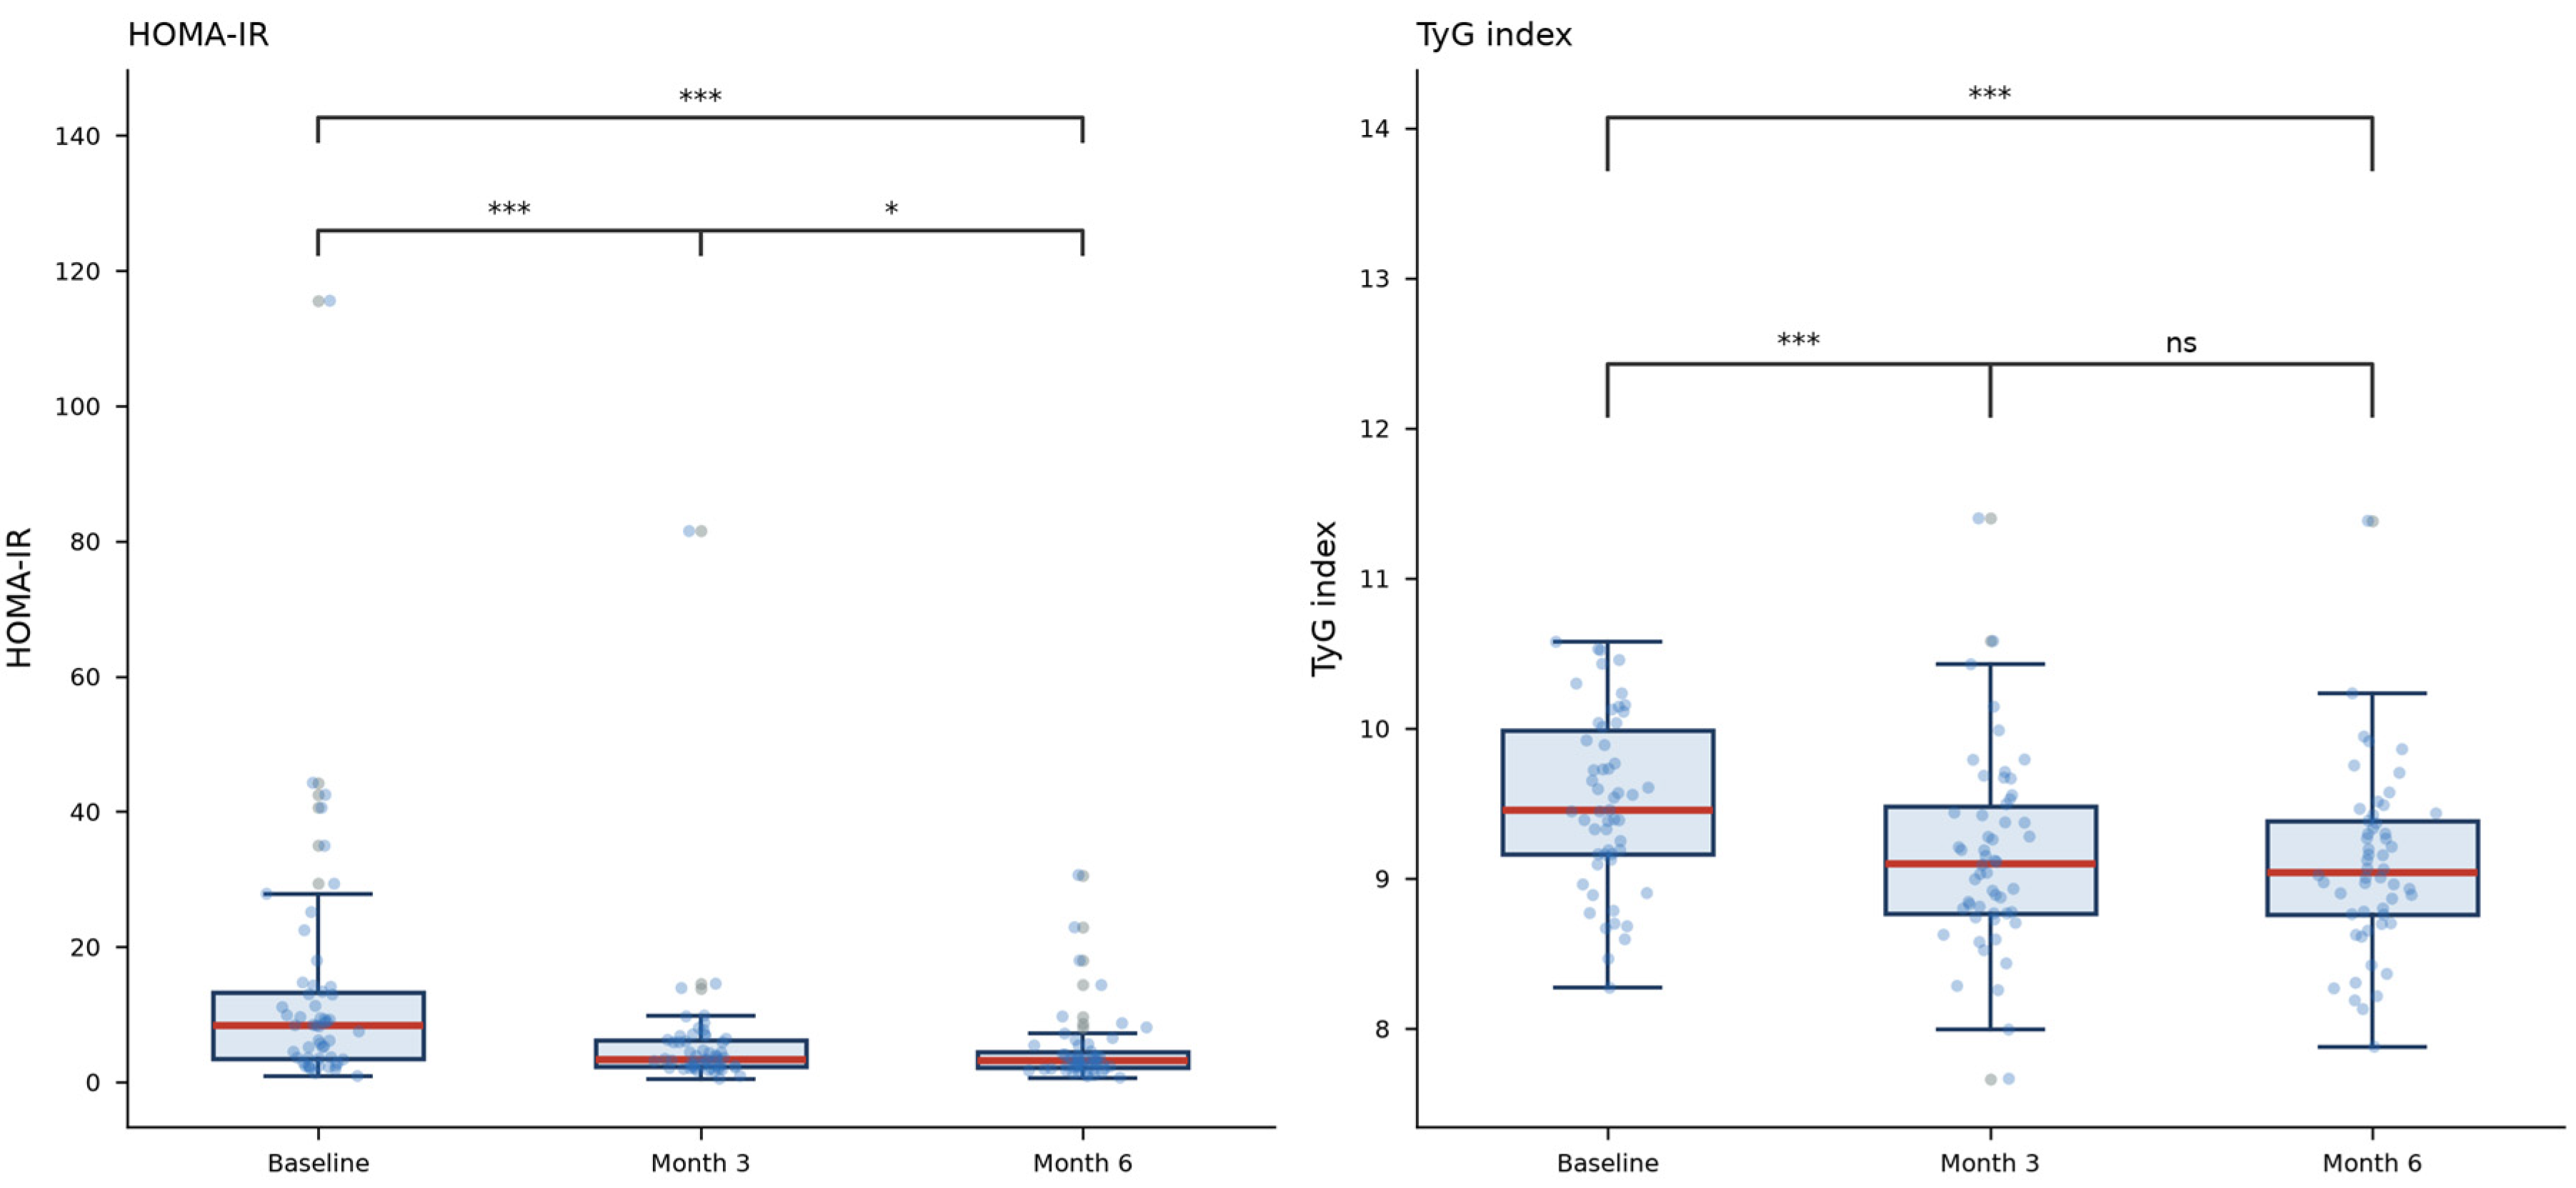
Figure 3.
Individual HOMA-IR trajectories from baseline to month 6 for all 54 participants (spaghetti plot). Each gray line represents one patient; the bold black line and shaded region represent the group median and IQR. Abbreviations: HOMA-IR, Homeostatic Model Assessment of Insulin Resistance; IQR, interquartile range. Created by the authors using original study data.
Figure 3.
Individual HOMA-IR trajectories from baseline to month 6 for all 54 participants (spaghetti plot). Each gray line represents one patient; the bold black line and shaded region represent the group median and IQR. Abbreviations: HOMA-IR, Homeostatic Model Assessment of Insulin Resistance; IQR, interquartile range. Created by the authors using original study data.
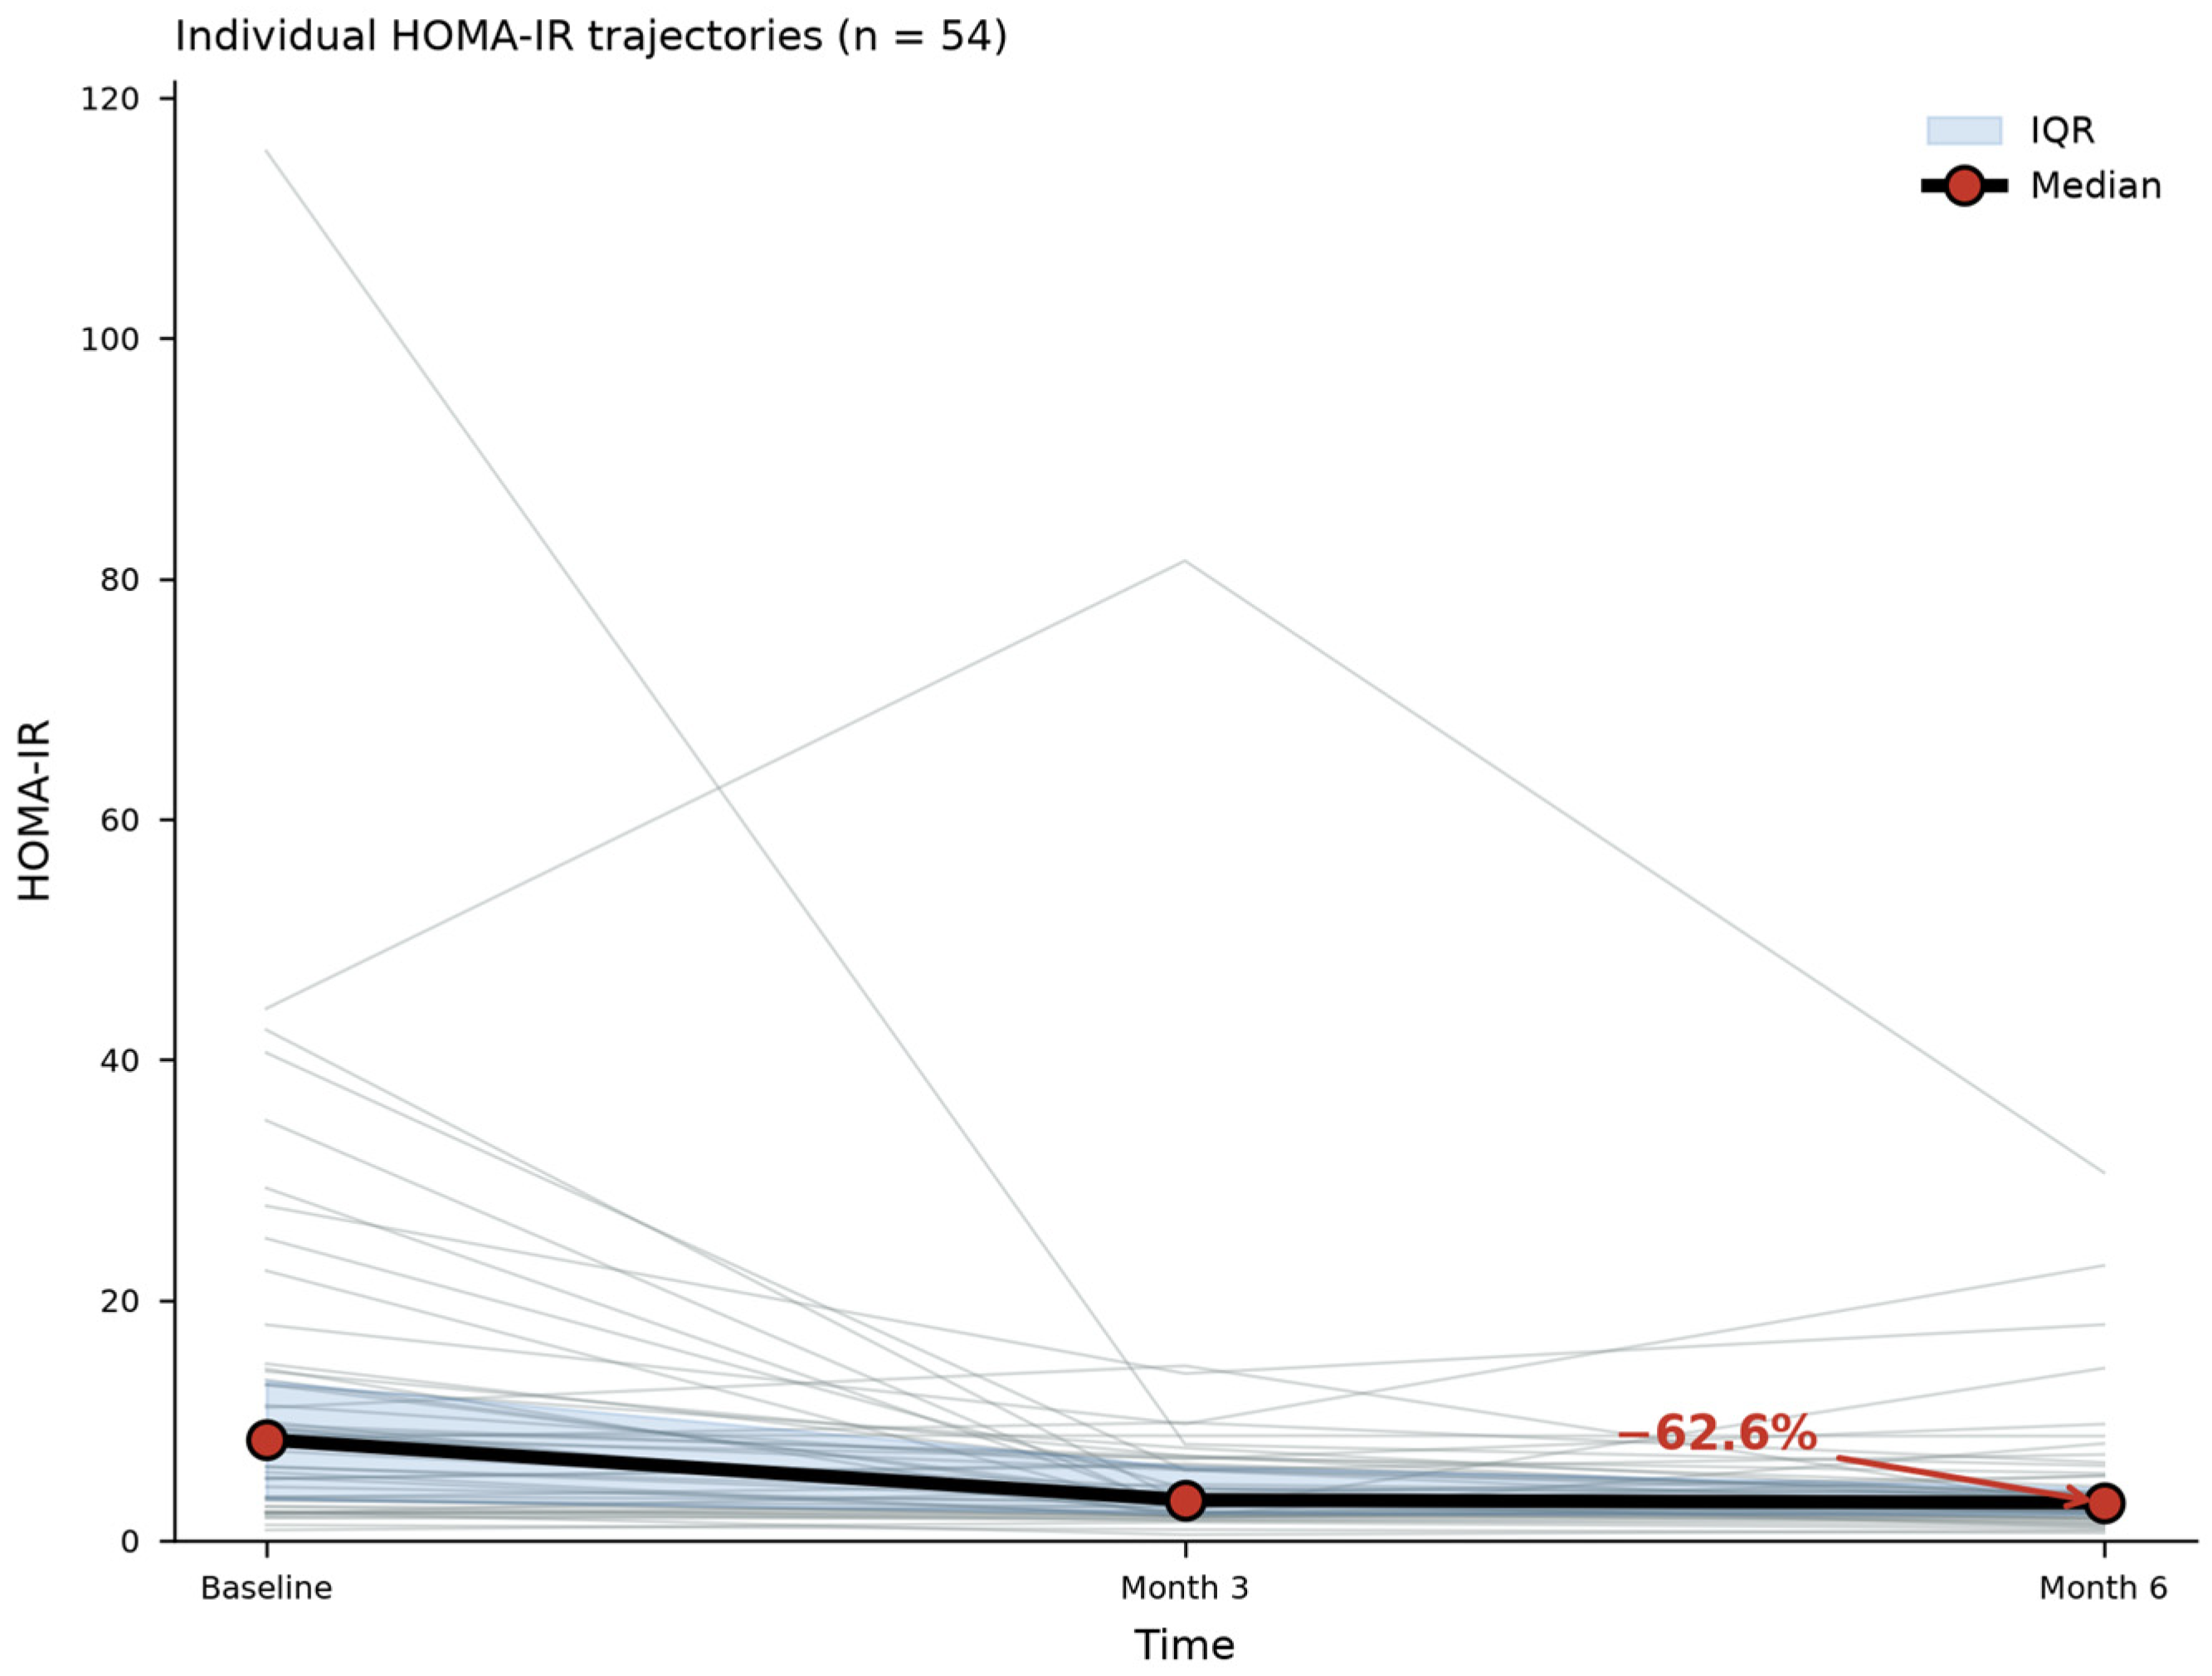
Figure 4.
Effect sizes for baseline-to-6-month change in the 15 metabolic and laboratory variables. Points are paired rank-biserial correlations and bars are 95% percentile bootstrap confidence intervals (4000 resamples). Filled markers indicate significance after Benjamini-Hochberg adjustment within the family; open markers indicate non-significance. Negative values denote a decrease from baseline. The rise in haemoglobin is consistent with plasma volume contraction. Abbreviations: ALT, alanine aminotransferase; BNP, B-type natriuretic peptide; eGFR, estimated glomerular filtration rate; FIB-4, Fibrosis-4 index; GGT, gamma-glutamyl transferase; HbA1c, glycated haemoglobin; HOMA-IR, homeostatic model assessment of insulin resistance; TyG, triglyceride-glucose; UACR, urinary albumin-to-creatinine ratio. Created by the authors using original study data.
Figure 4.
Effect sizes for baseline-to-6-month change in the 15 metabolic and laboratory variables. Points are paired rank-biserial correlations and bars are 95% percentile bootstrap confidence intervals (4000 resamples). Filled markers indicate significance after Benjamini-Hochberg adjustment within the family; open markers indicate non-significance. Negative values denote a decrease from baseline. The rise in haemoglobin is consistent with plasma volume contraction. Abbreviations: ALT, alanine aminotransferase; BNP, B-type natriuretic peptide; eGFR, estimated glomerular filtration rate; FIB-4, Fibrosis-4 index; GGT, gamma-glutamyl transferase; HbA1c, glycated haemoglobin; HOMA-IR, homeostatic model assessment of insulin resistance; TyG, triglyceride-glucose; UACR, urinary albumin-to-creatinine ratio. Created by the authors using original study data.
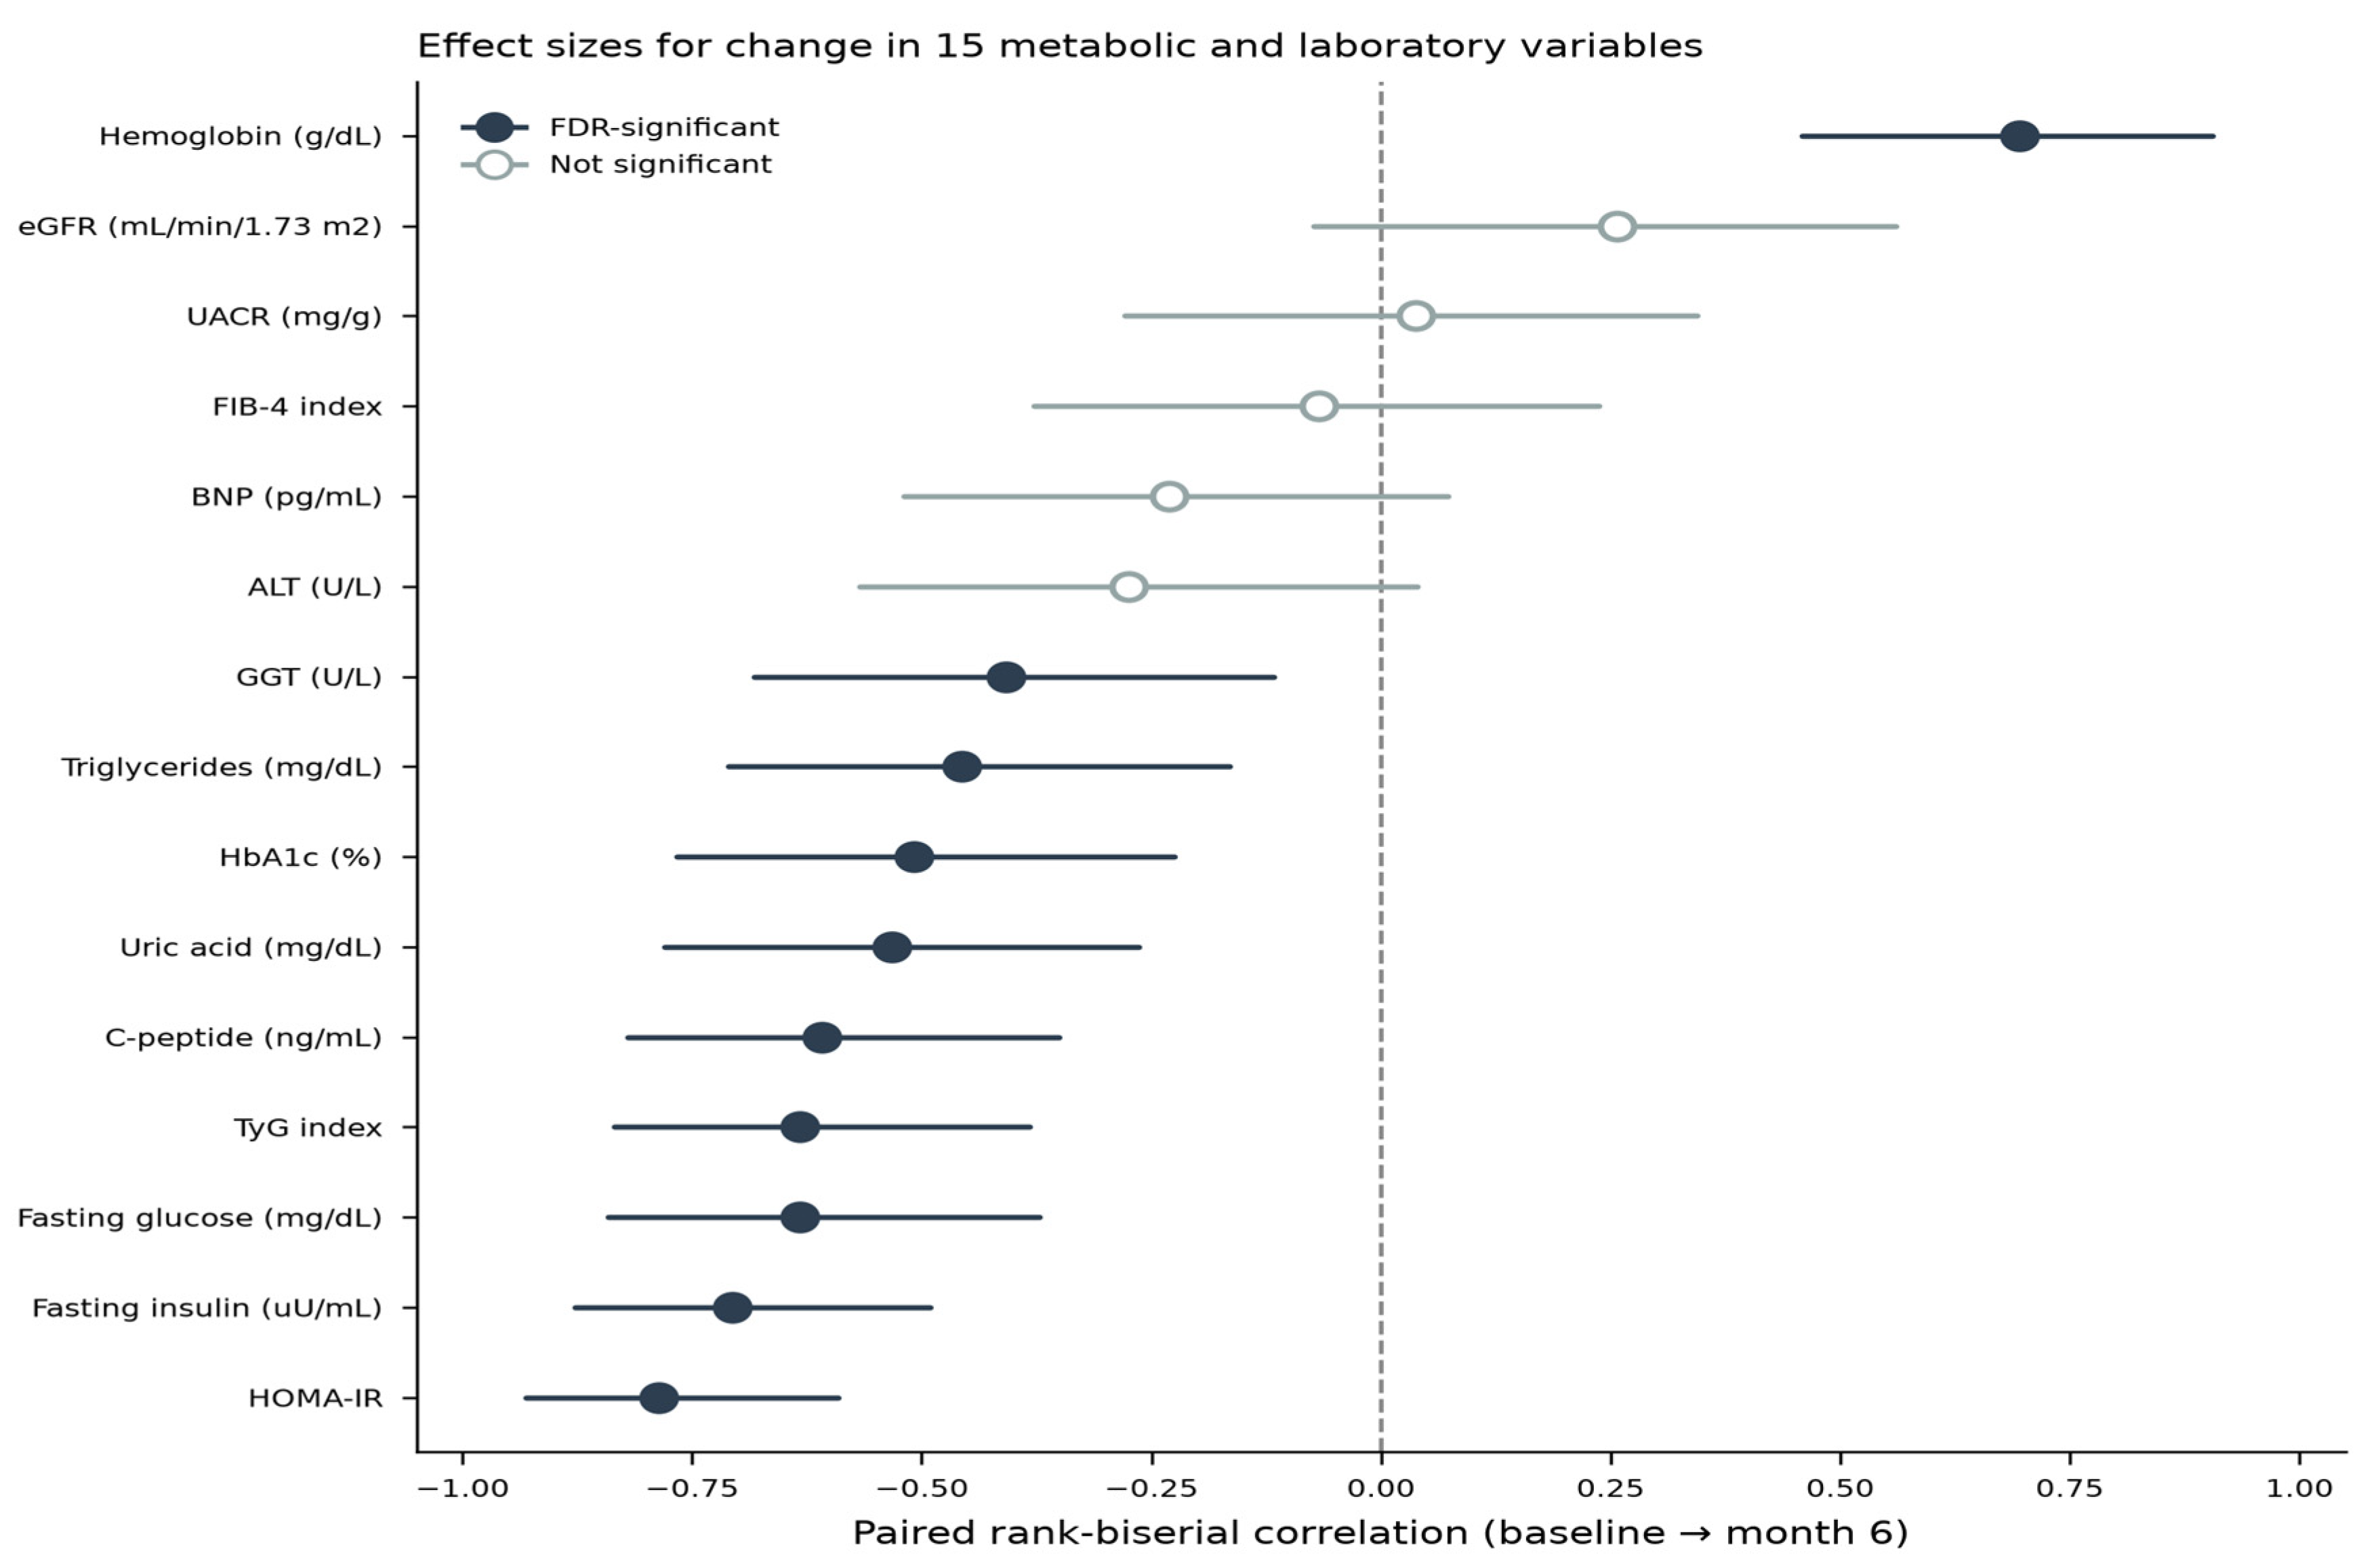
Figure 5.
Scatter plot of ΔHOMA-IR versus ΔHbA1c (baseline to month 6). Each point represents one patient; the dashed line indicates the regression line; the shaded area indicates the 95% CI. Spearman ρ = −0.15, p = 0.27. Abbreviations: HbA1c, glycated hemoglobin; HOMA-IR, Homeostatic Model Assessment of Insulin Resistance. Created by the authors using original study data.
Figure 5.
Scatter plot of ΔHOMA-IR versus ΔHbA1c (baseline to month 6). Each point represents one patient; the dashed line indicates the regression line; the shaded area indicates the 95% CI. Spearman ρ = −0.15, p = 0.27. Abbreviations: HbA1c, glycated hemoglobin; HOMA-IR, Homeostatic Model Assessment of Insulin Resistance. Created by the authors using original study data.
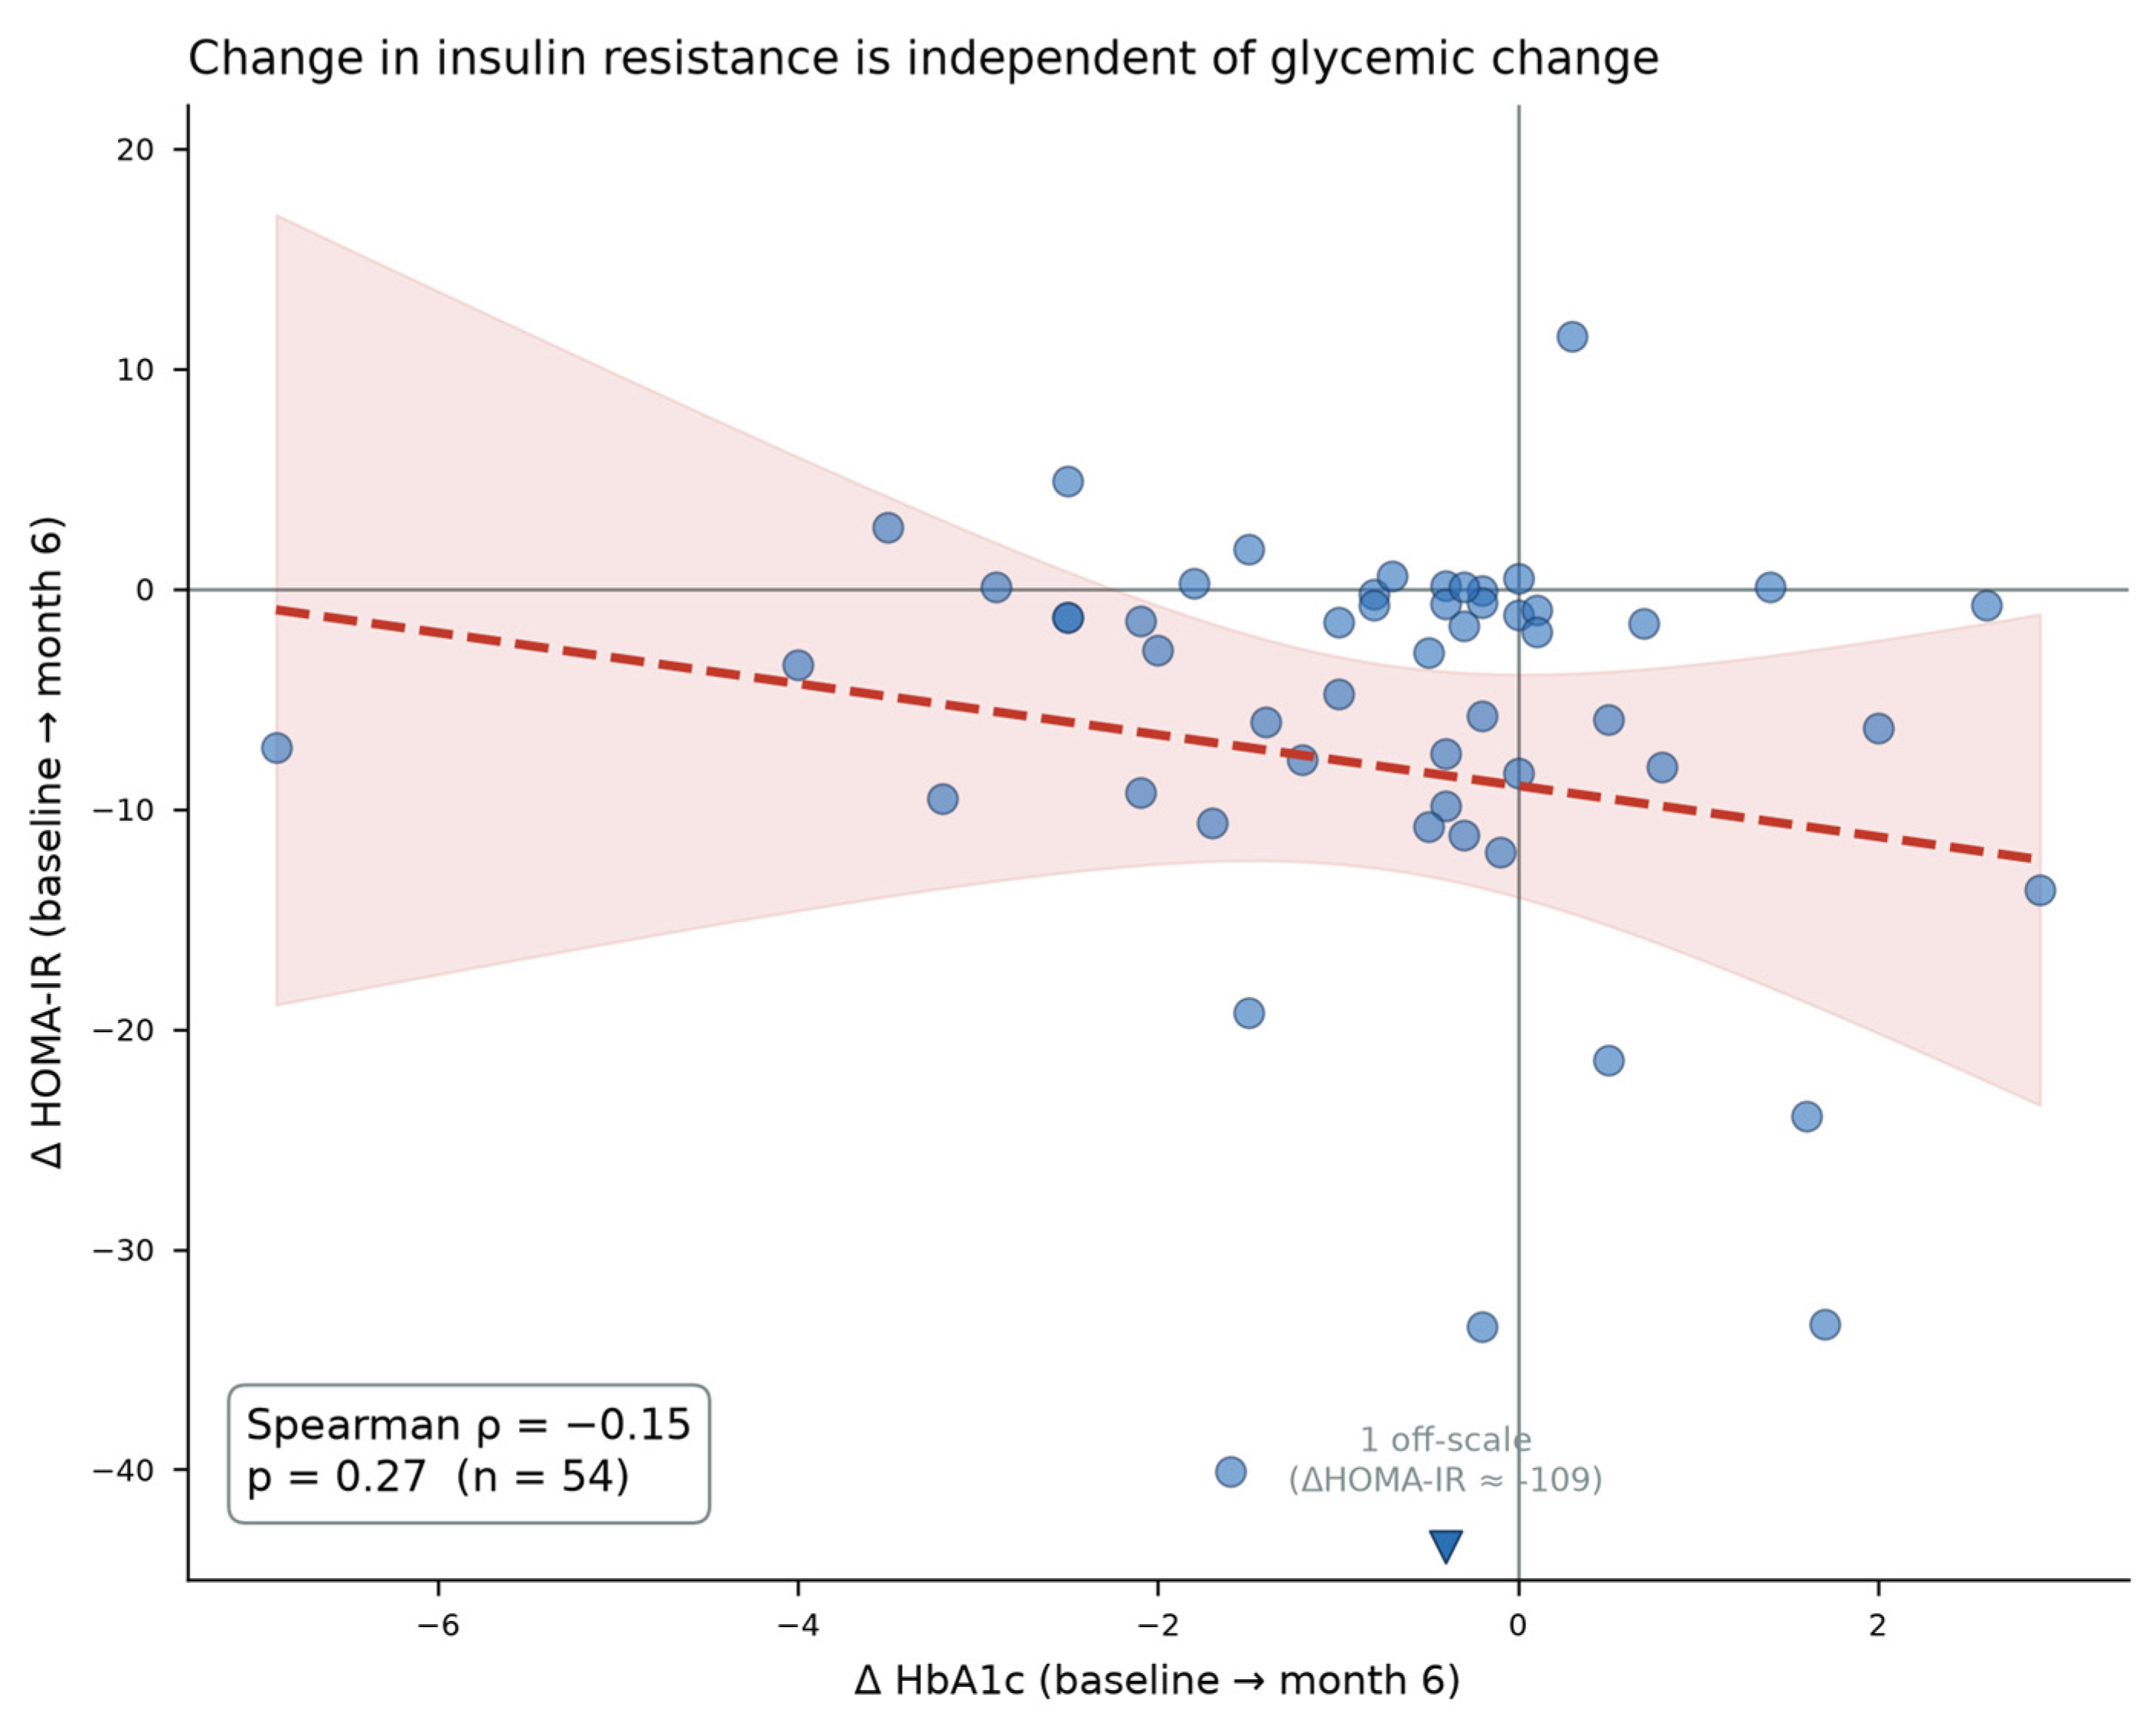
Figure 6.
Exploratory subgroup analysis: HOMA-IR and TyG index trajectories by baseline kidney-disease criterion. Criterion not met (n = 32) versus criterion met (n = 22). Points indicate group medians and error bars the interquartile range. Group x time interaction at month 6: TyG index beta = +0.308, p = 0.040; log-transformed HOMA-IR beta = +0.393, p = 0.077. Direct between-group comparison of within-participant change: TyG p = 0.089; log HOMA-IR p = 0.235 (Mann-Whitney U). The nominal TyG interaction is not corroborated by the between-group comparison, and no multiplicity adjustment was applied to these exploratory tests. Classification rests on a single baseline assessment and does not establish chronicity. Abbreviations: HOMA-IR, homeostatic model assessment of insulin resistance; TyG, triglyceride-glucose. Created by the authors using original study data.
Figure 6.
Exploratory subgroup analysis: HOMA-IR and TyG index trajectories by baseline kidney-disease criterion. Criterion not met (n = 32) versus criterion met (n = 22). Points indicate group medians and error bars the interquartile range. Group x time interaction at month 6: TyG index beta = +0.308, p = 0.040; log-transformed HOMA-IR beta = +0.393, p = 0.077. Direct between-group comparison of within-participant change: TyG p = 0.089; log HOMA-IR p = 0.235 (Mann-Whitney U). The nominal TyG interaction is not corroborated by the between-group comparison, and no multiplicity adjustment was applied to these exploratory tests. Classification rests on a single baseline assessment and does not establish chronicity. Abbreviations: HOMA-IR, homeostatic model assessment of insulin resistance; TyG, triglyceride-glucose. Created by the authors using original study data.


Table 1.
Baseline characteristics (n = 54).
| Variable | Value |
| Age (years), mean ± SD | 61.8 ± 9.2 |
| Female sex, n (%) | 31 (57.4) |
| Baseline kidney-disease criterion met, n (%) | 22 (40.7) |
| Criterion not met, n (%) | 32 (59.3) |
| Dapagliflozin 10 mg, n (%) | 46 (85.2) |
| Empagliflozin 25 mg, n (%) | 8 (14.8) |
| HOMA-IR, median (IQR) | 8.38 (3.47–13.26) |
| TyG index, median (IQR) | 9.45 (9.16–9.99) |
| HbA1c (%), median (IQR) | 7.35 (6.72–9.25) |
| Fasting glucose (mg/dL), median (IQR) | 147 (116–194) |
| Fasting insulin (µU/mL), median (IQR) | 22.0 (10.0–32.0) |
| Uric acid (mg/dL), median (IQR) | 5.70 (4.55–6.88) |
| GGT (U/L), median (IQR) | 20.0 (15.0–28.8) |
| Hemoglobin (g/dL), median (IQR) | 13.05 (12.03–14.28) |
Abbreviations: GGT, gamma-glutamyl transferase; HbA1c, glycated hemoglobin; HOMA-IR, Homeostatic Model Assessment of Insulin Resistance; IQR, interquartile range; SD, standard deviation; TyG, triglyceride–glucose.
Table 2.
Longitudinal changes in metabolic parameters (n = 54).
| Parameter | Baseline, median (IQR) | Month 3, median (IQR) | Month 6, median (IQR) | n non-tied pairs | r | p | FDR p | Change, % |
| HOMA-IR | 8.38 (3.47-13.26) | 3.37 (2.27-6.17) | 3.14 (2.19-4.39) | 54 | -0.79 | <0.001 | <0.001 | -62.6 |
| Fasting insulin (uU/mL) | 22.00 (10.00-32.00) | 10.10 (7.20-17.00) | 11.00 (7.25-13.00) | 52 | -0.71 | <0.001 | <0.001 | -50.0 |
| C-peptide (ng/mL) | 2.92 (1.72-5.05) | 2.30 (1.50-2.80) | 1.95 (1.52-2.98) | 51 | -0.61 | <0.001 | <0.001 | -33.2 |
| Fasting glucose (mg/dL) | 147.00 (116.25-194.25) | 123.50 (107.25-149.25) | 116.50 (101.25-134.75) | 53 | -0.63 | <0.001 | <0.001 | -20.7 |
| TyG index | 9.45 (9.16-9.99) | 9.10 (8.77-9.48) | 9.04 (8.76-9.38) | 54 | -0.63 | <0.001 | <0.001 | -4.3 |
| HbA1c (%) | 7.35 (6.72-9.25) | 7.15 (6.62-8.17) | 7.20 (6.62-8.30) | 51 | -0.51 | 0.002 | 0.003 | -2.0 |
| Triglycerides (mg/dL) | 168.00 (120.25-239.75) | 140.00 (99.75-196.25) | 158.50 (106.25-189.00) | 53 | -0.46 | 0.004 | 0.006 | -5.7 |
| Uric acid (mg/dL) | 5.70 (4.55-6.88) | 5.00 (3.70-5.78) | 4.90 (4.00-6.07) | 54 | -0.53 | <0.001 | 0.001 | -14.0 |
| GGT (U/L) | 20.00 (15.00-28.83) | 19.50 (15.00-26.00) | 16.50 (13.00-23.75) | 52 | -0.41 | 0.010 | 0.016 | -17.5 |
| ALT (U/L) | 20.00 (13.25-24.75) | 18.00 (14.00-23.00) | 18.50 (13.00-24.00) | 51 | -0.27 | 0.088 | 0.119 | -7.5 |
| FIB-4 index | 1.10 (0.80-1.32) | 1.05 (0.86-1.34) | 0.99 (0.83-1.34) | 54 | -0.07 | 0.664 | 0.711 | -10.0 |
| eGFR (mL/min/1.73 m2) | 89.00 (59.75-97.00) | 91.50 (66.50-98.00) | 91.50 (63.75-98.00) | 51 | 0.26 | 0.111 | 0.138 | +2.8 |
| UACR (mg/g) | 12.50 (5.53-52.73) | 12.50 (6.00-35.00) | 12.00 (5.40-53.00) | 54 | 0.04 | 0.806 | 0.806 | -4.0 |
| BNP (pg/mL) | 47.00 (23.00-78.00) | 39.50 (19.25-62.00) | 36.00 (17.25-55.75) | 53 | -0.23 | 0.143 | 0.165 | -23.4 |
| Hemoglobin (g/dL) | 13.05 (12.03-14.28) | 13.35 (12.53-14.38) | 13.70 (12.70-14.67) | 49 | 0.69 | <0.001 | <0.001 | +5.0 |
Abbreviations: FDR, false discovery rate (Benjamini–Hochberg); FIB-4, Fibrosis-4 index; GGT, gamma-glutamyl transferase; HbA1c, glycated hemoglobin; HOMA-IR, Homeostatic Model Assessment of Insulin Resistance; IQR, interquartile range; ns, not significant; r, rank-biserial correlation; TyG, triglyceride–glucose index.
Table 3.
Exploratory analysis of metabolic change by baseline kidney disease status. Because subgroups were not pre-specified and the smaller group contains only 13 participants, these results are hypothesis-generating. Inference is based on the direct between-group comparison of within-participant change (Mann-Whitney U with rank-biserial effect size) and on the group x time interaction term of the linear mixed model, not on comparing within-group significance. Baseline kidney disease status rests on a single baseline assessment and does not establish chronicity. KD, kidney disease.
Table 3.
Exploratory analysis of metabolic change by baseline kidney disease status. Because subgroups were not pre-specified and the smaller group contains only 13 participants, these results are hypothesis-generating. Inference is based on the direct between-group comparison of within-participant change (Mann-Whitney U with rank-biserial effect size) and on the group x time interaction term of the linear mixed model, not on comparing within-group significance. Baseline kidney disease status rests on a single baseline assessment and does not establish chronicity. KD, kidney disease.
| Outcome | Group |
Baseline median (IQR) |
Month 6 median (IQR) |
Within-group median change |
Between-group Δ p (Mann-Whitney) |
r |
LMM month6 × criterion interaction p |
| HOMA-IR (log units) |
Criterion not met (n=32) | 5.89 (3.19-11.77) | 2.59 (1.86-3.27) | -0.763 | 0.235 | -0.19 | 0.077 |
| Criterion met (n=22) | 8.85 (5.91-14.27) | 4.27 (2.84-8.31) | -0.422 | ||||
| TyG index (index units) |
Criterion not met (n=32) | 9.55 (9.23-9.90) | 9.04 (8.76-9.27) | -0.570 | 0.089 | -0.28 | 0.040 |
| Criterion met (n=22) | 9.36 (8.96-10.03) | 9.03 (8.76-9.66) | -0.218 |
Between-group p values from Mann–Whitney U test. Abbreviations: FDR, false discovery rate; GGT, gamma-glutamyl transferase; HOMA-IR, Homeostatic Model Assessment of Insulin Resistance; IQR, interquartile range; r, rank-biserial correlation; TyG, triglyceride–glucose index.
Table 4.
Exploratory robustness check of the HOMA-IR change under two arbitrary fasting-insulin exclusion thresholds, with the insulin-independent TyG index for comparison. Thresholds are a proxy for possible exogenous insulin exposure and cannot verify it; medication records were not available.
Table 4.
Exploratory robustness check of the HOMA-IR change under two arbitrary fasting-insulin exclusion thresholds, with the insulin-independent TyG index for comparison. Thresholds are a proxy for possible exogenous insulin exposure and cannot verify it; medication records were not available.
| Scenario | n | Outcome |
Baseline median |
Month 6 median |
Change, % | r | p |
| Full cohort | 54 | HOMA-IR | 8.38 | 3.14 | -62.6 | -0.79 | <0.001 |
| Full cohort | 54 | TyG index | 9.45 | 9.04 | -4.3 | -0.63 | <0.001 |
| Exclude fasting insulin >100 µU/mL | 50 | HOMA-IR | 7.84 | 3.07 | -60.9 | -0.75 | <0.001 |
| Exclude fasting insulin >100 µU/mL | 50 | TyG index | 9.45 | 9.01 | -4.6 | -0.70 | <0.001 |
| Exclude fasting insulin >50 µU/mL | 46 | HOMA-IR | 6.13 | 3.07 | -50.0 | -0.71 | <0.001 |
| Exclude fasting insulin >50 µU/mL | 46 | TyG index | 9.39 | 9.01 | -4.0 | -0.65 | <0.001 |
Thresholds are arbitrary and serve as a proxy for possible exogenous insulin exposure; a fasting-insulin value cannot identify who is receiving insulin and these cut-offs do not verify exposure. p values from Wilcoxon signed-rank test (FDR-adjusted for TyG). HOMA-IR, Homeostatic Model Assessment of Insulin Resistance; TyG, triglyceride–glucose index.
Disclaimer/Publisher’s Note: The statements, opinions and data contained in all publications are solely those of the individual author(s) and contributor(s) and not of MDPI and/or the editor(s). MDPI and/or the editor(s) disclaim responsibility for any injury to people or property resulting from any ideas, methods, instructions or products referred to in the content. |
© 2026 by the authors. Licensee MDPI, Basel, Switzerland. This article is an open access article distributed under the terms and conditions of the Creative Commons Attribution (CC BY) license (http://creativecommons.org/licenses/by/4.0/).
Copyright: This open access article is published under a Creative Commons CC BY 4.0 license, which permit the free download, distribution, and reuse, provided that the author and preprint are cited in any reuse.