
Preprint
Article

This version is not peer-reviewed.

Medium C/N with Low Aeration for Enhanced Aerobic Denitrifying MBBRs Start-Up Treating Mariculture Wastewater

Submitted:

27 August 2026

Posted:

28 August 2026

You are already at the latest version

Abstract
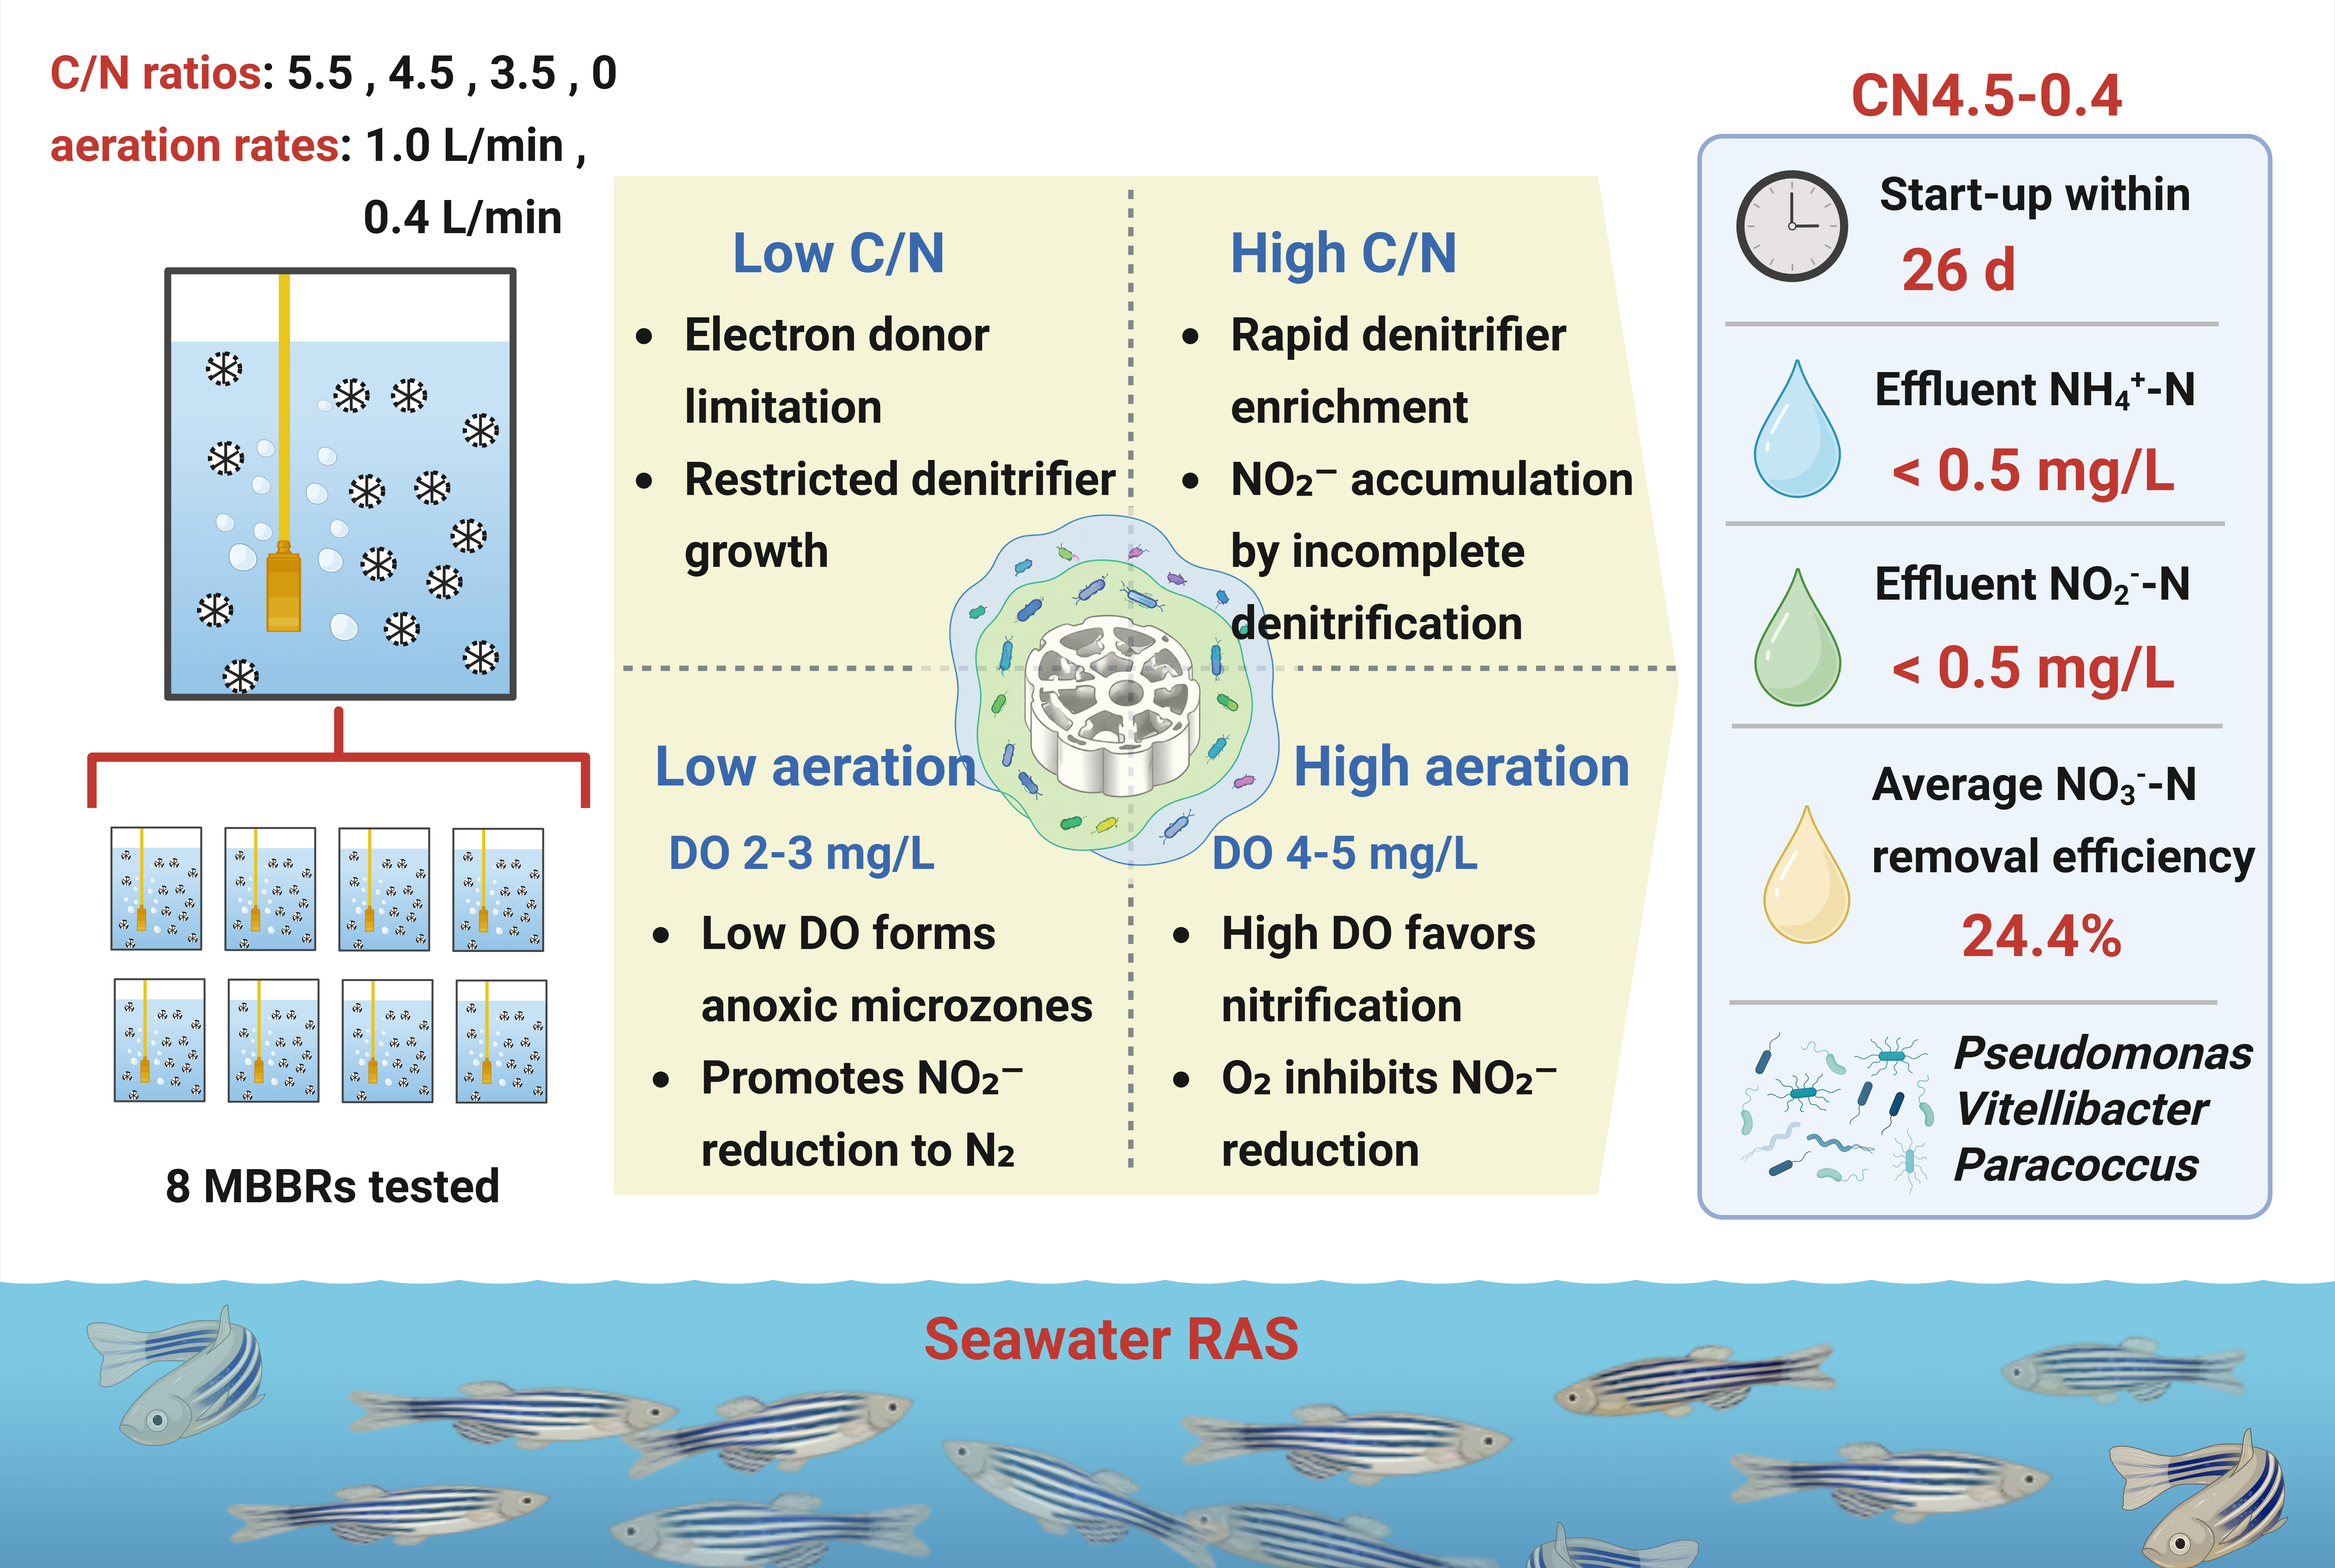
The Moving Bed Biofilm Reactor (MBBR) is commonly used for NH₄⁺-N removal from seawater recirculating aquaculture systems (RAS), while total nitrogen (TN) reduction is increasingly required. Aerobic denitrification offers a potential solution for simultaneous TN and NH₄⁺-N removal, but rapid reactor start-up remains challenging. This study investigated the start-up of aerobic denitrifying MBBRs treating mariculture wastewater. Eight MBBRs were operated at 25 ℃ with four C/N ratios (5.5, 4.5, 3.5, and 0) and two aeration rates (1.0 and 0.4 L/min). Only the CN4.5-0.4 MBBR met the predefined start-up criteria, achieving start-up in 26 days with an NH₄⁺-N removal efficiency of 93.8%. Effluent NH₄⁺-N and NO₂⁻-N remained below 0.5 mg/L without NO₃⁻-N accumulation. External carbon addition was essential, but excessive carbon did not accelerate start-up; CN3.5 MBBRs showed slower and less stable NH₄⁺-N removal, whereas CN5.5 MBBRs showed higher NO₃⁻-N removal but still accumulated NO₂⁻-N. Low aeration increased the average NO₃⁻-N removal efficiency at C/N = 5.5 from 39.0% to 66.2%. Microbial community analysis identified Pseudomonas, Vitellibacter, and Paracoccus as the dominant nitrogen-removing genera, with a combined relative abundance of 41.0% in the CN4.5-0.4 MBBR. Metagenomic sequencing identified genes associated with multiple nitrogen-transformation pathways and supported the potential for aerobic denitrification.
Keywords: 
;  ;  ;  ;  

1. Introduction

Conventional pond and cage aquaculture usually require extensive water resources and are vulnerable to environmental fluctuations such as climate variation, water quality changes, and external pollution. Therefore, land-based recirculating aquaculture systems have attracted increasing attention [1]. The recirculating aquaculture system (RAS), characterized by water conservation, land efficiency, high stocking density, and controllable discharge, better meets the requirements of sustainable aquaculture than conventional farming methods and represents an important direction for future aquaculture development [2].
However, high stocking density and feeding input in RAS can lead to the accumulation of feces and uneaten feed in culture water. These organic wastes release NH₄⁺-N through mineralization, while dissolved organic nitrogen can also be converted to NH₄⁺-N through microbial ammonification. Subsequently, NH₄⁺-N is oxidized to NO₂⁻-N and NO₃⁻-N through nitrification. Excessively high concentrations of NH₄⁺-N can severely affect the catalytic activity of enzymes and the stability of cell membranes in fish and shrimp, and impair excretory function and osmotic balance [3]. Excessively high NO₂⁻-N concentrations can interfere with oxygen transport in fish and shrimp, cause oxidation of important compounds, and damage organs [4]. In addition, NO₃⁻-N is the final product of nitrification in RAS and is generally less acutely toxic than NH₄⁺-N and NO₂⁻-N. However, excessive NO₃⁻-N accumulation can still inhibit the growth of fish and shrimp, and NO₃⁻-N-containing effluent may contribute to environmental pollution and eutrophication [5,6]. Therefore, compliant discharge of nitrogen-containing aquaculture tailwater is increasingly required, especially as the newly revised Fisheries Law of the People’s Republic of China [7] requires aquaculture tailwater discharge to meet relevant pollutant discharge standards, including TN limits where applicable.
The moving bed biofilm reactor (MBBR) is an efficient biofilm wastewater treatment technology with a 30-year global development history since its initial application in Norway in the late 1980s, supported by extensive research [8]. Evolved from a combination of biological fluidized bed and activated sludge process [9], it demonstrates operational simplicity, strong shock resistance, and stable performance. While MBBR applications in freshwater aquaculture have been studied [10], its extension to marine environments faces challenges in microbial community structure and metabolic activity, resulting in comparatively slower research progress and limited practical implementation [11,12]. Research on aerobic denitrification in seawater MBBRs remains in its infancy. Xiang et al. [13] investigated the effects of different COD/TN ratios on nitrogen removal performance and microbial communities in a pilot-scale MBBR bioaugmented with the salt-tolerant HNAD strain Zobellella B307. Their subsequent study evaluated the effects of different dissolved oxygen concentrations on the performance, biofilm characteristics, and microbial responses of an MHNAD-MBBR [14]. For complete nitrogen removal, MBBR systems usually require separate anoxic/aerobic zones, leading to structural complexity, large spatial footprints, and high energy consumption. The discovery of aerobic denitrifying bacteria has challenged traditional paradigms by enabling the reduction of NO₃⁻ to N₂ under aerobic conditions [15]. MBBR start-up efficiency critically determines system stability and cost-effectiveness, yet this process remains constrained by the synergistic colonization capacity of aerobic denitrifying and nitrifying bacteria.
In practical RAS operations, dissolved oxygen (DO) levels are typically controlled by adjusting aeration parameters. Aerobic denitrifying bacteria generally require appropriate microaerobic conditions to balance denitrifying enzyme activity and aerobic respiration, whereas nitrifying bacteria require sufficient DO for NH₄⁺-N oxidation [15]. Aerobic denitrifying bacteria rely on organic carbon sources as electron donors, and the C/N ratio is therefore a key factor regulating their nitrogen removal performance [13,16]. When the C/N ratio is too low, electron donor limitation can lead to NO₂⁻-N and NO₃⁻-N accumulation. However, when the C/N ratio exceeds the suitable range of the system, excessive organic carbon can promote the rapid proliferation of heterotrophic bacteria and denitrifiers. A large number of heterotrophic bacteria may compete with nitrifiers for DO and biofilm space, thereby slowing the nitrification process. Meanwhile, excessive enrichment of denitrifiers may cause NO₃⁻-N reduction to proceed faster than subsequent NO₂⁻-N reduction, resulting in an imbalance in the denitrification process and NO₂⁻-N accumulation [17,18]. Moreover, excessive carbon input inevitably increases operational costs. Additionally, high salinity stress in mariculture can disrupt cellular osmotic balance, and nitrifying bacteria exhibit slow growth rates under saline conditions, typically requiring extended biofilm formation periods [19]. Due to the conflicting DO and carbon source requirements between aerobic denitrifying and nitrifying bacteria, conventional MBBR start-up strategies often fail to achieve efficient synergism between these microbial groups.
Therefore, this study investigated the start-up of aerobic denitrifying biofilms and carbon and nitrogen removal performance in seawater RAS using eight MBBR systems operated at room temperature (25 ℃) with bioaugmented biofilm inoculation. The experimental variables included external carbon source C/N ratios (5.5, 4.5, 3.5, 0) and aeration rates (1.0 L/min for high aeration; 0.4 L/min for low aeration). This study further analyzed microbial diversity, relative abundance, and community structure to explain the differences in water quality variation and nitrogen removal performance under different C/N ratios and aeration rates. Metagenomic sequencing was employed to investigate intrinsic microbial pollutant degradation mechanisms. These findings provide practical guidance for carbon dosing and aeration control in industrial RAS.

2. Materials and Methods

2.1. Experimental Materials

2.1.1. MBBR Configuration

The core of this study utilized MBBR systems, with the experimental setup illustrated in the Supplementary Material (Figure S1). The configuration primarily consisted of a water storage tank, peristaltic pump, reactor, thermostatic water bath and low-temperature circulator, biofilm carriers, and aerator.
Each of the 8 experimental MBBR units consisted of cylindrical plexiglass vessels with an effective height of 500 mm, diameter of 140 mm, and working volume of 7.7 L. The system comprised four 200 L water storage tanks supplying eight parallel MBBR units, with each tank serving one C/N ratio. Detailed operational parameters for each unit are presented in Table 1.
Each reactor was loaded with approximately 350 g of commercial K6 biofilm carriers (25 mm in diameter, 4 mm in height, specific surface area of 1150 m²/m³) manufactured from high-density polyethylene and modified materials from Sanxing Water Treatment Equipment Co., Ltd. (Henan, China). The total packed volume reached approximately 2 L, resulting in a carrier filling ratio of approximately 26%. K6 biofilm carriers were selected due to their high specific surface area and favorable biofilm attachment properties, which are particularly advantageous for microbial colonization under saline conditions.
The experiment employed bioaugmented biofilm inoculation for system start-up. The start-up procedure was as follows: First, activated nitrogen removing bacteria were cultured using Industrial Denitrifying Bacteria and Aquatic Growth Factor products from Yichun Qiangwei Biotechnology Co., Ltd. (Jiangxi, China). The bacterial suspension was prepared with 6.0 g denitrifying bacteria, 6.0 g aquatic growth factor, 60 g artificial sea salt, 2 L purified water, and 150 g brown sugar, followed by thorough mixing and aerobic incubation for more than 18 h at 25 ℃. Two batches totaling 4 L of activated culture were prepared. Subsequently, each MBBR unit was loaded with 350 g of pre-cleaned and dried K6 carriers and 500 mL of activated culture. After filling the reactors to the outlet level with a peristaltic pump, all eight systems underwent 24 h batch aeration at 1.0 L/min. Following this batch phase, continuous 24 h inflow and aeration commenced under predetermined parameters. In this study, successful start-up was operationally defined as dense biofilm coverage on the carriers, together with effluent NH₄⁺-N and NO₂⁻-N concentrations below 0.5 mg/L and no net NO₃⁻-N accumulation for three consecutive measurements.

2.1.2. Experimental Water

The test water used artificial simulated recirculating aquaculture seawater, with the RAS simulation formula determined based on previous research [20]. The prepared water contained an NH₄⁺-N concentration of 5 mg/L, NO₃⁻-N concentration of 50 mg/L, and total nitrogen of 55 mg/L. In this study, the carbon-to-nitrogen ratio was expressed as the influent COD/TN ratio, where COD was calculated from the theoretical oxygen demand of sodium acetate and TN was calculated as the sum of influent NH₄⁺-N and NO₃⁻-N. To simulate the marine aquaculture environment, 31–33 g/L of artificial sea salt was added during each water preparation, resulting in a final salinity of 27.0 ± 1.5‰. Sodium acetate was supplemented according to the required C/N ratio, with sodium carbonate added as a buffer to adjust solution pH. Trace elements were added at a ratio of 2 ml per 1 L of simulated RAS seawater. Tap water was used for preparation, with each batch consisting of 200 L of simulated recirculating water. The prepared water and trace elements were thoroughly mixed and left to stand to ensure uniform distribution of all components. All MBBRs were operated at an HRT of 4 h. The initial influent pH was maintained at 7.10 ± 0.15.

2.2. Chemical Detection Indicators and Analytical Methods

Water samples were collected from the influent and effluent ports of each reactor every other day and numbered, then immediately tested after filtration through 0.45 μm syringe filters to remove impurities.

2.2.1. The Determination of Nitrogen Species and Other Physicochemical Indicators

NH₄⁺-N, NO₂⁻-N, and NO₃⁻-N, collectively referred to as " nitrogen species", were determined by Nessler's reagent colorimetric method, nitrite-N-(1-naphthyl)-ethylenediamine spectrophotometric method, and ultraviolet spectrophotometric method, respectively, using a spectrophotometer (Cary 60 UV-Vis, Agilent Technologies, USA). Other physicochemical parameters were measured using specialized instruments: salinity was measured with a handheld salinity meter (AR8012, Dongguan Wanchuang Electronic Products Co., Ltd., China), pH and water temperature were measured with a pH meter (PHS-25, Shanghai Yidian Scientific Instrument Co., Ltd., China), and dissolved oxygen in both the storage tank and reactors was measured with a portable dissolved oxygen meter (JPB-607A, Shanghai Yidian Scientific Instrument Co., Ltd., China).

2.2.2. Dissolved Organic Carbon Analysis

The dissolved organic carbon concentration was determined using a total organic carbon analyzer (multi N/C 3100, Analytik Jena AG, Germany) based on the high-temperature combustion method. The procedure involved: first acidifying samples with hydrochloric acid to pH 1.5-2.5, followed by purging with high-purity oxygen. The analyzer then automatically injected aliquots of the sample into a high-temperature combustion tube (heated to 700 ℃) in two batches. The total organic carbon content was calculated based on the CO₂ released during combustion. This method results in loss of purgeable organic compounds during aeration, therefore measuring only non-purgeable organic carbon, representing non-volatile dissolved organic carbon.

2.3. Microbial Analysis

At the end of the experiment, several K6 carriers were collected from each reactor and placed in sterilized, dried centrifuge tubes. Liquid nitrogen was immediately added for rapid freezing. After complete evaporation of the liquid nitrogen, the tube caps were tightened and stored at -80 ℃ for preservation. Mingke Biotechnology Co., Ltd. (Hangzhou, China) was commissioned to perform total DNA extraction, PCR amplification, sequencing, and analysis of the biofilm on K6 carriers.

2.3.1. Microbial Community Diversity Analysis

To analyze microbial community diversity and taxonomic composition, total genomic DNA was extracted from the samples, and the V3–V4 hypervariable regions of the bacterial 16S rRNA gene were amplified by PCR using barcode-tagged universal primers. PCR amplification was performed using TransStart FastPfu DNA Polymerase (TransGen Biotech, China). The amplified products were pooled and checked by 2% agarose gel electrophoresis, purified using the AxyPrep DNA Gel Extraction Kit (Axygen, USA), and quantified with the QuantiFluor™-ST blue fluorescence quantification system (Promega, USA). Purified amplicons were then mixed at equimolar concentrations according to sequencing requirements.
The libraries were sequenced on an Illumina platform using paired-end sequencing. Raw sequencing data were subjected to quality control and sequence assembly, followed by amplicon sequence variant (ASV) clustering and taxonomic annotation. Based on the ASV data, α-diversity indices were calculated to evaluate microbial richness and diversity, and β-diversity analysis was conducted to compare differences in microbial community structures among samples, thereby elucidating microbial community characteristics and variation patterns.

2.3.2. Metagenomic Sequencing and Analysis

To further investigate functional genes and nitrogen metabolic mechanisms, samples from the reactor with optimal operational performance were selected for metagenomic sequencing analysis. The integrity of extracted genomic DNA was verified by 1% agarose gel electrophoresis, after which the DNA was fragmented to approximately 300 bp using a Covaris M220 focused ultrasonicator (Covaris, USA). Paired-end sequencing libraries were constructed using the TruSeq™ DNA Sample Prep Kit (Illumina, USA) and sequenced on the Illumina HiSeq platform.
Raw sequencing reads were subjected to quality control and assembly, followed by gene prediction. The predicted genes were taxonomically and functionally annotated using databases including NR, COG, and KEGG. Particular emphasis was placed on analyzing nitrogen cycle–related functional pathways and key enzyme genes to elucidate the microbial mechanisms underlying nitrification and denitrification processes in the MBBR system.

3. Results and Discussion

3.1. Study on the Effect of C/N Ratio on MBBR Start-Up Performance

3.1.1. The Effect of C/N Ratio on NH₄⁺-N Removal

As shown in Figure 1(a) and Figure 1(b), NH₄⁺-N removal during the start-up period differed markedly among the MBBRs operated at different C/N ratios. Under high aeration conditions (1.0 L/min), the CN0-1.0 MBBR lacked an external carbon source, making it difficult for aerobic denitrification-related microorganisms to proliferate rapidly. Meanwhile, the high-salinity environment may have inhibited the growth and activity of autotrophic nitrifiers, resulting in the failure to establish an effective NH₄⁺-N removal system within a short period. In contrast, the CN5.5-1.0 and CN4.5-1.0 MBBRs reduced effluent NH₄⁺-N to below 0.5 mg/L within 48 h and maintained relatively stable performance thereafter. The CN3.5-1.0 MBBR showed a higher effluent NH₄⁺-N concentration at the initial stage, but it gradually decreased afterward. During the entire start-up period, the average NH₄⁺-N removal efficiencies of the CN5.5-1.0, CN4.5-1.0, and CN3.5-1.0 MBBRs were 97.3%, 95.7%, and 84.6%, respectively. These results indicate that, under high aeration conditions, an appropriate increase in C/N ratio helped accelerate the establishment of ammonia removal function during start-up. However, further increasing the C/N ratio from 4.5 to 5.5 did not markedly improve NH₄⁺-N removal efficiency, suggesting that C/N=4.5 was already sufficient to meet the carbon requirement for the growth and metabolism of heterotrophic functional bacteria involved in ammonia transformation.
A similar pattern was observed under low aeration conditions. The CN0-0.4 MBBR still exhibited poor NH₄⁺-N removal performance, whereas the CN5.5-0.4, CN4.5-0.4, and CN3.5-0.4 MBBRs achieved generally high NH₄⁺-N removal after 6 d, with average NH₄⁺-N removal efficiencies of 98.0%, 93.8%, and 90.3%, respectively. The mean effluent NH₄⁺-N concentrations were all below 0.5 mg/L. Compared with the CN5.5-0.4 and CN4.5-0.4 MBBRs, the CN3.5-0.4 MBBR showed greater fluctuations in effluent NH₄⁺-N, indicating that insufficient carbon supply at a lower C/N ratio may have limited the continuous proliferation and stable metabolism of heterotrophic nitrification–aerobic denitrification bacteria, thereby slowing the establishment of ammonia removal function and reducing its stability.

3.1.2. The Effect of C/N Ratio on NO₃⁻-N Removal

When the influent NO₃⁻-N concentration was maintained at approximately 50 mg/L, lower effluent NO₃⁻-N levels indicated effective inhibition of nitrate accumulation. Figure 1(c) and Figure 1(d) illustrate the influence of C/N ratio on NO₃⁻-N removal. All carbon-supplemented experimental MBBRs except the CN0 MBBRs achieved varying degrees of NO₃⁻-N removal within 48 h. Under identical aeration conditions, higher C/N ratios consistently corresponded to greater NO₃⁻-N removal efficiency, aligning with findings reported by Chen et al. [16]. This result can be attributed to the sufficient availability of organic carbon, which served as an electron donor and promoted the growth and activity of heterotrophic denitrifiers. Subsequent microbial community analysis showed that the main nitrogen-removing genera in this system included Pseudomonas, Vitellibacter, and Paracoccus, which are closely associated with heterotrophic nitrification and aerobic denitrification.
The CN5.5 MBBRs exhibited the strongest NO₃⁻-N removal among all carbon-supplemented reactors, suggesting that a relatively high C/N ratio accelerated the proliferation of denitrifying bacteria and enhanced nitrate reduction. However, higher NO₃⁻-N removal efficiency did not indicate the optimal overall nitrogen removal performance. Excessive carbon supply may have caused denitrifiers to become overly enriched, leading to faster NO₃⁻-N reduction than subsequent NO₂⁻-N reduction during the start-up period. As a result, the denitrification process became temporarily imbalanced, causing NO₂⁻-N accumulation as an intermediate product. For example, Zeng et al. [21] reported that the maximum nitrite accumulation ratio at C/N =5 was markedly higher than that at C/N =3 in a glucose-driven partial denitrification system, while Zhang et al. [22] found that acetate- and glycerol-driven systems achieved obvious NO₂⁻-N accumulation at specific C/N ratios. Therefore, although CN5.5 promoted NO₃⁻-N removal, it also increased the risk of incomplete denitrification and carbon source waste. In comparison, the CN4.5 MBBRs, especially CN4.5-0.4 under low aeration, achieved a better balance among NH₄⁺-N conversion, NO₃⁻-N removal, NO₂⁻-N control, and carbon utilization, making this condition more suitable for rapid and stable MBBR start-up.

3.1.3. Effect of C/N Ratio on Effluent NO₂⁻-N Concentration

NO₂⁻-N is an important toxic indicator in fish and shrimp aquaculture systems. Its accumulation usually results from incomplete nitrification of NH₄⁺-N or the limited further reduction of NO₂⁻-N during denitrification. As shown in Figure 1(e) and Figure 1(f), the nitrification system in the CN0 MBBRs was not effectively established, and denitrification was also very limited; therefore, almost no NO₂⁻-N accumulation occurred. In contrast, the remaining six MBBRs with external carbon addition showed different degrees of NO₂⁻-N accumulation. During the first 26 d, the effluent NO₂⁻-N concentrations fluctuated markedly in all MBBRs, indicating that the generation and further reduction of NO₂⁻-N had not yet reached a stable balance during the early start-up period.
The CN4.5-0.4 MBBR was the first to reduce effluent NO₂⁻-N below 0.5 mg/L on day 26 and maintained this stable performance over the following 6 d. This indicates that a moderate C/N ratio could provide sufficient electron donors, while lower aeration was conducive to the formation of local oxygen-limited microenvironments within the biofilm and reduced the competition between O₂ and NO₂⁻-N for electrons, thereby promoting the further reduction of NO₂⁻-N. Although the CN5.5 MBBRs generally showed smaller NO₂⁻-N fluctuations during the early start-up period, they failed to maintain effluent NO₂⁻-N below 0.5 mg/L during the later stage. This phenomenon is consistent with the analysis in Section 3.1.2, suggesting that the accumulated NO₂⁻-N in the CN5.5 MBBRs was mainly derived from incomplete NO₃⁻-N reduction rather than NH₄⁺-N oxidation, although the latter contribution could not be completely excluded. Therefore, the CN4.5-0.4 MBBR exhibited better stability in NO₂⁻-N control.

3.1.4. Effect of C/N Ratio on Organic Carbon Removal

In RAS, high concentrations of residual organic carbon in the effluent generally do not directly affect the health of cultured organisms but may cause water turbidity and increase the treatment pressure during discharge [23]. In this experiment, the influent organic carbon concentrations and DOC removal efficiencies during biofilm formation in the reactors operated at different C/N ratios are shown in Figure 2(a) and Figure 2(b). The influent and effluent organic carbon concentrations in the CN0 MBBRs remained consistently low, at approximately 3–4 mg/L, mainly because the added trace elements contained only small amounts of organic carbon that were not completely utilized by microorganisms. In contrast, the influent organic carbon concentrations differed markedly among the other experimental groups with different C/N ratios, whereas the effluent organic carbon concentrations in all groups stabilized at 5–10 mg/L after 10 d of operation. Under the same C/N ratio, the MBBRs operated under high and low aeration conditions showed similar organic carbon removal efficiencies. As the C/N ratio decreased, the organic carbon removal efficiency also declined. Overall, despite fluctuations in influent organic carbon concentrations or relatively high organic loading, the reactors effectively removed organic carbon, and the effluent organic carbon concentrations remained at relatively low levels.
As shown in Table 2, the optimal carbon-to-nitrogen ratios reported for different biofilm reactors varied considerably, with the favorable C/N or COD/TN ratios generally ranging from 4 to 20. For low-carbon biofilm nitrogen removal systems, the optimal ratios were typically concentrated between 4 and 5. Previous studies generally determined the optimal carbon-to-nitrogen ratio based on a single major indicator, such as NH₄⁺-N removal efficiency, NO₃⁻-N removal efficiency, TN removal efficiency, or nitrogen transformation rate. In contrast, the present study comprehensively considered NH₄⁺-N conversion, NO₃⁻-N reduction, NO₂⁻-N accumulation, start-up time, and carbon utilization efficiency. Comparative analysis showed that a C/N ratio of 4.5 enabled rapid reactor start-up while maintaining stable control of NH₄⁺-N, NO₂⁻-N, and NO₃⁻-N, together with relatively high carbon utilization efficiency. Therefore, C/N = 4.5 was identified as the optimal ratio for MBBR biofilm formation and start-up in this study.

3.2. Study on the Effect of Aeration Rate on MBBR Start-Up Performance

The reactor DO data during start-up are presented in the Supplementary Material (Figure S2). Under the same C/N ratio, the low-aeration reactors consistently showed lower DO than the high-aeration reactors, while all reactors remained under aerobic conditions. This provides important context for interpreting the nitrogen removal performance discussed below.

3.2.1. Effect of Aeration Rate on NH₄⁺-N Removal

Figure 3(a-d) demonstrate the differential effects of high aeration (1.0 L/min) compared with low aeration (0.4 L/min) on NH₄⁺-N removal across varying C/N ratios. For the CN0 MBBRs, low aeration conditions produced better NH₄⁺-N removal than high aeration, with the latter even showing negative removal rates likely due to residual molasses from initial bioaugmentation triggering DNRA reactions that caused NH₄⁺-N accumulation. As the operation continued, the CN0 MBBRs without external carbon addition gradually developed autotrophic nitrification. The CN0-0.4 MBBR maintained NH₄⁺-N accumulation-free operation and achieved a maximum removal rate of 8.9%, outperforming the high aeration condition. For the CN5.5 MBBRs, aeration intensity showed no obvious impact on NH₄⁺-N removal, with average effluent concentrations of 0.13 mg/L and 0.11 mg/L for high and low aeration respectively. For the CN4.5 MBBRs, NH₄⁺-N removal was more complete under high aeration, with average effluent NH₄⁺-N of 0.22 mg/L compared to 0.31 mg/L under low aeration. For the CN3.5 MBBRs, likely due to insufficient carbon supply causing unstable activity of heterotrophic nitrifying bacteria, effluent NH₄⁺-N showed frequent fluctuations until stabilizing after 26 d at low concentrations.

3.2.2. Effect of Aeration Rate on NO₃⁻-N Removal

Figure 3(e-h) demonstrate the effects of aeration rates on NO₃⁻-N removal efficiency under different C/N ratios. For the CN0 MBBRs, although relying only on trace amounts of organic carbon from the micronutrient solution, weak denitrification was still observed, with the CN0-0.4 MBBR showing slightly better but unstable removal efficiency than the CN0-1.0 MBBR, including instances of negative removal rates indicating NO₃⁻-N accumulation. Under each C/N ratio, the low-aeration MBBR generally exhibited higher denitrification efficiency than its high-aeration counterpart. Since all reactors remained under aerobic conditions during the start-up period, this difference was unlikely to result from complete oxygen limitation at the reactor scale, but rather from the different DO regimes created by the two aeration rates. This phenomenon may primarily be attributed to the relatively lower dissolved oxygen levels under low aeration, which more readily facilitate the formation of anoxic zones in less-mixed regions within the MBBR. Furthermore, due to the activity of aerobic microorganisms in the outer layer of the biofilm attached to the carriers, the dissolved oxygen concentration progressively decreases from the outer to inner layers of the biofilm during mass transfer. High aeration conditions may disrupt or weaken this dissolved oxygen concentration gradient within the biofilm and hinder the formation of anoxic microenvironments. Consequently, low aeration conditions may favor the coexistence of aerobic denitrification and biofilm-associated anoxic denitrification processes [38,39].
This trend was most evident at higher C/N ratios. At C/N = 5.5, the difference in average NO₃⁻-N removal efficiency between the high- and low-aeration MBBRs exceeded 27 percentage points. This may be because, under C/N = 5.5, electron donors were relatively sufficient, and denitrification was no longer mainly limited by carbon availability; therefore, DO conditions became an important factor affecting NO₃⁻-N reduction. As the C/N ratio decreased, the influence of aeration rate gradually diminished. At C/N = 4.5, the difference decreased to 3.7 percentage points, and at C/N = 3.5, it was only 2.9 percentage points. Therefore, under carbon-limited conditions, further adjustment of aeration intensity provided only limited improvement in NO₃⁻-N removal.

3.2.3. Effect of Aeration Rate on Effluent NO₂⁻-N Concentration

Figure 3(i-l) show that when C/N ratios were 0, 3.5, and 4.5, the MBBR systems consistently exhibited higher effluent NO₂⁻-N concentrations under higher aeration rates. With C/N ratios ≤ 4.5, the limited electron supply from carbon sources resulted in competition between O₂ and NO₂⁻-N for reducing equivalents under high dissolved oxygen conditions, leading to inhibited NO₂⁻-N reduction and subsequent accumulation. In contrast, under low dissolved oxygen conditions, NO₂⁻-N obtained more electrons, resulting in more complete denitrification. The CN0 MBBRs initially displayed similar patterns due to residual molasses from bioaugmentation inoculation, until carbon source depletion caused NO₂⁻-N concentrations to approach zero. After 26 d, microbial proliferation again led to discernible differences in effluent NO₂⁻-N levels. At C/N = 5.5, the higher organic carbon concentration provided more abundant electrons, making O₂ less competitive for electrons compared to other MBBRs, and consequently NO₂⁻-N could obtain sufficient electrons, resulting in no consistent difference in NO₂⁻-N concentrations between high and low aeration MBBRs. For practical applications, when C/N < 4.5, appropriately reducing aeration rates can effectively control NO₂⁻-N accumulation and optimize effluent quality.

3.2.4. Effect of Aeration Rate on Organic Carbon Removal

Figure 2. c-f) demonstrate that the effect of aeration rate on organic carbon removal was closely related to the C/N ratio. For the CN0 MBBRs, the lack of carbon source was insufficient to support substantial growth of heterotrophic microorganisms, resulting in no clear effect of aeration rate on removal efficiency. For the CN3.5 and CN4.5 MBBRs, organic carbon removal differed negligibly between the paired high- and low-aeration MBBRs. In contrast, for the CN5.5 MBBRs, organic carbon removal was generally higher in the CN5.5-0.4 MBBR than in the CN5.5-1.0 MBBR. Nevertheless, the aeration effect did not cause effluent organic carbon to exceed standards, with both control and experimental MBBRs meeting recirculation requirements. The study revealed that when C/N ≤ 4.5, aeration rate had minimal influence on both denitrification and organic carbon removal, while the effect became more pronounced when C/N increased to 5.5. This primarily occurs because higher C/N ratios accelerate the proliferation rate of heterotrophic bacteria beyond just denitrifiers, thereby accelerating organic carbon consumption. In practical operation, aeration strategies should be adjusted according to C/N ratios to balance nitrogen removal efficiency with energy consumption.

3.3. Microbial Community Analysis

This study analyzed the ASV distribution of microbial samples collected from the eight MBBRs. As shown in Figure 4(a), all eight samples shared 23 ASVs, while the CN0-0.4 sample contained 406 sample-specific ASVs, the highest number among all samples. Marked differences in ASV composition were observed among the samples. The CN3.5-1.0 and CN3.5-0.4 MBBRs showed the lowest total ASV counts and the fewest sample-specific ASVs, suggesting relatively low ASV richness and limited sample-specific differentiation. In contrast, the CN0-1.0, CN5.5-1.0, and CN4.5-1.0 MBBRs shared more ASVs with other samples, indicating greater overlap in microbial composition.

3.3.1. Alpha Diversity Analysis

Alpha diversity analysis reflects the abundance and diversity of microbial communities. Samples were collected at the end of the start-up experiment (32 d). As the CN0 MBBRs lacked external carbon supplementation and failed to establish an effective SND nitrogen removal system within this short period, the analysis focused primarily on carbon-supplemented MBBRs.
The Chao index reflects microbial community richness. Figure 4(b) shows the following Chao index order: CN5.5-1.0 MBBR > CN4.5-1.0 MBBR > CN3.5-1.0 MBBR, and CN5.5-0.4 MBBR > CN4.5-0.4 MBBR ≥ CN3.5-0.4 MBBR. This indicates that under identical aeration conditions, higher C/N ratios correspond to greater community richness, consistent with findings from Pan et al. [28]. Specifically, at C/N = 5.5, the high aeration MBBR's Chao index was 42 units higher than that of the low aeration MBBR; at C/N=4.5, the difference was 17; and at C/N=3.5, the indices were comparable between aeration MBBRs. These results demonstrate that as the C/N ratio decreases, the impact of aeration rate on community richness diminishes. This weakening effect may explain the observed reduction in aeration-induced differences in NO₃⁻-N removal efficiency at lower C/N ratios.
The Shannon index estimates microbial diversity within individual samples. As shown in Figure 4(c), the Shannon index of the high-aeration MBBRs followed the order CN5.5-1.0 > CN4.5-1.0 > CN3.5-1.0, indicating that microbial diversity increased with increasing C/N ratio under high aeration. Pairwise comparisons between the high- and low-aeration MBBRs at the same C/N ratio further showed that the Shannon index of the CN5.5-1.0 MBBR was 0.37 higher than that of the CN5.5-0.4 MBBR, while the CN4.5-1.0 MBBR exceeded the CN4.5-0.4 MBBR by 0.11. In contrast, the Shannon index of the CN3.5-1.0 MBBR was 0.07 lower than that of the CN3.5-0.4 MBBR. These results suggest that as the C/N ratio decreased, the difference in microbial diversity caused by aeration rate gradually narrowed, showing a trend similar to that observed for the Chao index.
The PCoA results in Figure 4(d) showed clear separation along PC1 between the CN0 MBBRs and the carbon-supplemented MBBRs, indicating that external carbon addition strongly shaped the microbial community structure.

3.3.2. Phylum-Level Community Analysis

The hierarchical clustering analysis (Bray-Curtis algorithm) of inter-sample community composition, combined with phylum-level community structure bar plots, generated the sample cluster dendrogram and bar chart shown in Figure 4(e).
The samples clustered into two groups, comprising the C/N = 5.5 MBBRs and the C/N ≤ 4.5 MBBRs, indicating distinct phylum-level community compositions between these tested conditions. Furthermore, the bar chart revealed that aeration had a more pronounced effect on the phylum-level community structure of the CN5.5-1.0 and CN5.5-0.4 MBBRs compared to other experimental MBBRs, which may be one of the reasons for the large difference in denitrification efficiency between the CN5.5-1.0 and CN5.5-0.4 reactors.
Analysis of phylum-level community structure across experimental MBBRs showed that Proteobacteria dominated absolutely, being one of the predominant phyla in mariculture [40], with relative abundances of 65.9%, 78.05%, 73.1%, 74.3%, 74.8%, and 72.3% in the CN5.5-1.0 to CN3.5-0.4 MBBRs, respectively. Bacteroidetes was the second most abundant, also representing a dominant group among marine bacterioplankton [41], with relative abundances of 19.9%, 18.6%, 18.9%, 22.0%, 18.9%, and 19.8% in the CN5.5-1.0 to CN3.5-0.4 MBBRs.
This microbial community structure demonstrates the successful cultivation of phylum-level microorganisms adapted to high salinity marine environments during the start-up experiment. Additionally, both Proteobacteria and Bacteroidetes are typical Gram-negative bacteria whose outer layers primarily consist of lipopolysaccharides [42], facilitating bacterial adhesion to K6 carrier surfaces. These phyla also play crucial roles in nitrogen and organic matter removal [43]. These microbial communities provide strong support for effective nitrogen and carbon removal in these MBBRs.

3.3.3. Genus-Level Dominant Bacterial Community Analysis

Statistical analysis methods were employed to examine the genus-level community structure across experimental MBBRs and evaluate the effects of C/N ratio and aeration rate on community composition. Genera with a relative abundance of ≥5% in an individual MBBR were defined as dominant genera [44], as illustrated in Figure 4(f).
Using a relative abundance threshold of ≥5% per sample to define dominant genera: at C/N = 5.5, the CN5.5-0.4 MBBR contained 6 dominant genera, compared with 4 in the CN5.5-1.0 MBBR; at C/N=4.5, the CN4.5-0.4 MBBR contained 7 dominant genera, compared with 6 in the CN4.5-1.0 MBBR; at C/N=3.5, the CN3.5-0.4 MBBR contained 5 dominant genera, compared with 7 in the CN3.5-1.0 MBBR. The CN4.5-0.4 MBBR contained the largest number of dominant genera, with seven genera exceeding 5% relative abundance.
Analysis of dominant nitrogen removing genera revealed Pseudomonas, Vitellibacter, and Paracoccus as the primary functional taxa. Pseudomonas was detected in all MBBRs and is widely recognized as an important denitrifying genus. It has been reported to exhibit heterotrophic nitrification–aerobic denitrification capability in various aquaculture and wastewater treatment systems, demonstrating strong environmental adaptability [45,46]. Vitellibacter is a common aerobic Gram-negative marine bacterium. Previous studies have shown that, as a halophilic genus, it is closely associated with nitrate removal processes and has been detected in various denitrification systems [47]. Paracoccus showed higher relative abundance in reactors operated at high C/N ratios and is a typical dominant denitrifying genus [48]. Its high abundance is closely related to enhanced nitrate removal efficiency; however, excessive enrichment may lead to incomplete denitrification and nitrite accumulation.
Their summed relative abundances were: CN5.5-1.0 (49.2%) > CN5.5-0.4 (48.1%) > CN4.5-0.4 (41.0%) > CN3.5-1.0 (32.5%) > CN4.5-1.0 (31.5%) > CN3.5-0.4 (26.3%). Key observations: at C/N = 5.5, aeration rate had minimal impact on nitrogen removing genera abundance; at C/N=4.5, the combined abundance under low aeration was 9.5 percentage points higher than that under high aeration; at C/N=3.5, the corresponding abundance under high aeration was 6.2 percentage points higher than that under low aeration. These findings demonstrate that the growth of nitrogen removing dominant genera is influenced by multiple factors including C/N ratio and aeration rate.

3.3.4. Functional Gene Profile and Nitrogen-Transformation Potential

The CN4.5-0.4 MBBR, which achieved the fastest start-up in this experiment, was selected for metagenomic sequencing to characterize its functional gene profile, as shown in Figure 5(a).
Excluding genes with unknown functions, relatively high proportions of annotated sequences (≥5%) were assigned to general function prediction, amino acid transport and metabolism, transcription, energy production and conversion, inorganic ion transport and metabolism, and replication, recombination, and repair. These categories described the overall functional composition of the CN4.5-0.4 biofilm, whereas specific nitrogen-transformation pathways were further evaluated using KEGG annotation.
Metagenomic annotation identified genes associated with several nitrogen-transformation pathways in the CN4.5-0.4 biofilm, including nitrification, denitrification, dissimilatory nitrate reduction to ammonium, assimilatory nitrate reduction, and anammox, as shown in Figure 5(b). Genes associated with denitrification were detected in the CN4.5-0.4 biofilm, indicating its genetic potential for nitrate and nitrite reduction under the aerobic bulk conditions maintained in the reactor. Figure 4(f) demonstrates that the CN5.5-1.0 and CN5.5-0.4 MBBRs maintained comparable abundances of dominant denitrifying genera under identical C/N ratios. The lower effluent NO₃⁻-N in the CN5.5-0.4 MBBR may be associated with oxygen-limited microenvironments under low aeration, which potentially favored both aerobic and anoxic denitrification. Additional pathways include: "Anammox" representing anaerobic NH₄⁺-N oxidation; "Dissimilatory NO₃⁻-N reduction" indicating the DNRA pathway (NO₃⁻-N→NH₄⁺-N) with associated enzymes and genes; and "Assimilatory NO₃⁻-N reduction" involving pathways and functional genes for NO₃⁻-N assimilation - a process where NO₃⁻-N is reduced to NH₄⁺-N for synthesis of nitrogenous organic compounds. These pathways represent distinct nitrogen-transformation processes rather than components of denitrification. The temporary increase in effluent NH₄⁺-N in the CN0-1.0 MBBR may have been associated with DNRA supported by residual molasses during the initial biofilm formation stage. The "Nitrification" pathway illustrates the conversion of NH₄⁺-N to NO₃⁻-N.
The nitrogen metabolism diagram identified genes associated with nitrification and denitrification in the CN4.5-0.4 MBBR, indicating the genetic potential for these nitrogen-transformation pathways and supporting the possible contribution of aerobic denitrification under aerobic conditions.

4. Conclusions

The study demonstrated that as the C/N ratio decreased, the removal rates of NH₄⁺-N and NO₃⁻-N showed a declining trend. However, at C/N = 5.5, incomplete denitrification within a short period resulted in effluent NO₂⁻-N exceeding 0.5 mg/L and prolonged start-up time, while no external carbon source made it difficult to achieve biofilm formation quickly. Reducing the aeration rate effectively alleviated the competition for electrons between O₂ and NO₂⁻-N during denitrification, thereby inhibiting NO₂⁻-N accumulation. Ultimately, the optimal start-up conditions were determined to be C/N=4.5 with an aeration rate of 0.4 L/min, which enabled rapid biofilm formation within 26 d, with effluent NH₄⁺-N and NO₂⁻-N stably maintained below 0.5 mg/L without NO₃⁻-N accumulation. The dominant nitrogen removing genera across all MBBRs were Pseudomonas, Vitellibacter, and Paracoccus. Notably, the CN4.5-0.4 MBBR enriched putative nitrogen-removing genera under high-salinity conditions. Metagenomic sequencing further identified genes associated with multiple nitrogen-transformation pathways in the CN4.5-0.4 MBBR and supported the potential contribution of aerobic denitrification. This study contributes to optimizing the operational efficiency and water quality management of seawater RAS and may help inform the further development of industrialized recirculating aquaculture technology.

Supplementary Materials

The following supporting information can be downloaded at the website of this paper posted on Preprints.org. Figure S1: Schematic diagram of the MBBR system.Figure S2: Changes in dissolved oxygen during the biofilm start-up period. (a) Dissolved oxygen at 0.4 L/min, (b) Dissolved oxygen at 1.0 L/min.

Author Contributions

Conceptualization, D.L.; methodology, X.W., F.Q. and D.L.; validation, X.W., W.Z., K.Y. and X.S.; formal analysis, X.W., F.Q. and W.Z.; investigation, X.W. and F.Q.; resources, Q.L.; data curation, X.W. and F.Q.; writing—original draft preparation, X.W. and F.Q.; writing—review and editing, J.G. and D.L.; visualization, X.W.; supervision, W.Z., Q.L. and X.S.; project administration, K.Y. and D.L.; funding acquisition, J.G. and D.L. All authors have read and agreed to the published version of the manuscript.

Funding

The research was financially supported by the Sannong Jiufang Research Project at Zhejiang Province (No. 2025SNJF013) and the National Key R&D Program of China (No. 2024YFD2400100).

Data Availability Statement

The data presented in this study are available from the corresponding author upon reasonable request.

Conflicts of Interest

The authors declare no conflicts of interest.

References

  1. Ropicki, A.; Garlock, T.; Farzad, R.; Hazell, J.E. Recirculating aquaculture system-based production as a pathway to increase aquaculture in developed countries: the case of United States aquaculture. Aquac. Econ. Manag. 2024, 28, 515–536. [Google Scholar] [CrossRef]
  2. Gupta, S.; Makridis, P.; Henry, I.; Velle-George, M.; Ribicic, D.; Bhatnagar, A.; Skalska-Tuomi, K.; Daneshvar, E.; Ciani, E.; Persson, D.; et al. Recent developments in recirculating aquaculture systems: a review. Aquac. Res. 2024, 2024, 6096671. [Google Scholar] [CrossRef]
  3. Sun, Y.; Fu, Z.; Ma, Z. The impact of acute ammonia nitrogen stress on serum biochemical indicators and spleen gene expression in juvenile yellowfin tuna (Thunnus albacares). Animals 2024, 14, 3090. [Google Scholar] [CrossRef] [PubMed]
  4. Gross, A.; Abutbul, S.; Zilberg, D. Acute and chronic effects of nitrite on white shrimp, Litopenaeus vannamei, cultured in low-salinity brackish water. J. World Aquac. Soc. 2004, 35, 315–321. [Google Scholar] [CrossRef]
  5. Torno, J.; Einwächter, V.; Schroeder, J.P.; Schulz, C. Nitrate has a low impact on performance parameters and health status of on-growing European sea bass (Dicentrarchus labrax) reared in RAS. Aquaculture 2018, 489, 21–27. [Google Scholar] [CrossRef]
  6. Preena, P.G.; Rejish Kumar, V.J.; Singh, I.S.B. Nitrification and denitrification in recirculating aquaculture systems: the processes and players. Rev. Aquac. 2021, 13, 2053–2075. [Google Scholar] [CrossRef]
  7. Standing Committee of the National People’s Congress of the People’s Republic of China. Fisheries Law of the People’s Republic of China (2025 Revision); National People’s Congress of the People’s Republic of China: Beijing, China, 2025; Available online: http://www.npc.gov.cn/npc/c2/c30834/202512/t20251227_450727.html (accessed on 14 August 2026).
  8. Bassin, J.P.; Kleerebezem, R.; Rosado, A.S.; van Loosdrecht, M.C.M.; Dezotti, M. Effect of different operational conditions on biofilm development, nitrification, and nitrifying microbial population in moving-bed biofilm reactors. Environ. Sci. Technol. 2012, 46, 1546–1555. [Google Scholar] [CrossRef] [PubMed]
  9. Madan, S.; Madan, R.; Hussain, A. Advancement in biological wastewater treatment using hybrid moving bed biofilm reactor (MBBR): a review. Appl. Water Sci. 2022, 12, 141. [Google Scholar] [CrossRef]
  10. Alitaleshi, F.; Daghbandan, A.; Pendashteh, A. Performance of rice husk biocarrier on ammonia nitrogen removal in the MBBR treating aquaculture wastewater using biological attached growth process: performance and kinetic study. J. Environ. Chem. Eng. 2024, 12, 111446. [Google Scholar] [CrossRef]
  11. Li, C.; Liang, J.; Lin, X.; Xu, H.; Tadda, M.A.; Lan, L.; Liu, D. Fast start-up strategies of MBBR for mariculture wastewater treatment. J. Environ. Manag. 2019, 248, 109267. [Google Scholar] [CrossRef] [PubMed]
  12. Tadda, M.A.; Altaf, R.; Gouda, M.; Rout, P.R.; Shitu, A.; Ye, Z.; Zhu, S.; Liu, D. Impact of Saddle-Chips biocarrier on treating mariculture wastewater by moving bed biofilm reactor (MBBR): mechanism and kinetic study. J. Environ. Chem. Eng. 2021, 9, 106710. [Google Scholar] [CrossRef]
  13. Xiang, Z.; Chen, X.; Bai, J.; Li, B.; Li, H.; Huang, X. Salt-tolerant heterotrophic nitrification and aerobic denitrification (HNAD) bacterium enhancing a pilot-scale moving bed biofilm reactor (MBBR) treating mariculture wastewater treatment with different COD/TN ratios. J. Water Process Eng. 2022, 50, 103278. [Google Scholar] [CrossRef]
  14. Xiang, Z.; Chen, X.; Li, H.; Zhu, B.; Chen, X.; Chen, T. A novel process based on marine heterotrophic nitrification and aerobic denitrification bacteria for treating mariculture wastewater: performance, biofilm characteristics and microbiome responses to dissolved oxygen. Aquaculture 2025, 595, 741498. [Google Scholar] [CrossRef]
  15. Hao, Z.L.; Ali, A.; Ren, Y.; Su, J.F.; Wang, Z. A mechanistic review on aerobic denitrification for nitrogen removal in water treatment. Sci. Total Environ. 2022, 847, 157452. [Google Scholar] [CrossRef] [PubMed]
  16. Chen, X.; Xiang, Z.; Huang, X.; Rong, H.; Bai, J.; Zhao, Y. Effect of C/N ratio on nitrogen removal of A/O-MBBR process for treating mariculture wastewater. J. Ocean Univ. China 2021, 20, 879–885. [Google Scholar] [CrossRef]
  17. Zhang, M.; Tan, Y.; Fan, Y.; Gao, J.; Liu, Y.; Lv, X.; Ge, L.; Wu, J. Nitrite accumulation, denitrification kinetic and microbial evolution in the partial denitrification process: the combined effects of carbon source and nitrate concentration. Bioresour. Technol. 2022, 361, 127604. [Google Scholar] [CrossRef] [PubMed]
  18. Zhang, M.; Lu, H.; Cai, L.; Sun, P.; Ma, B.; Li, J.; Chen, G.; Ruan, Y. C/N ratios inform sustainable aerobic denitrification for nitrogen pollution control: insights into the key parameter from a view of metabolic division. J. Clean. Prod. 2023, 414, 137565. [Google Scholar] [CrossRef]
  19. Navada, S.; Vadstein, O.; Gaumet, F.; Tveten, A.K.; Spanu, C.; Mikkelsen, Ø.; Kolarevic, J. Biofilms remember: osmotic stress priming as a microbial management strategy for improving salinity acclimation in nitrifying biofilms. Water Res. 2020, 176, 115732. [Google Scholar] [CrossRef] [PubMed]
  20. De Schryver, P.; Verstraete, W. Nitrogen removal from aquaculture pond water by heterotrophic nitrogen assimilation in lab-scale sequencing batch reactors. Bioresour. Technol. 2009, 100, 1162–1167. [Google Scholar] [CrossRef] [PubMed]
  21. Zeng, Z.; Wang, Y.; Zhu, W.; Xie, T.; Li, L. Effect of COD/NO₃⁻-N ratio on nitrite accumulation and microbial behavior in glucose-driven partial denitrification system. Heliyon 2023, 9, e14920. [Google Scholar] [CrossRef] [PubMed]
  22. Zhang, M.; Liu, J.; Wang, D.; Lu, M.; Fan, Y.; Ji, J.; Wu, J. Combined effects of carbon source and C/N ratio on the partial denitrification performance: nitrite accumulation, denitrification kinetic and microbial transition. J. Environ. Chem. Eng. 2024, 12, 113343. [Google Scholar] [CrossRef]
  23. Dauda, A.B.; Romano, N.; Ebrahimi, M.; Karim, M.; Natrah, I.; Kamarudin, M.S.; Ekasari, J. Different carbon sources affects biofloc volume, water quality and the survival and physiology of African catfish Clarias gariepinus fingerlings reared in an intensive biofloc technology system. Fish. Sci. 2017, 83, 1037–1048. [Google Scholar] [CrossRef]
  24. Chen, X.; Zhang, Q.; Zhu, Y.; Zhao, T. Response of wastewater treatment performance, microbial composition and functional genes to different C/N ratios and carrier types in MBBR inoculated with heterotrophic nitrification-aerobic denitrification bacteria. Bioresour. Technol. 2021, 336, 125339. [Google Scholar] [CrossRef] [PubMed]
  25. Pan, D.; Shao, S.; Zhong, J.; Wang, M.; Wu, X. Performance and mechanism of simultaneous nitrification–denitrification and denitrifying phosphorus removal in long-term moving bed biofilm reactor (MBBR). Bioresour. Technol. 2022, 348, 126726. [Google Scholar] [CrossRef] [PubMed]
  26. Zhang, Q.; Chen, W.; Yuan, C.; Liu, H.; Liang, S.; Tan, S. A novel pure biofilm system based on aerobic denitrification for nitrate wastewater treatment: exploring the feasibility of high total nitrogen removal under low-carbon condition. Chem. Eng. J. 2024, 480, 147978. [Google Scholar] [CrossRef]
  27. Chen, M.; Zhu, X.; Yan, D.; Teng, Y.; Zhang, G.; Li, Y.; Chen, Q.; Jiao, Y.; Xie, X.; Li, S. Effects of C/N ratio on performance, enzyme activity and microbial community in a bacteria-algal symbiotic MBBR for mariculture wastewater treatment. J. Environ. Chem. Eng. 2025, 13, 115820. [Google Scholar] [CrossRef]
  28. Pan, Z.; Zhou, J.; Lin, Z.; Wang, Y.; Zhao, P.; Zhou, J.; Liu, S.; He, X. Effects of COD/TN ratio on nitrogen removal efficiency, microbial community for high saline wastewater treatment based on heterotrophic nitrification-aerobic denitrification process. Bioresour. Technol. 2020, 301, 122726. [Google Scholar] [CrossRef] [PubMed]
  29. Deng, M.; Dai, Z.; Senbati, Y.; Li, L.; Song, K.; He, X. Aerobic denitrification microbial community and function in zero-discharge recirculating aquaculture system using a single biofloc-based suspended growth reactor: influence of the carbon-to-nitrogen ratio. Front. Microbiol. 2020, 11, 1760. [Google Scholar] [CrossRef] [PubMed]
  30. Chen, X.; Zhang, Q.; Zhu, Y.; Zhao, T. Response of rotating biological contactor started up by heterotrophic nitrification-aerobic denitrification bacteria to various C/N ratios. Chemosphere 2022, 291, 133048. [Google Scholar] [CrossRef] [PubMed]
  31. Qiu, M.; Liao, S.; Wang, B.; Zeng, J.; Fang, J.; Wang, A.; Ye, J. Effect of carbon source and C/N ratio on microbial community and function in ex situ biofloc system with inoculation of nitrifiers and aerobic denitrifying bacteria. Aquac. Res. 2021, 52, 4498–4511. [Google Scholar] [CrossRef]
  32. Song, C.G.; Zhao, C.K.; Wang, Q.Z.; Lu, S.; She, Z.; Zhao, Y.; Jin, C.; Guo, L.; Li, K.; Gao, M. Impact of carbon/nitrogen ratio on the performance and microbial community of sequencing batch biofilm reactor treating synthetic mariculture wastewater. J. Environ. Manag. 2021, 298, 113528. [Google Scholar] [CrossRef] [PubMed]
  33. Wang, Q.; Wu, S.; Chu, G.Y.; Zhang, Z.; She, Z.; Zhao, Y.; Guo, L.; Jin, C.; Gao, M. Metagenomic analysis and microbial activity shifts reveal the effect of the carbon/nitrogen ratio on the nitrogen removal performance of a moving bed biofilm reactor treating mariculture wastewater. J. Water Process Eng. 2023, 51, 103363. [Google Scholar] [CrossRef]
  34. Jia, Y.T.; Zhou, M.M.; Chen, Y.C.; Hu, Y.Y.; Luo, J. Insight into short-cut of simultaneous nitrification and denitrification process in moving bed biofilm reactor: effects of carbon to nitrogen ratio. Chem. Eng. J. 2020, 400, 125905. [Google Scholar] [CrossRef]
  35. Tao, T.; Chang, S. Simultaneous heterotrophic nitrification and aerobic denitrification of high C/N wastewater in a sequencing batch reactor. Water 2025, 17, 2515. [Google Scholar] [CrossRef]
  36. Peng, Z.; Lei, Y.; Zhan, Y.; Yang, B.; Pan, X. Impact of chemical oxygen demand/total nitrogen ratio on shifting autotrophic partial nitrification to heterotrophic nitrification and aerobic denitrification in high-strength ammonium wastewater treatment. Water 2024, 16, 2532. [Google Scholar] [CrossRef]
  37. Niavol, K.P.; Andaluri, G.; Achary, M.P.; Suri, R.P.S. How does carbon to nitrogen ratio and carrier type affect moving bed biofilm reactor (MBBR): performance evaluation and the fate of antibiotic resistance genes. J. Environ. Manag. 2025, 377, 124619. [Google Scholar] [CrossRef] [PubMed]
  38. Ghasemi, M.; Chang, S.; Sivaloganathan, S. Modeling and simulation study of simultaneous nitrification–denitrification in membrane aerated bioreactor. J. Membr. Sci. 2023, 668, 121210. [Google Scholar] [CrossRef]
  39. Janka, E.; Pathak, S.; Rasti, A.; Gyawali, S.; Wang, S. Simultaneous heterotrophic nitrification and aerobic denitrification of water after sludge dewatering in two sequential moving bed biofilm reactors (MBBR). Int. J. Environ. Res. Public Health 2022, 19, 1841. [Google Scholar] [CrossRef] [PubMed]
  40. Wang, C.X.; Ju, J.J.; Zhang, H.K.; Liu, P.; Song, Z.; Hu, X.; Zheng, Q. Exploring the variation of bacterial community and nitrogen transformation functional genes under the pressure of heavy metals in different coastal mariculture patterns. J. Environ. Manag. 2022, 324, 116365. [Google Scholar] [CrossRef] [PubMed]
  41. Zhang, M.J.; Jiang, R.T.; Zhang, J.L.; Li, K.; Zhang, J.; Shao, L.; He, W.; He, P. The impact of IMTA on the spatial and temporal distribution of the surface planktonic bacteria community in the surrounding sea area of Xiasanhengshan Island of the East China Sea. J. Mar. Sci. Eng. 2023, 11, 476. [Google Scholar] [CrossRef]
  42. Wang, Z.L.; Wu, Q.P.; Liao, G.W.; Fan, L. New insights into the regulation mechanism of Litopenaeus vannamei hepatopancreas after lipopolysaccharide challenge using transcriptome analyses. Fish. Shellfish Immunol. 2022, 128, 466–473. [Google Scholar] [CrossRef] [PubMed]
  43. Wu, H.; Yang, T.Y.; Zhang, M.Y.; Li, A.; Huang, D.; Xing, Z. Effect of HRT on nitrogen removal from low carbon source wastewater enhanced by slurry and its mechanism. Chem. Eng. J. 2023, 477, 147159. [Google Scholar] [CrossRef]
  44. Fan, L.F.; Wang, Z.L.; Chen, M.S.; Qu, Y.; Li, J.; Zhou, A.; Xie, S.; Zeng, F.; Zou, J. Microbiota comparison of Pacific white shrimp intestine and sediment at freshwater and marine cultured environment. Sci. Total Environ. 2019, 657, 1194–1204. [Google Scholar] [CrossRef] [PubMed]
  45. Hu, Y.Q.; Zeng, Y.X.; Du, Y.; Zhao, W.; Li, H.R.; Han, W.; Hu, T.; Luo, W. Comparative genomic analysis of two Arctic Pseudomonas strains reveals insights into the aerobic denitrification in cold environments. BMC Genom. 2023, 24, 534. [Google Scholar] [CrossRef] [PubMed]
  46. Gao, Y.; Zhu, J.; Wang, K.; Ma, Y.; Fang, J.; Liu, G. Discovery of a heterotrophic aerobic denitrification Pseudomonas sp. G16 and its unconventional nitrogen metabolic pathway. Bioresour. Technol. 2023, 387, 129670. [Google Scholar] [CrossRef] [PubMed]
  47. Li, Z.R.; Zhang, X.N.; Wang, H.C.; Cheng, H.Y.; Wang, A.J.; Zhang, Y.Q.; Cui, C.W.; Sun, Y.L. Effects of salinity on sulfur-dominated autotrophic denitrification microorganisms: microbial community succession, key microorganisms and response mechanisms. Chem. Eng. J. 2023, 478, 147308. [Google Scholar] [CrossRef]
  48. Huan, C.; Lyu, Q.; Wang, Z.; Tian, X.; Yan, Z.; Ji, G. Conversion behavior of heterotrophic nitrification–aerobic denitrification bacterium Paracoccus denitrificans HY-1 in nitrogen and phosphorus removal. J. Water Process Eng. 2024, 62, 105347. [Google Scholar] [CrossRef]
Figure 1. Influence of C/N ratio on NH₄⁺-N removal, NO₃⁻-N removal, and effluent NO₂⁻-N Figure 1 Influence of C/N ratio on NH₄⁺-N removal, NO₃⁻-N removal, and effluent NO₂⁻-N concentration. (a) NH₄⁺-N removal efficiency at 0.4 L/min, (b) NH₄⁺-N removal efficiency at 1.0 L/min, (c) NO₃⁻-N removal efficiency at 0.4 L/min, (d) NO₃⁻-N removal efficiency at 1.0 L/min, (e) effluent NO₂⁻-N concentration at 0.4 L/min, (f) effluent NO₂⁻-N concentration at 1.0 L/min.
Preprints 230383 g001
Figure 2. Influence of C/N ratio and aeration rate on DOC removal efficiency. (a) DOC removal efficiency at 0.4 L/min, (b) DOC removal efficiency at 1.0 L/min, (c) DOC removal efficiency at C/N = 0, (d) DOC removal efficiency at C/N = 5.5, (e) DOC removal efficiency at C/N = 4.5, (f) DOC removal efficiency at C/N = 3.5.
Preprints 230383 g002
Figure 3. Influence of aeration rate on NH₄⁺-N removal, NO₃⁻-N removal, and effluent NO₂⁻-N concentration. (a) NH₄⁺-N removal efficiency at C/N = 0, (b) NH₄⁺-N removal efficiency at C/N = 5.5, (c) NH₄⁺-N removal efficiency at C/N = 4.5, (d) NH₄⁺-N removal efficiency at C/N = 3.5, (e) NO₃⁻-N removal efficiency at C/N = 0, (f) NO₃⁻-N removal efficiency at C/N = 5.5, (g) NO₃⁻-N removal efficiency at C/N = 4.5, (h) NO₃⁻-N removal efficiency at C/N = 3.5, (i) effluent NO₂⁻-N concentration at C/N = 0, (j) effluent NO₂⁻-N concentration at C/N = 5.5, (k) effluent NO₂⁻-N concentration at C/N = 4.5, (l) effluent NO₂⁻-N concentration at C/N = 3.5.
Preprints 230383 g003
Figure 4. Microbial diversity analysis. (a) Venn diagram showing unique and shared ASVs among different samples, (b) Comparison of Chao index among different samples, (c) Comparison of Shannon index among different samples, (d) PCoA analysis based on Bray-Curtis distance, (e) Analysis of dominant bacterial communities at phylum level, (f) Analysis of dominant bacterial communities at genus level.
Preprints 230383 g004
Figure 5. (a) Gene functional abundance of the CN4.5-0.4 MBBR, (b) Mechanism of nitrogen metabolism in the CN4.5-0.4 MBBR.
Preprints 230383 g005
Table 1. Parameters of MBBR start-up experiment.
CN0-1.0 CN0-0.4 CN5.5-1.0 CN5.5-0.4 CN4.5-1.0 CN4.5-0.4 CN3.5-1.0 CN3.5-0.4
C/N 0 0 5.5 5.5 4.5 4.5 3.5 3.5
aeration rate(L/min) 1.0 0.4 1.0 0.4 1.0 0.4 1.0 0.4
Table 2. Comparison of Optimal C/N Ratios and Nitrogen Removal Performance in Recent Biofilm Reactors.
Reactor Influent N Temp. Key functional bacteria C/N tested Opt. C/N Performance at optimum C/N Reference
MBBR 600 mg NH₄⁺-N/L 25 ± 2 ℃ Paracoccus, Acinetobacter Corynebacterium 15, 10, 8, 6, 4, 1 10 NH₄⁺–N removal: 96.03%; TN removal: 83.96% [24]
MBBR 4.7 mg NH₄⁺-N/L, 0.6 mg NO₃⁻-N/L, 4.9 mg NO2⁻-N/L Zobellella B307, Paracoccus, Azoarcus 16, 12, 8, 4 16 NH₄⁺–N removal: 94.4%; NO₃⁻–N removal: 85.7% [13]
MBBR 20 mg NH₄⁺-N/L, 12 mg NO₃⁻-N/L Room temp. Proteobacteria, Acidobacteria, Nitrospirae 20, 15, 10, 5, 2 5 NH₄⁺–N removal: 99.60%; NO₃⁻–N removal: 63.58%; TN removal: 78.94% [25]
MBBR 90-110 mg NO₃⁻-N/L 25–28 ℃ Thauera, Azoarcus, Paracoccus 10, 8, 6, 4, 2, 1 4 TN removal rate: 10.02 mg/(L·h) [26]
BAS-MBBR 3.00 mg NH₄⁺-N/L, 7.00 mg NO₃⁻-N/L, 0.51 mg NO₂⁻-N/L Thauera, Paracoccus, Azoarcus 12, 9, 6, 3 9 NH₄⁺–N removal: 97.22% [27]
SBBR 100 mg NH₄⁺–N/L 30 ± 2 ℃ Pseudomonas, Bacillus, Paracoccus 35, 30, 25, 20, 15, 10 25 NH₄⁺–N removal: 99.54%; TN removal: 99.13% [28]
SGR 3.9 mg TAN/L, 0.5 mg NO₂⁻–N/L, 3.6 mg NO₃⁻–N/L 30 ± 0.2 ℃ Dechloromonas, Rhodobacter, Flavobacterium 20, 15 20 NO₂⁻–N removal: 100%; NO₃⁻–N removal: 83.3% [29]
RBC 500 mg NH₄⁺–N/L 25 ± 2 ℃ Alcaligenes, Cupriavidus sp. SWA1, Acinetobacter sp. TAC-1 15, 10, 8, 6, 4, 1 15 NH₄⁺–N removal: 99.57%; TN removal: 68.41% [30]
BFT 3.40 mg NH₄⁺–N/L; 1.02 mg NO₂⁻–N/L; 2.58 mg NO₃⁻–N/L 24 ℃ Pseudomonas stutzeri, Paracoccus sarotiniacens 12, 9, 6.17 12 TN removal: 88.60% [31]
SBBR 3.14 mg NH₄⁺–N/L; 7.08 mg NO₃⁻–N/L; 0.51 mg NO₂⁻–N/L Thauera, Denitratisoma, Pseudomonas 6, 5, 4, 3 6 NH₄⁺–N removal: 91.5% [32]
MBBR 3.55 mg NH₄⁺–N/L; 7.48 mg NO₃⁻–N/L; 0.99 mg NO₂⁻–N/L Thauera, Azoarcus, Pseudomonas 6, 5, 4, 3 6 Mean NH₄⁺–N removal: ~87.15% [33]
MBBR 100 mg NH₄⁺–N/L Stenotrophomonas maltophilia, Thauera, Paracoccus 7.5, 5.6, 3.7 7.5 NH₄⁺–N removal: 99.54%; TN removal: 94.43% [34]
SBR 49 mg NH₄⁺–N/L 19–23 ℃ Pseudomonas, Acinetobacter 17.1, 8.6 17.1 NH₄⁺–N removal: ~100%; TN removal: ~95% [35]
SBR 500 mg NH₄⁺–N/L 26 ± 1 ℃ Thauera, Pseudomonas, Flavobacterium 4, 2, 1, 0.5, 0 4 TN removal: 75.4 ± 8.1% [36]
MBBR 20–60 mg NH₄⁺–N/L 20 ± 1 ℃ Chryseobacterium, Elstera, Flavobacterium 20, 10, 7 20 NH₄⁺–N removal: ~67–70% [37]
Disclaimer/Publisher’s Note: The statements, opinions and data contained in all publications are solely those of the individual author(s) and contributor(s) and not of MDPI and/or the editor(s). MDPI and/or the editor(s) disclaim responsibility for any injury to people or property resulting from any ideas, methods, instructions or products referred to in the content.
Copyright: This open access article is published under a Creative Commons CC BY 4.0 license, which permit the free download, distribution, and reuse, provided that the author and preprint are cited in any reuse.