
Submitted:
25 August 2026
Posted:
27 August 2026
You are already at the latest version
Abstract
Environmental DNA (eDNA) metabarcoding is a valuable, non-invasive approach for assessing fish biodiversity in freshwater ecosystems. This study characterized fish-associated diversity across four freshwater locations in Indiana, including upstream and downstream sites of the White River, Shadyside Lake, and Trail Creek, and examined contemporary White River fish communities in the context of recovery following the historical 1999 chemical spill. Water samples were analyzed using high-throughput sequencing targeting the mitochondrial 12S rRNA gene, and fish-associated exact sequence variants (ESVs) were evaluated using richness, diversity, and community composition analyses. A total of 87 unique fish-associated ESVs were detected. White River downstream exhibited the highest ESV richness (60), followed by White River upstream (27), Shadyside Lake (22), and Trail Creek (7), and also had the highest Shannon diversity (H′ = 2.30). Community analyses revealed substantial overlap between the two White River sites and greater similarity between them than with Shadyside Lake or Trail Creek. The relatively high richness and diversity detected downstream are consistent with previous biological assessments documenting substantial recovery of White River fish communities following the 1999 spill. Overall, these findings support eDNA metabarcoding as a useful complement to conventional fish monitoring for assessing freshwater biodiversity and long-term ecological change.
Keywords:
environmental DNA (eDNA)
; metabarcoding
; fish diversity
; freshwater ecosystems
; White River
; biodiversity monitoring
; conservation
; Indiana
1. Introduction
Freshwater ecosystems support substantial biodiversity and provide important ecological, economic, and recreational benefits. Fish communities are widely recognized as indicators of aquatic ecosystem health because they respond to environmental disturbances, habitat degradation, and changes in water quality [1,2,3]. Consequently, accurate assessment of fish diversity is essential for biodiversity conservation, fisheries management, and long-term ecological monitoring.
Traditional fish survey methods, including electrofishing, netting, and visual observations, have been widely used to evaluate fish community composition. Although effective, these approaches can be labor-intensive, invasive, and may underestimate rare or low-abundance species. Environmental DNA (eDNA) metabarcoding has emerged as a powerful alternative for aquatic biodiversity monitoring [4,5,6,7]. Environmental DNA consists of genetic material released into aquatic environments through mucus, scales, feces, reproductive products, and decomposing tissues. By collecting and analyzing water samples, researchers can detect organisms without direct capture or observation [5,6]. Numerous studies have demonstrated that eDNA metabarcoding provides sensitive and efficient assessment of fish community diversity across a wide range of aquatic habitats [4,7,8,9,10].
Recent applications of eDNA metabarcoding have successfully characterized fish communities in rivers, lakes, estuaries, and marine ecosystems throughout the world [1,8,9,10,11,12]. These studies have demonstrated the ability of eDNA approaches to detect spatial variation in fish diversity, monitor biodiversity, identify rare species, and assess community composition across environmental gradients [9,10,11,12]. The combination of high-throughput sequencing and eDNA analysis allows rapid assessment of aquatic communities while minimizing disturbance to natural habitats.
The White River in Indiana has experienced substantial anthropogenic impacts during the past several decades. A major chemical spill near Anderson, Indiana resulted in extensive fish mortality and raised concerns regarding long-term ecological consequences for aquatic communities [13]. Since that event, habitat restoration efforts and improvements in environmental management have contributed to recovery of portions of the watershed. Subsequent fish community surveys documented improvements in biological integrity and fish diversity throughout sections of the White River [14]. However, molecular assessments of current fish community diversity within the watershed remain limited.
Environmental DNA (eDNA) metabarcoding provides an opportunity to evaluate contemporary fish community composition and compare diversity patterns among freshwater habitats. Previous studies have demonstrated that eDNA can effectively estimate fish alpha and beta diversity and characterize spatial variation in fish communities [15,16]. Although the White River watershed was the primary focus of this study because of its history of environmental disturbance and recovery, comparisons with ecologically distinct freshwater systems provide broader context for interpreting fish community structure. Therefore, Shadyside Lake and Trail Creek were included to represent freshwater habitats with contrasting hydrological characteristics. Shadyside Lake represents a lentic habitat within the White River watershed, whereas Trail Creek is an independent stream that drains directly into Lake Michigan. Including Trail Creek enabled comparison of fish diversity between the White River watershed and a hydrologically distinct freshwater ecosystem, allowing us to determine whether observed diversity patterns were unique to the White River or reflected broader freshwater biodiversity patterns.
The objectives of this study were to (1) characterize fish diversity in the White River, Shadyside Lake, and Trail Creek using environmental DNA (eDNA) metabarcoding; (2) compare fish community composition among representative freshwater habitats in Indiana; (3) evaluate differences between upstream and downstream sites within the White River watershed; and (4) assess long-term fish community recovery downstream of the historical 1999 chemical spill. We hypothesized that fish community composition would differ among habitats because of differences in hydrology and habitat characteristics, and that the upstream and downstream White River communities would exhibit substantial similarity and shared diversity, reflecting long-term recovery of the aquatic ecosystem.
2. Materials and Methods
2.1. Study Sites and Water Sample Collection
Environmental DNA (eDNA) samples were collected from four freshwater sites in central Indiana, USA, including White River upstream (WR UP), White River downstream (WR DN), Shadyside Lake (SS Lake), and Trail Creek. The White River sites were selected to represent locations upstream and downstream of the historical 1999 chemical spill [13,14]. Shadyside Lake was included as a representative lentic habitat within the study region. Trail Creek, which drains directly into Lake Michigan and lies outside the White River watershed, was selected as an independent freshwater stream for comparison. Including this site allowed evaluation of whether fish diversity patterns observed within the White River watershed were specific to that watershed or differed from those of a hydrologically distinct freshwater ecosystem.
At each site, water was collected from three separate points to account for local spatial variation in eDNA distribution. The three water collections from each site were combined during filtration to generate a composite sample representing the fish community at that location.
Water samples (200 mL per collection point) were collected using sterile syringes provided by Jonah Ventures (Boulder, CO, USA) according to the manufacturer’s protocols. Geographic coordinates were recorded for each sampling location and are shown in Figure 1. Water samples were filtered using the Aquatic eDNA Kit (Fish + Phytoplankton; Jonah Ventures, Boulder, CO, USA), which utilizes an enclosed membrane filtration system. Filters were preserved in the manufacturer’s lysis buffer and stored at −20 °C until DNA extraction.
2.2. DNA Extraction, Sequencing, and Taxonomic Assignment
DNA extraction was performed using the silica-column protocol provided in the Aquatic eDNA Kit. Extracted DNA samples were submitted to Jonah Ventures (Boulder, CO, USA) for library preparation, high-throughput sequencing, and bioinformatics analysis. Fish communities were characterized using the MiFish universal primer set targeting a portion of the mitochondrial 12S rRNA gene [17]. Sequencing was performed on an Illumina MiSeq platform.
Raw sequence reads were processed using the Jonah Ventures bioinformatics pipeline, which included quality filtering (Q > 30), dereplication, chimera removal, and taxonomic assignment. Representative sequences were compared against reference databases using BLAST. Taxonomic assignments were accepted when sequence identity was ≥95% and sequence length exceeded 100 bp. Fish-associated exact sequence variants (ESVs) were retained for subsequent analyses.
2.3. Diversity and Community Analyses
Fish-associated ESV richness was calculated as the total number of fish ESVs identified per site. Shannon diversity indices were calculated using the vegan package in R (version 4.0) to evaluate fish community diversity.
Species presence–absence data were used to assess community composition among sites. Shared and unique species between White River upstream and downstream locations were visualized using Venn diagrams. Bray–Curtis dissimilarity analysis and community ordination were used to evaluate differences in fish assemblage composition among habitats. Heatmaps were generated to visualize dominant fish taxa detected across sites.
2.4. Statistical Analysis
Descriptive statistics were used to summarize species richness, ESV richness, and diversity indices. Fish species richness and diversity metrics were compared among sites using Microsoft Excel and R software. Due to the limited number of sampling locations, analyses focused primarily on descriptive comparisons of fish community composition rather than formal hypothesis testing.
3. Results
3.1. Fish-Associated ESV Richness and Diversity
Environmental DNA metabarcoding detected 87 unique fish-associated exact sequence variants (ESVs) across the four freshwater sampling locations. Site-level ESV richness differed among sampling locations (Table 1; Figure 2). White River downstream (WR DN) had the highest ESV richness, with 60 fish-associated ESVs detected, followed by White River upstream (WR UP) with 27 ESVs, Shadyside Lake (SS Lake) with 22 ESVs, and Trail Creek with 7 ESVs. Because some ESVs occurred at more than one sampling location, the sum of site-level ESV richness values exceeds the total number of unique ESVs detected across the complete dataset. ESV, exact sequence variant. ESV richness represents the number of fish-associated ESVs detected at each sampling location.
Diversity indices showed a pattern consistent with differences in ESV richness (Table 1; Figure 3). WR DN had the highest Shannon diversity (H′ = 2.30), followed by WR UP (H′ = 2.00), SS Lake (H′ = 1.46), and Trail Creek (H′ = 0.96). Simpson diversity was also highest at WR DN (0.731) and lowest at Trail Creek (0.418), with intermediate values at WR UP (0.709) and SS Lake (0.648). Thus, among the four composite samples analyzed, WR DN exhibited the highest fish-associated ESV richness and diversity.
3.2. Shared and Site-Specific Fish Taxa in the White River
Comparison of taxonomically assigned fish detections between WR UP and WR DN revealed both shared and site-specific taxa (Figure 4). A total of 20 fish taxa were detected at both White River locations, whereas five were detected only at WR UP and 39 were detected only at WR DN. The greater number of downstream-specific detections was consistent with the higher richness observed at WR DN.
These results demonstrate substantial overlap between the upstream and downstream White River assemblages while also revealing a greater number of taxonomic detections at the downstream site.
3.3. Taxonomic Composition of Fish Communities
The heatmap of dominant fish-associated detections showed differences in taxonomic composition among the four sampling locations (Figure 5). Several taxa were detected at multiple sites, whereas others exhibited more restricted distributions. The two White River locations contained a broader range of fish-associated detections than Trail Creek, whereas Shadyside Lake exhibited an intermediate pattern.
Sequence-read representation also varied among detected ESVs and sampling locations. WR DN contained a comparatively broad distribution of reads among multiple fish-associated ESVs, consistent with its higher Shannon diversity. In contrast, the Trail Creek sample contained fewer ESVs, with sequencing reads concentrated among a smaller number of detected variants. Shadyside Lake showed an intermediate pattern relative to the White River and Trail Creek samples.
3.4. Community Dissimilarity and Ordination
Bray–Curtis dissimilarity analysis revealed differences in fish-associated eDNA composition among the four sampling locations (Figure 6). The WR UP and WR DN samples showed greater similarity to one another than either showed to SS Lake or Trail Creek. SS Lake and Trail Creek exhibited more distinct sequence-composition profiles relative to the White River samples.
Ordination based on Bray–Curtis dissimilarity further visualized differences among the four sampling locations (Figure 7). The WR UP and WR DN samples were positioned more closely to one another than to SS Lake or Trail Creek, whereas the latter samples occupied distinct positions in ordination space (Figure 7).
4. Discussion
Environmental DNA (eDNA) metabarcoding has become an increasingly valuable approach for monitoring aquatic biodiversity and characterizing fish communities across diverse aquatic ecosystems [18,19,20].In the present study, eDNA metabarcoding detected 87 unique fish-associated exact sequence variants (ESVs) across four freshwater sampling locations in Indiana. Differences in ESV richness, diversity indices, and taxonomic composition were observed among the four locations, demonstrating the utility of eDNA for characterizing spatial variation in fish-associated molecular diversity across contrasting freshwater environments.
The downstream White River site (WR DN) exhibited the highest fish-associated ESV richness and diversity among the four sampling locations. A total of 60 ESVs were detected at WR DN, compared with 27 at White River upstream (WR UP), 22 at Shadyside Lake (SS Lake), and 7 at Trail Creek. Shannon diversity followed a similar pattern, with the highest value at WR DN (H′ = 2.30), followed by WR UP (H′ = 2.00), SS Lake (H′ = 1.46), and Trail Creek (H′ = 0.96). Previous eDNA studies have demonstrated that fish assemblages can vary substantially among freshwater environments as a function of habitat heterogeneity, connectivity, hydrology, and other local environmental characteristics [1,3,11,12,15]. The comparatively high diversity detected at WR DN may therefore reflect characteristics of the downstream river environment; however, because the present study included a single composite sample from each location, the relative contributions of habitat characteristics and site-specific factors cannot be distinguished.
Comparison of the two White River locations revealed substantial overlap as well as site-specific taxonomic detections. Twenty fish taxa were detected at both WR UP and WR DN, whereas five were detected only at WR UP and 39 only at WR DN. Bray–Curtis dissimilarity and ordination analyses similarly showed that the two White River samples were more similar to one another than either was to SS Lake or Trail Creek. This pattern is consistent with the shared hydrological setting of the two White River locations while also indicating spatial variation in fish-associated eDNA composition within the river system [20,21]. Because eDNA can be transported downstream and the present study represents a single sampling period, these patterns should be interpreted as differences in detected eDNA assemblages rather than definitive measures of local fish population structure.
Trail Creek was included as a hydrologically independent freshwater comparison rather than as a component of the White River recovery assessment. Unlike the White River sites, Trail Creek drains directly into Lake Michigan and lies outside the White River watershed. Trail Creek exhibited the lowest ESV richness and diversity and a distinct community profile in the Bray–Curtis and ordination analyses. These differences demonstrate that the eDNA approach was able to distinguish fish-associated sequence assemblages among hydrologically distinct freshwater systems. However, because only one composite sample was analyzed from each location, the observed differences should not be generalized as characteristic differences among habitat types without additional spatial and temporal replication.
One of the most noteworthy observations was the relatively high fish-associated diversity detected downstream of the area affected by the historical 1999 White River chemical spill. The spill caused extensive fish mortality and raised concerns regarding long-term ecological effects within the watershed [13]. Subsequent biological assessments documented improvements in fish community condition and aquatic habitat quality in portions of the White River [14,25]. The White River Mainstem Project subsequently documented 94 fish species across 405 river miles and generally favorable Index of Biotic Integrity (IBI) scores, providing independent evidence of substantial recovery of fish communities within much of the river system [14]. The relatively high ESV richness and diversity observed at WR DN in the present study are consistent with these previous assessments. Nevertheless, because comparable eDNA data from before or immediately following the spill are unavailable, the present study cannot directly quantify recovery or attribute current community patterns to recovery from the spill. Rather, the eDNA results provide a contemporary molecular snapshot that complements previous conventional biological assessments of the White River.
Two taxa of particular interest, Catostomus commersonii (white sucker) and Hypentelium nigricans (northern hog sucker), were detected at WR UP but not in the WR DN composite sample. Both taxa have ecological associations that can make their occurrence informative in assessments of stream condition [24]. However, nondetection by eDNA should not be interpreted as confirmation of biological absence. Differences in local habitat conditions, spatial distribution of fish, eDNA production and transport, DNA degradation, and sampling variability can all affect detection. Consequently, the upstream-only detections observed here cannot be attributed to persistent effects of the historical spill. Replicated sampling across seasons and multiple upstream and downstream locations would be necessary to determine whether these patterns are persistent.
Differences in taxonomic composition were also apparent between Shadyside Lake and the riverine sampling locations. Taxa including Micropterus salmoides (largemouth bass), Lepomis macrochirus (bluegill), Lepomis cyanellus (green sunfish), and Ambloplites rupestris (rock bass) were detected prominently in the Shadyside Lake sample, consistent with fish assemblages commonly associated with lentic environments. In contrast, several sucker, shiner, and darter taxa were detected in the river samples. These observations illustrate the capacity of eDNA metabarcoding to characterize differences in fish-associated taxonomic composition across contrasting freshwater environments. Because sequence-read counts do not directly represent fish abundance, however, differences in read representation should not be interpreted as quantitative differences in population size.
Environmental DNA metabarcoding offers several advantages as a complement to conventional fish survey methods. Because eDNA analysis detects genetic material released into the aquatic environment, taxa can be identified without direct capture, reducing disturbance while allowing relatively rapid biodiversity assessment [6,22]. eDNA approaches may also improve detection of taxa that are difficult to capture using conventional methods [4,7,23]. Comparison with historical White River fish surveys showed that the genera detected in the present study were generally represented in previous conventional surveys, and no additional genera were identified by eDNA. Thus, rather than revealing previously undocumented genera, the present analysis largely corroborated existing knowledge of regional fish diversity while demonstrating the feasibility of eDNA metabarcoding as a complementary, non-invasive monitoring approach.
Several limitations should be considered when interpreting these findings. First, the three spatial water collections obtained at each site were pooled during filtration, resulting in a single composite eDNA sample for each location rather than independent biological replicates. Consequently, the study provides descriptive and exploratory comparisons rather than replicated statistical tests of differences among locations or habitat types. Second, eDNA detection provides evidence of genetic material in the sampled water but does not directly establish local organism abundance, biomass, age structure, reproductive success, or population size [22,23]. Jonah Ventures’ documentation likewise notes that metabarcoding sequence-read counts do not directly correspond to the original concentration of eDNA in environmental samples. Detection and taxonomic assignment may also be influenced by eDNA transport and degradation, sequencing depth, amplification biases, and reference-database completeness. Finally, sampling was limited spatially and temporally. Future studies incorporating replicated samples, additional upstream and downstream locations, seasonal sampling, and repeated surveys across years would provide a stronger basis for evaluating temporal dynamics and long-term ecological recovery within the White River watershed.
5. Conclusions
Environmental DNA (eDNA) metabarcoding successfully characterized fish-associated molecular diversity across four freshwater sampling locations in Indiana, detecting 87 unique fish-associated ESVs. Among the four composite samples, the downstream White River site exhibited the highest ESV richness and diversity, while the upstream and downstream White River samples showed greater similarity to each other than to Shadyside Lake or the hydrologically independent Trail Creek. The relatively high diversity detected downstream is consistent with previous conventional biological assessments documenting substantial recovery of White River fish communities following the 1999 chemical spill, although the absence of historical eDNA data and limited spatial and temporal replication preclude direct attribution of the observed patterns to ecological recovery. Overall, these findings demonstrate the value of eDNA metabarcoding as a non-invasive complement to conventional fish monitoring for characterizing freshwater fish biodiversity and community composition and provide a contemporary molecular assessment that can support future long-term monitoring of ecological change in the White River and other freshwater ecosystems
Author Contributions
Conceptualization, Renfang Taylor; methodology, Ethan Poorbaugh, Scott Carr, Haaven Rentfro; investigation, Ethan Poorbaugh, Scott Carr, Haaven Rentfro, Renfang Taylor; Writing—review and editing, Ethan Poorbaugh, Scott Carr, Haaven Rentfro, and Renfang Taylor. All authors have read and agreed to the published version of the manuscript.
Funding
This research received no external funding.
Acknowledgments
We acknowledge the Women Philanthropy Council of Anderson University for supporting the materials of eDNA kits. The authors sincerely thank Jay E. Taylor and Ernest N. Taylor for their assistance with field sampling, sample preparation, and sample labeling. Their contributions and support were greatly appreciated throughout this project. During the preparation of this manuscript/study, the author(s) used ChatGPT4.0 for the purposes of English grammars checking. The authors have reviewed and edited the output and take full responsibility for the content of this publication.”.
Conflicts of Interest
The authors declare no conflicts of interest.
Abbreviations
The following abbreviations are used in this manuscript:
| WR UP | White River upstream |
| WR DN | White River down stream |
| SS Lake | Shady Side Lake |
| eDNA | Environmental DNA |
References
- Van Driessche, C.; Everts, T.; Neyrinck, S.; Halfmaerten, D.; Haegeman, A.; Ruttink, T.; Bonte, D.; Brys, R. Using environmental DNA metabarcoding to monitor fish communities in small rivers and large brooks: Insights on the spatial scale of information. Environ. Res. 2023, 228, 115857. [Google Scholar] [CrossRef]
- Li, S.; Huang, Y.; Li, F.; Liu, Y.; Ma, H.; Zhang, X.; Wang, X.; Chen, W.; Cui, G.; Wang, T. Functional alpha and beta diversity of fish communities and their relationship with environmental factors in the Huanghe River (Yellow River) Estuary and adjacent seas, China. Fishes 2024, 9, 222. [Google Scholar] [CrossRef]
- Beridze, T.; Japoshvili, B.; Edisherashvili, T.; Anderson, C.; Mumladze, L. Fish diversity assessed by eDNA detection methods in the Rioni River. Metabarcoding Metagenom 2023, 7, 247–262. [Google Scholar] [CrossRef]
- Deiner, K.; Bik, H.M.; Mächler, E.; Seymour, M.; Lacoursière-Roussel, A.; Altermatt, F.; Creer, S.; Bista, I.; Lodge, D.M.; de Vere, N.; Pfrender, M.E.; Bernatchez, L. Environmental DNA metabarcoding: Transforming how we survey animal and plant communities. Mol. Ecol. 2017, 26, 5872–5895. [Google Scholar] [CrossRef] [PubMed]
- Ficetola, G.F.; Miaud, C.; Pompanon, F.; Taberlet, P. Species detection using environmental DNA from water samples. Biol. Lett. 2008, 4, 423–425. [Google Scholar] [CrossRef] [PubMed]
- Barnes, M.A.; Turner, C.R. The ecology of environmental DNA and implications for conservation genetics. Conserv. Genet. 2016, 17, 1–17. [Google Scholar] [CrossRef]
- Ruppert, K.M.; Kline, R.J.; Rahman, M.S. Past, present, and future perspectives of environmental DNA (eDNA) metabarcoding: A systematic review in methods, monitoring, and applications of global eDNA. Glob. Ecol. Conserv. 2019, 17, e00547. [Google Scholar] [CrossRef]
- Tsuji, S.; Inui, R.; Nakao, R.; Miyazono, S.; Saito, M.; Kono, T.; Akamatsu, Y. Quantitative environmental DNA metabarcoding shows high potential as a novel approach to quantitatively assess fish community. Sci. Rep. 2022, 12, 21524. [Google Scholar] [CrossRef] [PubMed]
- Sales, N.G.; Wangensteen, O.S.; Carvalho, D.C.; Deiner, K.; Præbel, K.; Coscia, I.; McDevitt, A.D.; Mariani, S. Space-time dynamics in monitoring neotropical fish communities using eDNA metabarcoding. Sci. Total Environ. 2021, 754, 142096. [Google Scholar] [CrossRef] [PubMed]
- Seymour, M.; Edwards, F.K.; Cosby, B.J.; Kelly, M.G.; de Bruyn, M.; Carvalho, G.R.; Creer, S. Executing multi-taxa eDNA ecological assessment via traditional metrics and interactive networks. Sci. Total Environ. 2020, 729, 138801. [Google Scholar] [CrossRef] [PubMed]
- Shen, Y.; Zhou, X.; Zhang, Y.; Zhang, J.; Li, Q.; Chen, Q.; Liu, Z.; Li, Y.; Cheng, R.; Luo, Y. Important fish diversity maintenance status of the tributaries in a hotspot fish conservation area in the upper Yangtze River revealed by eDNA metabarcoding. Sci. Rep. 2024, 14, 24128. [Google Scholar] [CrossRef] [PubMed]
- Deng, J.; Zhang, X.; Yao, X.; Rao, J.; Dai, F.; Wang, H.; Wang, Y.; Jiang, W. eDNA metabarcoding reveals differences in fish diversity and community structure in Danjiang River. Sci. Rep. 2024, 14, 29460. [Google Scholar] [CrossRef] [PubMed]
- Ball, R.L. The March 2000 Fisheries Survey of the West Fork White River That Was Affected by the December 1999 Fish Kill; Indiana Department of Natural Resources, Division of Fish and Wildlife: Indianapolis, IN, USA, 2000. [Google Scholar]
- Clark-Kolaks, S.; Gaston, K.; Holloway, D. White River Mainstem 2020: A detailed analysis of the fish community and aquatic habitat. Proc. Ind. Acad. Sci. 2022, 130, 144–155. [Google Scholar]
- Li, Y.; Evans, N.T.; Renshaw, M.A.; Jerde, C.L.; Olds, B.P.; Shogren, A.J.; Deiner, K.; Lodge, D.M.; Lamberti, G.A.; Pfrender, M.E. Estimating fish alpha- and beta-diversity along a small stream with environmental DNA metabarcoding. Metabarcoding Metagenom 2018, 2, e24262. [Google Scholar] [CrossRef]
- Wang, C.; Yu, Y.; Llompart, F.M.; Chen, Z.; Liu, Y.; Zhu, G. Environmental DNA as a novel tool for monitoring fish community structure and diversity feature in the northern Antarctic Peninsula. Estuar. Coast. Shelf Sci. 2025, 313, 109076. [Google Scholar] [CrossRef]
- Miya, M.; Sato, Y.; Fukunaga, T.; Sado, T.; Poulsen, J.Y.; Sato, K.; Minamoto, T.; Yamamoto, S.; Yamanaka, H.; Araki, H.; Kondoh, M.; Iwasaki, W. MiFish, a set of universal PCR primers for metabarcoding environmental DNA from fishes: Detection of more than 230 subtropical marine species. R. Soc. Open Sci. 2015, 2, 150088. [Google Scholar] [CrossRef] [PubMed]
- Manel, S.; Mathon, L.; Mouillot, D.; Bruno, M.; Valentini, A.; Lecaillon, G.; Gudefin, A.; Deter, J.; Boisery, P.; Dalongeville, A. Benchmarking fish biodiversity of seaports with eDNA and nearby marine reserves. Conserv. Lett. 2024, 17, e13001. [Google Scholar] [CrossRef]
- Qiu, S.; Ooi, J.L.S.; Chen, W.; Poong, S.-W.; Zhang, H.; He, W.; Su, S.; Luo, H.; Hu, W.; Affendi, Y.A.; Du, J.; Loh, K.-H. Heterogeneity of fish taxonomic and functional diversity evaluated by eDNA and gillnet along a mangrove–seagrass–coral reef continuum. Animals 2023, 13, 1777. [Google Scholar] [CrossRef] [PubMed]
- Qu, C.; Stewart, K.A.; Clemente-Carvalho, R.; Zheng, J.; Wang, Y.; Gong, C.; Ma, L.; Zhao, J.; Lougheed, S.C. Comparing fish prey diversity for a critically endangered aquatic mammal in a reserve and the wild using eDNA metabarcoding. Sci. Rep. 2020, 10, 16715. [Google Scholar] [CrossRef] [PubMed]
- Lee, H.T.; Liao, C.H.; Hsu, T.H. Environmental DNA (eDNA) metabarcoding in the fish market and nearby seafood restaurants in Taiwan reveals the underestimation of fish species diversity in seafood. Biology 2021, 10, 1132. [Google Scholar] [CrossRef] [PubMed]
- Ni, X.; Zhao, L.; Jiang, Y.-W.; Wang, H.; Tan, J.; Li, Y.; Sun, B.-J.; Lin, X.-L. Environmental DNA metabarcoding reveals fish diversity, community assembly and one invasive species prevalence in a National Park of Liaohe in September. Front. Mar. Sci. 2024, 11, 1403700. [Google Scholar] [CrossRef]
- He, W.; Wang, L.; Ou, D.; Li, W.; Huang, H.; Ou, R.; Qiu, J.; Cai, L.; Lin, L.; Zhang, Y. Fish diversity monitoring using environmental DNA techniques in the Clarion–Clipperton Zone of the Pacific Ocean. Water 2023, 15, 2123. [Google Scholar] [CrossRef]
- Munkittrick, K.R.; Dixon, D.G. Use of white sucker (Catostomus commersoni) populations to assess the health of aquatic ecosystems exposed to low-level contaminant stress. Can. J. Fish. Aquat. Sci. 1989, 46, 1455–1462. [Google Scholar] [CrossRef]
- Crawford, G.C.; Lydy, M.J.; Frey, J.W. Fishes of the White River Basin, Indiana; Water-Resources Investigations Report 96-4232; U.S. Geological Survey: Indianapolis, IN, USA, 1996. [Google Scholar]
Figure 1.
Sampling locations for environmental DNA (eDNA) collection in Indiana freshwater ecosystems, including White River upstream (WR UP), White River downstream (WR DN), Shadyside Lake (SS Lake), and Trail Creek.
Figure 1.
Sampling locations for environmental DNA (eDNA) collection in Indiana freshwater ecosystems, including White River upstream (WR UP), White River downstream (WR DN), Shadyside Lake (SS Lake), and Trail Creek.
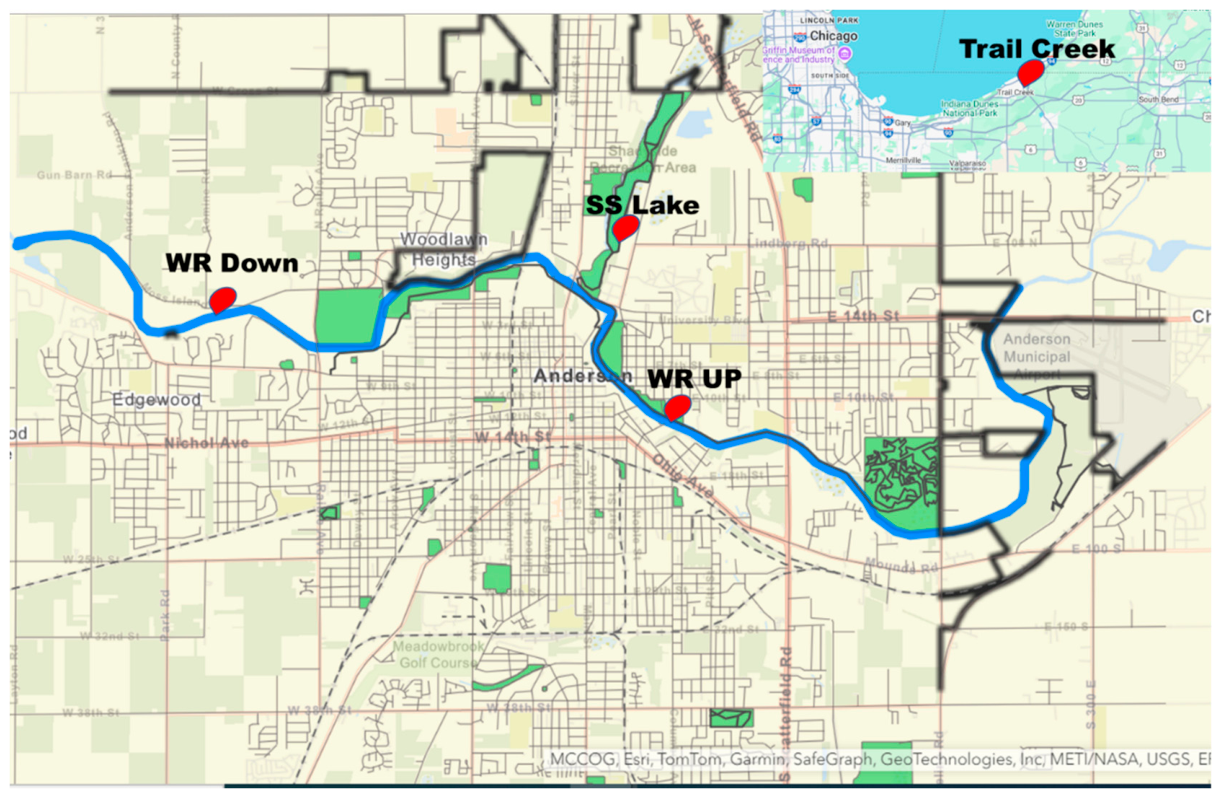
Figure 2.
Fish-associated exact sequence variant (ESV) richness detected by environmental DNA (eDNA) metabarcoding across four freshwater sampling locations in Indiana.
Figure 2.
Fish-associated exact sequence variant (ESV) richness detected by environmental DNA (eDNA) metabarcoding across four freshwater sampling locations in Indiana.
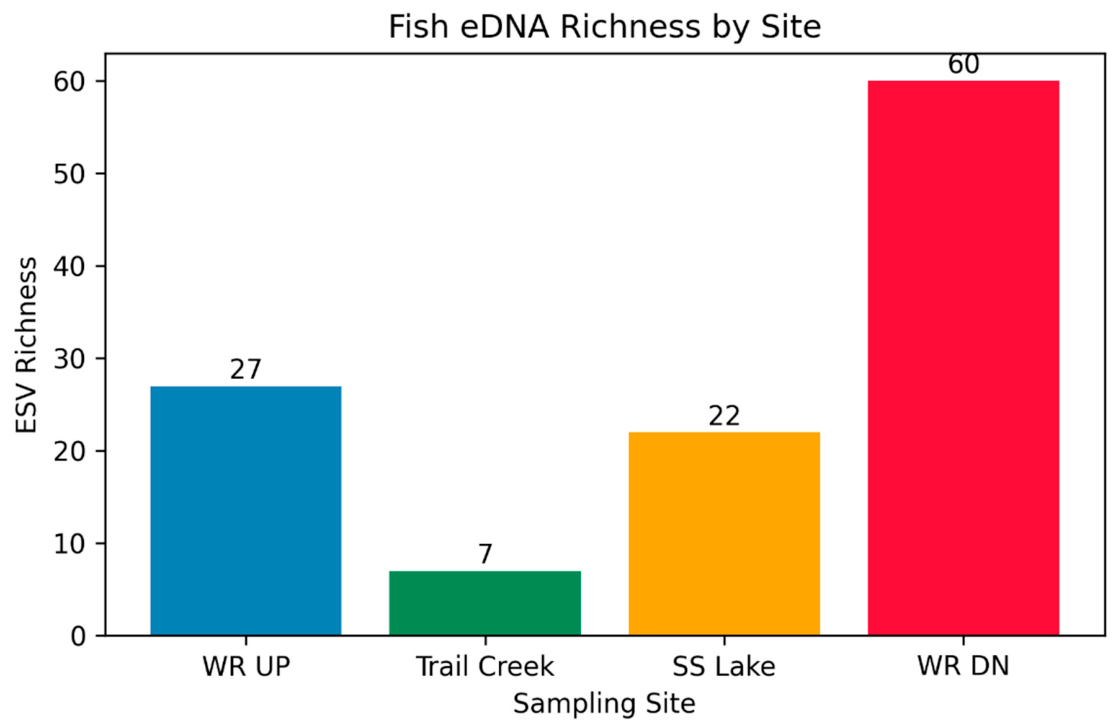
Figure 3.
Shannon diversity indices calculated from fish-associated eDNA sequence data across the four sampling locations.
Figure 3.
Shannon diversity indices calculated from fish-associated eDNA sequence data across the four sampling locations.
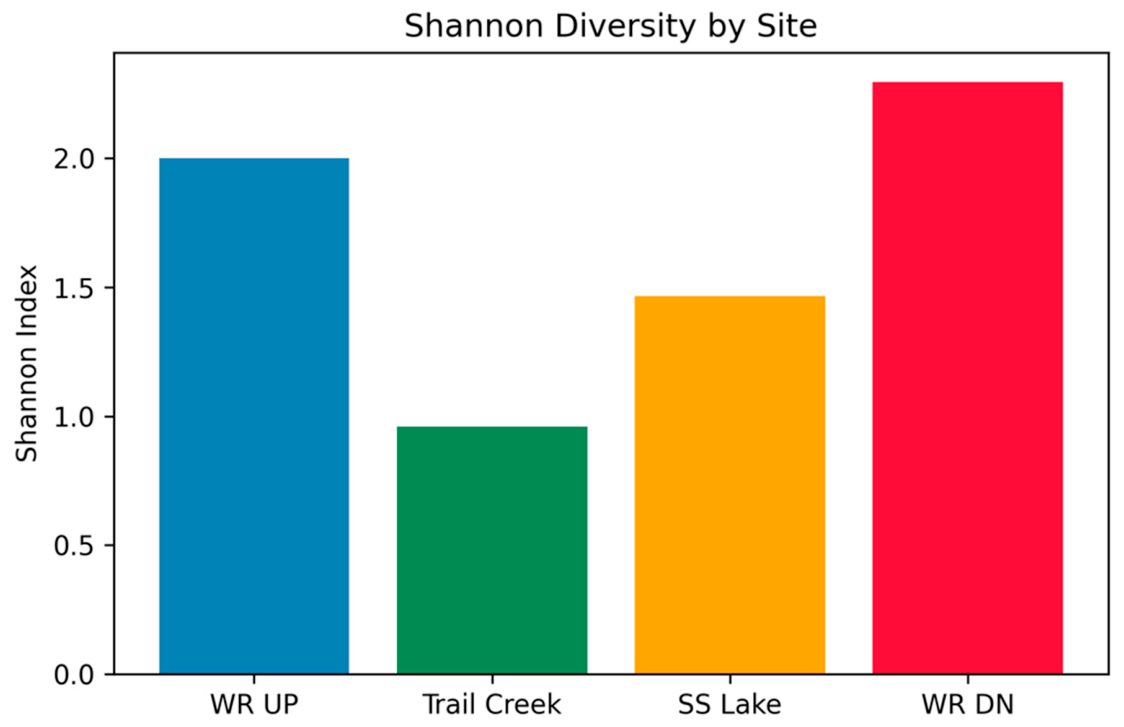
Figure 4.
Venn diagram showing shared and site-specific fish taxa detected by environmental DNA (eDNA) metabarcoding at the White River upstream (WR UP) and White River downstream (WR DN) sampling locations.
Figure 4.
Venn diagram showing shared and site-specific fish taxa detected by environmental DNA (eDNA) metabarcoding at the White River upstream (WR UP) and White River downstream (WR DN) sampling locations.
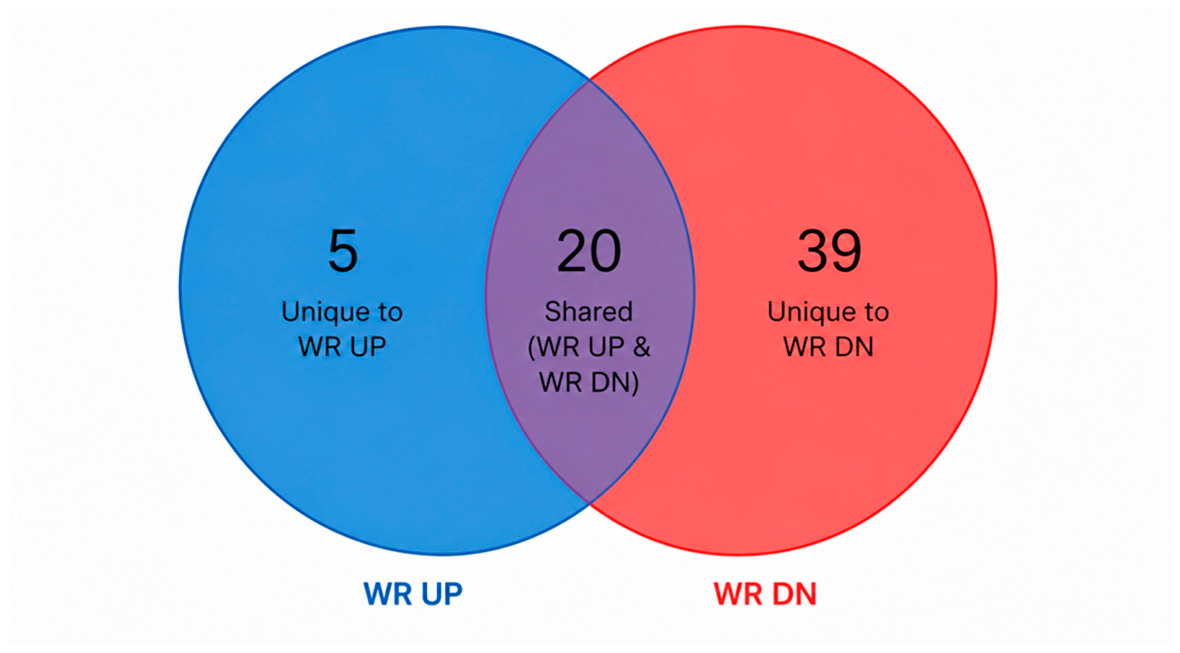
Figure 5.
Heatmap showing dominant fish-associated taxa detected by environmental DNA (eDNA) metabarcoding across four freshwater sampling locations in Indiana. Color intensity represents relative sequence-read representation within the dataset and should not be interpreted as a direct estimate of fish abundance.
Figure 5.
Heatmap showing dominant fish-associated taxa detected by environmental DNA (eDNA) metabarcoding across four freshwater sampling locations in Indiana. Color intensity represents relative sequence-read representation within the dataset and should not be interpreted as a direct estimate of fish abundance.
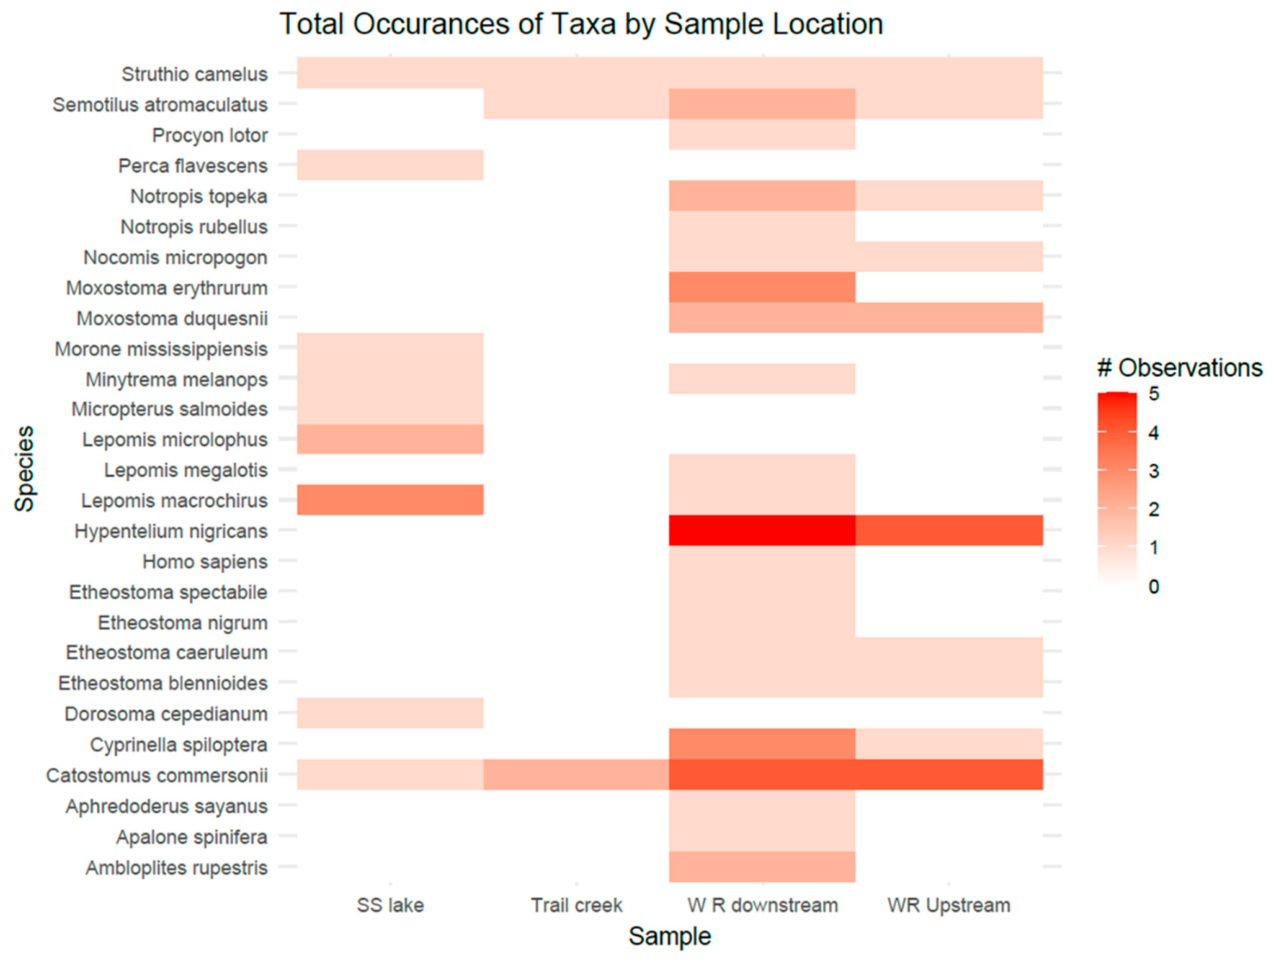
Figure 6.
Bray–Curtis dissimilarity matrix showing differences in fish-associated eDNA composition among sampling locations based on sequence-read data. Lower values indicate greater similarity in sequence composition.
Figure 6.
Bray–Curtis dissimilarity matrix showing differences in fish-associated eDNA composition among sampling locations based on sequence-read data. Lower values indicate greater similarity in sequence composition.
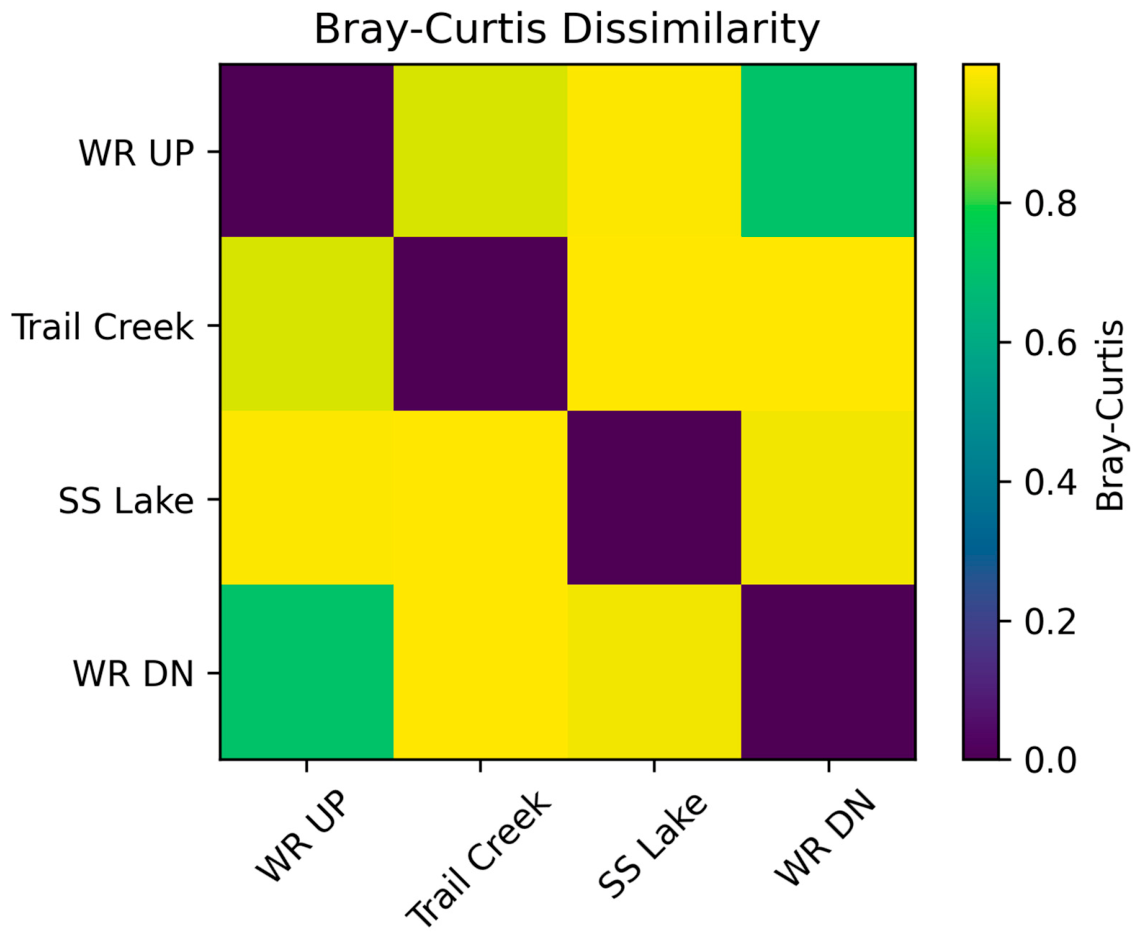
Figure 7.
Ordination of fish-associated eDNA composition based on Bray–Curtis dissimilarity among the four sampling locations. Samples positioned more closely in ordination space have more similar sequence-composition profiles.
Figure 7.
Ordination of fish-associated eDNA composition based on Bray–Curtis dissimilarity among the four sampling locations. Samples positioned more closely in ordination space have more similar sequence-composition profiles.
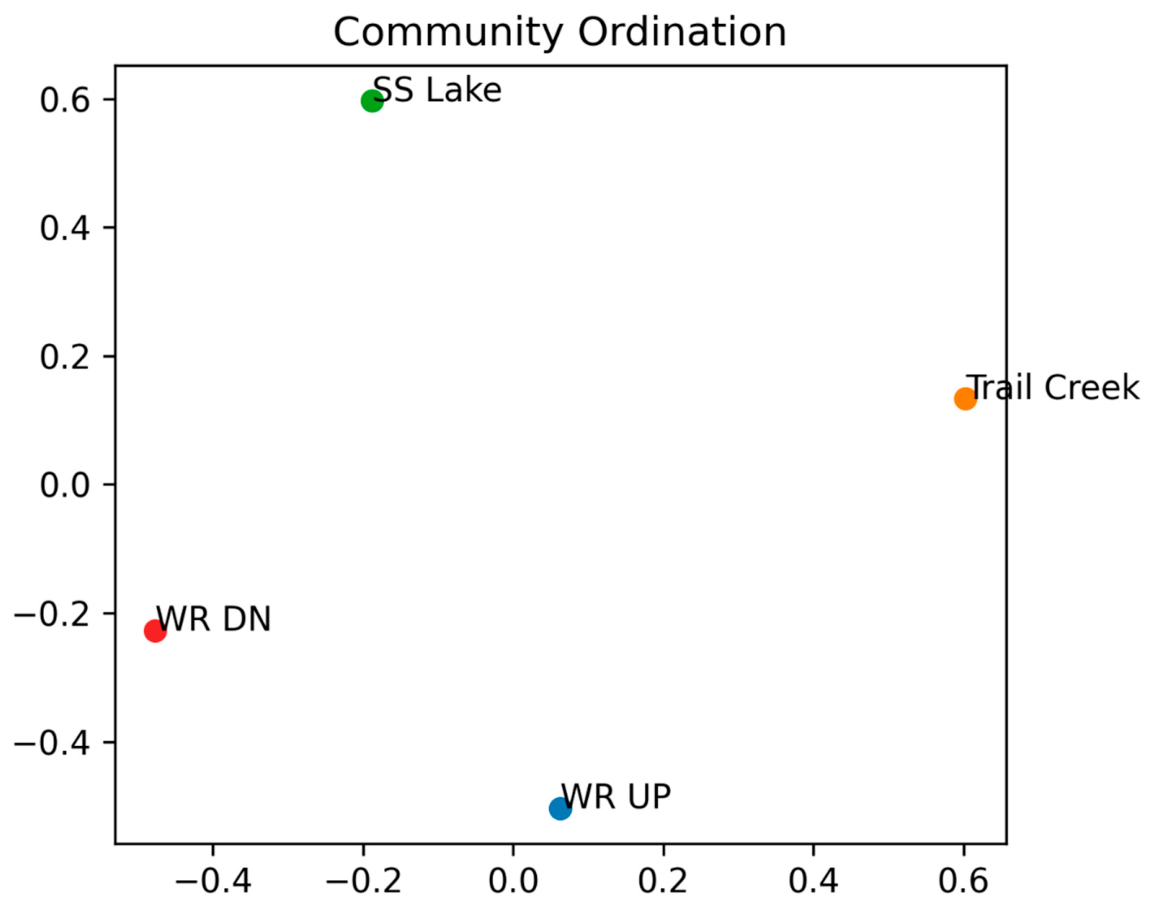

Table 1.
Fish-associated ESV richness and diversity metrics across four Indiana freshwater ecosystems.
Table 1.
Fish-associated ESV richness and diversity metrics across four Indiana freshwater ecosystems.
| Site | Habitat Type | ESV Richness | Shannon Diversity (H’) | Simpson Diversity |
| WR UP | River | 27 | 2.00 | 0.709 |
| WR DN | River | 60 | 2.30 | 0.731 |
| SS Lake | Lake | 22 | 1.46 | 0.648 |
| Trail Creek | River | 7 | 0.96 | 0.418 |
Disclaimer/Publisher’s Note: The statements, opinions and data contained in all publications are solely those of the individual author(s) and contributor(s) and not of MDPI and/or the editor(s). MDPI and/or the editor(s) disclaim responsibility for any injury to people or property resulting from any ideas, methods, instructions or products referred to in the content. |
© 2026 by the authors. Licensee MDPI, Basel, Switzerland. This article is an open access article distributed under the terms and conditions of the Creative Commons Attribution (CC BY) license (http://creativecommons.org/licenses/by/4.0/).
Copyright: This open access article is published under a Creative Commons CC BY 4.0 license, which permit the free download, distribution, and reuse, provided that the author and preprint are cited in any reuse.