
Submitted:
26 August 2026
Posted:
26 August 2026
You are already at the latest version
Abstract
Infrasound, a low-frequency physical stimulus from environmental and anthropogenic sources, is assumed to impact microvascular regulation, though the mechanism is not fully understood. This study examines the effects of bipolar infrasound exposure (1 Hz, 100 dB) on the sublingual microcirculation in mice, with a single 4-hour exposure and repeated 4-hour daily exposures for 14 days. Control mice were placed in the same chamber without infrasound exposure. Using sidestream dark-field (SDF) videomicroscopy and laser Doppler flowmetry (LDF), we assessed microvascular diameter oscillations (vasomotion) and flow changes (flowmotion), respectively. A single exposure significantly increased vasomotion oscillation amplitude in the low-frequency band, while changes in the very-low- and high-frequency bands were not significant. Flowmotion measured by LDF significantly increased in the very-low-frequency band after a single exposure, while the other frequency bands remained unchanged. In contrast, repeated exposure significantly increased vasomotion oscillation amplitude within the very-low-, low-, and high-frequency bands, while LDF-derived flowmotion did not change significantly. The findings suggest that repeated exposure to infrasound may induce irregular microvascular oscillations, primarily affecting vessel diameter rather than overall perfusion, warranting further exploration into related mechanisms.
Keywords:
infrasound
; microcirculation
; vasomotion
; flowmotion
; mechanotransduction
1. Introduction
Infrasound emissions from technical sources have increased worldwide, originating from a wide variety of sources. The question of their health effects arises from various perspectives, both in the workplace, such as in the aviation industry, and outdoors and in open water, where large wind turbines are now among the biggest sources of chronic and impulsive infrasound. It has been demonstrated that the SPL (Sound Pressure Levels) noise levels of today’s large wind turbines (250 meters and above) have risen significantly [1]. The specific properties of infrasound, such as its very low attenuation, highlight the potential effects of pulsatile infrasound on the cells and membranes of living organisms. Its biological significance cannot be deduced from a single property of a particular sound pulse, but must take all properties into account [2]. As wind energy production has expanded, modern wind turbines have increased in both size and generating capacity. In some regions, the expansion of wind energy infrastructure has also resulted in wind farms being located in closer proximity to residential areas. They generate a range of acoustic emissions, including audible sound, low-frequency noise, and infrasound [3,4].
Infrasound is very low-frequency sound, usually defined as sound with a frequency below 20 Hz. Sound is a mechanical wave caused by the vibration of objects that travels through a material medium, with its main characteristics being frequency and intensity. Frequency refers to the number of oscillations or pressure changes per second, while intensity is the amount of sound energy passing through a unit area per second. Although infrasound is typically considered to be below the range of human hearing, research has shown that humans can also perceive some of these very low frequencies, up to about 1.5–2 Hz [5]. There were reports indicating an association of infrasound with human diseases and animal abnormalities [6]. Due to the increased presence of infrasound sources, such as wind turbines, in daily life. This has drawn attention from the general public and scientists to study the effects of infrasound exposure on human health. Several experimental and epidemiological studies have investigated possible links between exposure to infrasound and a range of adverse effects on the body and mind, including sleep disorders, headaches, cognitive impairments and other dysfunctions, stress responses, and cardiovascular and autonomic nervous system problems [6]. While some of these associations remain under debate, emerging theories suggest that mechanical stimulation from sound waves may penetrate biological tissues and interact with cellular signaling pathways. More specifically, mechanical vibrations may produce effects such as membrane deformation, activation of mechanosensitive ion channels, and subsequent influence on cell activity across different physiological systems [7,8,9,10].
Among the various effects of acoustic exposure on the body that remain insufficiently understood, microcirculation is of relevance. Microcirculation is blood flow through the smallest vessels that form the vasculature network in the body, including arterioles, capillaries, and venules. These vessels are normally 100 μm or less in diameter and provide the direct delivery of oxygen and nutrients to tissues and the removal of metabolic waste [11]. Microcirculatory dysfunction is involved in many pathological processes, such as sepsis, cardiovascular diseases, diabetes, and inflammatory disorders [12,13,14]. Microvascular regulation links systemic circulation with cellular metabolism. A key component is vasomotion, the spontaneous rhythmic oscillation of vascular tone in small resistance vessels, independent of cardiac and respiratory cycles. These oscillations arise from interactions among vascular smooth muscle, endothelial signaling, and neural control [11]. By periodically changing microvascular resistance and redistributing blood flow, vasomotion may improve tissue oxygen extraction and adapt perfusion to local metabolic demands [15]. Flowmotion, the corresponding rhythmic fluctuation in microvascular blood flow, can be separated into physiological frequency bands associated with distinct mechanisms: NO-independent endothelial activity at 0.005–0.0095 Hz, NO-dependent endothelial activity at 0.0095–0.02 Hz, sympathetic activity at 0.02–0.05 Hz, myogenic activity at 0.05–0.15 Hz, respiratory activity at 0.15–2.0 Hz, and cardiac activity at 2.0–8.0 Hz [16]. Changes in the amplitude or frequency distribution of these oscillations may indicate endothelial dysfunction or impaired autonomic vascular control [17,18,19].
Advances in microvascular imaging now allow direct assessment of these dynamics. Sidestream dark-field (SDF) videomicroscopy enables visualization of the sublingual microcirculation, an accessible site commonly used to evaluate systemic microvascular function. Mechanical forces such as shear stress, stretch, and pressure regulate vascular function through endothelial mechanotransduction. The mechanosensitive ion channel Piezo1 contributes to this process by mediating calcium influx in response to membrane deformation and influencing vascular tone [20,21,22,23]. External mechanical stimuli, including vibration and low-frequency sound, may also affect vascular behavior through mechanosensitive pathways [20,24,25]. In this context, infrasound may represent an overlooked environmental mechanical stimulus capable of affecting endothelial signaling and microvascular regulation.
However, its direct effects on vasomotion in vivo remain poorly understood, as previous research has focused mainly on neurological and auditory outcomes. This study therefore evaluated the effects of infrasound on microcirculatory dynamics in mice after a 4-hour exposure. Sublingual microvessels were recorded using SDF videomicroscopy, vessel diameter changes were quantified with the VasoMetrics plugin in ImageJ, and oscillatory activity was analyzed using Fast Fourier Transform in three frequency bands: very low frequency, low frequency, and high frequency. This combined imaging and analytical approach was used to determine whether infrasound alters the oscillatory behavior of small vessels.
2. Materials and Methods
2.1. Animals
All experimental procedures were performed in accordance with the guidelines of the Canadian Council on Animal Care and were approved by the Dalhousie University Committee on Laboratory Animals. Thirty-five male C57BL/6 mice (6–8 weeks old) were purchased from Charles River (Saint-Constant, QC, Canada). Animals were housed in the Life Science Research Institute Animal Care Facility at the Faculty of Medicine, Dalhousie University, under standard laboratory conditions with a 12 h light/dark cycle and ad libitum access to food and water.
2.2. Experimental Groups
The study was designed to investigate effects of infrasound exposure (4 h) and repeated infrasound exposure (4 h daily for 14 consecutive days) on microcirculatory vasomotion and flowmotion. It included four groups: 1) infrasound exposure for 4 h (IE4h), 2) control without infrasound exposure (CON4h), 3) infrasound exposure for 14 days (IE14d) and 4) control for 14 days without infrasound exposure (CON14d). The experimental groups and exposure protocols are summarized in Table 1.
2.3. Infrasound Exposure and Monitoring System
Infrasound exposure was conducted in a sealed glove box (Bohlender GmbH, Grünsfeld, Germany) serving as the exposure chamber. A 25 cm woofer loudspeaker (W 250 S, VISATON GmbH & Co. KG, Haan, Germany) was mounted on the top opening of the chamber to generate low-frequency and infrasonic sound. The sound signal was produced by a microcontroller-based signal generator, amplified, and delivered to the loudspeaker. Both sinusoidal and bipolar waveforms could be generated, and the sound pressure level was adjusted by changing the signal amplitude. Pressure changes inside the chamber were continuously measured using a custom data acquisition system equipped with a differential pressure transducer. The signal was amplified, digitized, and recorded at 100 samples/s, allowing monitoring of frequencies up to 50 Hz. Two Python programs were used to control the exposure, change waveform settings, collect pressure data, and calculate frequency-dependent sound pressure levels. Because wind turbine-related infrasound has a pulsatile pattern rather than a sinusoidal shape, a bipolar waveform was used in this study. This waveform alternates between positive and negative differential-pressure peaks and includes the fundamental frequency and its harmonics. Sound pressure levels were calculated in decibels using unweighted Z-scaling. Based on reference conditions established by Physikalisch-Technische Bundesanstalt (PTB, Braunschweig, Germany) in a test chamber using infrasonic and low-frequency sine-wave signals, we calibrated the monitoring system and applied the resulting frequency-dependent calibration factors to the measured sound pressure levels.
2.4. Experimental Setup
All the mice were placed in the chamber for 4 h with (IE4h) or without (CON4h) infrasound exposure, or 4 h daily for 14 days with (IE14d) or without (CON14d) infrasound exposure. For the single exposure and control group, sublingual microcirculatory imaging was performed twice: once at baseline before the start of the 4 h exposure period, and again immediately after its completion. For the 14-day groups, the imaging was only performed once on day 15, the day after 14 days of exposure.
For all imaging procedures [26], general anesthesia was induced with 3.5% isoflurane in an induction chamber. Once anesthesia was achieved, the mouse was placed on a heating pad to maintain body temperature at 37 °C, which was continuously monitored using a rectal probe. The limbs were gently secured with tape, and anesthesia was maintained throughout the imaging procedure with 2% isoflurane delivered through a nose cone. To prepare the tongue for sublingual imaging, the lower incisors were carefully trimmed at the base with surgical scissors to improve access to the sublingual region and facilitate proper positioning of the imaging probe. The tongue was then gently extended using tweezers and fixed in place with a 5-0 polyester suture placed approximately 2 mm from the apex. The suture was attached to a holding plate positioned cranially so that the lower surface of the tongue faced upward. Care was taken to avoid excessive stretching or pressure that might interfere with physiological blood flow. To prevent tissue drying and improve optical coupling, ophthalmic gel was applied to the tongue surface before imaging.
2.5. SDF Imaging and Video Acquisition
Sublingual microcirculation was visualized using sidestream dark-field (SDF) video microscopy (MicroScan, MicroVision Medical Inc., Amsterdam, The Netherlands). The imaging system uses stroboscopic green light at 530 nm, which is absorbed by hemoglobin in red blood cells, thereby providing contrast between perfused microvessels and the surrounding tissue. This allowed real-time visualization of the sublingual microvascular network without the use of fluorescent dyes or contrast agents. The SDF probe was mounted on a modified adjustable stereotaxic holder to maintain a stable position during image acquisition and to minimize pressure-related artifacts. Before recording, illumination, focus, and probe position were carefully adjusted under low-ambient-light conditions. Particular attention was given to avoiding excessive pressure on the tongue surface, as probe-induced compression may interfere with local microvascular perfusion and vessel diameter. An ophthalmic gel was applied to the surface of the tongue to prevent tissue drying and improve optical coupling between the probe and the tissue. For each animal, one 5-min SDF video was recorded from the sublingual microcirculation at a frame rate of 30 frames per second. Videos were digitally recorded as AVI files on a Windows computer and stored for offline analysis. The same imaging conditions, including anesthesia, animal positioning, probe stabilization, recording duration, and frame rate, were used for all experimental groups.
2.6. Laser Doppler Flowmetry Assessment of Sublingual Microcirculation
After SDF imaging, the SDF probe was replaced with a laser Doppler flowmetry (LDF) probe to assess sublingual microvascular blood flow. The LDF probe was kept stable throughout the recording period to minimize motion artifacts. Laser Doppler signals were recorded from the sublingual microcirculation as an index of local tissue perfusion. Measurements were performed under the same anesthetic and environmental conditions for all animals.
2.7. Vessel Selection and Analysis
Vasomotion was assessed offline using FIJI/ImageJ version 1.54p with the VasoMetrics plugin. For each 5-min SDF recording, multiple analyzable microvessel segments were selected for diameter-tracking analysis, including a relatively straight course, clear vessel borders, high contrast, and a baseline diameter between 20 and 50 μm. Vessel segments with marked curvature, poor contrast, overlapping structures, unclear vessel walls, or unstable visualization were excluded from analysis. Baseline vessel diameter varied among selected vessels, reflecting the heterogeneous nature of the sublingual microvascular network. For each selected vessel, a midline was manually drawn along the vessel axis. The VasoMetrics plugin then automatically generated perpendicular measurement lines along the selected segment and measured the distance between opposite vessel walls frame by frame. This generated a continuous time series of changes in vessel diameter over the full 5-min recording period. The resulting diameter traces were exported for subsequent frequency-domain analysis. No automated post-acquisition motion-correction algorithm was applied. Therefore, vessel selection was restricted to stable recordings and vessel segments with minimal visible displacement during the recording period. A formal SDF video quality score was not applied; however, recordings were visually inspected before analysis, and only videos with sufficient focus, contrast, and stable visualization of the microvascular field were included.
2.8. Frequency-Domain Analysis
To evaluate the oscillatory behavior of microvascular signals, time-series data obtained from both VasoMetrics and laser Doppler flowmetry were exported to Excel and then analyzed by Fast Fourier Transform (FFT) using a Python script. For the VasoMetrics analysis, changes in vessel diameter over time were used as the input signal. For LDF analysis, the recorded perfusion signal from the sublingual region was used to assess flow-related oscillations. FFT converted these signals from the time domain to the frequency domain, enabling quantitative analysis of oscillatory activity across predefined frequency bands. Based on previous literature, oscillatory activity was evaluated in three frequency ranges: very low frequency (VLF, 0.005–0.15 Hz), low frequency (LF, 0.15–2 Hz), and high frequency (HF, 2–8 Hz) [16]. For each band, the mean spectral magnitude was calculated from the FFT output and used as an indicator of vasomotion or flowmotion activity.
2.9. Statistical Analysis
Statistical analysis was performed using GraphPad Prism 11.1.0 (GraphPad Software Inc., Boston, MA, USA). Normal distribution of data was confirmed by the Kolmogorov-Smirnov test. Data are presented as mean ± standard deviation (SD). For the acute groups, within-group comparisons between baseline and post-exposure measurements were performed using a paired two-tailed t-test. For the chronic groups, comparisons between the infrasound and control groups were performed using an unpaired two-tailed t-test. A p-value of ≤ 0.05 was considered statistically significant.
3. Results
3.1. In Control Mice, the Vasomotion Amplitude Derived from SDF Remained Stable
To determine whether chamber placement and experimental handling alone affected sublingual microvascular vasomotion, control mice were placed in the exposure chamber for 4 h without infrasound exposure. SDF-derived mean vasomotion amplitudes were measured in the VLF, LF, and HF frequency bands before and immediately after chamber placement. For each frequency band, the pre-chamber value was normalized to 100%, and the post-chamber value was expressed relative to the corresponding baseline. Mean amplitude showed numerical increases in the VLF and LF bands and a decrease in the HF band after 4 h; however, none of these changes reached statistical significance (Figure 1). These findings indicate that chamber placement and handling alone did not significantly alter sublingual microvascular vasomotion.
3.2. Four Hours of Infrasound Exposure Increased Vasomotion Amplitude
The immediate effect of a single infrasound exposure on sublingual microvascular vasomotion was assessed by comparing SDF-derived mean amplitudes before and immediately after 4 h of exposure to 1 Hz, 100 dB infrasound. For each frequency band, the pre-exposure value was normalized to 100%, and the post-exposure value was expressed relative to the corresponding baseline. Mean vasomotion amplitude increased numerically after exposure in the VLF, LF, and HF bands. The increase was statistically significant in the LF band, whereas the increases observed in the VLF and HF bands did not reach statistical significance (Figure 2). These findings suggest that a single 4 h infrasound exposure primarily affects the LF component of sublingual microvascular vasomotion.
3.3. Repeated Infrasound Exposure Significantly Elevated Vasomotion Amplitudes
To assess the effect of repeated infrasound exposure on sublingual microvascular vasomotion, mice were exposed to 1 Hz, 100 dB infrasound for 4 h/day for 14 consecutive days. SDF-derived mean vasomotion amplitudes were then analyzed in the VLF, LF, and HF frequency bands and compared between control and infrasound-exposed mice. Values were normalized to the corresponding control group, which was set to 100%. Repeated infrasound exposure significantly increased mean vasomotion amplitude in all three frequency bands (Figure 3). These findings demonstrate that repeated infrasound exposure enhances sublingual microvascular diameter oscillations across the VLF, LF, and HF ranges.
3.4. Flowmotion Did Not Change After 4 h of Chamber Placement in Control Mice
To determine whether placement in the exposure chamber alone affected sublingual microvascular flowmotion, laser Doppler flowmetry was performed in control mice before and after 4 h in the chamber without active infrasound exposure. LDF-derived mean amplitudes were analyzed in the VLF, LF, and HF frequency bands and normalized to the corresponding pre-chamber values, which were set to 100%. After 4 h of chamber placement, mean amplitude showed a numerical decrease in the VLF and HF bands and a slight increase in the LF band. However, none of these changes reached statistical significance (Figure 4). These results indicate that chamber placement alone did not significantly alter LDF-derived sublingual flowmotion in control mice.
3.5. Four Hours of Infrasound Exposure Increased Flowmotion in the VLF Band
To evaluate the effect of a single, 4 h infrasound exposure on sublingual microvascular flowmotion, laser Doppler flowmetry was performed before and immediately after exposure to bipolar infrasound at 1 Hz and 100 dB. LDF-derived mean amplitudes were analyzed in the VLF, LF, and HF frequency bands and normalized to the corresponding pre-exposure values, which were set to 100%. Following infrasound exposure, mean amplitude increased significantly in the VLF band compared with the pre-exposure baseline. A numerical increase was also observed in the LF band, although this difference was not statistically significant. In contrast, mean amplitude in the HF band showed a slight, non-significant decrease after exposure (Figure 5). These findings indicate that a single 4 h exposure to infrasound primarily alters the slower VLF component of sublingual microvascular flowmotion, while the LF and HF components remain largely unaffected.
3.6. Repeated Infrasound Exposure Did Not Alter LDF-Derived Sublingual Flowmotion
To evaluate whether repeated infrasound exposure affected sublingual microvascular flowmotion, laser Doppler flowmetry was performed after 14 days of daily exposure to infrasound at 1 Hz and 100 dB for 4 h per day. LDF-derived mean amplitudes were analyzed within the VLF, LF, and HF frequency bands and normalized to the corresponding control values, which were set to 100% (Figure 6). Mean amplitude was numerically higher in the infrasound-exposed group across all three frequency bands; however, none of these differences reached statistical significance.
4. Discussion
The results suggest a complex microvascular response to infrasound exposure. After a single 4 h exposure, FFT analysis of SDF data showed a significant increase in vasomotion amplitude in the LF band, while changes in the VLF and HF bands were not significant. In contrast, FFT analysis of LDF data detected a significant increase in flowmotion amplitude in the VLF band, with no significant changes in the LF or HF bands. Following 14 days of repeated exposure, SDF-derived vasomotion amplitude increased significantly across all three frequency bands, whereas LDF-derived flowmotion remained unchanged. Placing the animals in the chamber without infrasound exposure did not affect vasomotion or flowmotion. Overall, these findings suggest that repeated infrasound exposure produced a broader effect on vessel-diameter oscillations, but this was not accompanied by a sustained increase in blood-flow oscillations.
The microvasculature may first perceive infrasound as a minor mechanical stimulus. With sufficient sustained exposure, the effects may be enhanced regarding the impact on vascular control, and the oscillatory response may become more pronounced. One possible explanation for this phenomenon is mechanotransduction. Blood vessels are not mere tubes; they are active, dynamic structures that can detect and respond to mechanical forces. Endothelial cells and vascular smooth muscle cells are continuously engaged in sensing and responding to mechanical stimuli such as shear stress, stretch, pressure, and deformation [27]. The mechanisms that transduce these forces into intracellular signals involve mechanosensitive pathways. One of the most relevant candidates in this context is the mechanically activated ion channel PIEZO1, which is activated by membrane tension and deformation. Upon activation, PIEZO1 permits the influx of cations, in particular calcium, and this can initiate downstream signaling pathways that regulate vascular tone [23,28,29]. Thus, infrasound may act as a mechanical stimulus that affects biological tissues through repeated compression and expansion and may deform vascular and surrounding tissues to effectively activate mechanosensitive pathways [30,31].
The data suggested that bipolar infrasound at 100 dB and 1 Hz was associated with alterations in the amplitude of vasomotion oscillations across the analyzed frequency bands. Nevertheless, conceptually, it can be proposed that this effect may arise not through macroscopic tissue vibration, but through the application of cyclic mechanical strain to the vascular endothelium. Although the acoustic pressure equivalent of 100 dB (approximately 2 Pa) is negligible compared with intravascular hydrostatic pressure, it is aligned with the physiological range of endothelial shear stress (1–7 Pa) [32]. The bipolar waveform may also expose the vascular wall to alternating phases of compression and rarefaction, thereby generating rhythmic fluctuations in endothelial membrane tension.
Continuous cyclic mechanical loading could, in principle, influence mechanosensitive ion channels and calcium-dependent vascular signaling; however, this remains speculative in the absence of direct channel studies or calcium measurements. This disturbance in calcium signaling may disrupt downstream mechanotransduction pathways responsible for the regulation of vascular tone and ultimately impair the coordinated spontaneous oscillations that characterize normal vasomotion. A mechanistic explanation that uses membrane deformation, mechanotransduction, and PIEZO1-dependent vascular signaling fits well with this [33,34,35]. Subtle mechanical changes resulting from repetitive oscillatory mechanical loading may alter the physiological balance between the endothelium and the underlying smooth muscle [20]. In this context, it is reasonable to assume that infrasound-related membrane deformations may open mechanosensitive channels, like PIEZO1, which affect calcium, nitric oxide, and the overall reactivity of the vessel wall [36,37]. Vasomotion relies on precise calcium signaling and interconnected endothelial and smooth muscle communications, meaning that even small disruptions in any of these pathways can change the size of the oscillatory fluctuations in blood vessel diameter [15,37,38,39]. This explanation aligns well with our findings. The increase in spectral activity in the vasomotion-related band may be the result of enhancement or dysregulation of the vascular oscillators.
Vasomotion is believed to enhance tissue perfusion by creating rhythmic variations in microvascular blood flow across both time and space. This process may improve oxygen extraction and help sustain tissue oxygen levels, especially when perfusion is limited. Thus, this study hypothesizes that infrasound exposure might serve as a gentle mechanical stimulus to the microcirculation, prompting a compensatory rise in oscillatory activity to maintain flow distribution and oxygen supply to tissues [37,40,41,42,43].
Laser Doppler flowmetry was used alongside SDF imaging to assess flowmotion and vasomotion in the sublingual microcirculation. The two methods showed partially different responses to infrasound. This partial disagreement may reflect the different physiological variables captured by the two techniques. SDF-based analysis quantifies rhythmic changes in the diameter of selected vessels, whereas LDF measures fluctuations in local red blood cell flux within a broader tissue volume. Consequently, an increase in vessel-diameter oscillations does not necessarily produce a proportional change in tissue-level flowmotion. Differences in sampling volume, vessel selection, red blood cell velocity, concentration, and network recruitment may also contribute to the distinct responses detected by the two methods [38,44,45]. The absence of significant changes in LDF-derived oscillatory amplitude after repeated exposure suggests that the broader SDF vasomotion response was not accompanied by a parallel change in LDF-derived flowmotion. The increased vasomotion seen after infrasound exposure likely indicates changes in how the local vascular wall is regulated, rather than a significant shift in tissue perfusion. Infrasound could serve as a gentle cyclic mechanical stimulus, possibly boosting or interfering with local vascular oscillators via mechanotransduction pathways [20,46]. However, the minimal change in flowmotion derived from LDF indicates that microvascular flow stayed relatively stable despite increased diameter oscillations. This might reflect a compensatory or adaptive adjustment of microvascular tone to preserve tissue perfusion and oxygen delivery [43,47].
Increased vasomotion should not be interpreted as inherently beneficial. Previous studies have shown that vasomotion and flowmotion patterns can change in pathological or hypoxic conditions and may reflect subtle alterations in microvascular regulatory function [42,48,49]. Therefore, the increased vasomotion seen after chronic infrasound exposure might indicate an early sign of disrupted vascular regulation instead of a straightforward physiological enhancement. Mechanistically, this response could involve gradual modifications in mechanosensitive pathways, endothelial responsiveness, calcium-dependent signaling, and endothelial–smooth muscle coupling [20,37,38].
With repeated infrasound exposure, the biological response may become more consistent or accumulate over time, allowing the effect to become more detectable statistically. This interpretation is supported by previous experimental studies showing that repeated infrasound exposure can induce time-dependent biological changes, including alterations in calcium signaling, apoptosis, neuroinflammation, and tissue injury [9,10]. The data support the hypothesis that repeated infrasound exposure may be associated with altered microvascular oscillatory behavior, potentially involving mechanotransduction-related pathways, rather than an immediate response. Another relevant point is that the changes were detected in the sublingual microcirculation. This area is particularly advantageous because it offers a direct and easily accessible view of the microvascular function in the system. The sublingual bed is locally confined, but its underlying regulatory mechanisms are analogous to those of the wider microcirculatory system. Consequently, the findings discussed may imply that infrasound could affect not just one limited vascular locality, but microvascular regulation in a more global sense. If this is the case, prolonged exposure could affect the sublingual bed and beyond in terms of tissue perfusion heterogeneity, endothelial function, and vascular regulation.
The frequency-band pattern also suggests a more comprehensive regulatory effect than an effect that consists of an isolated random change. Increases in the very low, low, and high frequency ranges suggest that the response may have involved a multi-layered structure of blood vessel regulation. The very low frequency range is typically considered an indicator of endothelial and myogenic control, whereas the higher bands may be due to the respiratory and cardiac control superimposed on the microvascular control. A widespread increase across bands may suggest a broader alteration in microvascular oscillatory behavior, although the present data cannot distinguish local vascular mechanisms from systemic physiological influences, either through direct interactions via local mechanosensitive pathways or via some other means that alter the control through systemic physiological changes.
These results must be considered along with some limitations. First, the present study identifies an association with infrasound exposure and modified vasomotion but does not directly support the assertion of an underlying molecular pathway. Second, the assessment of vasomotion in SDF recordings was based on oscillatory vessel diameter changes. While powerful, this functional readout does not, by itself, distinguish endothelial, myogenic, neural, or any systemic contributions. Third, as the strongest conclusions were drawn following repeated exposure, future research should investigate whether the response continues to increase over time, reaches a plateau, or malfunctions or exhausts itself. Despite the limitations acknowledged, the overall pattern of our findings is meaningful. The data are consistent with the theory that infrasound can serve as a biologically relevant mechanical stimulus to the microcirculation. More specifically, we hypothesize that through mechanosensitive pathways that may include membrane deformation and PIEZO1-related calcium-dependent mechanisms, progressive exposures may change vasomotion. This is critical considering that vasomotion is not an inconsequential vascular phenomenon; it is a core mechanism responsible for the precise adjustment of tissue perfusion. Therefore, any enduring change in this mechanism will impact microvascular stability, the distribution of flow, and ultimately tissue oxygenation.
While the current findings align with a possible mechanotransduction-related response, the study did not directly investigate the underlying molecular mechanism. The analysis focused on SDF-derived vessel diameter oscillations and a frequency-domain assessment of vasomotion, so it cannot identify whether the changes originated from endothelial cells, vascular smooth muscle cells, neural regulation, systemic hemodynamic factors, or a combination of these. Specifically, measurements of PIEZO1 expression, PIEZO1 channel activity, intracellular Ca²⁺ signaling, nitric oxide production, and endothelial or smooth muscle responses were not performed. Therefore, PIEZO1-mediated endothelial mechanotransduction should be viewed as a plausible hypothesis rather than a confirmed mechanism. Future research involving pharmacological or genetic modulation of PIEZO1, Ca²⁺ imaging, endothelial function tests, and direct vessel wall mechanics measurements is necessary to establish if the vasomotion changes after infrasound exposure are causally related to mechanosensitive signaling pathways.
5. Conclusions
This study shows that repeated exposure to bipolar infrasound at 1 Hz and 100 dB causes notable changes in sublingual microvascular vasomotion in mice. A single 4-hour exposure significantly increased SDF-based vasomotion amplitude in the LF band, while changes in the VLF and HF bands were not statistically significant. However, 14 days of consecutive exposure resulted in a consistent, statistically significant increase in vasomotion amplitude across the VLF, LF, and HF frequency bands. These results imply that the microcirculatory response to infrasound depends on exposure duration, with broader effects appearing after repeated stimulation than after a single exposure. Importantly, after repeated exposure, the rise in SDF-derived vasomotion did not correspond with a significant change in LDF-derived flowmotion. This suggests that increased oscillations in vessel diameter do not automatically lead to proportional shifts in overall microvascular blood flow. Consequently, these results should be seen as indicating changes in local vascular wall regulation, rather than a direct boost in tissue perfusion. The difference between vasomotion and flowmotion emphasizes the need to combine structural and functional microvascular assessments when examining the biological impacts of low-frequency mechanical stimuli. While this study did not directly explore molecular mechanisms, the findings align with a potential mechanotransduction response. Repeated low-frequency mechanical stimulation could influence endothelial or smooth muscle signaling pathways, possibly involving membrane deformation, calcium-based responses, and mechanosensitive ion channels like PIEZO1.
Overall, this study offers new evidence that infrasound may affect microvascular oscillatory behavior, highlighting the microcirculation as a key area for future investigations. Future research should combine pharmacological or genetic modulation of mechanosensitive pathways with histopathological assessment, endothelial function testing, calcium imaging, and direct measurements of vascular wall mechanics. These approaches will help clarify whether the observed changes in vasomotion are directly caused by mechanotransduction. Ultimately, these findings could enhance our understanding of how environmental mechanical stimuli influence vascular physiology and microvascular stability.
Author Contributions
Conceptualization, M.D. and C.L.; methodology, B.S. and M.B.; software, B.S. and M.B.; validation, B.S. and M.B.; writing-original draft preparation, M.D.; writing-review and editing, U.B.-S., J.Z., B.S., M.B. and C.L.; visualization, M.D.; supervision, C.L. All authors have read and agreed to the published version of the manuscript.
Funding
The Deutsche Schutzgemeinschaft Schall fuer Mensch und Tier (DSGS) e.V., a not-for-profit research society, funded this work with an unrestricted grant.
Institutional Review Board Statement
The animal study protocol was approved by the Dalhousie University Committee for Laboratory Animals (protocol code 24-085; approval date: 22 October 2024).
Informed Consent Statement
Not applicable.
Data Availability Statement
Not applicable.
Conflicts of Interest
Ursula Bellut-Staeck is a volunteer board member of the DSGS. The other authors declare no conflicts of interest.
Abbreviations
The following abbreviations are used in this manuscript:
| CON4h | 4-hour control group |
| CON14d | 14-day control group |
| FFT | Fast Fourier Transform |
| HF | High frequency |
| IE4h | 4-hour infrasound exposure group |
| IE14d | 14-day infrasound exposure group |
| IS | Infrasound |
| LDF | Laser Doppler flowmetry |
| LF | Low frequency |
| NO | Nitric oxide |
| PTB | Physikalisch-Technische Bundesanstalt |
| SD | Standard deviation |
| SDF | Sidestream dark-field |
| SPL | Sound pressure level |
| VLF | Very low frequency |
| DSGS | Deutsche Schutz-Gemeinschaft-Schall für Mensch und Tier |
References
- Mattsson, K.; Eriksson, G.; Persson, L.; Chilo, J.; Tatar, K. Efficient Finite Difference Modeling of Infrasound Propagation in Realistic 3D Domains: Validation with Wind Turbine Measurements. Appl. Acoust. 2026, 243. [Google Scholar] [CrossRef]
- Persinger, M.A. Infrasound, Human Health, and Adaptation: An Integrative Overview of Recondite Hazards in a Complex Environment. Nat. Hazards 2014, 70, 501–525. [Google Scholar] [CrossRef]
- Flemmer, C.; Flemmer, R. Wind Turbine Infrasound: Phenomenology and Effect on People. Sustain. Cities Soc. 2023, 89. [Google Scholar] [CrossRef]
- Baliatsas, C.; van Kamp, I.; van Poll, R.; Yzermans, J. Health Effects from Low-Frequency Noise and Infrasound in the General Population: Is It Time to Listen? A Systematic Review of Observational Studies. Sci. Total Environ. 2016, 557–558, 163–169. [Google Scholar] [CrossRef] [PubMed]
- Baeza Moyano, D.; González Lezcano, R.A. Effects of Infrasound on Health: Looking for Improvements in Housing Conditions. Int. J. Occup. Saf. Ergon. 2022, 28, 809–823. [Google Scholar] [CrossRef] [PubMed]
- Kapoor, P.; Yadav, R.B.; Agrawal, N.; Gaur, S.; Arora, R. Infrasound in Biology and Medicine: Insights into Mechanisms, Health Outcomes and Research Perspectives - A Narrative Review. Noise Health 2025, 27, 676–691. [Google Scholar] [CrossRef] [PubMed]
- Wang, B.; Chen, J.; Liu, B.; Li, L.; Yi, N.; Liu, J.; Zhang, S. Observation of the L929 Cell Membrane after Infrasound Exposure with Atomic Force Microscope. Zhonghua Lao Dong Wei Sheng Zhi Ye Bing Za Zhi 2005, 23, 428–430. [Google Scholar] [PubMed]
- Shi, M.; Du, F.; Liu, Y.; Li, L.; Cai, J.; Zhang, G.F.; Xu, X.F.; Lin, T.; Cheng, H.R.; Liu, X.D.; et al. Glial Cell-Expressed Mechanosensitive Channel TRPV4 Mediates Infrasound-Induced Neuronal Impairment. Acta Neuropathol. 2013, 126, 725–739. [Google Scholar] [CrossRef] [PubMed]
- Liu, Z.; Gong, L.; Li, X.; Ye, L.; Wang, B.; Liu, J.; Qiu, J.; Jiao, H.; Zhang, W.; Chen, J.; et al. Infrasound Increases Intracellular Calcium Concentration and Induces Apoptosis in Hippocampi of Adult Rats. Mol. Med. Rep. 2012, 5, 73–77. [Google Scholar] [CrossRef] [PubMed]
- Liu, Z.H.; Chen, J.Z.; Ye, L.; Liu, J.; Qiu, J.Y.; Xu, J.; Lu, R.; Yuan, X.C.; Zhang, W.D.; Li, X.F.; et al. Effects of Infrasound at 8 Hz 90 DB/130 DB on NMDAR1 Expression and Changes in Intracellular Calcium Ion Concentration in the Hippocampus of Rats. Mol. Med. Rep. 2010, 3, 917–921. [Google Scholar] [CrossRef] [PubMed]
- Spencer-Vargas, A.C.; Nelson, C.; Danchulis, L.; Xu, Y.; Walborn, L.; Mayrovitz, H.N. The Cellular and Biophysical Origins of Microvascular Vasomotion: A Scoping Review. Cureus 2026. [Google Scholar] [CrossRef] [PubMed]
- Aksu, U.; Yavuz-Aksu, B.; Goswami, N. Microcirculation: Current Perspective in Diagnostics, Imaging, and Clinical Applications. J. Clin. Med. 2024, 13, 6762. [Google Scholar] [CrossRef] [PubMed]
- Serova, V.; Klibus, M.; Marcinkevics, Z.; Rubins, U.; Grabovskis, A.; Sabelnikovs, O. Microcirculation Monitoring in Septic Shock: Focused Review. Medicina (B. Aires) . 2026, 62, 346. [Google Scholar] [CrossRef] [PubMed]
- Wang, H.; Ding, H.; Wang, Z.-Y.; Zhang, K. Research Progress on Microcirculatory Disorders in Septic Shock: A Narrative Review. Medicine 2024, 103, e37273. [Google Scholar] [CrossRef] [PubMed]
- Aalkjær, C.; Boedtkjer, D.; Matchkov, V. Vasomotion – What Is Currently Thought? Acta Physiol. 2011, 202, 253–269. [Google Scholar] [CrossRef] [PubMed]
- Wang, Q.; Zhang, X.; Li, B.; Liu, X.; Li, A.; Li, H.; Shi, X.; Han, J. Tumor-Derived Exosomes Promote Tumor Growth Through Modulating Microvascular Hemodynamics in a Human Ovarian Cancer Xenograft Model. Microcirculation 2024, 31. [Google Scholar] [CrossRef] [PubMed]
- Kralj, L.; Lenasi, H. Wavelet Analysis of Laser Doppler Microcirculatory Signals: Current Applications and Limitations. Front. Physiol. 2023, 13. [Google Scholar] [CrossRef] [PubMed]
- Rossi, M.; Cupisti, A.; Di Maria, C.; Galetta, F.; Barsotti, G.; Santoro, G. Blunted Post-Ischemic Increase of the Endothelial Skin Blood Flowmotion Component as Early Sign of Endothelial Dysfunction in Chronic Kidney Disease Patients. Microvasc. Res. 2008, 75, 315–322. [Google Scholar] [CrossRef] [PubMed]
- Sun, P.-C.; Chen, C.-S.; Kuo, C.-D.; Lin, H.-D.; Chan, R.-C.; Kao, M.-J.; Wei, S.-H. Impaired Microvascular Flow Motion in Subclinical Diabetic Feet with Sudomotor Dysfunction. Microvasc. Res. 2012, 83, 243–248. [Google Scholar] [CrossRef] [PubMed]
- Davis, M.J.; Earley, S.; Li, Y.S.; Chien, S. Vascular Mechanotransduction. Physiol. Rev. 2023, 103, 1247–1421. [Google Scholar]
- Li, J.; Hou, B.; Tumova, S.; Muraki, K.; Bruns, A.; Ludlow, M.J.; Sedo, A.; Hyman, A.J.; McKeown, L.; Young, R.S.; et al. Piezo1 Integration of Vascular Architecture with Physiological Force. Nature 2014, 515, 279–282. [Google Scholar] [CrossRef] [PubMed]
- Syeda, R.; Florendo, M.N.; Cox, C.D.; Kefauver, J.M.; Santos, J.S.; Martinac, B.; Patapoutian, A. Piezo1 Channels Are Inherently Mechanosensitive. Cell Rep. 2016, 17, 1739–1746. [Google Scholar] [CrossRef] [PubMed]
- Wang, S.; Chennupati, R.; Kaur, H.; Iring, A.; Wettschureck, N.; Offermanns, S. Endothelial Cation Channel PIEZO1 Controls Blood Pressure by Mediating Flow-Induced ATP Release. J. Clin. Invest. 2016, 126, 4527–4536. [Google Scholar] [CrossRef] [PubMed]
- del Rosario-Gilabert, D.; Valenzuela-Miralles, A.; Esquiva, G. Advances in Mechanotransduction and Sonobiology: Effects of Audible Acoustic Waves and Low-Vibration Stimulations on Mammalian Cells. Biophys. Rev. 2024, 16, 783–812. [Google Scholar] [CrossRef] [PubMed]
- Zeng, Y.; Wu, Z.; Xiong, M.; Liang, Z.; Chen, Z.; Huang, H.; Yang, H.; Chen, Q. Piezo1 Promotes Vibration-Induced Vascular Smooth Muscle Injury by Regulating the NF-ΚB/P65 Axis. Commun. Biol. 2025, 8, 96. [Google Scholar] [CrossRef] [PubMed]
- Dyminski Parente Ribeiro, E.; Dastan, M.; Bellut-Staeck, U.; Zhou, J.; Lehmann, C. Minimally-Invasive Imaging of Sublingual Vessels—A New Method to Study Microvascular Changes in Mice. Life 2025, 15, 1478. [Google Scholar] [CrossRef] [PubMed]
- Ando, J.; Yamamoto, K. Vascular Mechanobiology Endothelial Cell Responses to Fluid Shear Stress. Circ. J. 2009, 73, 1983–1992. [Google Scholar] [CrossRef] [PubMed]
- Lhomme, A.; Gilbert, G.; Pele, T.; Deweirdt, J.; Henrion, D.; Baudrimont, I.; Campagnac, M.; Marthan, R.; Guibert, C.; Ducret, T.; et al. Stretch-Activated Piezo1 Channel in Endothelial Cells Relaxes Mouse Intrapulmonary Arteries. Am. J. Respir. Cell Mol. Biol. 2019, 60, 650–658. [Google Scholar] [CrossRef] [PubMed]
- Ranade, S.S.; Qiu, Z.; Woo, S.-H.; Hur, S.S.; Murthy, S.E.; Cahalan, S.M.; Xu, J.; Mathur, J.; Bandell, M.; Coste, B.; et al. Piezo1, a Mechanically Activated Ion Channel, Is Required for Vascular Development in Mice. Proc. Natl. Acad. Sci. 2014, 111, 10347–10352. [Google Scholar] [CrossRef] [PubMed]
- Alves-Pereira, M.; Castelo Branco, N.A.A. Vibroacoustic Disease: Biological Effects of Infrasound and Low-Frequency Noise Explained by Mechanotransduction Cellular Signalling. Prog. Biophys. Mol. Biol. 2007, 93, 256–279. [Google Scholar] [CrossRef] [PubMed]
- Wang, N. Review of Cellular Mechanotransduction. J. Phys. D. Appl. Phys. 2017, 50, 233002. [Google Scholar] [CrossRef] [PubMed]
- Malek, A.M. Hemodynamic Shear Stress and Its Role in Atherosclerosis. JAMA 1999, 282, 2035. [Google Scholar] [CrossRef] [PubMed]
- Leventhall, G. What Is. Infrasound? Prog. Biophys. Mol. Biol. 2007, 93, 130–137. [CrossRef] [PubMed]
- Dessalles, C.A.; Leclech, C.; Castagnino, A.; Barakat, A.I. Integration of Substrate- and Flow-Derived Stresses in Endothelial Cell Mechanobiology. Commun. Biol. 2021, 4, 764. [Google Scholar] [CrossRef] [PubMed]
- Swain, S.M.; Liddle, R.A. Piezo1 Acts Upstream of TRPV4 to Induce Pathological Changes in Endothelial Cells Due to Shear Stress. J. Biol. Chem. 2021, 296, 100171. [Google Scholar] [CrossRef] [PubMed]
- Harraz, O.F.; Klug, N.R.; Senatore, A.J.; Hill-Eubanks, D.C.; Nelson, M.T. Piezo1 Is a Mechanosensor Channel in Central Nervous System Capillaries. Circ. Res. 2022, 130, 1531–1546. [Google Scholar] [CrossRef] [PubMed]
- Jackson, W.F. Endothelial Ion Channels and Cell-Cell Communication in the Microcirculation. Front. Physiol. 2022, 13. [Google Scholar] [CrossRef] [PubMed]
- Li, J.; Zhang, Y.; Zhang, D.; Wang, W.; Xie, H.; Ruan, J.; Jin, Y.; Li, T.; Li, X.; Zhao, B.; et al. Ca2+ Oscillation in Vascular Smooth Muscle Cells Control Myogenic Spontaneous Vasomotion and Counteract Post-Ischemic No-Reflow. Commun. Biol. 2024, 7, 332. [Google Scholar] [CrossRef] [PubMed]
- Rahman, A.; Hughes, A.; Matchkov, V.; Nilsson, H.; Aalkjær, C. Antiphase Oscillations of Endothelium and Smooth Muscle [Ca2+]i in Vasomotion of Rat Mesenteric Small Arteries. Cell Calcium 2007, 42, 536–547. [Google Scholar] [CrossRef] [PubMed]
- Thorn, C.E.; Kyte, H.; Slaff, D.W.; Shore, A.C. An Association between Vasomotion and Oxygen Extraction. Am. J. Physiol.-Heart Circ. Physiol. 2011, 301, H442–H449. [Google Scholar] [CrossRef] [PubMed]
- Rücker, M.; Strobel, O.; Vollmar, B.; Roesken, F.; Menger, M.D. Vasomotion in Critically Perfused Muscle Protects Adjacent Tissues from Capillary Perfusion Failure. Am. J. Physiol.-Heart Circ. Physiol. 2000, 279, H550–H558. [Google Scholar] [CrossRef] [PubMed]
- Salvi, P.; Faini, A.; Castiglioni, P.; Brunacci, F.; Montaguti, L.; Severi, F.; Gautier, S.; Pretolani, E.; Benetos, A.; Parati, G. Increase in Slow-Wave Vasomotion by Hypoxia and Ischemia in Lowlanders and Highlanders. J. Appl. Physiol. 2018, 125, 780–789. [Google Scholar] [CrossRef] [PubMed]
- Munoz, C.J.; Lucas, A.; Williams, A.T.; Cabrales, P. A Review on Microvascular Hemodynamics. Crit. Care Clin. 2020, 36, 293–305. [Google Scholar] [CrossRef] [PubMed]
- Hultman, M.; Richter, F.; Larsson, M.; Strömberg, T.; Iredahl, F.; Fredriksson, I. Robust Analysis of Microcirculatory Flowmotion during Post-Occlusive Reactive Hyperemia. Microvasc. Res. 2024, 155, 104715. [Google Scholar] [CrossRef] [PubMed]
- Fredriksson, I.; Larsson, M.; Strömberg, T.; Iredahl, F. Vasomotion Analysis of Speed Resolved Perfusion, Oxygen Saturation, Red Blood Cell Tissue Fraction, and Vessel Diameter: Novel Microvascular Perspectives. Skin. Res. Technol. 2022, 28, 142–152. [Google Scholar] [CrossRef] [PubMed]
- Lim, X.R.; Abd-Alhaseeb, M.M.; Ippolito, M.; Koide, M.; Senatore, A.J.; Plante, C.; Hariharan, A.; Weir, N.; Longden, T.A.; Laprade, K.A.; et al. Endothelial Piezo1 Channel Mediates Mechano-Feedback Control of Brain Blood Flow. Nat. Commun. 2024, 15, 8686. [Google Scholar] [CrossRef] [PubMed]
- Roy, T.K.; Secomb, T.W. Effects of Impaired Microvascular Flow Regulation on Metabolism-perfusion Matching and Organ Function. Microcirculation 2021, 28. [Google Scholar] [CrossRef] [PubMed]
- Fonseca, D.A.; Antunes, P.E.; Antunes, M.J.; Cotrim, M.D. Vasomotion as an Oscillatory Sign of Functional Impairment in the Human Internal Thoracic Artery: A Study Based on Risk Factors and Vessel Reactivity. Exp. Physiol. 2018, 103, 1030–1038. [Google Scholar] [CrossRef] [PubMed]
- Rodriguez, M.; Tehrani, L.; Mayrovitz, H.N. Skin Blood Flowmotion in Various Disease States: A Scoping Review. Cureus 2026, 18, e101379. [Google Scholar] [CrossRef] [PubMed]
Figure 1.
Effects of 4 h chamber placement on SDF-derived sublingual vasomotion amplitude in control mice. Control mice were placed in the exposure chamber for 4 h without infrasound exposure. SDF-derived mean vasomotion amplitudes in the VLF, LF, and HF frequency bands were measured before and immediately after chamber placement. For each frequency band, the pre-chamber value was normalized to 100%, and the value measured after 4 h was expressed as a percentage of the corresponding pre-chamber baseline. No statistically significant differences were observed in any of the frequency bands. Data are presented as mean ± SD; n = 5 mice. Statistical comparisons were performed using a paired two-tailed t-test. ns, not significant; SDF, sidestream dark-field imaging; VLF, very low frequency; LF, low frequency; HF, high frequency.
Figure 1.
Effects of 4 h chamber placement on SDF-derived sublingual vasomotion amplitude in control mice. Control mice were placed in the exposure chamber for 4 h without infrasound exposure. SDF-derived mean vasomotion amplitudes in the VLF, LF, and HF frequency bands were measured before and immediately after chamber placement. For each frequency band, the pre-chamber value was normalized to 100%, and the value measured after 4 h was expressed as a percentage of the corresponding pre-chamber baseline. No statistically significant differences were observed in any of the frequency bands. Data are presented as mean ± SD; n = 5 mice. Statistical comparisons were performed using a paired two-tailed t-test. ns, not significant; SDF, sidestream dark-field imaging; VLF, very low frequency; LF, low frequency; HF, high frequency.
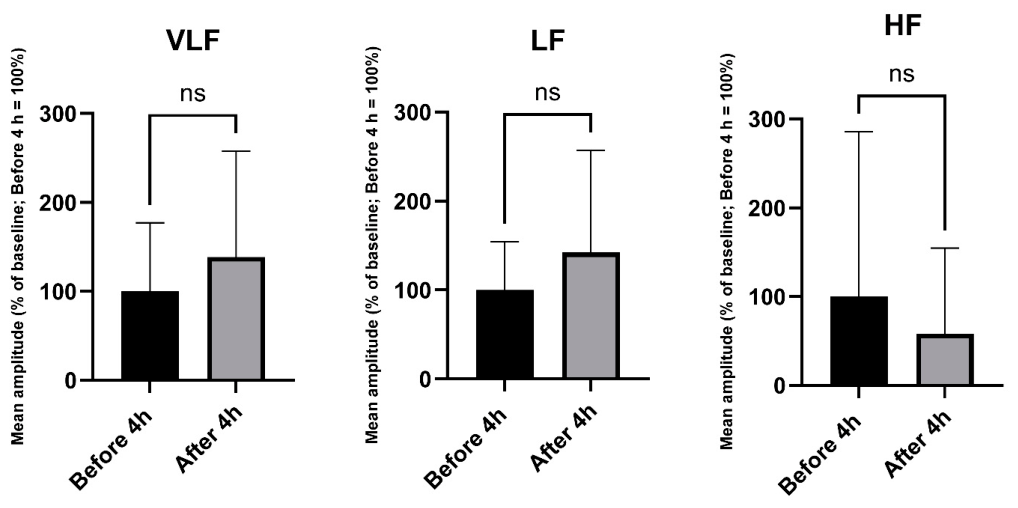
Figure 2.
Effects of a single 4 h infrasound exposure on SDF-derived sublingual vasomotion amplitude. Mice were exposed to infrasound at 1 Hz and 100 dB for 4 h. SDF-derived mean vasomotion amplitudes in the VLF, LF, and HF frequency bands were measured before and immediately after exposure. For each frequency band, the pre-exposure value was normalized to 100%, and the post-exposure value was expressed as a percentage of the corresponding pre-exposure baseline. Infrasound exposure significantly increased mean vasomotion amplitude in the LF band, whereas the increases observed in the VLF and HF bands were not statistically significant. Data are presented as mean ± SD; n = 10 mice. Statistical comparisons were performed using a paired two-tailed t-test. p ≤ 0.05 versus the corresponding pre-exposure value; ns, not significant; SDF, sidestream dark-field imaging; VLF, very low frequency; LF, low frequency; HF, high frequency.
Figure 2.
Effects of a single 4 h infrasound exposure on SDF-derived sublingual vasomotion amplitude. Mice were exposed to infrasound at 1 Hz and 100 dB for 4 h. SDF-derived mean vasomotion amplitudes in the VLF, LF, and HF frequency bands were measured before and immediately after exposure. For each frequency band, the pre-exposure value was normalized to 100%, and the post-exposure value was expressed as a percentage of the corresponding pre-exposure baseline. Infrasound exposure significantly increased mean vasomotion amplitude in the LF band, whereas the increases observed in the VLF and HF bands were not statistically significant. Data are presented as mean ± SD; n = 10 mice. Statistical comparisons were performed using a paired two-tailed t-test. p ≤ 0.05 versus the corresponding pre-exposure value; ns, not significant; SDF, sidestream dark-field imaging; VLF, very low frequency; LF, low frequency; HF, high frequency.
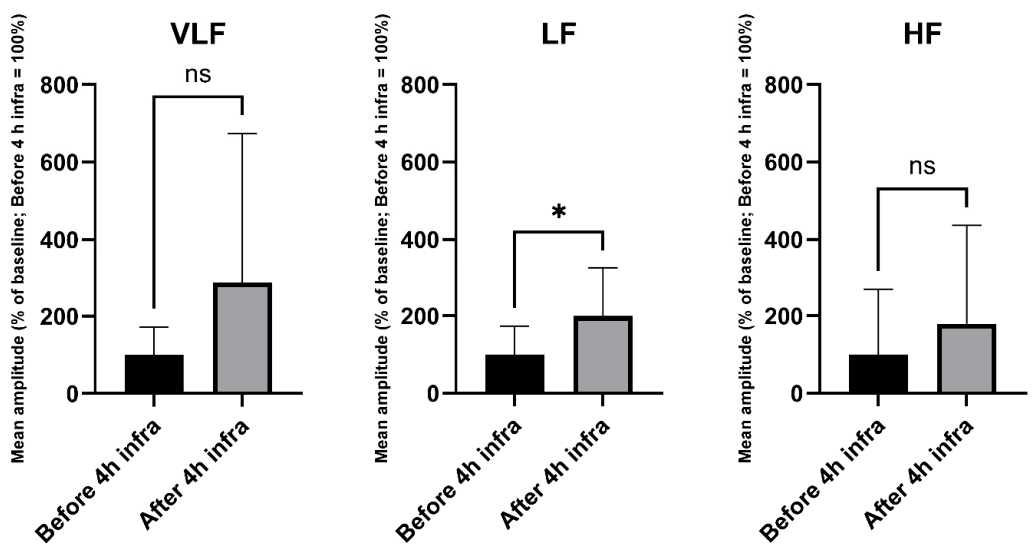
Figure 3.
Effects of repeated infrasound exposure on SDF-derived sublingual vasomotion amplitude. Mice were exposed to infrasound at 1 Hz and 100 dB for 4 h/day for 14 consecutive days. SDF-derived mean vasomotion amplitudes were analyzed in the VLF, LF, and HF frequency bands. For each frequency band, values were expressed as a percentage of the corresponding control mean, which was set to 100%. Repeated infrasound exposure significantly increased mean vasomotion amplitude in all three frequency bands. Data are presented as mean ± SD; n = 10 mice per group. Statistical comparisons were performed using an unpaired two-tailed t-test. p ≤ 0.05 versus control. SDF, sidestream dark-field imaging; VLF, very low frequency; LF, low frequency; HF, high frequency.
Figure 3.
Effects of repeated infrasound exposure on SDF-derived sublingual vasomotion amplitude. Mice were exposed to infrasound at 1 Hz and 100 dB for 4 h/day for 14 consecutive days. SDF-derived mean vasomotion amplitudes were analyzed in the VLF, LF, and HF frequency bands. For each frequency band, values were expressed as a percentage of the corresponding control mean, which was set to 100%. Repeated infrasound exposure significantly increased mean vasomotion amplitude in all three frequency bands. Data are presented as mean ± SD; n = 10 mice per group. Statistical comparisons were performed using an unpaired two-tailed t-test. p ≤ 0.05 versus control. SDF, sidestream dark-field imaging; VLF, very low frequency; LF, low frequency; HF, high frequency.
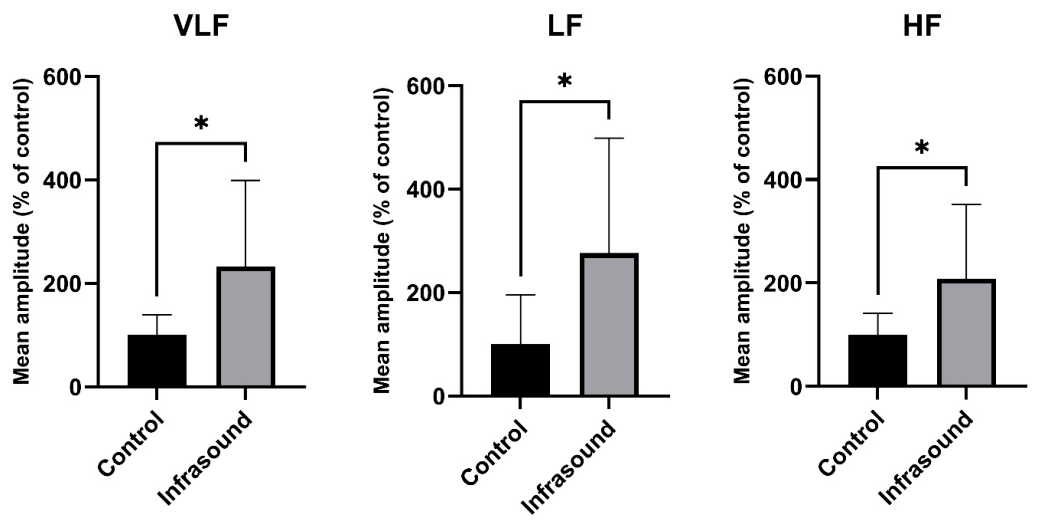
Figure 4.
Effects of 4 h chamber placement on LDF-derived sublingual flowmotion in control mice. Mice were placed in the exposure chamber for 4 h without active infrasound exposure. LDF-derived mean amplitudes in the VLF, LF, and HF frequency bands were measured before and after chamber placement. For each frequency band, the value measured before chamber placement was normalized to 100%, and the value measured after 4 h was expressed as a percentage of the corresponding pre-chamber baseline. Data are presented as mean ± SD; n = 5 mice. Statistical comparisons were performed using a paired two-tailed t-test. ns, not significant; LDF, laser Doppler flowmetry; VLF, very low frequency; LF, low frequency; HF, high frequency.
Figure 4.
Effects of 4 h chamber placement on LDF-derived sublingual flowmotion in control mice. Mice were placed in the exposure chamber for 4 h without active infrasound exposure. LDF-derived mean amplitudes in the VLF, LF, and HF frequency bands were measured before and after chamber placement. For each frequency band, the value measured before chamber placement was normalized to 100%, and the value measured after 4 h was expressed as a percentage of the corresponding pre-chamber baseline. Data are presented as mean ± SD; n = 5 mice. Statistical comparisons were performed using a paired two-tailed t-test. ns, not significant; LDF, laser Doppler flowmetry; VLF, very low frequency; LF, low frequency; HF, high frequency.
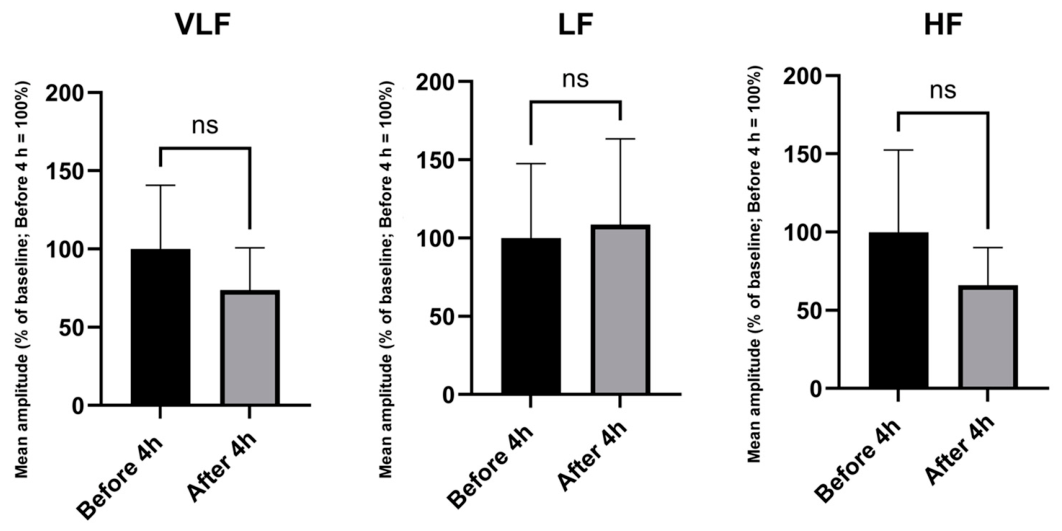
Figure 5.
Effects of a single 4 h bipolar infrasound exposure on LDF-derived sublingual flowmotion. Mice were exposed to bipolar infrasound at 1 Hz and 100 dB for 4 h. LDF-derived mean amplitudes in the VLF, LF, and HF frequency bands were measured before and immediately after exposure. For each frequency band, the pre-exposure value was normalized to 100%, and the post-exposure value was expressed as a percentage of the corresponding pre-exposure baseline. Infrasound exposure significantly increased mean amplitude in the VLF band, whereas the changes observed in the LF and HF bands were not statistically significant. Data are presented as mean ± SD; n = 10 mice. Statistical comparisons were performed using a paired two-tailed t-test. **p ≤ 0.01; ns, not significant; LDF, laser Doppler flowmetry; VLF, very low frequency; LF, low frequency; HF, high frequency.
Figure 5.
Effects of a single 4 h bipolar infrasound exposure on LDF-derived sublingual flowmotion. Mice were exposed to bipolar infrasound at 1 Hz and 100 dB for 4 h. LDF-derived mean amplitudes in the VLF, LF, and HF frequency bands were measured before and immediately after exposure. For each frequency band, the pre-exposure value was normalized to 100%, and the post-exposure value was expressed as a percentage of the corresponding pre-exposure baseline. Infrasound exposure significantly increased mean amplitude in the VLF band, whereas the changes observed in the LF and HF bands were not statistically significant. Data are presented as mean ± SD; n = 10 mice. Statistical comparisons were performed using a paired two-tailed t-test. **p ≤ 0.01; ns, not significant; LDF, laser Doppler flowmetry; VLF, very low frequency; LF, low frequency; HF, high frequency.
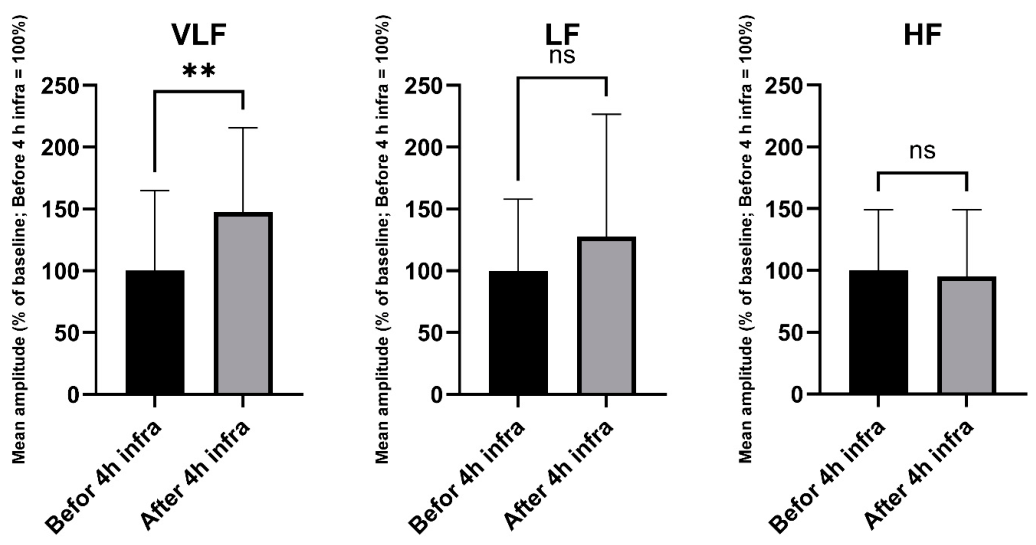
Figure 6.
Effects of repeated infrasound exposure on LDF-derived sublingual flowmotion. Mice were exposed to infrasound at 1 Hz and 100 dB for 4 h/day for 14 consecutive days. LDF-derived mean amplitudes in the VLF, LF, and HF frequency bands were analyzed and expressed as a percentage of the corresponding control values. Data are presented as mean ± SD; n = 10 per group. Statistical comparisons were performed using an unpaired two-tailed t-test. ns, not significant; LDF, laser Doppler flowmetry; VLF, very low frequency; LF, low frequency; HF, high frequency.
Figure 6.
Effects of repeated infrasound exposure on LDF-derived sublingual flowmotion. Mice were exposed to infrasound at 1 Hz and 100 dB for 4 h/day for 14 consecutive days. LDF-derived mean amplitudes in the VLF, LF, and HF frequency bands were analyzed and expressed as a percentage of the corresponding control values. Data are presented as mean ± SD; n = 10 per group. Statistical comparisons were performed using an unpaired two-tailed t-test. ns, not significant; LDF, laser Doppler flowmetry; VLF, very low frequency; LF, low frequency; HF, high frequency.
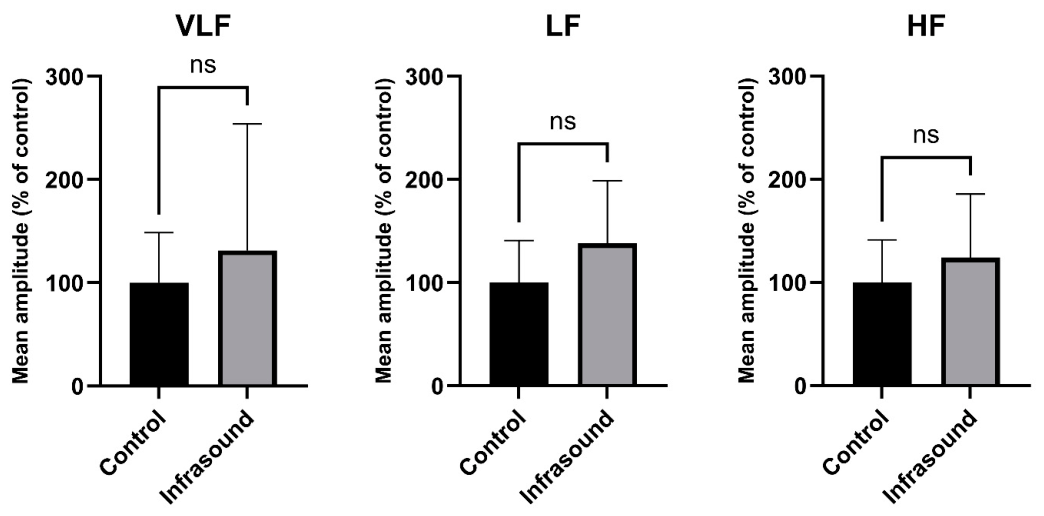

Table 1.
Experimental groups and infrasound exposure protocols.
| Experimental Group | Exposure in the chamber | Measurements | n |
| IE4h | IS, 1 Hz, 100 dB, 4 h | before/after | 10 |
| CON4h | No IS, 4 h | before/after | 5 |
| IE14d | IS, 1 Hz, 100 dB, 4 h/day ×14 days | day 15 | 10 |
| CON14d | No IS, 4 h/day ×14 days | day 15 | 10 |
1 IS, infrasound; IE4h, 4-h infrasound exposure group; CON4h, 4-h control group; IE14d, 14-day infrasound exposure group; CON14d, 14-day control group.
Disclaimer/Publisher’s Note: The statements, opinions and data contained in all publications are solely those of the individual author(s) and contributor(s) and not of MDPI and/or the editor(s). MDPI and/or the editor(s) disclaim responsibility for any injury to people or property resulting from any ideas, methods, instructions or products referred to in the content. |
© 2026 by the authors. Licensee MDPI, Basel, Switzerland. This article is an open access article distributed under the terms and conditions of the Creative Commons Attribution (CC BY) license (http://creativecommons.org/licenses/by/4.0/).
Copyright: This open access article is published under a Creative Commons CC BY 4.0 license, which permit the free download, distribution, and reuse, provided that the author and preprint are cited in any reuse.