

Submitted:
25 August 2026
Posted:
26 August 2026
You are already at the latest version
Abstract
Mountain karst landscapes present major challenges for reconstructing past habitation because suitable environments are spatially fragmented and archaeological remains are often dispersed. This study integrates GIS-based multicriteria decision analysis (GIS-MCDA) and machine-learning methods to model habitation suitability in Biokovo Nature Park, Croatia. Twenty-one morphometric, hydrogeomorphological, climatic, and archaeological criteria, together with 804 reference polygons, were used to develop four habitation suitability models: Equal-Weight GIS-MCDA, Analytic Hierarchy Process (AHP) GIS-MCDA, Random Forest (RF), and XGBoost. All models showed strong independent discrimination, with AUC values of 0.9152 for Equal Weight, 0.9447 for AHP, 0.9876 for RF, and 0.9886 for XGBoost. The final XGBoost model indicates that favourable habitation environments are limited and spatially discontinuous, with high and very high suitability occupying only 16.72% of the study area. Suitable zones are concentrated within distinct karst micro-landscapes, particularly around dolines. The results support the interpretation of Biokovo as a selectively used mountain landscape and demonstrate the potential of combining GIS-MCDA and machine-learning approaches for archaeological prospection in Mediterranean and Dinaric karst environments.
Keywords:
geoarchaeology
; habitation suitability
; predictive modelling
; GIS-MCDA
; machine learning
; landscape archaeology
; mountain archaeology
; karst landscape
; Biokovo
1. Introduction
Understanding the geographical factors that determine habitation suitability remains one of the central challenges of landscape archaeology, particularly in mountain environments where pronounced spatial heterogeneity strongly influences patterns of human occupation [1,2,3,4]. Contemporary mountain archaeology no longer considers mountains as marginal areas but as dynamic socio-environmental systems shaped by the long-term interaction between natural processes and human activities [1,3,5,6,7].
Consequently, archaeological research has shifted from documenting individual sites towards investigating the spatial organization of cultural landscapes and the processes that structured them through time [7,8,9].
This perspective is especially relevant in Mediterranean karst mountain regions, where rugged topography, limited surface water availability and pronounced environmental gradients create highly variable conditions for human occupation and land use [2,4,10,11]. In such environments, habitation patterns result from the interaction of multiple geographical characteristics rather than a single environmental factor, making their reconstruction dependent on the integration of archaeological evidence and spatial analysis [1,12,13].
Habitation suitability modelling has become an important analytical approach for investigating the relationship between archaeological landscape features and landscape characteristics [14]. Based on the premise that the spatial distribution of archaeological landscape features reflects the interaction between human behavior and environmental conditions rather than random processes, predictive modelling integrates archaeological and geographical data within a GIS environment to evaluate habitation suitability and test hypotheses concerning the factors that influenced the spatial organization of human occupation [14,15,16,17,18]. Beyond identifying areas of archaeological potential, these models provide a quantitative framework for evaluating long-term human–environment relationships and interpreting the processes that shaped cultural landscapes [18,19,20].
Biokovo Mountain provides a suitable case study for applying this approach. Its complex karst geomorphology, rugged relief, pronounced environmental gradients and the close relationship between the Adriatic coast and the mountain interior have created highly heterogeneous conditions for long-term human occupation and land use. Archaeological research has documented numerous anthropogenic landscape features, including burial mounds, communication routes, dry-stone structures, seasonal pastoral settlements, sacred sites and cave localities with evidence of human activity, indicating recurrent use of the mountain from prehistory to the modern period [5,21]. Despite this rich archaeological record, the geographical factors associated with habitation suitability across Biokovo have never been systematically evaluated, nor has an integrated spatial model been developed to examine their role in high-mountain habitation patterns.
To address this research gap, this study presents the first GIS-based habitation suitability model for Biokovo Mountain integrating archaeological landscape features with geographical variables. Unlike approaches based solely on the spatial distribution of archaeological sites, the proposed model combines multiple categories of archaeological landscape features representing different forms of past human activity with the delineation of suitable and unsuitable areas derived from landscape characteristics. This modelling approach is used to test the hypothesis that the spatial distribution of archaeological landscape features reflects long-term relationships between human activity and geographical conditions, to evaluate the relative importance of individual geographical variables in shaping habitation suitability, and to provide a new interpretative framework for understanding the organization of the high-mountain cultural landscape.
2. Materials and Methods
2.1. Study Area
Biokovo Mountain is located along the eastern Adriatic coast within the Dinaric mountain system and represents one of the most prominent karst massifs in southern Croatia (Figure 1). Extending in a northwest–southeast direction parallel to the coastline, the massif rises abruptly from sea level to its highest peak, Sveti Jure (1762 m a. s. l.), over a relatively short horizontal distance. This pronounced altitudinal gradient creates distinct environmental contrasts between the coastal zone, transitional slopes and the high-mountain plateau [22].
The mountain is composed predominantly of Mesozoic limestones and dolomites, while its present-day morphology is the result of prolonged tectonic activity and karstification [22,23]. The landscape is characterized by steep slopes, rocky ridges and numerous surface and subterranean karst landforms, including karren, dolines, karst ridges, pits and caves [22,23]. The summit plateau exhibits well-developed polygonal karst, with densely distributed dolines separated by sharp interdoline ridges and pyramidal peaks, producing exceptional microtopographic variability [22]. Water resources are scarce, consisting primarily of springs, ponds, wells and natural rock pools [24]. Biokovo is characterized by pronounced climatic variability resulting from the interaction of Mediterranean and continental influences [25]. Temperature, precipitation and vegetation change markedly with altitude, affecting pasture productivity and the seasonal suitability of different parts of the mountain for human occupation [25,26].
2.2. Methodological Workflow of Habitation Suitability Modelling
The methodological workflow consisted of seven main stages (Figure 2). First, input spatial datasets were compiled and used to derive 21 morphometric, hydrogeomorphological, climatic, and archaeological criteria. All criterion layers were harmonized to a common 5 m raster grid, and reference data were mapped and divided into training and independent validation subsets. Training data were then used for criterion diagnostics, response-curve definition, sensitivity analysis, and spatial cross-validation. Following the analysis, two GIS-MCDA (Equal Weight and AHP) and two machine-learning (Random Forest (RF) and Extreme Gradient Boosting (XGBoost)) models were subsequently developed. Finally, all models were independently validated and compared in terms of predictive performance and spatial robustness.
2.2.1. Input Data and Geoarchaeological Criterion Generation
The predictive modelling incorporated 21 geoarchaeological criteria, divided into four groups: morphometric, hydrogeomorphological, climatic, and archaeological. All criteria were generated using a digital elevation model (DEM) derived from airborne LiDAR data provided by the State Geodetic Administration of Croatia [27]. Due to computational constraints, the DEM was resampled to a common 5 m analysis grid prior to criteria generation.
Morphometric criteria
Elevation (ELV) represents the vertical position of each raster cell and ranges from approximately sea level to 1762 m a.s.l. It was included because altitude influences accessibility, climate, vegetation, snow persistence, and the seasonal suitability of mountain habitation areas [3,4,28].
Slope (SLO) expresses terrain gradient in degrees, ranging from nearly flat surfaces to slopes exceeding 80°. It directly affects accessibility, construction potential, erosion, and the availability of usable ground, with gentler terrain generally considered more favourable for habitation [29,30,31].
Aspect (ASP) describes slope orientation and influences solar radiation, wind exposure, soil moisture, vegetation, and local microclimate. It was included to account for differences in environmental conditions associated with terrain orientation [28,29,32].
Plan curvature (PLAN) describes horizontal terrain curvature and distinguishes convergent, divergent, and approximately planar surfaces. It affects runoff concentration and drainage dispersion and therefore helps identify hollows, ridges, and locally planar terrain potentially relevant to habitation [29].
Profile curvature (PROF) describes terrain curvature along the direction of maximum slope. It influences flow acceleration, erosion, sediment accumulation, and slope stability, distinguishing locally convex, concave, and linear terrain positions [29].
Sky View Factor (SVF) measures local topographic openness as the proportion of visible sky above each raster cell. It captures differences in enclosure that can influence radiative cooling, cold-air accumulation, humidity, and exposure [33].
Terrain Ruggedness Index (TRI) quantifies local elevation variability, with higher values representing rougher and more dissected terrain [34,35]. Lower ruggedness generally corresponds to smoother surfaces that are easier to access and more suitable for construction and recurrent human use [30,31].
Topographic Position Index (TPI) describes the elevation of a location relative to its surroundings. Positive values represent locally elevated positions, negative values indicate depressions, and values close to zero represent terrain with an elevation similar to its surroundings, allowing differentiation of ridges, depressions, margins, and relatively neutral terrain positions [34].
Hydrogeomorphological criteria
Drainage density (DD) represents the local concentration of drainage features and serves as a proxy for runoff concentration, terrain dissection, erosion potential, and moisture conditions [36]. In karst terrain, it should be interpreted cautiously because surface drainage is often discontinuous [37].
Convergence Index (CI) describes the tendency of surface flow to converge or diverge [38]. It differentiates terrain where runoff and sediment may accumulate from better-drained or more divergent positions and therefore provides information on moisture, erosion, and local surface stability.
Length-Slope Factor (LSF) combines slope steepness and contributing flow length as a proxy for potential erosion intensity [39]. High values represent terrain with greater runoff-related erosion potential and generally less favourable conditions for stable surfaces suitable for habitation.
Stream Power Index (SPI) estimates the potential erosive power of concentrated runoff based on slope and accumulated flow [40]. High values identify areas potentially affected by stronger runoff or gullying and are interpreted as a proxy for runoff energy rather than permanent stream activity in the Biokovo karst.
Topographic Wetness Index (TWI) combines contributing area and slope to estimate potential moisture accumulation [41]. It was included because local moisture conditions may influence water availability, vegetation productivity, and the suitability of locations for habitation or pastoral use.
Archaeological criteria
Distance to ponds (lokve) (DL) represents proximity to mapped ponds, which constitute important potential water sources in the karst mountain environment. Access to such water sources may have influenced habitation, pastoral activity, and seasonal occupation [5,21,42,43].
Distance to mountain paths/roads (DR) measures the distance to the mapped mountain path and road network and was used as an indicator of landscape accessibility. Proximity to communication routes may have influenced habitation, pastoral infrastructure, movement, and the spatial distribution of archaeological remains [44].
Least-cost distance to the coast (LCDC) represents terrain-mediated accessibility from the coast. Slope was transformed into a walking-cost surface, with walking speeds constrained between 0.5 and 6.0 km h⁻¹ and accumulated least-cost travel time was calculated from the coastline [44,45].
Density of speleological objects (DSO) represents the spatial concentration of known caves and other speleological features [46]. Cave-rich areas provide potential shelter, water-related resources, or other archaeologically relevant activity spaces, although the pattern can also reflect differences in survey intensity.
Climatic criteria
Heat Load Index (HLI) was derived from slope and aspect to represent relative topographic heat exposure [47]. It captures differences in thermal conditions that influence snow persistence, soil moisture, vegetation, and the seasonal suitability of mountain areas for human occupation.
General Wind Shelter Index (GWSI) represents topographic shelter from wind independent of a single dominant direction [48]. Sheltered locations may provide more favourable conditions for habitation, livestock management, and outdoor activity by reducing wind exposure and associated thermal stress.
2.2.2. Reference Data Design
The reference dataset comprised 804 manually delineated reference polygons: 447 locations interpreted as habitation-related TRUE cases (e.g. remains of stone-built houses, shepherds’ dwellings and seasonal pastoral settlements) and 357 surveyed FALSE cases without evidence of habitation (Figure 3). The FALSE class intentionally included not only clearly unsuitable terrain (e.g. steep cliffs, gullies and deep dolines) but also surveyed locations that appeared environmentally plausible yet lacked known habitation evidence. This design reduced the risk that the models would learn only an artificial contrast between archaeological locations and inherently unsuitable for habitation. Criterion values were extracted for each polygon as exact area-weighted raster-cell means, producing a complete 21-variable modelling table.
Before any criterion screening or model development, the reference dataset was divided into spatially stratified training and independent-validation subsets using a 70:30 split. A regular 2 km spatial grid was used to distribute both classes throughout the study area while retaining the target class proportions. The training subset contained 563 polygons (313 TRUE and 250 FALSE), and the independent validation subset contained 241 polygons (134 TRUE and 107 FALSE). The validation subset was then sealed and was not used for criterion screening, response standardization, AHP weighting, machine-learning tuning, model fitting, or threshold selection.
2.2.3. Training-Only Criterion Diagnostics, Response Curves and Sensitivity Analysis
Criterion relevance and potential redundancy were assessed exclusively using the 563 polygons of the training reference subset. Individual criteria were evaluated in terms of their ability to distinguish habitation-related TRUE locations from FALSE locations using descriptive statistics, univariate discrimination measures, and a fixed five-fold spatial cross-validation procedure. Potential redundancy among predictors was examined using rank correlations, with aspect treated as a circular variable. Correlation was used as a diagnostic rather than as an automatic criterion-exclusion rule.
Spatially cross-validated response curves were subsequently derived for each criterion to characterise the form of its relationship with habitation suitability. These empirical relationships, together with the observed training-data distributions and the geoarchaeological interpretation of individual variables, were used to define transparent criterion-specific GIS-MCDA membership functions. All 21 criteria were standardised to a common 0–1 suitability scale using linear, optimum-based, circular, or nonlinear functions depending on the observed response and the expected underlying environmental process.
2.2.4. GIS-MCDA Modelling
Two different GIS-MCDA models were constructed from the standardised geoarchaeological criteria. The Equal-Weight model (EW GIS-MCDA) assigned an identical weight to each of the 21 criteria:
Accordingly, habitation suitability at location was calculated as:
where denotes the standardised suitability value of criterion at location .
The second GIS-MCDA model was based on the Analytic Hierarchy Process (AHP), one of the most used methods for criteria weighting in GIS-MCDA [51,52,53,54]. Pairwise judgments were defined independently of the training AUC values and without access to the independent validation data. Comparisons were first conducted among the four thematic groups and subsequently among the criteria within each group. The final group weights were 41.55% for morphometric criteria, 29.26% for archaeological criteria, 18.49% for hydrogeomorphological criteria, and 10.70% for climate criteria. The five largest individual criterion weights were assigned to DR (13.32%), SLO (12.84%), TRI (8.50%), DSO (7.69%), and LSF (7.67%). All pairwise comparison matrices satisfied the conventional consistency requirement, with a maximum consistency ratio of 0.0263.
The final AHP suitability surface was calculated as:
with the criterion weights constrained to sum to one:
2.2.5. Predictive Machine-Learning Modelling
RF and XGBoost were implemented as complementary nonlinear predictive models using the same 21 criteria employed in the GIS-MCDA analysis. Unlike the GIS-MCDA models, the machine-learning models were trained on the original harmonized criterion values rather than the standardized 0–1 suitability score. Because aspect is a circular variable, ASP was represented by its sine and cosine components:
This transformation produced 22 numerical model features while preserving the original set of 21 conceptual criteria.
Both algorithms were tuned exclusively within the fixed five-fold spatial cross-validation design. For RF, 24 predefined combinations of and minimum node size were evaluated, with 1000 trees grown per forest. The selected RF configuration was:
For XGBoost, 24 predefined combinations of learning rate (), maximum tree depth, minimum child weight, and number of boosting rounds were evaluated. The remaining sampling and regularization parameters were fixed as follows:
The selected XGBoost configuration was:
Criterion importance was evaluated by permutation within the held-out spatial folds. For each original criterion, deterioration in predictive performance after permutation was quantified as the increase in Brier score and the reduction in AUC. The sine and cosine components of ASP were permuted jointly so that aspect remained a single conceptual predictor. Finally, RF and XGBoost were refitted using all 563 training polygons and their locked hyperparameters and then applied to the harmonized raster stack. The resulting probability surfaces were restricted to the same common analysis mask as the GIS-MCDA models and checked for consistent raster geometry, valid-cell count, and the expected probability range:
2.2.6. Independent Validation and Spatial Robustness Assessment
Only after all four habitation suitability models had been finalized was the independent 30% validation dataset used for their accuracy evaluation. Mean model scores were extracted for the 241 validation polygons using exact polygon–cell overlap. Model discrimination was assessed using receiver operating characteristic (ROC) curves and area under the curve (AUC) values with 95% DeLong confidence intervals. The AUC direction was specified a priori so that higher scores represented the TRUE class, and scores were not reversed after inspection of the validation results.
Because all models were evaluated using the same validation polygons, pairwise differences in AUC were tested using paired DeLong tests. Holm correction was applied across the six pairwise model comparisons. RF and XGBoost were additionally evaluated as probabilistic models using the Brier score, log-loss, calibration intercept, and calibration slope. These calibration metrics were not applied to the GIS-MCDA outputs because their 0–1 values represent suitability indices rather than calibrated event probabilities. No classification threshold was derived from the validation data.
A supplementary spatial robustness analysis examined whether model performance was sensitive to the distance between the independent validation polygons and the training data. The minimum polygon-to-polygon Euclidean distance between each validation polygon and the 563 training polygons was calculated in EPSG:3765. Two distance-restricted validation subsets were defined a priori: polygons located ≥250 m and ≥500 m from the nearest training polygon. ROC analysis was performed only when at least ten observations were available in each response class. Consequently, the ≥500 m subset was retained as a sample-size diagnostic but was not used for AUC estimation when too few TRUE cases remained.
3. Results
3.1. Criterion Relevance, Redundancy and Response Structure
Training-only spatial cross-validation showed clear differences in the standalone discriminatory power of the 21 criteria (Table 1). Overall, terrain morphology, accessibility, and climate criteria provided the strongest individual separation between TRUE and FALSE reference polygons, whereas several hydrogeomorphological and resource-proximity criteria showed comparatively weak standalone discrimination. However, low univariate performance was not considered sufficient justification for criterion exclusion, as predictors with limited individual discriminatory power may still contribute useful information through nonlinear effects and interactions within multivariate models [55,56].
Redundancy analysis identified several strongly correlated predictor pairs, particularly among terrain-structure and exposure-related variables, indicating partial overlap in the environmental information represented by individual criteria. Correlation was likewise treated as a diagnostic rather than an automatic exclusion criterion, because related predictors may contribute differently to GIS-MCDA standardisation and nonlinear machine-learning models. Accordingly, all 21 criteria were retained for subsequent habitation suitability modelling.
3.2. Accuracy of Habitation Suitability Models
Four habitation suitability models were produced for Biokovo Nature Park: two GIS-MCDA models based on Equal Weight (EW GIS-MCDA) and the Analytic Hierarchy Process (AHP GIS-MCDA), and two machine-learning models based on RF and XGBoost. Although all four models identified broadly similar areas of favorable and unfavorable terrain, the machine-learning outputs showed a more spatially contrasted pattern, with high-suitability areas more sharply separated from the surrounding landscape (Figure 4).
All four models showed strong discrimination between habitation-related TRUE locations and FALSE locations (Figure 5; Table 2). The two machine-learning models achieved the highest predictive accuracy, with XGBoost reaching an AUC of 0.9886 and RF an AUC of 0.9876. Their confidence intervals largely overlapped, and the difference between them was not statistically significant, indicating essentially equivalent discriminatory performance.
The GIS-MCDA models also performed well, although their accuracy was lower than that of the machine-learning approaches. The AHP model achieved an AUC of 0.9447, compared with 0.9152 for the Equal-Weight model. Pairwise statistical comparisons confirmed that AHP performed significantly better than Equal Weight, while both RF and XGBoost significantly outperformed the two GIS-MCDA models. These results indicate that structured expert weighting improved predictive performance relative to simple equal weighting, while nonlinear machine-learning algorithms provided a further increase in discrimination.
Probability-based performance measures (Brier score and log-loss), which are applicable only to the RF and XGBoost outputs, also slightly favored XGBoost (Table 2). However, the difference between the two algorithms was small, reinforcing the conclusion that both models provided similarly strong predictive performance.
Supplementary distance-based validation was used to examine whether the high model accuracy could be explained primarily by validation locations situated close to the training data. Restricting the analysis to validation polygons located at least 250 m from the nearest training polygon did not reduce model discrimination, with the relative ranking of the four models remaining unchanged. This provides additional evidence that the high validation accuracy was not driven solely by spatial proximity between training and validation samples. At distances of at least 500 m, however, too few TRUE cases remained for reliable ROC analysis. The independent 241-polygon validation dataset therefore remains the primary measure of model accuracy, while the distance-restricted analysis provides supplementary evidence of spatial robustness.
3.3. Final Habitation Suitability Model of Biokovo Nature Park
Based on the independent validation results, the XGBoost model was selected as the final spatial representation of habitation suitability in Biokovo Nature Park (Figure 6). The continuous model output was classified into five suitability classes using Jenks natural breaks classification: very low, low, medium, high, and very high. Of the approximately 193.17 km² modelled area, 120.77 km² (62.52%) was classified as very low suitability, 24.92 km² (12.90%) as low suitability, 15.17 km² (7.85%) as medium suitability, 13.27 km² (6.87%) as high suitability, and 19.03 km² (9.85%) as very high suitability. Thus, very low and low suitability together accounted for approximately 75.42% of the modelled area, indicating that most of Biokovo represents environmentally demanding terrain with limited potential for habitation. In contrast, high and very high suitability cover only 16.72% of the study area.
The final model indicates that favourable habitation environments on Biokovo are relatively scarce and occur as a discontinuous network of spatially restricted patches embedded within a predominantly unsuitable mountain karst landscape. The pronounced dominance of very low suitability reflects the generally harsh geomorphological conditions of the massif, where steep slopes, high terrain ruggedness, exposed ridges, and strongly dissected karst terrain constrain the availability of locations suitable for habitation. Very low and low suitability predominated particularly along the steep southwestern exposed ridges and highly dissected slopes. In contrast, high and very high suitability occurred in smaller, spatially fragmented patches, mainly within the interior karst plateau and on locally gentler terrain.
4. Discussion
4.1. Spatial Patterns and Environmental Controls of Habitation Suitability
The results demonstrate that habitation suitability on Biokovo cannot be explained by a single geographical characteristic but rather reflects the combined influence of terrain morphology, accessibility and local climatic conditions. Although individual criteria differed considerably in their discriminatory capacity, slope (SLO), distance to mountain paths and roads (DR), and Heat Load Index (HLI) consistently emerged among the most influential predictors in both machine-learning models. Their consistent importance in both independently tuned algorithms suggests that these relationships are not model-specific.
From an archaeological perspective, this combination is particularly meaningful in a high-mountain karst environment. Slope affects not only the physical suitability of terrain for habitation but also movement, construction, livestock management and the availability of usable surfaces [7]. Accessibility, represented by distance to the mapped network of mountain paths and roads, further emphasises the importance of connectivity within the mountain landscape. Heat load, in turn, reflects local differences in thermal conditions that may influence snow persistence, soil moisture, vegetation and the seasonal suitability of particular locations. Favourable areas were therefore characterised not by a single resource or environmental advantage, but by the convergence of several conditions conducive to repeated or seasonal human activity.
The spatial organisation of these favourable areas further indicates that habitation potential should not be understood as a continuous altitudinal or topographic zone, but rather as a network of localised favourable areas embedded within the karst massif. Suitable locations generally occur as spatially restricted patches separated by considerably more rugged and restrictive terrain. In mountain landscapes, such spatial fragmentation may reflect the organisation of different activities around dispersed but potentially complementary areas rather than within large and continuously occupied settlement zones [58].
In several parts of the mountain, areas of high and very high suitability correspond to landscapes characterised by intensive anthropogenic modification, particularly dense networks of dry-stone structures associated with pastoral land use. Houses, livestock enclosures, walls, paths and other dry-stone constructions represent the material expression of the organisation of mountain space and of the long-term investment required to maintain pastoral activities in a demanding karst environment. Their concentration within these areas suggests repeated use of favourable parts of the mountain for habitation and economic activities.
This spatial organisation is expressed in different forms across the interior karst plateau (Figure 7). In the highest part of the massif around Sveti Jure (Figure 7A), favourable terrain forms a fine-grained mosaic associated with locations such as Studenci, Baškovića staje, Lokva and Radov dolac. In contrast, the Lemišni doci–Plužine–Podglogovik area (Figure 7B) contains a more extensive and spatially coherent concentration of favourable terrain, while Kupušnjak near Vošac (Figure 7C) represents a more elongated and spatially constrained favourable zone within otherwise rugged terrain. Suitable environments on Biokovo therefore occur at different spatial scales and in different topographic settings.
Podglogovik, located within this more extensive favourable zone (Figure 7B), provides a clear example of how modelled suitability corresponds with the archaeological use of mountain space. The earliest documented human activity within this relatively restricted area is represented by a prehistoric necropolis. The same area also contains a pastoral settlement and its associated infrastructure, water sources, sacred structures and communication routes of different periods. The landscape was also repeatedly modified and reinterpreted: the church of St Elijah was constructed on a prehistoric burial mound, while individual tumuli were later reused for observation positions and trenches during the First World War [5]. Podglogovik is therefore significant not only for the density of archaeological remains, but also for the repeated organisation and reuse of the same spatial unit for different purposes.
A comparable pattern can be observed at Lokva, within the fine-grained mosaic of favourable terrain identified in the wider Sveti Jure area (Figure 7A). The prehistoric tumulus situated at approximately 1460 m a.s.l. contained a burial attributed to the Cetina cultural group and radiocarbon dated to 2410–2198 BC, demonstrating that the highest parts of Biokovo were already incorporated into patterns of human mobility and landscape use during the third millennium BC [5,21]. The same tumulus was reused several millennia later for two burials dating to the fourteenth century. The wider landscape around Lokva contains a pond, a clay source, remains of dry-stone structures and enclosed dolines, as well as several speleological objects, including Dusa Ice Pit nearby and Stara ledenica along the communication route between Vošac and Lokva. At Lokva, the repeated use of this broader spatial unit coincides with access to pasture, water, raw materials and communication routes.
Importantly, both the Podglogovik necropolis and the Lokva tumulus are located within areas of very high suitability for human habitation and landscape use. This correspondence should not be interpreted as evidence that burial locations themselves represent habitation sites. Rather, their placement within favourable zones suggests that funerary places formed part of wider landscapes that were accessible and repeatedly used for different economic and social activities. The occurrence of archaeological features from different periods within these same favourable spatial units reflects the long-term importance of particular parts of the mountain, although the character and intensity of their use changed through time.
Figure 8 shows how the modelled patterns correspond with habitation-related features at Lemišni doci, Podglogovik and Lokva, where dwellings, agricultural or pastoral surfaces, pathways and water-related features occur within broader karst micro-landscapes. Their correspondence with high- and very-high-suitability zones indicates that the model identifies broader environmental settings rather than individual settlement locations.
Accessibility was particularly important, with distance to mountain paths and roads among the strongest predictors in the models. This result requires chronological caution because the mapped communication network cannot automatically be considered contemporaneous with all archaeological features included in the analysis. Nevertheless, mountain routes are strongly constrained by topography and frequently follow passes, gentler slopes and naturally accessible corridors [59]. Later paths may therefore preserve or approximate older patterns of movement, or reuse earlier communication corridors, even when direct chronological continuity cannot be demonstrated. Historical evidence from Biokovo also illustrates the importance of such corridors: in the Sveti Jure area, two routes ascending from the coast, one via Lokva and the other via Vošac, converged with paths from Župa, Krstatice and Vrgorac, while an old route documented cartographically in 1968 continued towards Mucića and Crna ledenica ice pits [60].
In the high karst zones of Biokovo, permanent surface water is scarce, and pastoral communities developed multiple strategies for securing water, including the use of ponds, wells, stone troughs and natural depressions. The relatively weak standalone discriminatory capacity of distance to ponds should therefore not be interpreted as evidence that water was unimportant. Rather, it indicates that proximity to mapped ponds alone was insufficient to determine habitation suitability, which depended on the interaction of several geographical characteristics. Historical and ethnographic evidence also documents the use of snow and ice from natural ice pits to supplement conventional water sources during periods of scarcity [60,61,62,63].
Pastoral settlements associated with communities from Župa, Krstatice, Zagvozd, Brela, Bast, Tučepi and Podgora were distributed across the high-mountain landscape, some situated close to speleological objects such as Dusa Ice Pit, Crna ledenica, Mucića ledenica, Jarova rupa and Ledenica pored barake. Pastures, pastoral settlements, communication routes and different water resources thus formed interconnected components of the high-mountain pastoral landscape.
The chronological depth of this evidence requires a distinction between continuity of activity and persistence of spatial significance. The presence of prehistoric burial mounds, medieval burials, pastoral settlements, sacred structures, historical routes and more recent modifications within the same favourable areas does not demonstrate uninterrupted occupation or the continuation of identical practices. Instead, it suggests that particular spatial units were repeatedly selected and reinterpreted by communities with different social and economic requirements [63]. This is particularly evident at Podglogovik and Lokva, where evidence of different forms of activity accumulated over several millennia. Viewed from a longue durée perspective, this recurrent use reflects the interaction between relatively persistent geographical conditions and changing human practices over time [64,65].
The different modelling approaches provide complementary views of the identified spatial pattern. GIS-MCDA provides a transparent representation of the contribution assigned to individual landscape characteristics, whereas Random Forest and XGBoost capture nonlinear relationships and interactions between predictors. Although the machine-learning models achieved significantly higher discriminatory performance than the GIS-MCDA approaches, different modelling approaches converged on broadly comparable spatial patterns and identified several of the same influential predictors. This convergence suggests that the resulting suitability pattern reflects meaningful landscape structure rather than the behaviour of a single modelling technique. Taken together with the archaeological evidence, the results indicate that geographical conditions influenced human choices, while repeated human activity progressively transformed favourable areas into a structured cultural landscape.
5. Conclusions
This study demonstrates the potential of integrating GIS-MCDA and machine-learning approaches for modelling habitation suitability in complex karst mountain landscapes. Based on the results obtained for Biokovo Nature Park, the following conclusions can be drawn:
- The integration of 21 morphometric, hydrogeomorphological, climatic and archaeological criteria with a reference dataset of 804 polygons (447 habitation-related TRUE cases and 357 surveyed FALSE cases) provided a structured framework for identifying environmental conditions associated with past mountain habitation. The separation of training and independent validation datasets ensured that model performance was evaluated on data not used during model development.
- All four developed models showed strong independent discriminatory performance. The AHP GIS-MCDA model (AUC = 0.9447) significantly outperformed the Equal-Weight model (AUC = 0.9152), indicating that structured weighting improved the predictive capability of the GIS-MCDA approach. Machine-learning models achieved substantially higher discrimination, with RF and XGBoost reaching AUC values of 0.9876 and 0.9886, respectively, while their performances were statistically comparable.
- GIS-MCDA provides a transparent representation of criterion standardisation and weighting, whereas RF and XGBoost are better able to capture nonlinear relationships and interactions among environmental variables. Their combined use therefore brings together the interpretability of GIS-MCDA and the higher predictive performance achieved by the machine-learning models.
- The final XGBoost model indicates that favourable habitation environments occupy a relatively limited part of Biokovo. High- and very-high-suitability zones account for only 16.72% of the modelled area and occur mainly as spatially discontinuous patches within the interior karst plateau. Their distribution around dolines, gentler surfaces and other locally favourable micro-landscapes supports an interpretation of Biokovo as a selectively used mountain environment rather than a uniformly occupied landscape. Archaeological evidence from Podglogovik and Lokva further indicates the repeated use of some of these favourable areas in widely separated chronological periods, without implying continuous occupation.
- The resulting suitability model should not be interpreted as a deterministic reconstruction of settlement locations, but as a spatial framework for identifying areas with increased potential for recurrent human use. It can therefore support targeted archaeological prospection, particularly within predicted high- and very-high-suitability areas that have not yet been systematically surveyed. Prospective field validation will be essential for testing its archaeological usefulness and assessing its transferability to other Mediterranean and Dinaric karst mountain environments.
Author Contributions
Conceptualization, S.B., D.Š. and F.D.; methodology, S.B., D.Š. and F.D.; software, F.D.; validation, D.Š. and F.D.; formal analysis, S.B., D.Š. and F.D.; investigation, S.B., D.Š. and F.D.; resources, S.B.; data curation, S.B., D.Š. and F.D.; writing—original draft preparation, S.B., and F.D.; writing—review and editing, S.B., and F.D.; visualization, S.B., D.Š. and F.D.; supervision, S.B.; project administration, S.B.; funding acquisition, S.B. All authors have read and agreed to the published version of the manuscript.
Funding
This research was funded by the European Union – NextGenerationEU through the IceLink project, grant number IP-UNIZD2025-27075. The APC was funded by the European Union – NextGenerationEU through the IceLink project.
Data Availability Statement
The data supporting the findings of this study are available from the corresponding author upon reasonable request.
Acknowledgments
This work was carried out as part of the project IceLink (IP-UNIZD2025-27075, funded by the European Union – NextGenerationEU. The authors gratefully acknowledge Biokovo Nature Park, HPD Biokovo, Rikardo Škorlić (SO HPD Biokovo), SAK Ekstrem Makarska, and the Croatian Mountain Rescue Service (CMRS) for their support and assistance during fieldwork. During the preparation of this study, the authors used ChatGPT Plus to generate certain graphical elements (Figure 2) and to assist with language editing and grammatical correction of the manuscript. The authors have reviewed and edited the output and take full responsibility for the content of this publication.
Conflicts of Interest
The authors declare no conflicts of interest.
Abbreviations
The following abbreviations are used in this manuscript:
| AHP | Analytic Hierarchy Process |
| ASP | Aspect |
| AUC | Area Under the Curve |
| BWSI | Bora Wind Shelter Index |
| CI | Convergence Index |
| DD | Drainage Density |
| DEM | Digital Elevation Model |
| DL | Distance to Ponds (Lokve) |
| DR | Distance to Mountain Paths/Roads |
| DSO | Density of Speleological Objects |
| ELV | Elevation |
| EW | Equal Weight |
| GIS | Geographic Information System |
| GIS-MCDA | Geographic Information System-Based Multicriteria Decision Analysis |
| GWSI | General Wind Shelter Index |
| HLI | Heat Load Index |
| LCDC | Least-Cost Distance to the Coast |
| LiDAR | Light Detection and Ranging |
| LSF | Length-Slope Factor |
| MCDA | Multicriteria Decision Analysis |
| ML | Machine Learning |
| OOF | Out-of-Fold |
| PLAN | Plan Curvature |
| PROF | Profile Curvature |
| RF | Random Forest |
| ROC | Receiver Operating Characteristic |
| SLO | Slope |
| SPI | Stream Power Index |
| SVF | Sky View Factor |
| TPI | Topographic Position Index |
| TRI | Terrain Ruggedness Index |
| TWI | Topographic Wetness Index |
| XGBoost | Extreme Gradient Boosting |
| JWSI | Jugo Wind Shelter Index |
References
- Della Casa, P.; Walsh, K. Introduction: Interpretation of sites and material culture from mid-high altitude mountain environments. Preist. Alp. 2007, 42, 5–8. [Google Scholar]
- Walsh, K.; Mocci, F. Mobility in the mountains: Late third and second millennia Alpine societies’ engagements with the high-altitude zones in the Southern French Alps. Eur. J. Archaeol. 2011, 14, 88–115. [Google Scholar] [CrossRef]
- Walsh, K. The Archaeology of Mediterranean Landscapes: Human–Environment Interaction from the Neolithic to the Roman Period; Cambridge University Press: Cambridge, UK, 2014. [Google Scholar]
- Hafner, A.; Brunner, M.; Laabs, J. Archaeology of the Alpine space. Research on the foothills, valley systems and high mountain landscapes of the Alps. Vita Antiq. 2017, 9, 16–37. [Google Scholar] [CrossRef]
- Bekavac, S.; Miletić, Ž. Kulturni krajolik Biokova: Reciklaže u kršu; Sveučilište u Zadru: Zadar, Croatia; Javna ustanova „Park prirode Biokovo“, 2024; p. 210 pp. [Google Scholar]
- Fernández Mier, M.; Fernández Fernández, J.; López Gómez, P. Agrarian Archaeology: A Research and Social Transformation Tool. Heritage 2023, 6, 300–318. [Google Scholar] [CrossRef]
- Garcia-Molsosa, A. Mountain Landscapes: The Archaeological Perspective. In Archaeology of Mountain Landscapes: Interdisciplinary Research Strategies of Agro-Pastoralism in Upland Regions; Garcia-Molsosa, A., Ed.; State University of New York Press: Albany, NY, USA, 2023; pp. 1–17. [Google Scholar] [CrossRef]
- Anschuetz, K.F.; Wilshusen, R.H.; Scheick, C.L. An Archaeology of Landscapes: Perspectives and Directions. J. Archaeol. Res. 2001, 9, 157–211. [Google Scholar] [CrossRef]
- Knapp, A.B.; Ashmore, W. Archaeological Landscapes: Constructed, Conceptualized, Ideational. In Archaeologies of Landscape: Contemporary Perspectives; Ashmore, W., Knapp, A.B., Eds.; Blackwell Publishers: Oxford, UK, 1999; pp. 1–30. [Google Scholar]
- Biagi, P.; Starnini, E.; Efstratiou, N.; Nisbet, R.; Hughes, P.D.; Woodward, J.C. Mountain Landscape and Human Settlement in the Pindus Range: The Samarina Highland Zones of Western Macedonia, Greece. Land 2023, 12, 96. [Google Scholar] [CrossRef]
- de Vingo, P.; Merlini, V.; Biagi, P.; Starnini, E.; Efstratiou, N. Pottery as an Indicator of Mountain Landscape Exploitation: An Example from the Northern Pindos Range of Western Macedonia (Greece). Heritage 2025, 8, 500. [Google Scholar] [CrossRef]
- Ford, D.C.; Williams, P. Karst Hydrogeology and Geomorphology; Wiley: Chichester, UK, 2007. [Google Scholar]
- Štrba, Ľ.; Lukáč, M. Geocultural Heritage and Geocultural Sites: Interpreting Geoheritage–Cultural Heritage Relationships Through a Management Matrix Framework. Heritage 2026, 9, 182. [Google Scholar] [CrossRef]
- Li, G.; Dong, J.; Che, M.; Wang, X.; Fan, J.; Dong, G. GIS and Machine Learning Models Target Dynamic Settlement Patterns and Their Driving Mechanisms from the Neolithic to Bronze Age in the Northeastern Tibetan Plateau. Remote Sens. 2024, 16, 1454. [Google Scholar] [CrossRef]
- Wang, Y.; Shi, X.; Oguchi, T. Archaeological Predictive Modeling Using Machine Learning and Statistical Methods for Japan and China. ISPRS Int. J. Geo-Inf. 2023, 12, 238. [Google Scholar] [CrossRef]
- Kvamme, K.L. The Fundamental Principles and Practice of Predictive Archaeological Modeling. In Mathematics and Information Science in Archaeology: A Flexible Framework; Voorrips, A., Ed.; Holos-Verlag: Bonn, Germany, 1990; pp. 257–295. [Google Scholar]
- Wheatley, D.; Gillings, M. Spatial Technology and Archaeology: The Archaeological Applications of GIS; Taylor & Francis: London, UK, 2002. [Google Scholar] [CrossRef]
- Verhagen, P.; Whitley, T.G. Integrating Archaeological Theory and Predictive Modeling: A Live Report from the Scene. J. Archaeol. Method Theory 2012, 19, 49–100. [Google Scholar] [CrossRef]
- Banerjee, R.; Srivastava, P.K.; Pike, A.W.G.; Petropoulos, G.P. Identification of Painted Rock-Shelter Sites Using GIS Integrated with a Decision Support System and Fuzzy Logic. ISPRS Int. J. Geo-Inf. 2018, 7, 326. [Google Scholar] [CrossRef]
- Conolly, J.; Lake, M. Geographical Information Systems in Archaeology; Cambridge University Press: Cambridge, UK, 2006. [Google Scholar] [CrossRef]
- Bekavac, S.; Miletić, Ž. Biokovo – Lokva. Situ 2024, 1, 64–71. [Google Scholar] [CrossRef]
- Telbisz, T.; Dragušica, H.; Nagy, B. Doline Morphometric Analysis and Karst Morphology of Biokovo Mt (Croatia) Based on Field Observations and Digital Terrain Analysis. Hrvat. Geogr. Glas. 2009, 71, 2–22. [Google Scholar] [CrossRef]
- Velić, J.; Velić, I.; Kljajo, D.; Protrka, K.; Škrabić, H.; Špoljar, Z. An Geological Overview of Glacial Accumulation and Erosional Occurrences at the Velebit and the Biokovo Mts., Croatia. Rud.-Geol.-Naft. Zb. 2017, 32, 77–96. [Google Scholar] [CrossRef]
- Matić, N.; Maldini, K.; Cuculić, V.; Frančišković-Bilinski, S. Investigations of karstic springs of the Biokovo Mt from the Dinaric karst of Croatia. Geochemistry 2012, 72, 179–190. [Google Scholar] [CrossRef]
- Penzar, I.; Penzar, B. Weather and climate of the Biokovo region. Acta Biokov. 1995, 7, 115–126. [Google Scholar]
- Magaš, D.; Juračić, M.; Halamić, J.; Bočić, N.; Faivre, S.; Lončar, N.; Ternjej, I. VELIKA GEOGRAFIJA HRVATSKE 2, FIZIČKA GEOGRAFIJA HRVATSKE-PRIRODNO-GEOGRAFSKA OSNOVA RAZVOJA; Zagreb: Sveučilište u Zadru, Odjel za geografiju, Zadar: Zadar; Školska knjiga: doo, Zagreb, 2023. [Google Scholar]
- State Geodetic Administration. LiDAR-Derived Digital Terrain Model (DTM) of Croatia; 1 m Spatial Resolution; State Geodetic Administration: Zagreb, Croatia, 2023. [Google Scholar]
- Mihoci, I.; Hršak, V.; Kučinić, M.; Mičetić Stanković, V.; Delić, A.; Tvrtković, N. Butterfly diversity and biogeography on the Croatian karst mountain Biokovo: Vertical distribution and preference for altitude and aspect? Eur. J. Entomol. 2011, 108, 623–633. [Google Scholar] [CrossRef]
- Zevenbergen, L.W.; Thorne, C.R. Quantitative analysis of land surface topography. Earth Surf. Process. Landf. 1987, 12, 47–56. [Google Scholar] [CrossRef]
- Parow-Souchon, H.; Zickel, M.; Manner, H. Upper Palaeolithic sites and where to find them: A predictive modelling approach to assess site expectancy in the Southern Levant. Quat. Int. 2022, 635, 53–72. [Google Scholar] [CrossRef]
- Kranjčić, N.; Šiško, D.; Đurin, B.; Cetl, V. A Determination of Suitable Zones for Settlements Based on Multi-Criteria Analysis: A Case Study of Goranci (Bosnia and Herzegovina). Sustainability 2025, 17, 10508. [Google Scholar] [CrossRef]
- McCune, B.; Keon, D. Equations for potential annual direct incident radiation and heat load. J. Veg. Sci. 2002, 13, 603–606. [Google Scholar] [CrossRef]
- Zakšek, K.; Oštir, K.; Kokalj, Ž. Sky-View Factor as a Relief Visualization Technique. Remote Sens. 2011, 3, 398–415. [Google Scholar] [CrossRef]
- De Reu, J.; Bourgeois, J.; Bats, M.; Zwertvaegher, A.; Gelorini, V.; De Smedt, P.; Chu, W.; Antrop, M.; De Maeyer, P.; Finke, P.; Van Meirvenne, M.; Verniers, J.; Crombé, P. Application of the topographic position index to heterogeneous landscapes. Geomorphology 2013, 186, 39–49. [Google Scholar] [CrossRef]
- Riley, S.J.; DeGloria, S.D.; Elliot, R. A Terrain Ruggedness Index That Quantifies Topographic Heterogeneity. Intermt. J. Sci. 1999, 5, 23–27. [Google Scholar]
- Horton, R.E. Erosional development of streams and their drainage basins: Hydrophysical approach to quantitative morphology. Geol. Soc. Am. Bull. 1945, 56, 275–370. [Google Scholar] [CrossRef]
- Reszler, C.; Komma, J.; Stadler, H.; Strobl, E.; Blöschl, G. A propensity index for surface runoff on a karst plateau. Hydrol. Earth Syst. Sci. 2018, 22, 6147–6161. [Google Scholar] [CrossRef]
- Thommeret, N.; Bailly, J.-S.; Puech, C. Extraction of thalweg networks from DTMs: Application to badlands. Hydrol. Earth Syst. Sci. 2010, 14, 1527–1536. [Google Scholar] [CrossRef]
- Moore, I.D.; Burch, G.J. Physical basis of the length-slope factor in the Universal Soil Loss Equation. Soil Sci. Soc. Am. J. 1986, 50, 1294–1298. [Google Scholar] [CrossRef]
- Moore, I.D.; Grayson, R.B.; Ladson, A.R. Digital terrain modelling: A review of hydrological, geomorphological, and biological applications. Hydrol. Process. 1991, 5, 3–30. [Google Scholar] [CrossRef]
- Beven, K.J.; Kirkby, M.J. A physically based, variable contributing area model of basin hydrology. Hydrol. Sci. Bull. 1979, 24, 43–69. [Google Scholar] [CrossRef]
- Aničić, B.; Perica, D. Structural features of cultural landscape in the karst area (Landscape in transition). Acta Carsologica 2003, 32, 173–188. [Google Scholar] [CrossRef]
- Ravbar, N. Local drinking water supply in karst regions. Dela 2010, 34, 223–233. [Google Scholar] [CrossRef]
- Seifried, R.M.; Gardner, C.A.M. Reconstructing historical journeys with least-cost analysis: Colonel William Leake in the Mani Peninsula, Greece. J. Archaeol. Sci. Rep. 2019, 24, 391–411. [Google Scholar] [CrossRef]
- Tobler, W. Three Presentations on Geographical Analysis and Modeling: Non-Isotropic Geographic Modeling; Speculations on the Geometry of Geography; and Global Spatial Analysis; NCGIA Technical Report 93-1; National Center for Geographic Information and Analysis, University of California: Santa Barbara, CA, USA, 1993. [Google Scholar]
- Angelucci, D.E.; Boschian, G.; Fontanals, M.; Pedrotti, A.; Vergès, J.M. Shepherds and karst: The use of caves and rock-shelters in the Mediterranean region during the Neolithic. World Archaeol. 2009, 41, 191–214. [Google Scholar] [CrossRef]
- McCune, B.; Keon, D. Equations for potential annual direct incident radiation and heat load. J. Veg. Sci. 2002, 13, 603–606. [Google Scholar] [CrossRef]
- Winstral, A.; Elder, K.; Davis, R.E. Spatial snow modeling of wind-redistributed snow using terrain-based parameters. J. Hydrometeorol. 2002, 3, 524–538. [Google Scholar] [CrossRef]
- Grisogono, B.; Belušić, D. A review of recent advances in understanding the meso- and microscale properties of the severe Bora wind. Tellus A 2009, 61, 1–16. [Google Scholar] [CrossRef]
- Pasarić, Z.; Belušić, D.; Klaić, Z.B. Orographic influences on the Adriatic sirocco wind. Ann. Geophys. 2007, 25, 1263–1267. [Google Scholar] [CrossRef]
- Domazetović, F.; Šiljeg, A.; Lončar, N.; Marić, I. Development of automated multicriteria GIS analysis of gully erosion susceptibility. Appl. Geogr. 2019, 112, 102083. [Google Scholar] [CrossRef]
- Domazetović, F.; Šiljeg, A.; Lončar, N.; Marić, I. Development of automated multicriteria GIS analysis of gully erosion susceptibility. Appl. Geogr. 2019, 112, 102083. [Google Scholar] [CrossRef]
- Cissé, C. O. T.; Marić, I.; Domazetović, F.; Glavačević, K.; Almar, R. Derivation of coastal erosion susceptibility and socio-economic vulnerability models for sustainable coastal management in Senegal. Sustainability 2024, 16(17), 7422. [Google Scholar] [CrossRef]
- Malczewski, J. GIS-based multicriteria decision analysis: A survey of the literature. Int. J. Geogr. Inf. Sci. 2006, 20, 703–726. [Google Scholar] [CrossRef]
- Guyon, I.; Elisseeff, A. An Introduction to Variable and Feature Selection. J. Mach. Learn. Res. 2003, 3, 1157–1182. [Google Scholar] [CrossRef]
- Yaworsky, P.M.; Vernon, K.B.; Spangler, J.D.; Brewer, S.C.; Codding, B.F. Advancing predictive modeling in archaeology: An evaluation of regression and machine learning methods on the Grand Staircase-Escalante National Monument. PLoS ONE 2020, 15, e0239424. [Google Scholar] [CrossRef] [PubMed]
- Reitmaier-Naef, L.; Bucher, J.; Della Casa, P.; Grutsch, C.O.; Hauptmann, A.; Oberhänsli, M.; Reitmaier, T.; Seifert, M.; Thomas, P.; Turck, R. Montanlandschaft Oberhalbstein – prähistorische Kupferproduktion in Graubünden. Archäol. Schweiz 2022, 45, 4–15. [Google Scholar]
- Tilley, C. A Phenomenology of Landscape: Places, Paths and Monuments; Berg Publishers: Oxford, UK; Providence, RI, USA, 1994. [Google Scholar]
- Buzjak, N.; Bočić, N.; Paar, D.; Bakšić, D.; Dubovečak, V. Ice Caves in Croatia. In Ice Caves; Perșoiu, A., Lauritzen, S.-E., Eds.; Elsevier: Amsterdam, The Netherlands, 2018; pp. 335–369. [Google Scholar] [CrossRef]
- Fortis, A. Viaggio in Dalmazia; Alvise Milocco: Venezia, Italy, 1774; Vols. 1–2. [Google Scholar]
- Kaer, P. Makarska i Primorje. I. Opisni dio; Tiskarski umjetnički zavod „Miriam“: Rijeka, Croatia, 1914. [Google Scholar]
- Poljak, Ž. Hrvatske planine. I. Biokovo. Naše Planin. 1958, 10, 67–80. [Google Scholar]
- Ingold, T. The Temporality of the Landscape. World Archaeol. 1993, 25, 152–174. [Google Scholar] [CrossRef]
- Braudel, F. The Mediterranean and the Mediterranean World in the Age of Philip II; originally published 1949; University of California Press: Berkeley, CA, USA, 1995. [Google Scholar]
- Braudel, F. History and the Social Sciences: The Longue Durée. Rev. Fernand Braudel Cent. 2009, 32, 171–203. [Google Scholar]
Figure 1.
Location and topographic characteristics of Biokovo Nature Park, Croatia: (A) geographical location of the study area and (B) elevation, major peaks, settlements, roads, and mountain paths.
Figure 1.
Location and topographic characteristics of Biokovo Nature Park, Croatia: (A) geographical location of the study area and (B) elevation, major peaks, settlements, roads, and mountain paths.
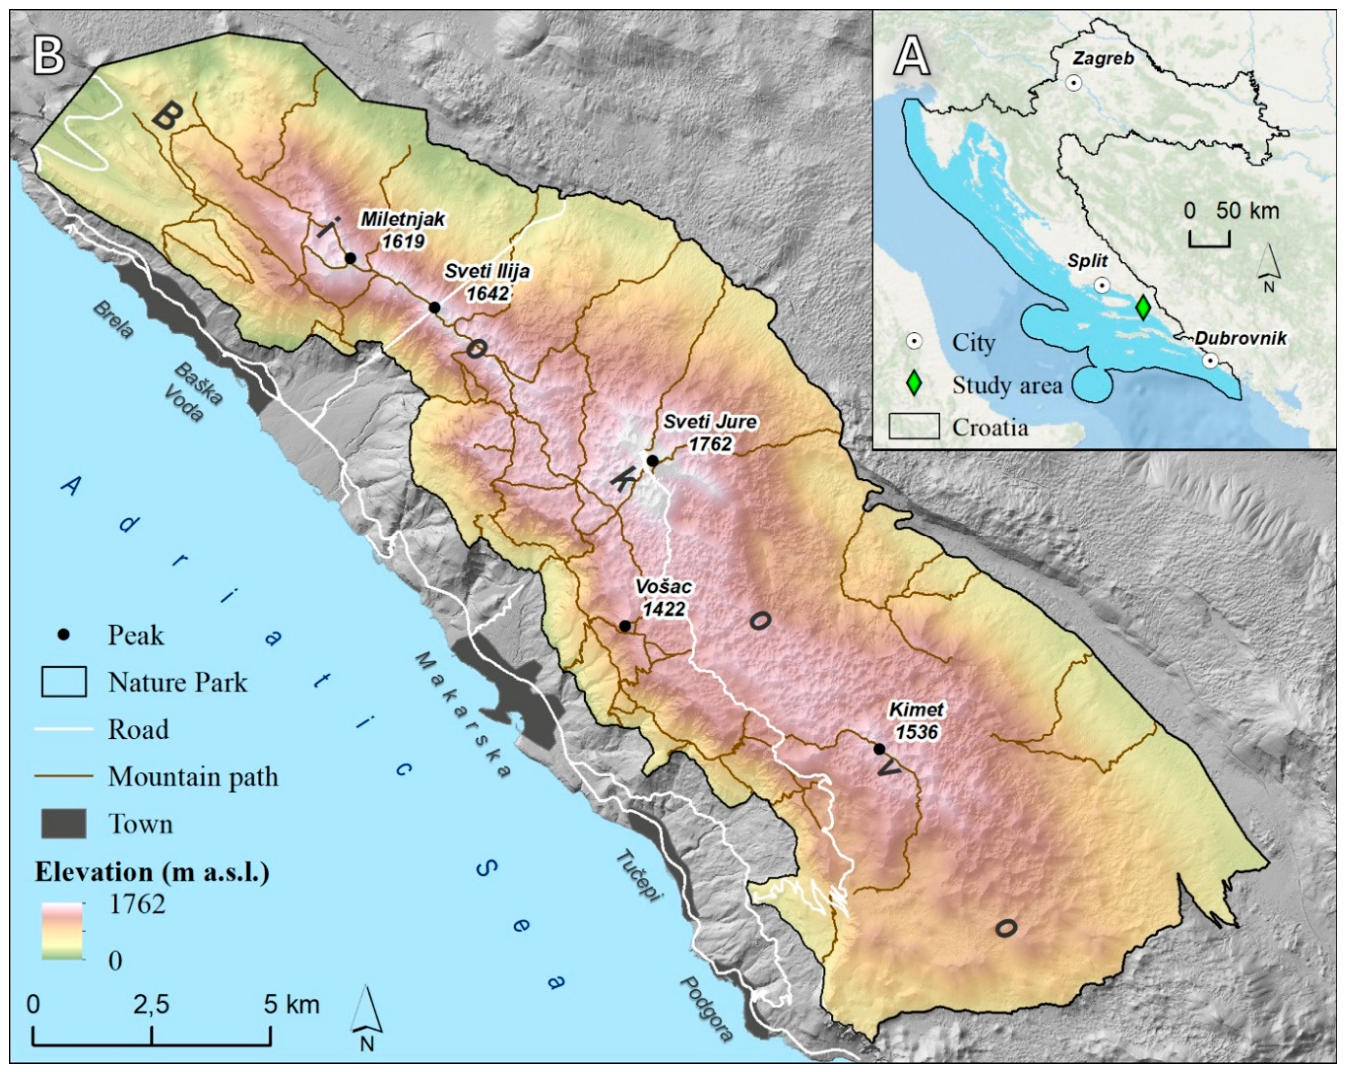
Figure 2.
Schematic overview of the methodological workflow used for GIS-MCDA and ML habitation suitability modelling in Biokovo Nature Park.
Figure 2.
Schematic overview of the methodological workflow used for GIS-MCDA and ML habitation suitability modelling in Biokovo Nature Park.
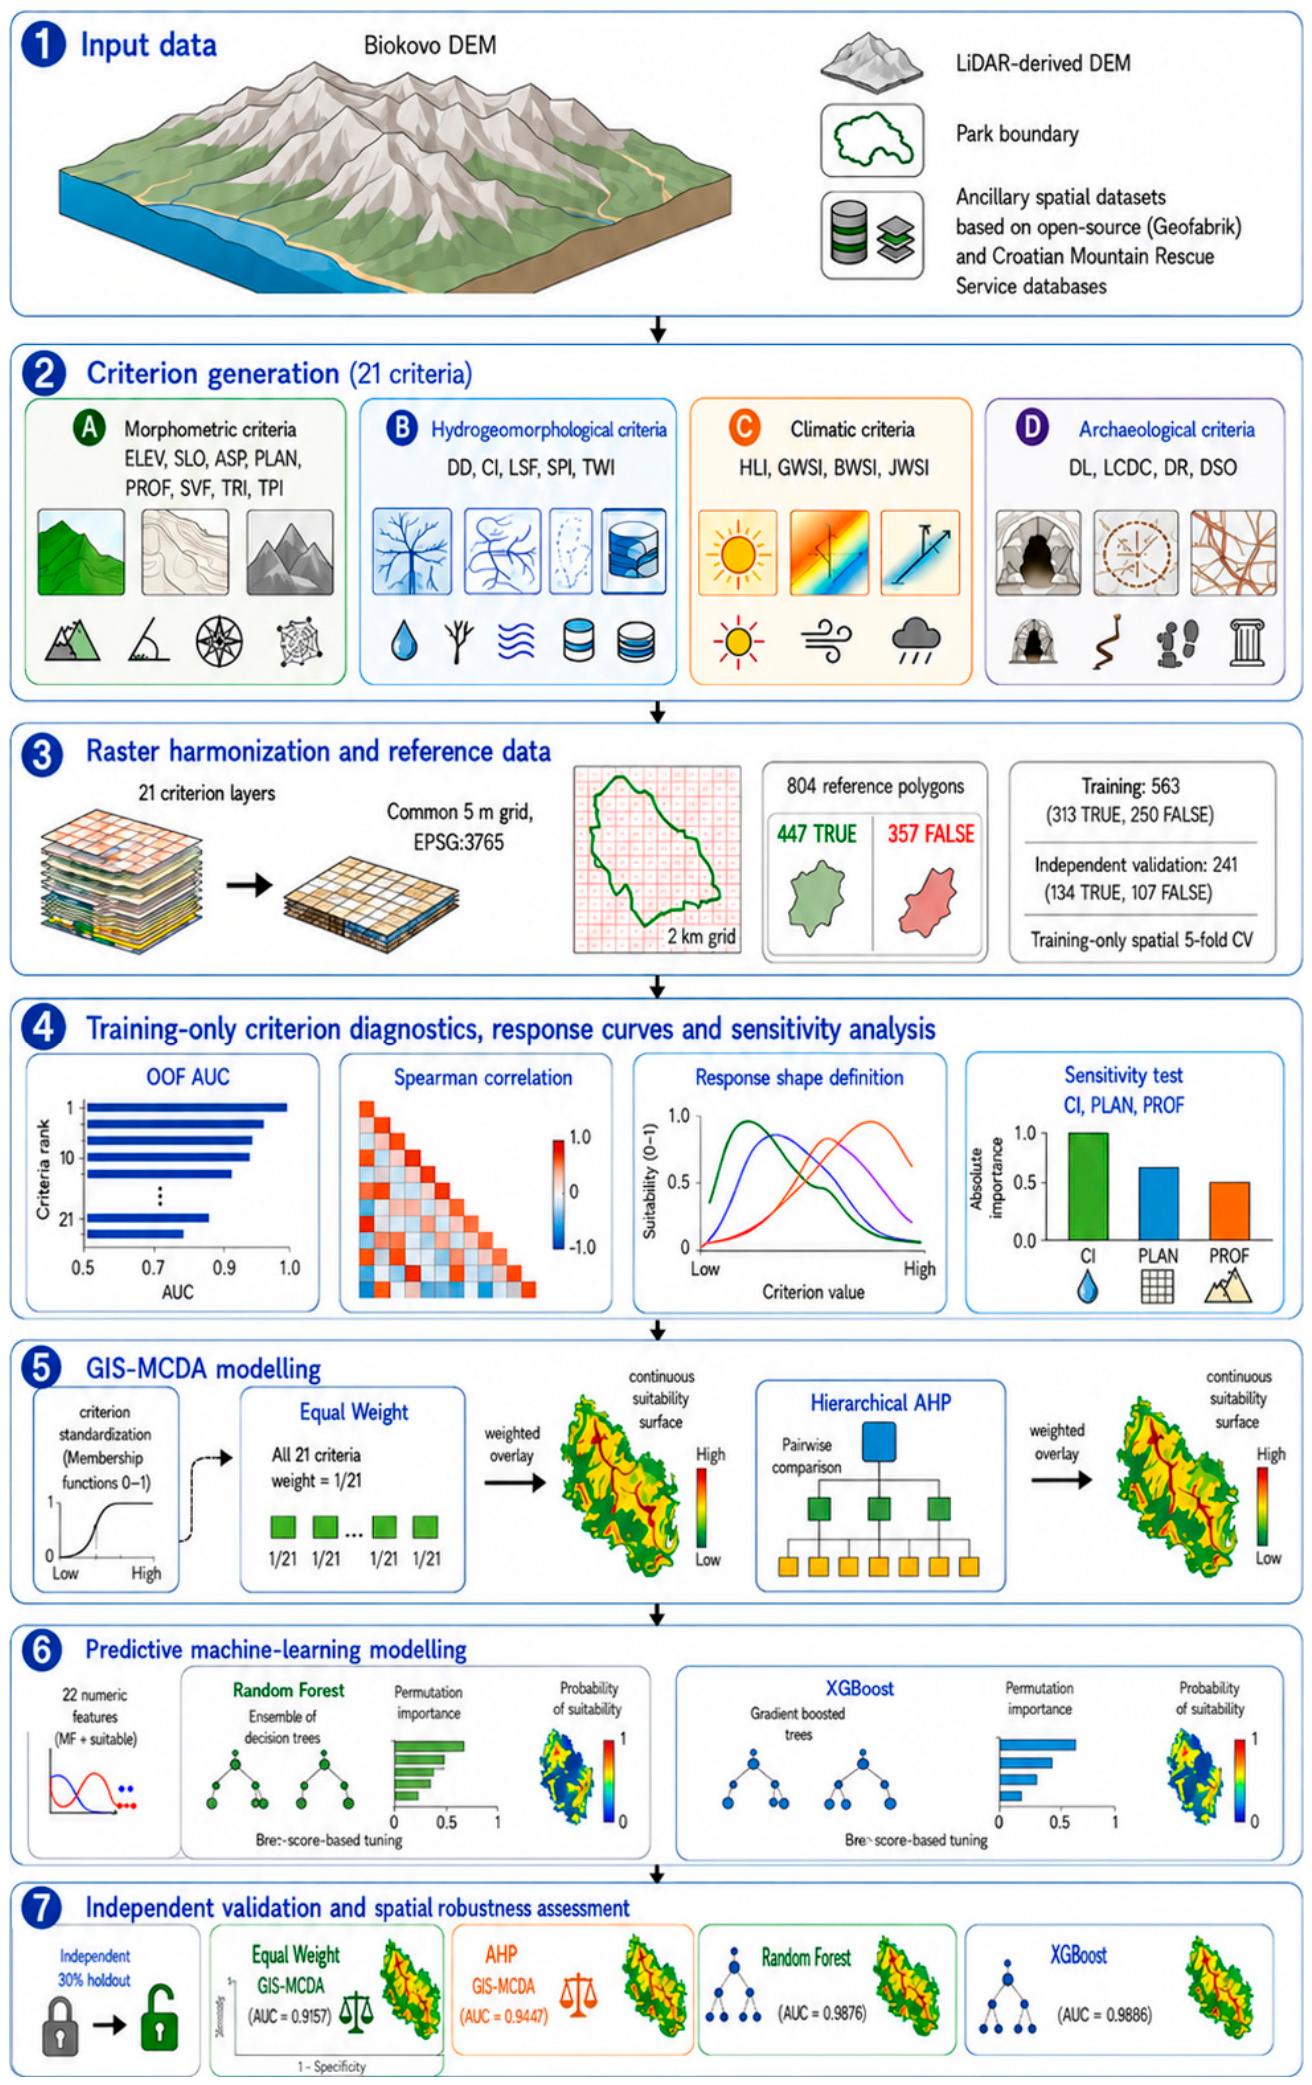
Figure 3.
Manually mapped reference polygons used for training and validation.
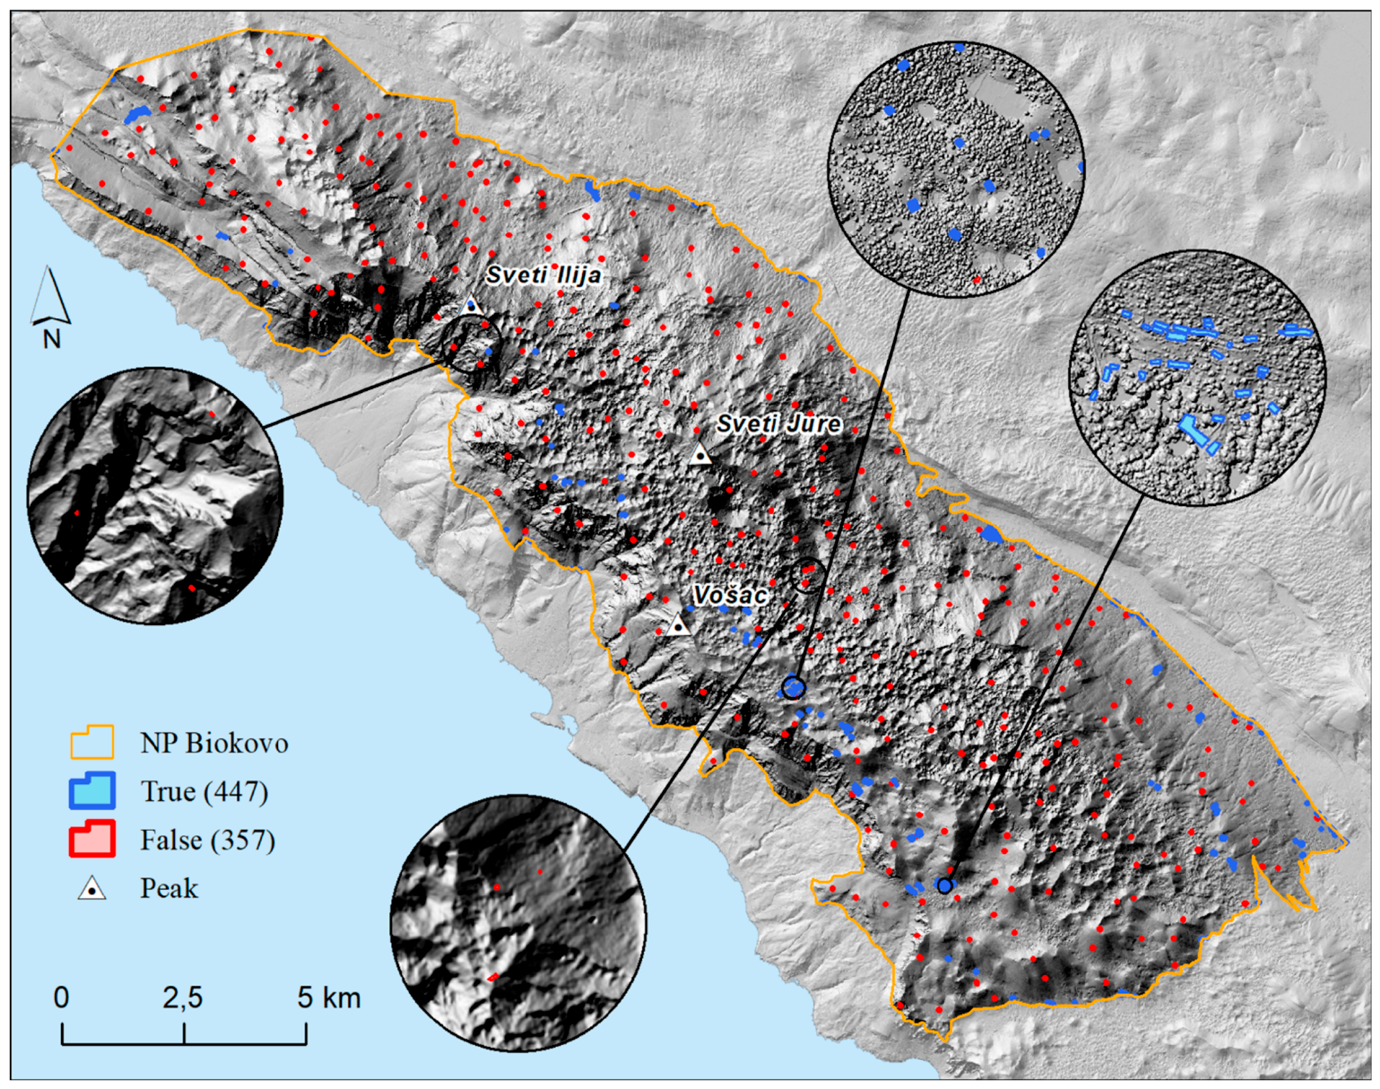
Figure 4.
Spatial distribution of habitation suitability across Biokovo Nature Park represented by the four developed models: EW GIS-MCDA, AHP GIS-MCDA, RF, and XGBoost.
Figure 4.
Spatial distribution of habitation suitability across Biokovo Nature Park represented by the four developed models: EW GIS-MCDA, AHP GIS-MCDA, RF, and XGBoost.
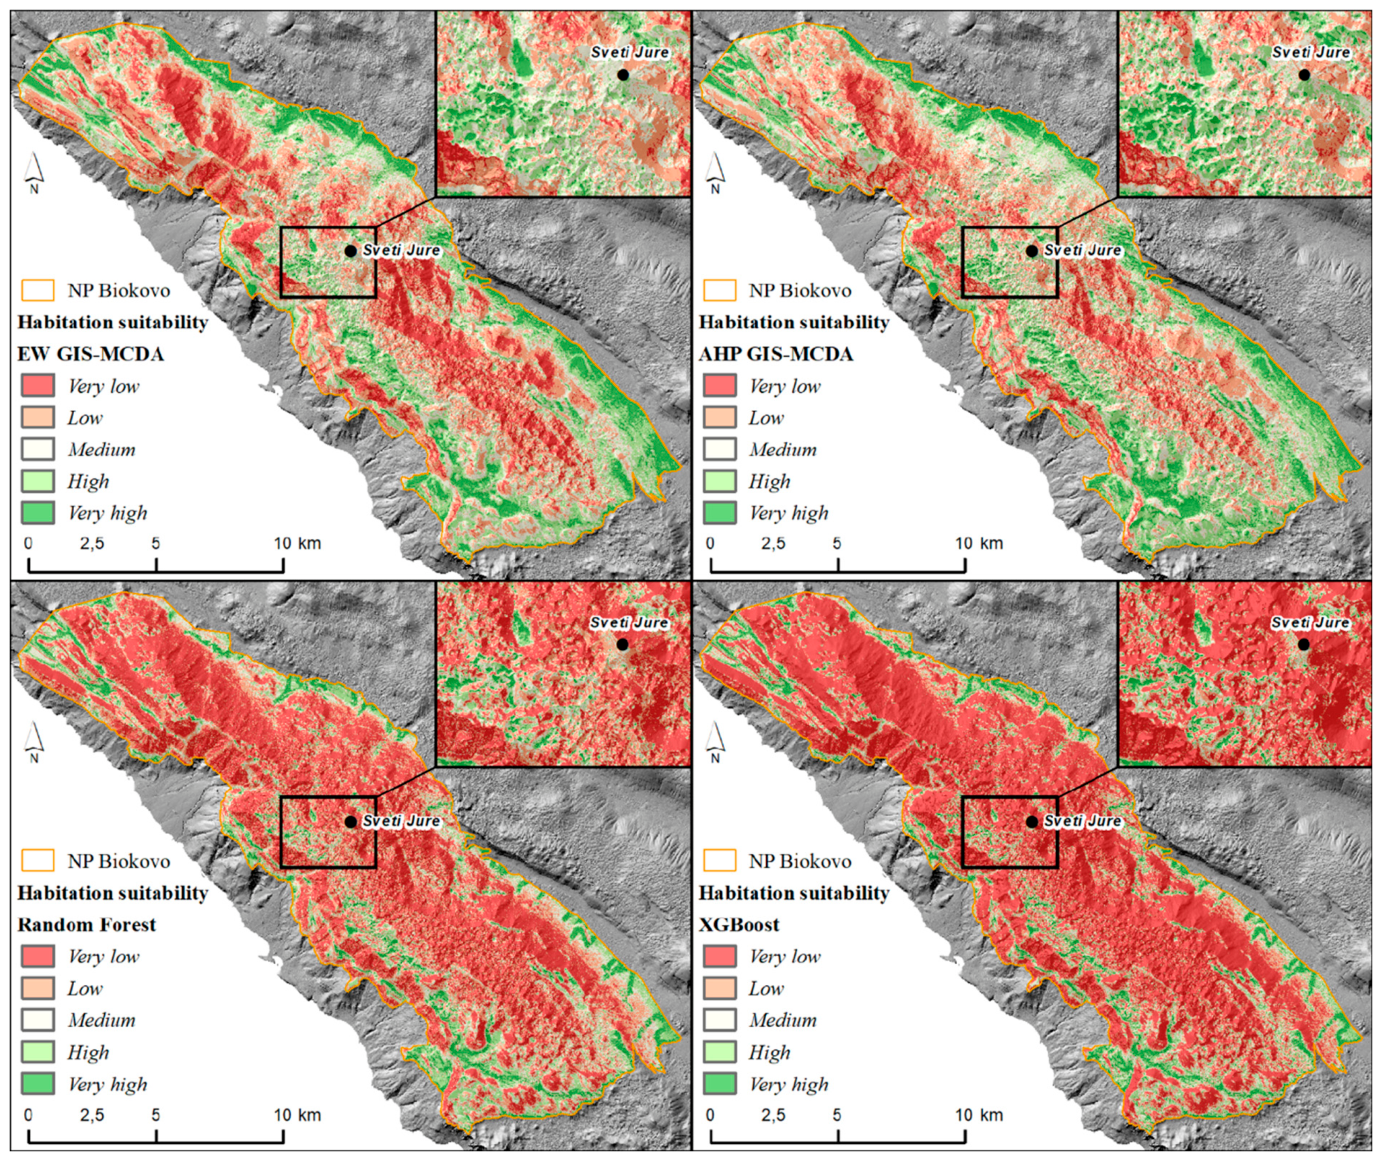
Figure 5.
Independent validation of the four created habitation suitability models. (A) Receiver operating characteristic (ROC) curves based on the independent validation dataset. (B) Area under the curve (AUC) estimates with 95% DeLong confidence intervals.
Figure 5.
Independent validation of the four created habitation suitability models. (A) Receiver operating characteristic (ROC) curves based on the independent validation dataset. (B) Area under the curve (AUC) estimates with 95% DeLong confidence intervals.
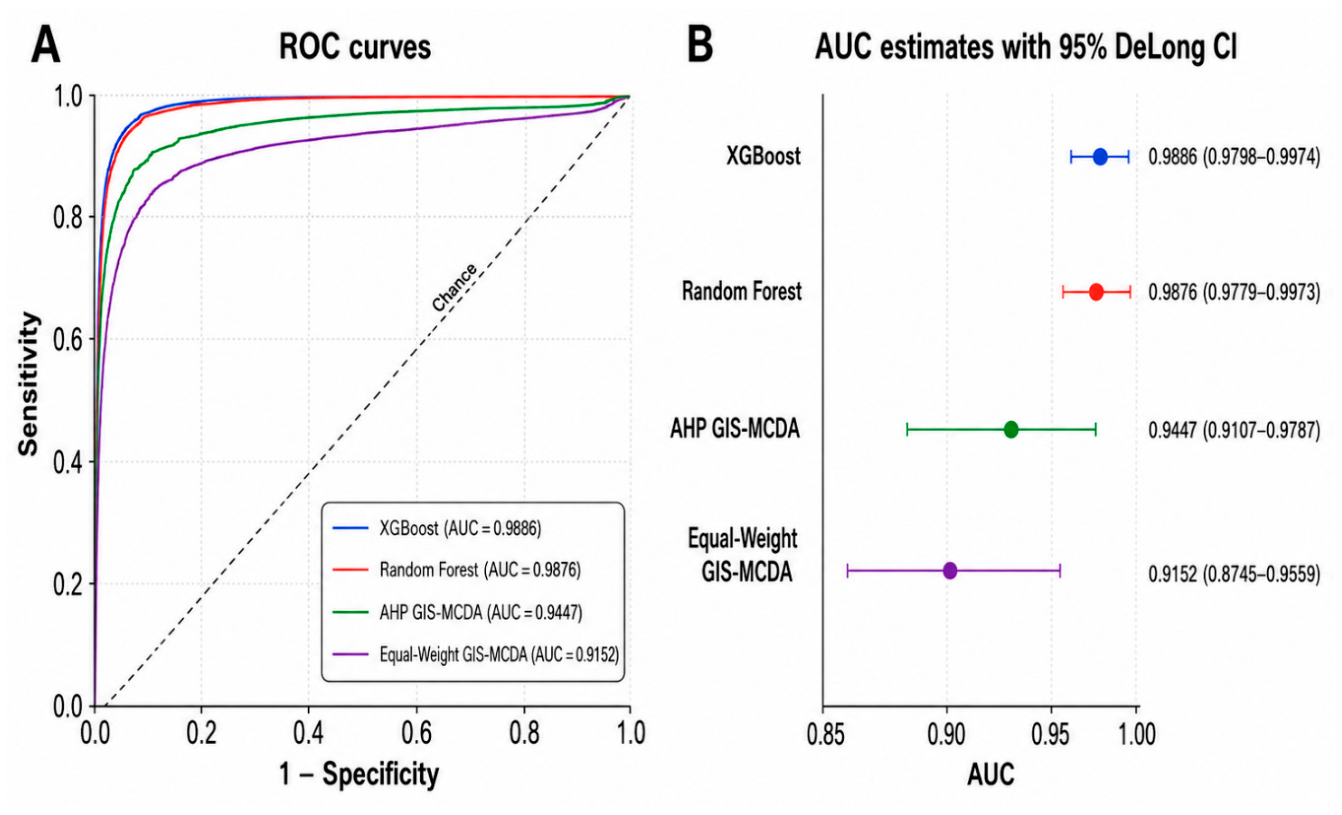
Figure 6.
Final habitation suitability model of Biokovo Nature Park derived from the XGBoost algorithm (ROC AUC = 0.9886).
Figure 6.
Final habitation suitability model of Biokovo Nature Park derived from the XGBoost algorithm (ROC AUC = 0.9886).
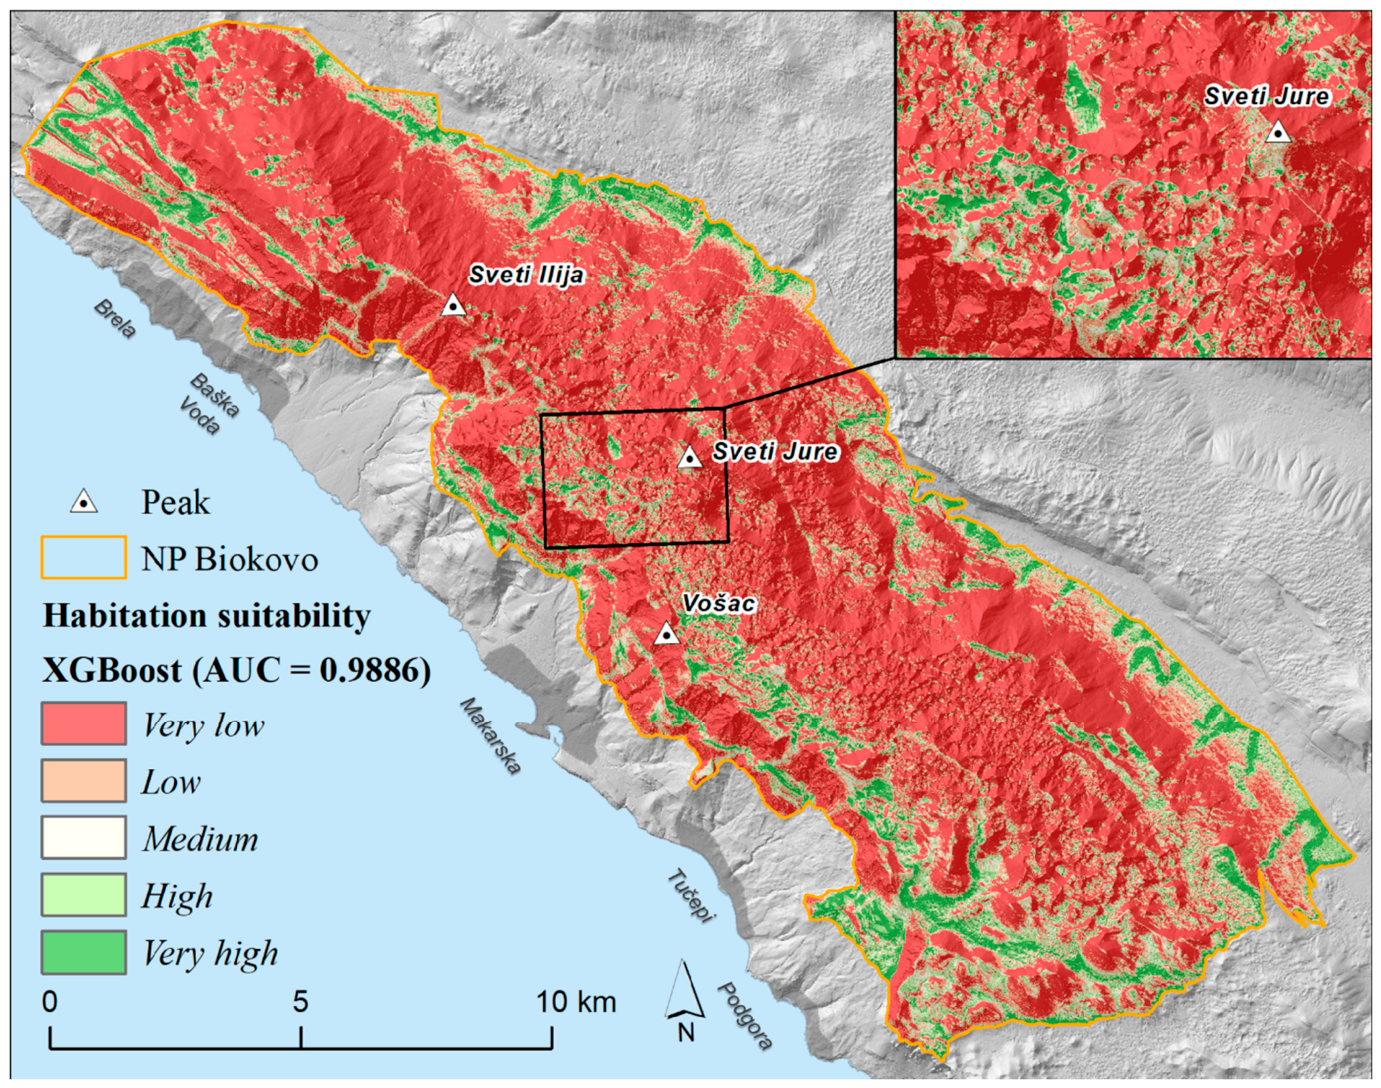
Figure 7.
Representative examples of high and very high habitation suitability within the interior karst plateau of Biokovo Nature Park: (A) the wider Sveti Jure area, (B) the Lemišni doci–Plužine–Podglogovik area, and (C) the Kupušnjak area near Vošac.
Figure 7.
Representative examples of high and very high habitation suitability within the interior karst plateau of Biokovo Nature Park: (A) the wider Sveti Jure area, (B) the Lemišni doci–Plužine–Podglogovik area, and (C) the Kupušnjak area near Vošac.
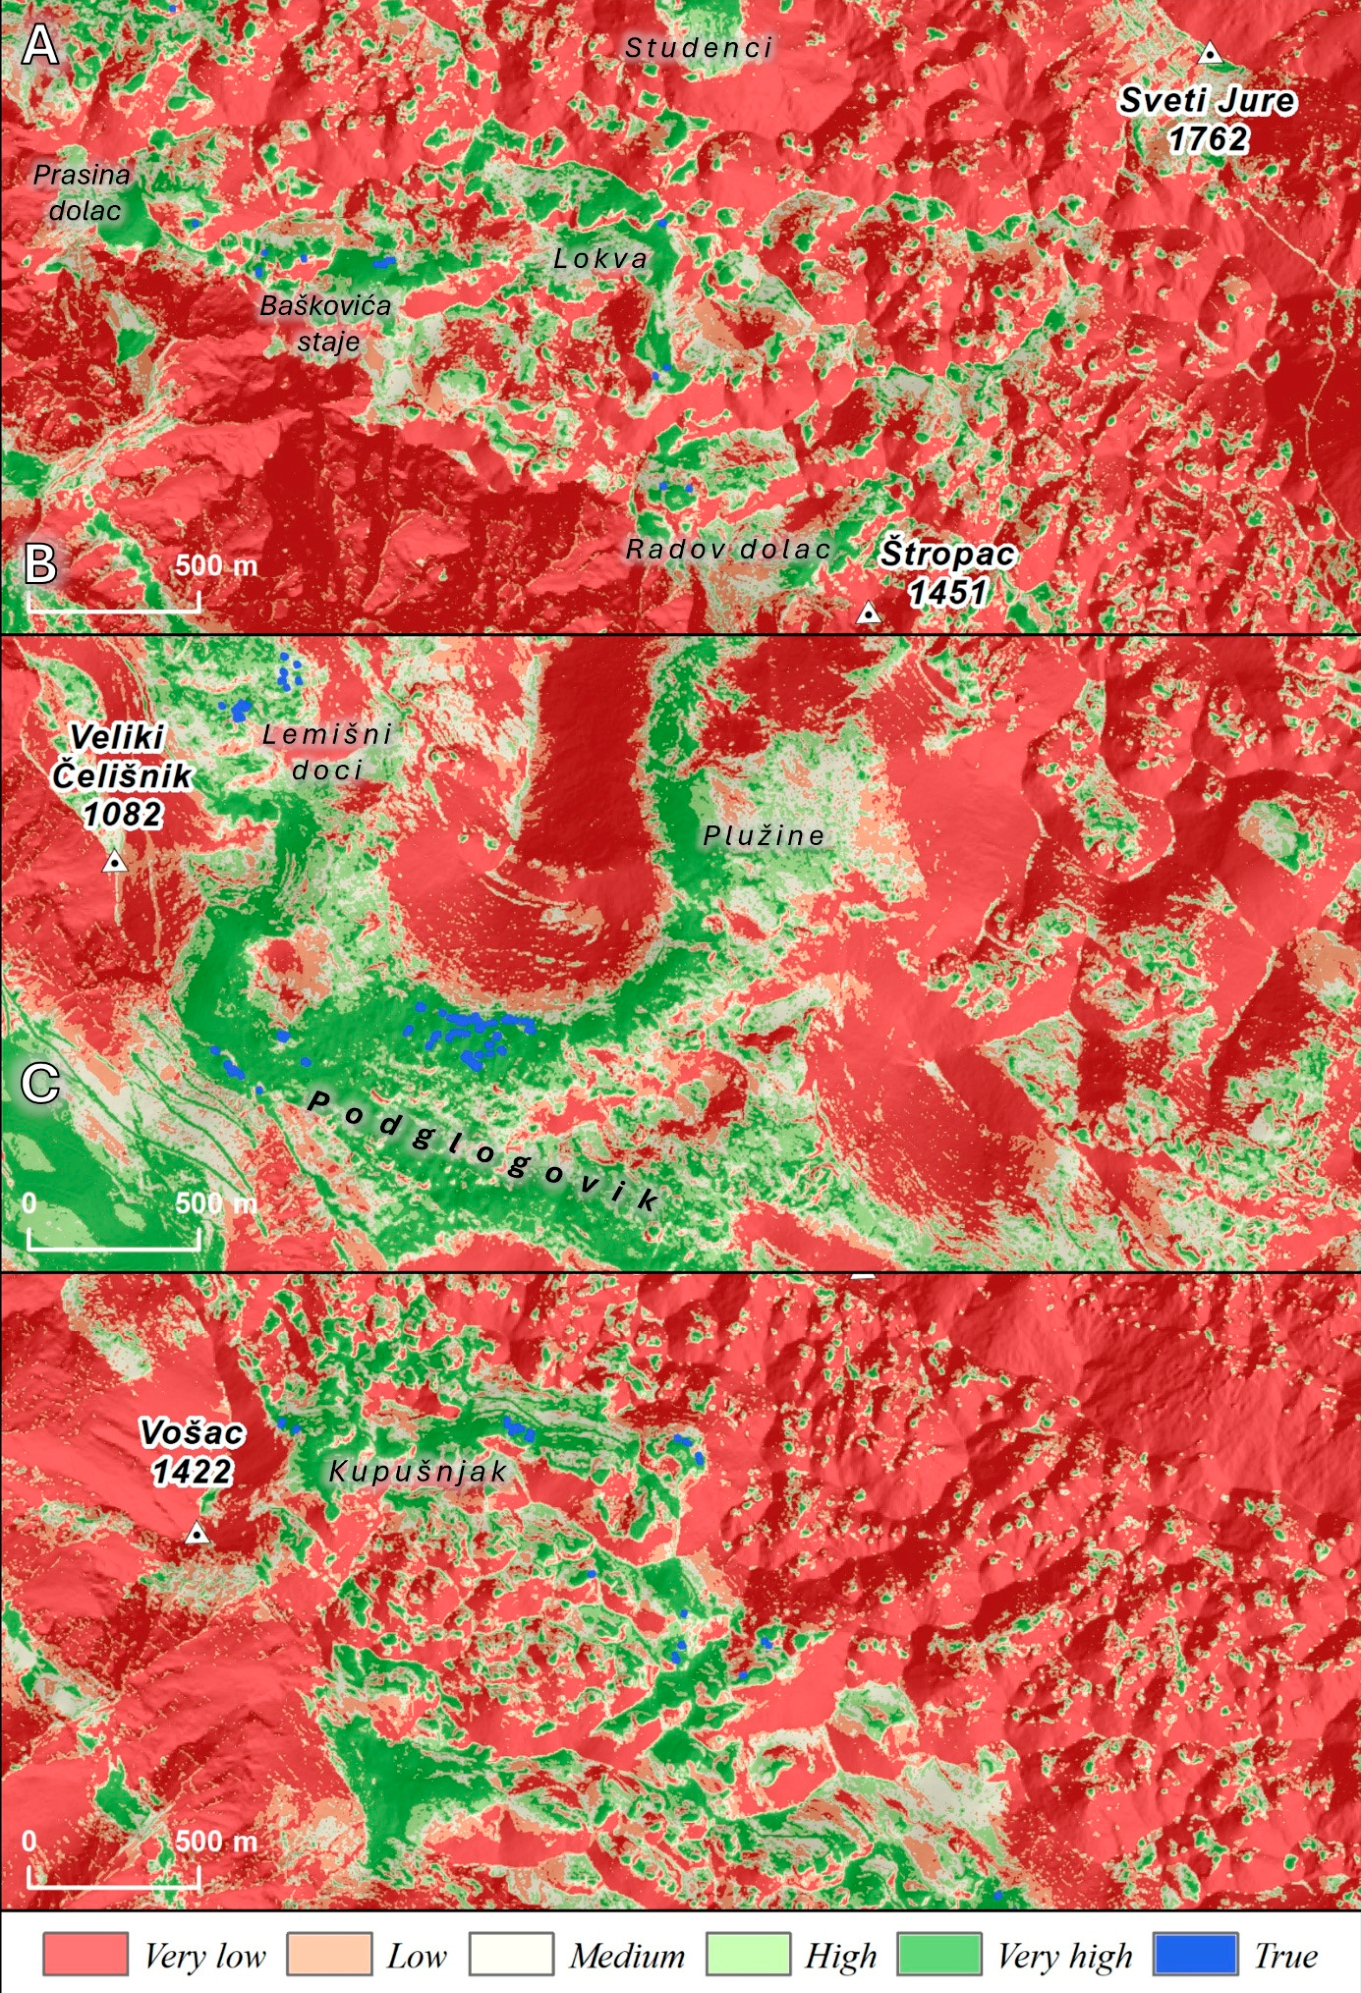
Figure 8.
Examples of habitation-related landscapes within high- and very-high-suitability zones of Biokovo Nature Park: (A) Lokva, (B) Podglogovik, and (C) Lemišni doci.
Figure 8.
Examples of habitation-related landscapes within high- and very-high-suitability zones of Biokovo Nature Park: (A) Lokva, (B) Podglogovik, and (C) Lemišni doci.
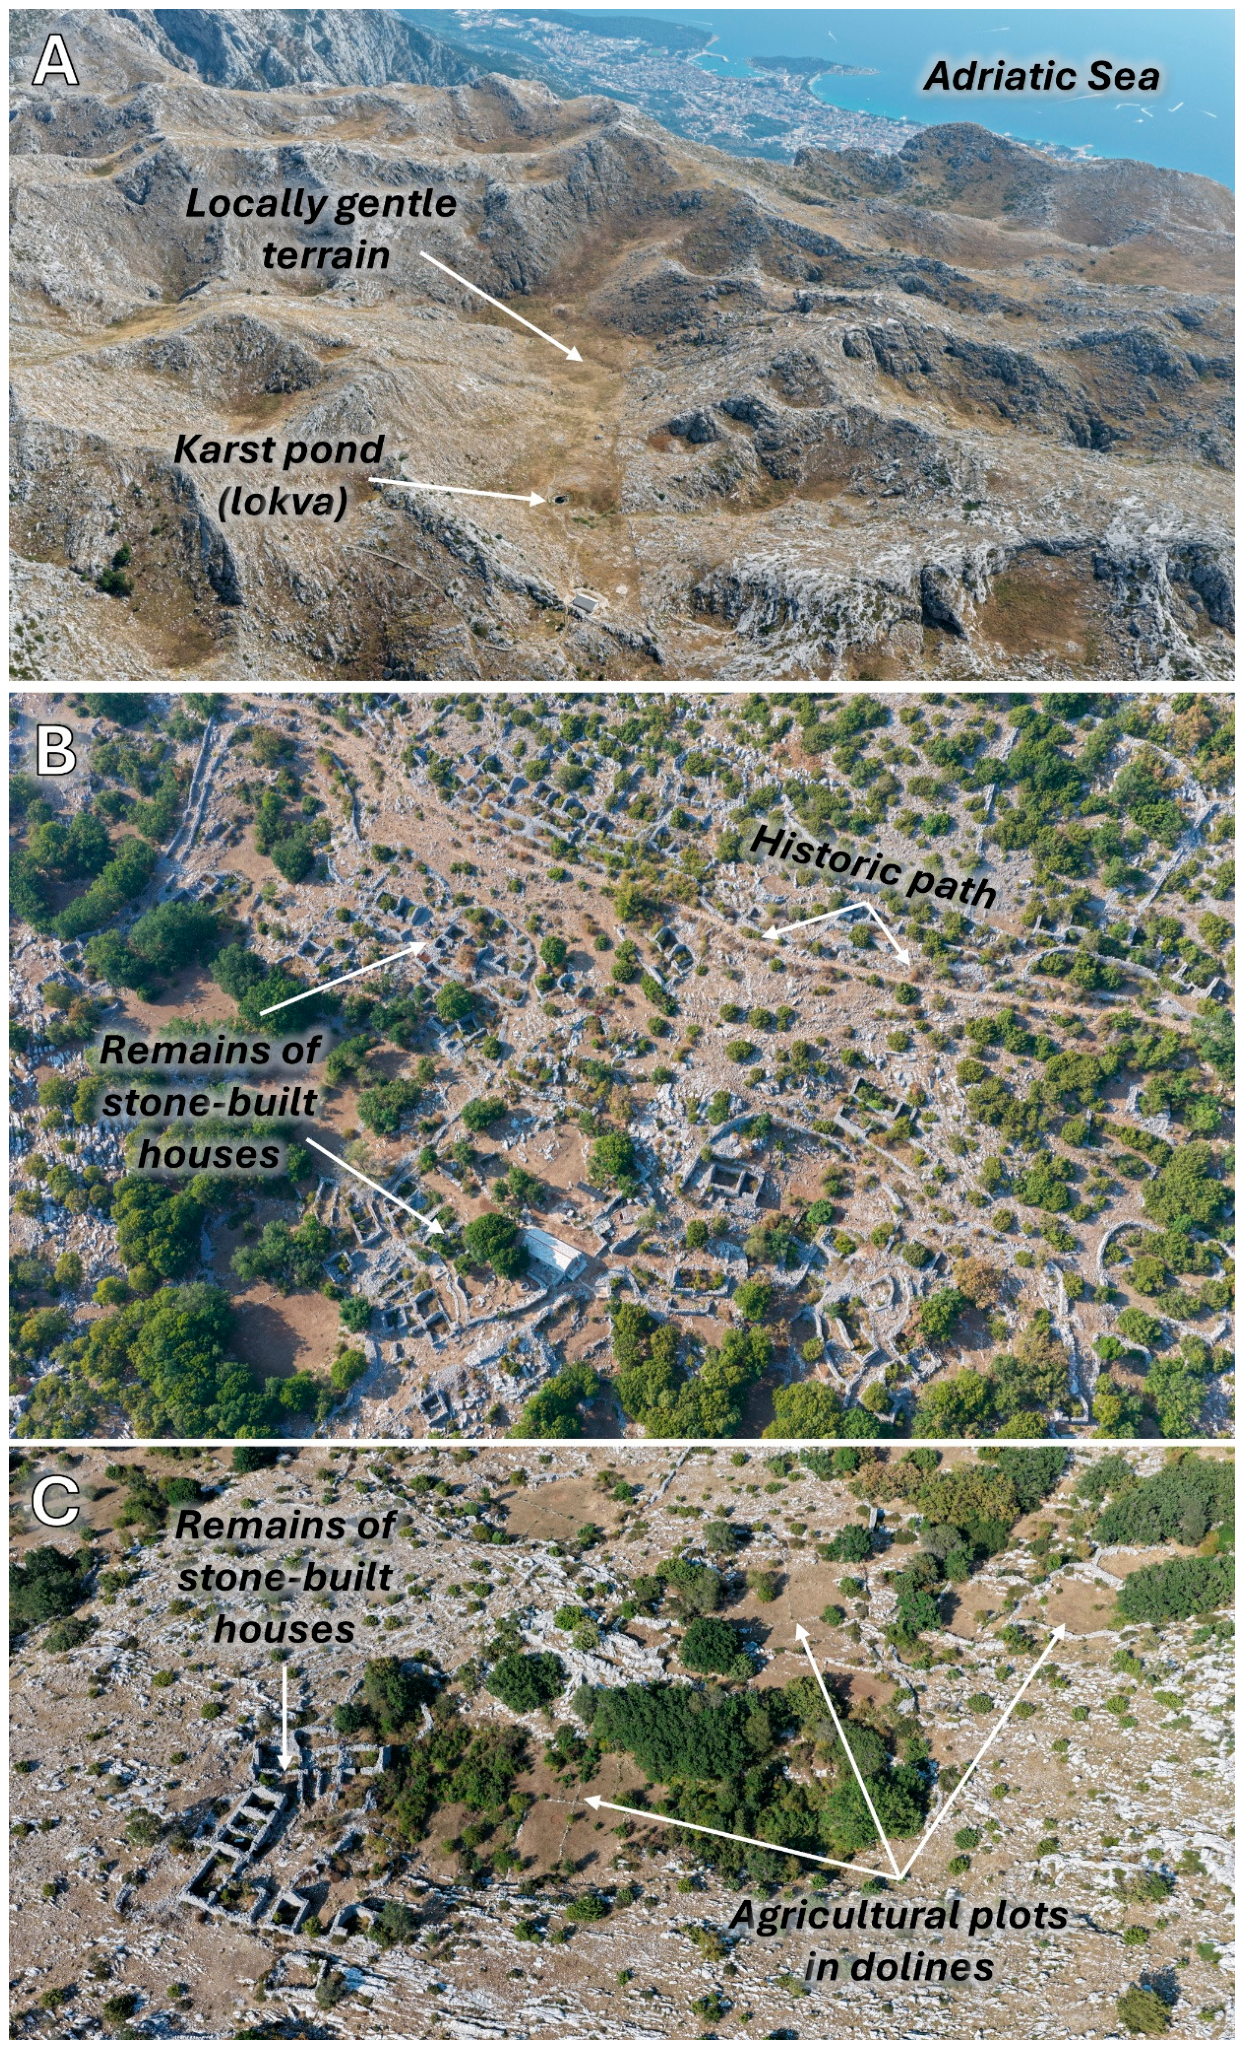

Table 1.
Training-only univariate discrimination of the 21 geoarchaeological criteria based on spatial out-of-fold (OOF) AUC values.
Table 1.
Training-only univariate discrimination of the 21 geoarchaeological criteria based on spatial out-of-fold (OOF) AUC values.
| Rank | Criterion | OOF AUC |
| 1 | SLO | 0.866 |
| 2 | TRI | 0.828 |
| 3 | DR | 0.822 |
| 4 | BWSI | 0.816 |
| 5 | HLI | 0.797 |
| 6 | LSF | 0.731 |
| 7 | PLAN | 0.725 |
| 8 | JWSI | 0.707 |
| 9 | GWSI | 0.700 |
| 10 | SVF | 0.694 |
| 11 | ASP | 0.678 |
| 12 | PROF | 0.672 |
| 13 | CI | 0.624 |
| 14 | TPI | 0.594 |
| 15 | TWI | 0.575 |
| 16 | SPI | 0.569 |
| 17 | ELV | 0.553 |
| 18 | LCDC | 0.544 |
| 19 | DSO | 0.529 |
| 20 | DD | 0.511 |
| 21 | DL | 0.505 |
Table 2.
Independent validation performance of the four final habitation suitability models.
| Model | AUC | 95% CI | Brier score | Log-loss | Interpretation |
| XGBoost | 0.9886 | 0.9798–0.9974 | 0.0441 | 0.1570 | Highest numerical AUC; statistically comparable with RF |
| Random Forest | 0.9876 | 0.9779–0.9973 | 0.0512 | 0.1931 | Statistically comparable with XGBoost |
| AHP GIS-MCDA | 0.9447 | 0.9107–0.9787 | — | — | Significantly better than Equal Weight |
| Equal-Weight GIS-MCDA | 0.9152 | 0.8745–0.9559 | — | — | Interpretable baseline model |
Disclaimer/Publisher’s Note: The statements, opinions and data contained in all publications are solely those of the individual author(s) and contributor(s) and not of MDPI and/or the editor(s). MDPI and/or the editor(s) disclaim responsibility for any injury to people or property resulting from any ideas, methods, instructions or products referred to in the content. |
© 2026 by the authors. Licensee MDPI, Basel, Switzerland. This article is an open access article distributed under the terms and conditions of the Creative Commons Attribution (CC BY) license (http://creativecommons.org/licenses/by/4.0/).
Copyright: This open access article is published under a Creative Commons CC BY 4.0 license, which permit the free download, distribution, and reuse, provided that the author and preprint are cited in any reuse.