
Submitted:
25 August 2026
Posted:
26 August 2026
You are already at the latest version
Abstract
Steel weldability remains a central issue in materials engineering, affecting structural integrity, manufacturing reliability, and lifecycle performance across many industries. This paper examines weldability from an integrated perspective that combines metallurgical fundamentals, quality assurance methodologies, and emerging artificial intelligence (AI) tools. Key metallurgical aspects including phase transformations, heat-affected zone behavior, grain refinement, and microstructural heterogeneity—are discussed in relation to weld quality and mechanical performance. Limitations of conventional destructive and non-destructive inspection methods are considered in the context of increasingly complex welding requirements. The study further analyzes the role of AI-assisted approaches, such as machine learning, computer vision, and predictive modeling, in improving defect detection, process monitoring, and weld evaluation. By linking microstructural information with performance indicators and incorporating intelligent monitoring systems, the work outlines a data-driven framework for adaptive quality control and more reliable welding processes.
Keywords:
weldability
; welding imperfections
; computer vision
; quality assurance
1. Introduction
Weldability in steels remains a critical topic for industries such as automotive, energy, infrastructure, and construction. As manufacturing moves toward lightweighting, particularly in electric vehicles (EVs), the demand for high-performance welds has grown, steel allows significant weight reduction while maintaining strength and recyclability, with steel recycling rates exceeding 90 % [1].
Advanced High-Strength Steels (AHSS) and third-generation variants offer high formability and strength for chassis and safety-critical components, but also present challenges: increased susceptibility to HAZ softening, microstructural degradation, and weld cracking [2].
Parallel trends in Industry 4.0 and smart manufacturing are transforming welding. Digitized production systems use real-time sensor feedback such as laser triangulation, acoustic, thermal, and electrical measurements to enable adaptive, robot-driven fabrication with embedded quality control [3,4,5,6,7]. Despite advancements, conventional QA methods, destructive tests and periodic NDT remain time-consuming, costly, and inadequate for real-time assurance. Innovations like Signature Image Processing (SIP) employ electrical data for on-the-fly defect detection and process stability assessment. Recent advances in multi-sensor fusion & AI combine current/voltage patterns with 2D image inspection to achieve 100% defect detection accuracy, illustrating the power of sensor-fusion, potentially complementing SIP [4].
Recent advances in laser triangulation imaging combined with deep learning are redefining in-line weld quality inspection, marking a clear shift toward intelligent, real-time QA systems in modern welding environments [5,6,7]. These systems employ deep neural networks tailored for real-time operation and optimized for deployment of standard industrial hardware, ensuring both cost-effectiveness and scalability. By continuously analyzing weld bead geometry during the process, such systems can predict internal features including tensile strength and subsurface integrity with high confidence. Demonstrated accuracy reaching 96.9%, along with seamless integration into production lines, position these technologies as a key enabler of automated, data-driven quality assurance in high-performance welding applications.
The integration of AI and deep learning further revolutionizes weld quality. Emerging trends demonstrate that deep learning models can predict quality parameters using sensor time-series with continuous learning methods. Together, these developments call for a holistic framework combining metallurgical insight, digitized QA systems, and AI-enriched monitoring to meet modern performance, reliability, and efficiency goals in welding industry.
The concept of weldability lies at the intersection of metallurgical science and process control, encapsulating how a material responds to welding in terms of defect formation, microstructural transformation, and mechanical integrity. At its core, weldability reflects the material's capacity to undergo thermal cycling without compromising performance, and is governed by parameters like hardenability, phase transformations, residual stress development, and different cracking risks.
Metallurgical insight, such as continuous cooling transformations (CCT), and grain boundary behavior enables predictive evaluation of weldability across various material grades, especially as modern welded structure become lighter and increasingly complex and demanding high strength.
In today’s industrial landscape, this metallurgical knowledge is being integrated into digitized QA frameworks and AI-enriched weld monitoring systems, reshaping how welding is designed, controlled, and validated. By embedding real-time sensors, thermal models, and machine learning algorithms, modern systems can dynamically assess weld quality, predict defect probability based on metallurgical criteria, and adapt process parameters to optimize reliability and efficiency. These intelligent platforms not only flag deviations from optimal weldability windows but also enable closed-loop control, predictive maintenance, and full traceability. This synergy between metallurgical fundamentals and digital intelligence aligns with Industry 4.0 goals, ensuring higher performance, greater process transparency, and reduced rework in welding applications.
2. Metallurgical Foundations of Weldability. Literature Survey
Although various phenomenological assumptions and boundary definitions for partial weldability criteria have been proposed, a comprehensive physical or mathematical framework for the numerical evaluation of weldability is still lacking. This gap exists because weldability is influenced by a complex interplay of numerous internal and external parameters, making it highly context dependent [9,10,11,12,13,14,15,16,17,18,19,20,21,22]. Most researchers tend to focus on individual aspects of the phenomenon rather than its full scope. The high variability of weldability parameters presents a significant challenge to the development of universal, quantitative weldability criteria [10].
ISO TR 581 standard defines the weldability as result of interaction of material, manufacture and design characteristics [9]. According to American Welding Society (AWS), the weldability is defined as the metal capacity to be welded under the fabrication conditions imposed with a specific suitability and designed structure, which perform satisfactorily in service.
In summary, weldability refers to the capacity of a material to be welded under specific conditions without defects and with adequate mechanical performance in the weld and heat-affected zone (HAZ). Thus, weldability is intrinsically linked to chemical composition, microstructural evolution, phase transformations, and cooling behavior, each governed by thermodynamics and kinetics, Table 1.
Numerous studies in the literature focus on specific aspects of weldability [10,11,12,13,14,15,16,17,18,19,20,21], often resulting in models with limited applicability to certain materials or welding conditions. The sections below summarize the primary research directions concerning metallurgical and operational weldability.
For structural and high-strength steels, weldability is closely linked to the carbon equivalent (CE), which serves as a key indicator of hardenability and cracking risk [14,16]. The tendency toward HAZ hardening has been explored in detail in [15], where the authors predict the maximum hardness in the heat-affected zone and recommend appropriate preheat temperatures to reduce cracking risk.
Additionally, several studies have addressed cold cracking susceptibility in welded steels [17,18,19,20,21], introducing various predictive parameters such as the Preheat Hydrogen-Affected (PHA) index, or Pcm cracking parameter - Ito and Bessyo [22], to quantify risk and guide welding procedure selection [17,20].
Steel weldability depends significantly on the type of steel. Low-carbon steel (<0.25% C) has good weldability due to their low hardenability and minimal risk of cold cracking. Medium to high-carbon steels show increasing hardenability, making them prone to martensite formation, cracking, and brittleness unless preheating and post-weld heat treatment are applied.
Alloyed steels (e.g., HSLA, Cr-Mo steels, stainless steels) may require specialized welding procedures due to susceptibility to phase imbalance, sensitization, or hydrogen-induced cracking. Carbon Equivalent (CE) is commonly used to assess hardenability and, by extension, their weldability. Steels with CE < 0.4 are generally considered easily weldable without special precautions [16,17,18,19,20,21,22].
HAZ is critical in weldability evaluation because it's where material microstructural changes experiencing grain growth, phase transformations, softening, or hardening effect due to thermal cycling. According to microstructural characteristics, HAZ can be divided into four zones:
- Coarse-grained HAZ (CGHAZ): prone to grain coarsening and reduced toughness.
- Fine-grained HAZ (FGHAZ): formed at lower peak temperatures, often more ductile.
- Intercritical HAZ (ICHAZ): partial austenitization; risk of mixed-phase microstructure.
- Subcritical HAZ (SCHAZ): tempering effects dominate; hardness may drop in HSLA or martensitic steels.
Grain growth in the CGHAZ and martensite/bainite formation during rapid cooling can significantly alter mechanical properties, including increasing brittleness and reducing fatigue resistance.
The final microstructure determines the mechanical integrity and the weld performance indicators. Grain-refined ferritic welds present high toughness and ductility. Mixed ferrite with bainite or pearlite led to balanced strength/toughness characteristics. Martensitic regions in HAZ are associated with high hardness, presenting potential cracking zones. Retained austenite or carbide networks issues with dimensional stability and corrosion resistance. Control over cooling rate t8/5 time, is crucial for microstructure control. For instance, laser welding typically has very high cooling rates, promoting finer microstructures but increasing the risk of martensite in high-strength steels unless controlled by preheat or pulsed modes [19].
3. Weldability Extended Model
In this section an extended model of weldability is presented that is universaly applicable, for different classes of materials like steels, non-ferrous alloys, special alloys and other metals. Complementary to the models disscused in the previous section, this proposal integrates different methods from the QA management system, metalographic features, and recent developments in SIP and AI learning algorithms. This fusion of advanced technologies and sensors allows us to build a weldability model that reflects the real-world welding practices. One novel key element in this approach is the matrix risks factors that consider all esential variables presented in Table 1. The key parameter that considers all those effects (material, production and design) is the Equivalent Risk Factor (ERF).
Most welding processes can handle some imperfections (e.g., misalignment, moderate CE), but when risk accumulation beyond ~50% starts affecting weld integrity significantly. The model we have proposed fits what welding engineers expect: a gradual tolerance to low risk, then a sharp drop of weldability when combined complexity exceeds safe limits.
The risk factors matrix is very sensitive to any partial risks that become high (e.g. cold cracking susceptibility or hot cracking susceptibility), the ERF spike even if other factors remain low. This is important because cracks don’t average out, a single severe weakness can dominate failure probability. The weldability equation is universally valable for all materials and welding processes. The weldability number (WN) is normalised and presents a non-linear evolution described by a 5PL function, called weldability function, Figure 1. The 5PL function and its parameters are given in eq(1).
Where:
ERF is the equivalent risk factor normalised (0-1).
a = horizontal asymptote (lower hypotheticaly weldability score), (a=0);
b = Hill slope, (b=3);
c = inflection point, where the weldability curve starts to fall steeply, (c=0.42). Lower c determines that weldability drops off early (more conservative), while higher c determines that weldability remains high despite growing risk (model more tolerant);
d = horizontal asymptote (maximum hypotheticaly weldability score), (d=1);
e = asymmetrical factor, (e=1.2).
Weldability can be quantified using a continuous normalized five-parameter logistic (5PL) function, which generates a weldability score based on a matrix of risk factors. This score provides a unified index that reflects how suitable a material or material combination is for welding under given conditions.
A score of 0 represents a hypothetical extreme in which welding is not feasible by any method, the joint would be completely unviable in terms of metallurgical integrity, mechanical performance, or geometric compatibility. Conversely, a score of 1 corresponds to an idealized scenario in which the welded joint is indistinguishable from the base material in all aspects: microstructure, mechanical properties, geometry, and stress distribution.
In real-world applications, the weldability index will fall between 0 and 1 and can be interpreted through an associated Equivalent Risk Factor (ERF) according to Table 2.
In summary, risk accumulation beyond approximately 50% (ERF > 0.5) begins to seriously affect weld integrity, calling for substantial adjustments to the welding process, materials, or joint configuration to ensure performance and reliability. This weldability model is universal for all materials, and the weldability index is directly correlated with the matrix risk factors. This matrix is specific to each class of metallic materials, having three sections of variables according to ISO/TR 581:2005 weldability definition.
4. Matrix Risk Factors
The risk factors matrix accounts for the influence of three primary categories on the welding process: material-related, production-related, and design-related (constructional weldability) factors, in accordance with the ISO/TR 581:2005 standard. Together, these three categories comprise a total of 20 parameter sets, offering a comprehensive framework for evaluating weldability across diverse material and process contexts. For each material class—such as carbon and low-alloy steels, cast irons, non-ferrous alloys, and high-alloy steels a tailored configuration is applied.
Hot crack susceptibility index is a concept traditionally used to assess the susceptibility of alloys to hot cracking, especially for austenitic stainless steels and nickel-based alloys, but also in laser-based additive manufacturing [23]. The Hot Cracking Index (HCI) can be applied to structural steels, such as S355 or S690, but requires some adaptation because structural steels are ferritic or ferritic-pearlitic, not austenitic.
They generally have different solidification behavior and mechanisms of cracking, like cold cracking and heat-affected zone (HAZ) liquation cracking that are more common. Still, hot cracking can occur in certain weld metal compositions or with improper filler material selection, especially for high-strength low-alloy (HSLA) steels like S690 and when the ratio of weld depth-width is too high.
Different weldability studies have shown that Depth/Width ratio (DWR) plays a critical role in determining weld quality indicators, like penetration, cracking tendency, mechanical strength [23,24,25,26]. Optimal ratios vary by process and materials, in narrow-gap arc welds DWR ≫ 1, but in conventional GMA/TIG methods DWR ratio tend around 0.6–0.7. Process welding parameters and the travel speed significantly impact on the resulting DWR ratio. This factor is particularly important in MIG/MAG (GMA) and submerged-arc welding where a ratio of 2:3 is optimal for sound welds. A ratio of 1:3 gives shallow beads which are prone to surface cracking, while a higher ratio of 2:1 result in the centreline cracking. For other processes, which use key-hole techniques (e.g. electron beam welding), the single pass bead may be narrow and deep but still satisfactory.
Hot cracking index (HCI) is calculated traditionaly based on material composition (e.g., C, S, P, Ni, etc.). Elements that have low solubility in the alloy matrix, such as phosphorus (P), sulfur (S), boron (B), and silicon (Si) tend to promote hot cracking during weld joint solidification. These elements segregate to the liquid along solidification grain boundaries and form a low melting point liquid film. Because of these reasons, the levels of P, S, B, and Si in nickel alloys and austenitic stainless steels are held at a very low level [23,24].
C, S, P, B promote hot cracking because they form low-melting eutectics at grain boundaries and Si, Mn helps deoxidation and improve solidification structure. Furthermore, we have developed a hot crack susceptibility index (HCS) that is a combined parameter normalised, according to Table 3 and eq (3) for an easy implemetation in the weldability model. The HCS index accounts for both geometric influences via weld depth-to-width ratio (D/W), but also for compositional influence (HCI) through eq(2).
Where:
- HCI = compositional hot cracking index, eq(2).
- DWR = depth-to-width ratio of the weld bead.
- DWRref = reference ratio above which cracking risk sharply increases (e.g. 2 for structural steels).
- α = weighting factor for composition vs. geometry (e.g., 0.7 composition, 0.3 geometry).
Cold cracking is also referred to as delayed hydrogen-induced cracking or underbead cracking is a critical concern in high-strength structural steels, particularly in ferritic and martensitic grades such as S355, S690, and other HSLA steels. This type of cracking typically occurs in the heat-affected zone (HAZ) after welding and is primarily governed by three interrelated factors: diffusible hydrogen content in the weld and HAZ, residual stresses resulting from thermal contraction and restraint, and the formation of hard, brittle microstructures in the HAZ (e.g., martensite or bainite).
Numerous studies in the literature propose different variants of carbon equivalent (CE) formulas (Table 4), each relating the risk of cold cracking to specific welding scenarios and groups of steels. In the present weldability model, the cold cracking susceptibility (CCS) is assessed using a composite welding severity index, which combines four key welding parameters into a single normalized variable.
The four welding parameters considered along with their variation ranges, are diffusible hydrogen content (2–50 ml/100 g), carbon equivalent CET (0.1–0.7 %), material thickness (2–80 mm) and preheating temperature (5–200 °C) according to eq. (4) and Table 5.
Cold cracking risk is most sensitive to CE and H₂, thus the weights are focused on these variables: wCE =0.35, wH2=0.35, wt=0.15 and wTp=0.15 , where . Thus, by replacing the CCS variables in eq(4) we can asign directly the score for this risk factor according to Table 3.
Based on the 20 parameter sets presented in Table 3 for steels and Table 6 for aluminium alloys, we can now calculate the normalized Equivalent Risk Factor (ERF) using eq. (5), where ri represents the material, production, and design risk factors.
When α>1, a non-linearity is introduced into the contribution of ri to the overall ERF. This can be interpreted as a risk acceleration effect, where any high-risk component is sharply amplified. Specifically, if any ri → 1, then ERF→1. Conversely, if all ri values remain small, the ERF also stays low, but it can rise rapidly if a single parameter increases significantly. This is important because cracks don’t average out — a single severe weakness can dominate failure probability.
In other words, the model reflects that risks do not simply average out: a single dominant factor—such as cold cracking—can disproportionately drive the total risk to a high level, even when other risks remain low. This captures the reality that a localized severe weakness may govern the overall probability of failure.
5. Experimental Validation of the Model
According to the weldability model presented in the previous section, the weldability score can be calculated based on material, design, and execution-related factors. In total, 20 significant variables are considered, reflecting the complex environment in which the welded joint is designed and produced under specific conditions. The outcome is expressed as a value between 0 and 1, integrating the influence of all these parameters.
At the same time, a welded joint is ultimately defined by its Welding Procedure Specification (WPS), which establishes a unique set of measurable characteristics. These can be quantified through various analyses and tests commonly performed in industrial practice. Typical quality control data include identification of welding imperfections (type, size, and distribution), microstructural characteristics (mean grain size and constituents), weld geometry, penetration depth, heat-affected zone (HAZ) width, non-metallic inclusions, and hardness variation across the deposited metal and HAZ.
While additional advanced techniques are available for more detailed joint characterization, maintaining reasonable costs and processing times requires focusing on the core analyses already outlined. The results of these evaluations (& Quality Control) can then be synthesized using the same scoring method as applied in the weldability model (Table 8), enabling a direct comparison between predicted and measured values for model validation.
According to ISO 581, the fewer factors that influence material selection, welding procedure, and structural design are accounted, the greater the metallurgical, operative, and constructional weldability will be. In other words, weldability is strongly dependent on the number and type of variables considered in the assessment. However, this approach introduces a bias that increases with the number of variables included in the study. To address this, the variables can be grouped into three main classes—material, production, and design. Within each class, the influence of individual variables is aggregated through a weighted sum, while between classes their interaction is treated multiplicatively, thereby capturing the dominant effects more effectively. Thus, the experimental weldability number (WN) can be calculated based on eq (6):
where :
Δd = grains coarsening effect in HAZ (μm)
dbase= mean grains size in parent metal (μm)
wHAZ= width of HAZ (mm)
t = equivalent thickness joint (mm)
QCscore = quality control score using SR EN ISO 5817: 2023, (0-1)
Weld quality encompasses the mechanical integrity, geometric accuracy, and defect-free nature of a weld. Traditional quality control (QC) in welding has focused on destructive and non-destructive testing (NDT) methods. However, as manufacturing demands increase and weld environments become more complex, these methods face limitations in terms of speed, repeatability, data richness, and real-time decision-making. This has opened the door to advanced QC techniques, including machine learning, image processing, and sensor fusion, that can operate in real-time and learn adaptively from data. Newer QC methods rely on digitized signal analysis, where electrical, thermal, and visual signals from the welding process are collected and interpreted using statistical or AI models. Signature Image Processing (SIP) converts electrical time-series signals (current and voltage) into phase-space images, which are compared against a library of “acceptable” and “defective” signatures. SIP has been successfully deployed in industry via systems like WeldPrint. These systems support in-line, non-contact, real-time evaluation with high repeatability without requiring physical access to the weld pool, only sensor input from welding machines, making it ideal for robotic and automated welding. AI-Vision systems are using laser triangulation and deep learning algorithms and can achieve ~97% accuracy on weld classification, support real-time line integration, offering full automation potential, though they require moderate hardware investment.
A Weld Visual Inspection app has been developed as a dedicated module for welding applications, being focused on the detection of surface-breaking imperfections through visual testing (VT), a non-destructive examination method governed by ISO 17637:2003.
Geometric imperfections in metallic welds are classified in accordance with EN ISO 6520-1:2007, which defines six principal defect groups. The developed AI-based weld visual inspection model was trained to detect and classify the following imperfection categories: cracks, craters, porosity, solid inclusions, lack of fusion, excessive convexity, burn-through, and spatter.
According to Table 9 and Figure 6 a very good correlation can be observed between the predicted values for weldability number vs. the measured values. This proves that the proposed model for weldability number can be used as an advanced model to capture the behaviour of metallic materials during welding processess.
6. Conclusions
Weldability must be treated as a multi-parametric, non-linear system rather than a single-property descriptor.The study demonstrates that weldability emerges from the interaction of metallurgical, production, and design variables, consistent with ISO/TR 581. The proposed framework confirms that no isolated parameter (e.g., carbon equivalent alone) can adequately predict weld performance.
The Equivalent Risk Factor (ERF) provides a physically meaningful aggregation of heterogeneous welding risks.By structuring 20 variables into a normalized risk matrix and introducing non-linear amplification, the ERF captures the critical engineering reality that localized high-risk factors dominate failure probability. This aligns with fracture mechanics principles, where weakest-link behavior governs weld integrity.
The 5-parameter logistic (5PL) weldability function is an appropriate mathematical representation of weldability degradation. The model reflects a gradual tolerance to low risk followed by a sharp transition beyond a critical threshold (ERF ≈ 0.4–0.5). This behavior is consistent with observed welding practice, particularly the abrupt increase in cracking susceptibility and HAZ degradation in high-strength steels.
The proposed weldability number (WN) establishes a direct bridge between predictive modeling and measurable weld quality. By integrating quality control outputs (hardness, grain coarsening, HAZ width, defect levels) into the same normalized framework, the model enables quantitative comparison between predicted weldability and experimental validation, reducing the gap between design and verification.
Experimental validation confirms the sensitivity of weldability to process selection and thermal effects.The comparative results (LBW > TIG > MAG) for S235JR demonstrate that lower heat input and reduced HAZ width correlate with higher weldability scores. This validates the model’s responsiveness to metallurgical transformations such as grain growth and hardness variation.
The integration of AI-based quality assurance represents a paradigm shift from post-process inspection to real-time weldability control. Technologies such as sensor fusion, signature image processing, and deep learning enable continuous monitoring and prediction of weld quality, supporting adaptive control strategies. This transforms weldability from a static material property into a dynamic, controllable process variable.
The framework supports universality across materials, with adaptable risk matrices. The extension of the model to aluminium alloys demonstrates its scalability. By modifying the risk factor matrix while preserving the ERF structure, the methodology can be generalized to diverse material systems and welding processes.
From an engineering standpoint, weldability degradation is governed by threshold behavior rather than linear accumulation. The study confirms that beyond ERF ≈ 0.5, weld integrity decreases rapidly, requiring disproportionate mitigation measures (preheat, PWHT, design changes). This has direct implications for welding procedure qualification and risk-based decision-making.
The proposed holistic model aligns with Industry 4.0 objectives by enabling data-driven, closed-loop welding systems. The combination of metallurgical knowledge, structured risk evaluation, and AI-driven monitoring provides a foundation for intelligent welding environments with predictive capability, traceability, and reduced reliance on empirical trial-and-error approaches.
The Weld Visual Inspection can be easily deployed on dedicated hardware like NVIDIA Jetson devices, allowing fast and accurate detection of welding imperfections using advanced AI algorithms (YOLO) at the moment of fabrication, cutting down the costs of inspection and repairing.
The main contribution of the work is the unification of traditionally fragmented domains into a single evaluative framework. By merging metallurgy, process engineering, quality assurance, and AI, the study provides a coherent methodology for assessing and optimizing weldability, with both theoretical consistency and practical applicability.
7. Declarations
Author Contributions
The author is solely responsible for the conception, design, analysis, and writing of the manuscript. The author approved the final version of the manuscript.
Funding
The author did not receive financial support from any public, commercial, or not-for-profit funding agency for the research, authorship, and/or publication of this article.
Competing Interests
All authors declare that they have no conflicts of interest. The author has no financial or non-financial interests to disclose and no affiliations with or involvement in any organization or entity with any financial interest or non-financial interest in the subject matter or materials discussed in this manuscript.
References
- Hahn, Y.; Maack, R.; Buchholz, G.; Purrio, M.; Angerhausen, M.; Tercan, H.; Meisen, T. Towards a Deep Learning-based Online Quality Prediction System for Welding Processes. arXiv [cs.LG. arXiv:2310.12632v2. [CrossRef]
- Perka, A.K.; John, M.; Kuruveri, U.B.; Menezes, P.L. Advanced High-Strength Steels for Automotive Applications: Arc and Laser Welding Process, Properties, and Challenges. Metals 2022, 12, 1051. [Google Scholar] [CrossRef]
- Skriko, T.; Ahola, A.; Björk, T. Overview on the digitized production of welded steel structures. Weld. World 2022, 66, 799–813. [Google Scholar] [CrossRef]
- Lee, J.; Choi, H.; Kim, J. Welding Bead Inspection Using Image and Multi-Sensor Fusion. Appl. Sci. 2023, 13, 11497. [Google Scholar] [CrossRef]
- Spruck; Seiler, J.; Roll, M.; Dudziak, T.; Eckstein, J.; Kaup, A. Quality Assurance of Weld Seams Using Laser Triangulation Imaging and Deep Neural Networks. IEEE Int. Workshop Metrol. Ind. 4.0 IoT (MetroInd4.0 & IoT) 2024, 407–412. [Google Scholar] [CrossRef]
- Lee, K.; Hwang, I.; Kim, Y.-M.; Lee, H.; Kang, M.; Yu, J. Real-Time Weld Quality Prediction Using a Laser Vision Sensor in a Lap Fillet Joint during Gas Metal Arc Welding. Sensors 2020, 20, 1625. [Google Scholar] [CrossRef]
- Dold, Patricia M.; Bleier, Fabian; Boley, Meiko; Mikut, Ralf. Two-stage quality monitoring of a laser welding process using machine learning: An approach for fast yet precise quality monitoring. At.-Autom. 2023, vol. 71(no. 10), 878–890. [Google Scholar] [CrossRef]
- Jeffus, Larry. Welding and Metal Fabrication; Delmar Cengage Learning, 2012; p. 780. ISBN -13: 978-1-4180-1374-5. [Google Scholar]
- ISO/TR 581:2005; Weldability — Metallic materials — General principles, reviewed. 2021. Available online: https://www.iso.org/standard/40507.html.
- Grigorenko, G.M.; Kostin, V.A. Criteria for evaluating the weldability of steels. Weld. Int. 2013, 7:10, 815–820. [Google Scholar] [CrossRef]
- Omajene, J.; Martikainen, J.; Kah, P. Weldability of Thermo-Mechanically Rolled Steels Used in Oil and Gas Offshore Structures. Int. J. Eng. Sci. (IJES) 2014, Vol. 3(Issue 5), 62–69. [Google Scholar]
- Kojundžić, Domagoj; Krnić, Nikša; Samardžić, Ivan. Weldability of nickel and nickel-based alloys // MTECH 2021 Conference Proceedings; Hrvatsko društvo za zaštitu materijala (HDZaMa): Zagreb, 2021; pp. str. 214–233. Available online: https://www.croris.hr/crosbi/publikacija/prilog-skup/708105.
- Kalinowski, Joseph M. NASA Contractor Report 195376, Weldability of a Nickel-Based Superalloy. Available online: https://ntrs.nasa.gov/api/citations/19950004780/downloads/19950004780.pdf.
- Kasuya, T.; Hashiba, Y. Carbon Equivalent to Assess Hardenability of Steel and Prediction of HAZ Hardness Distribution. NIPPON STEEL TECHNICAL REPORT No, 95 January 2007. [Google Scholar]
- Kasuya, T.; Yurioka, N.; Okumura, M. Methods for predicting maximum hardness of heat-affected zone and selecting necessary preheat temperature for steel welding. In Nippon Steel Technical Report; 1995; pp. 7–14. [Google Scholar]
- Wang, Wesley. The Great Minds of Carbon Equivalent. Available online: https://ewi.org/the-great-minds-of-carbon-equivalent-part-ii-2/.
- Suzuki, Haruyoshi. Revised Cold Cracking Parameter PHA and its applications. Trans. Jpn. Weld. Soc. 1985, 16.1, 40–49. [Google Scholar]
- Yurioka, Nobutaka. Physical metallurgy of steel weldability. ISIJ Int. 2001, 41.6, 566–570. [Google Scholar] [CrossRef]
- Perka, A.K.; John, M.; Kuruveri, U.B.; Menezes, P.L. Advanced High-Strength Steels for Automotive Applications: Arc and LaserWelding Process, Properties, and Challenges. Metals 2022, 12, 1051. [Google Scholar] [CrossRef]
- Suzuki, H.; Yurioka, N. Prevention Against Cold Cracking by the Hydrogen Accumulation Cracking Parameter PHA. Trans. Jpn. Weld. Soc. 1983, Vol. 14(No. 1). [Google Scholar]
- Watanabe, Takehiko; Okane, Isao. Association of Partial Melting and Hydrogen-Assisted Cracking in Weld Heat-Affected Zone of High Strength Steel (Part 5); pp. 9–15. [CrossRef]
- Ito, Y.; Bessyo, K. IIW Document No. IX 576-68; “Weldability formula of high strength steels related to heat affected zone cracking”. 1968.
- Tang, G.; Gould, B.J.; Ngowe, A.; et al. An Updated Index Including Toughness for Hot-Cracking Susceptibility. Metall. Mater. Trans. A 2022, 53, 1486–1498. [Google Scholar] [CrossRef]
- Odoemelam, C.; Achebo, J.; Ehiorobo, J.; Osaremwinda, J. Simulation-Based Optimization of Aspect Ratio in Tungsten Inert Gas Welding. Engineering 2018, 10, 876–890. [Google Scholar] [CrossRef]
- Jia, R.; Li, H.; Wei, F.; Zhou, Y.; Duan, W.; Zhang, K.; Lei, Z. Investigation of Microstructure and Mechanical Properties of High-Depth-to-Width-Ratio Horizontal NG-GMAW Joint for S500Q Steel. Materials 2024, 17, 2056. [Google Scholar] [CrossRef]
- Tathgir, S.; Bhattacharya, A.; Bera, T. K. Influence of Current and Shielding Gas in TiO2 Flux Activated TIG Welding on Different Graded Steels. Mater. Manuf. Process. 2015, 30(9), 1115–1123. [Google Scholar] [CrossRef]
Figure 1.
Weldability model for all metallic materials.
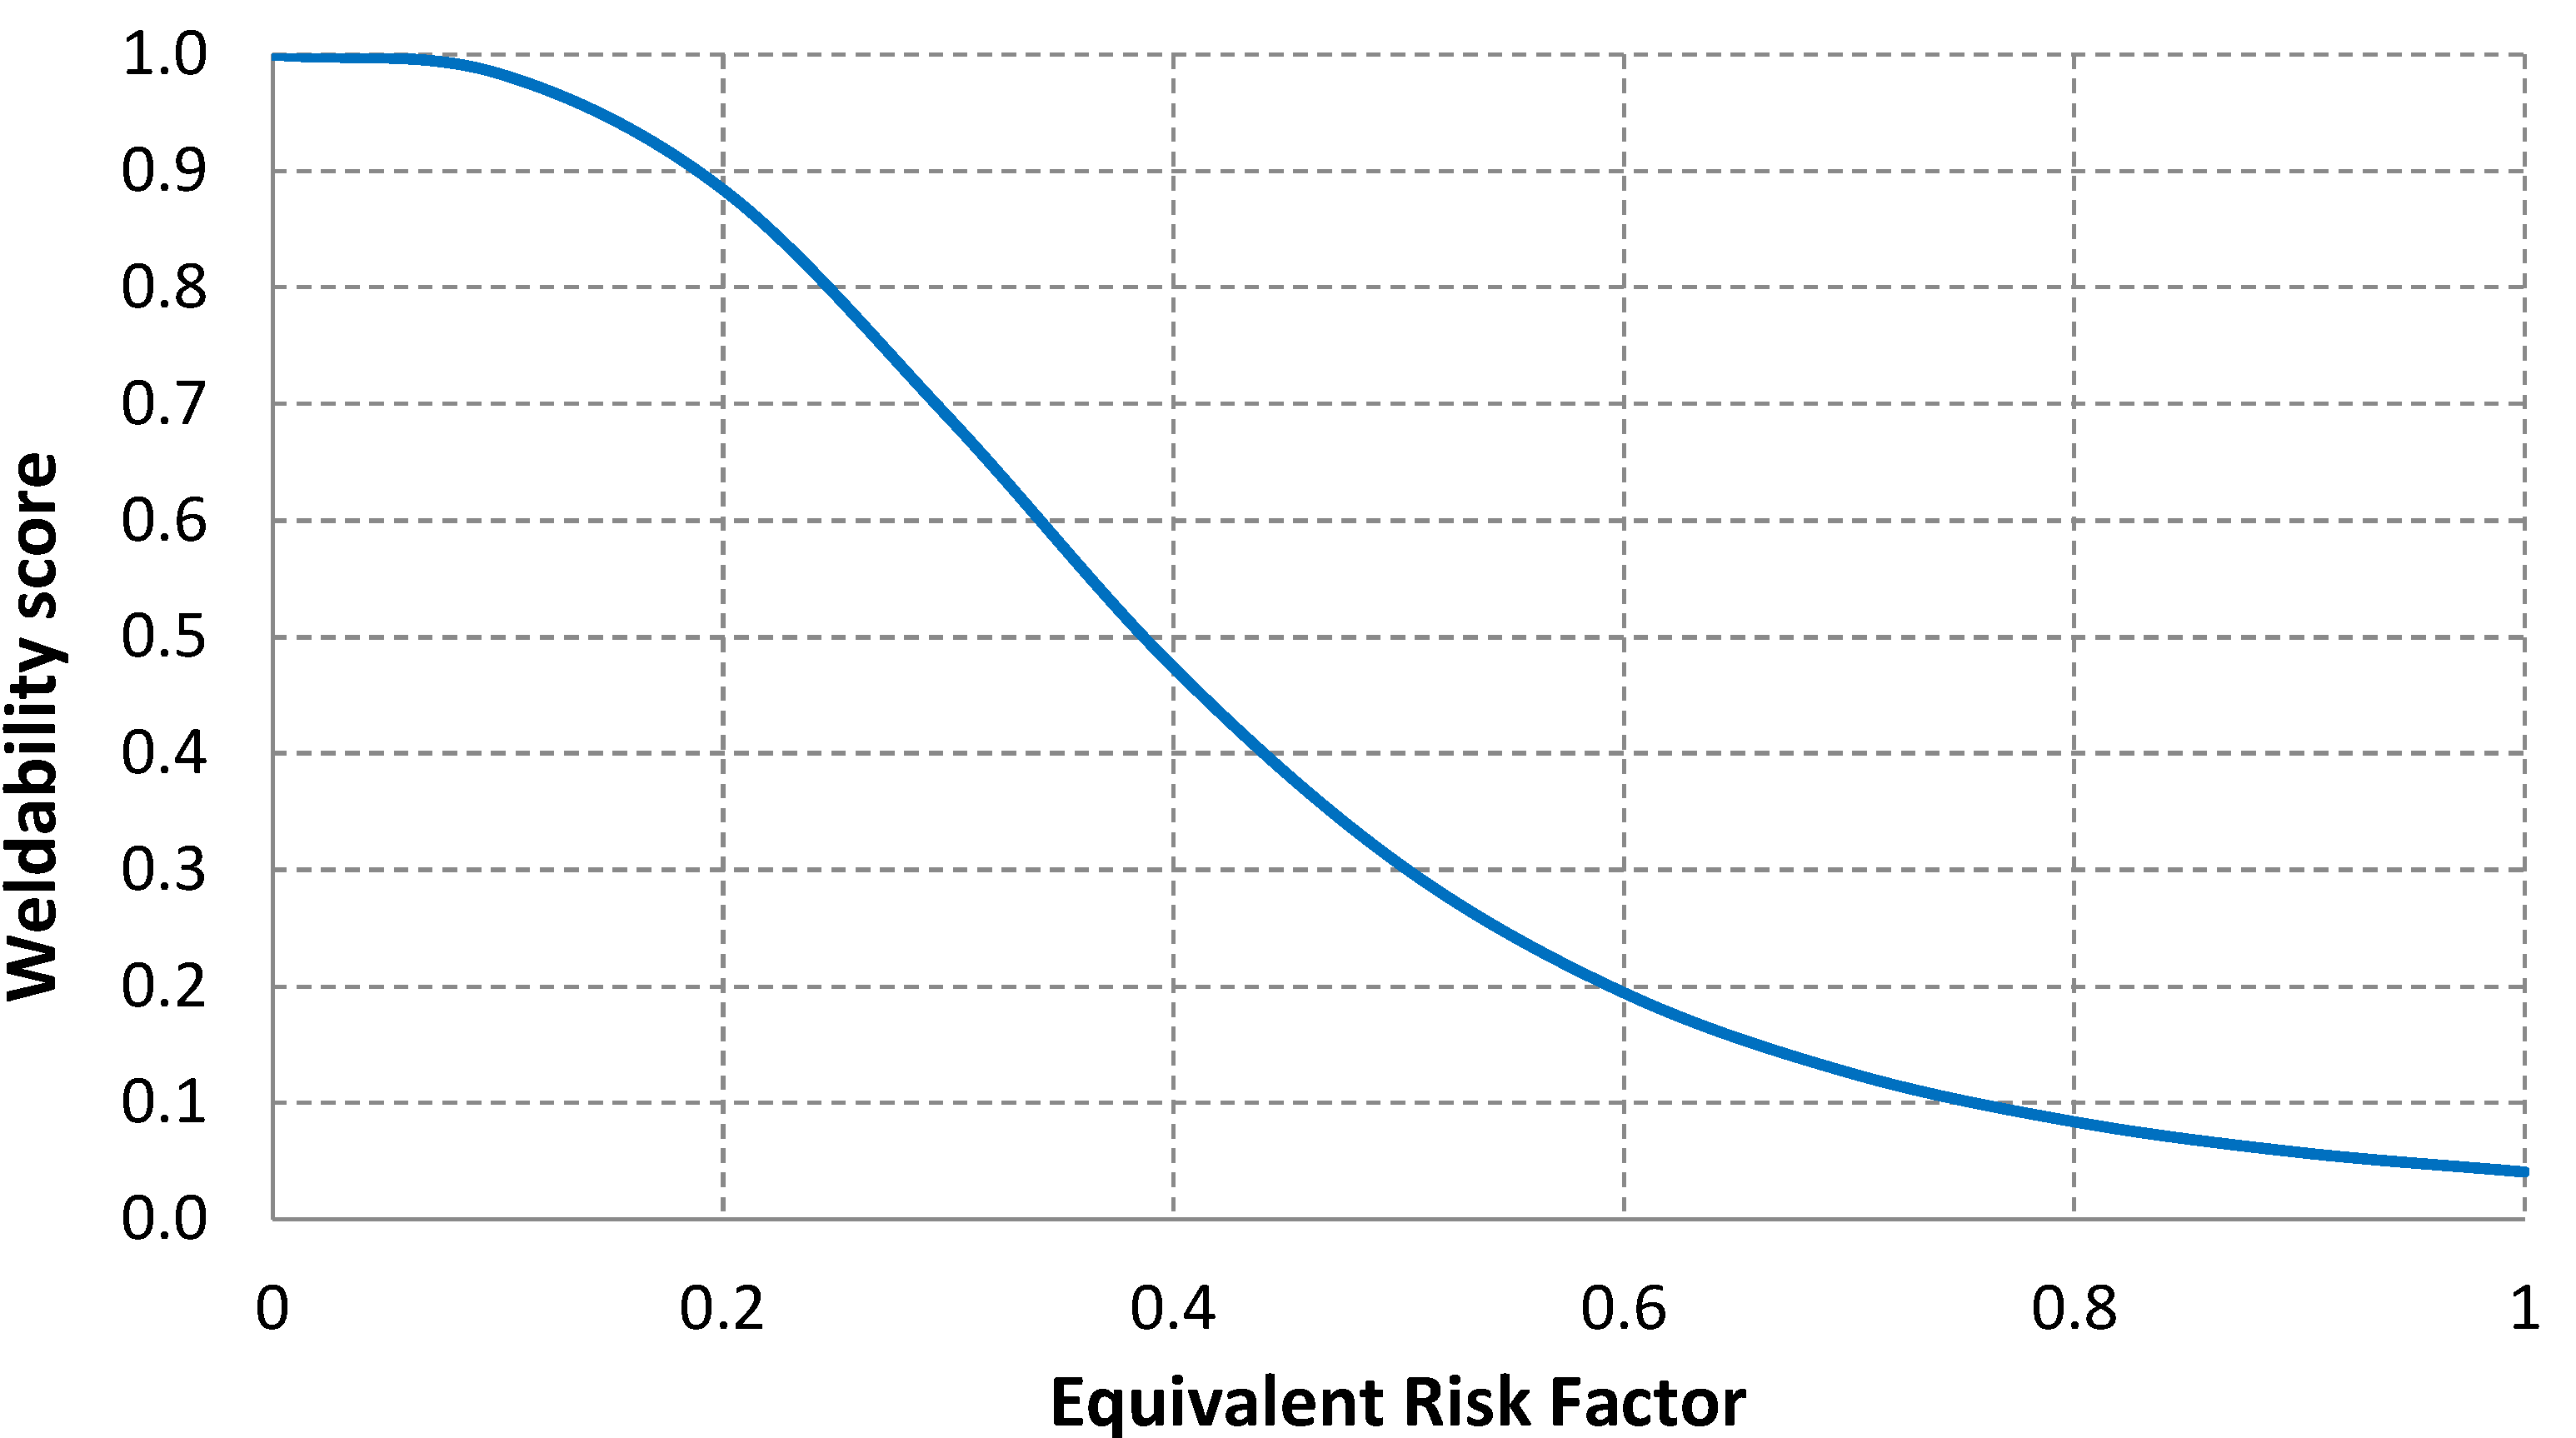
Figure 2.
Material weldability factor. Simulated values for structural steels.
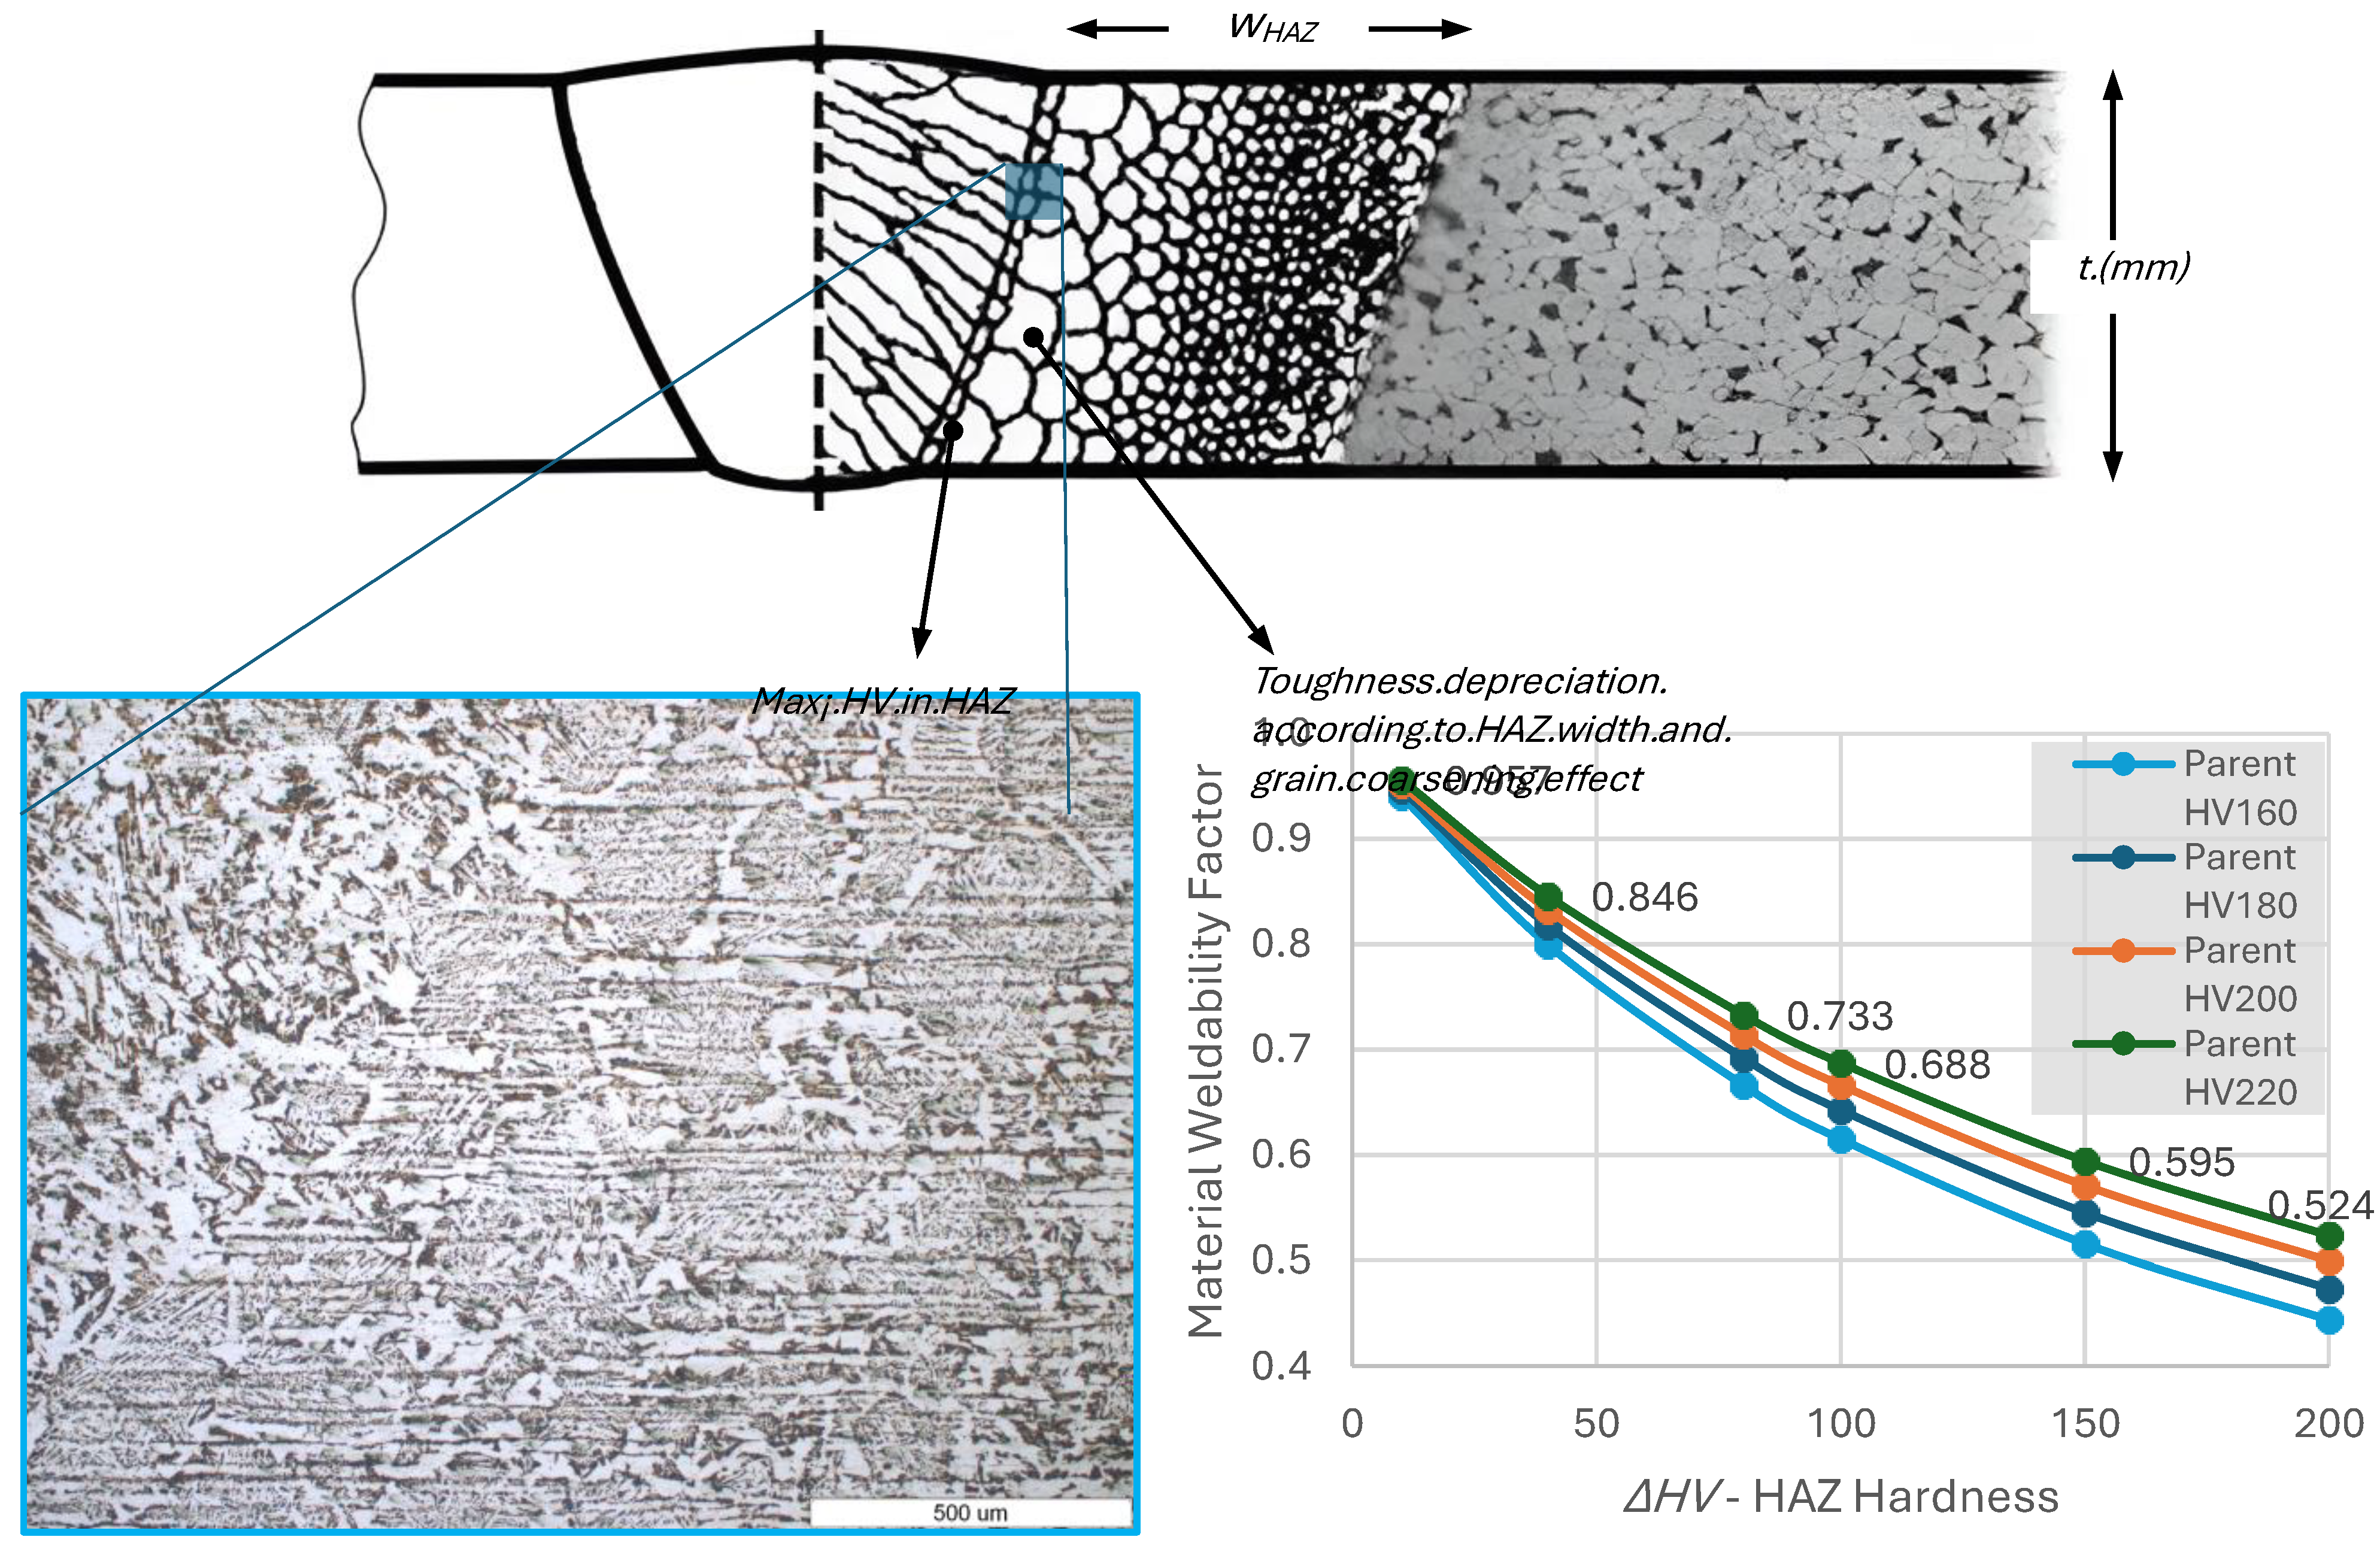
Figure 3.
Simulated values for operative factors according to HAZ width and material equivalent thickness.
Figure 3.
Simulated values for operative factors according to HAZ width and material equivalent thickness.
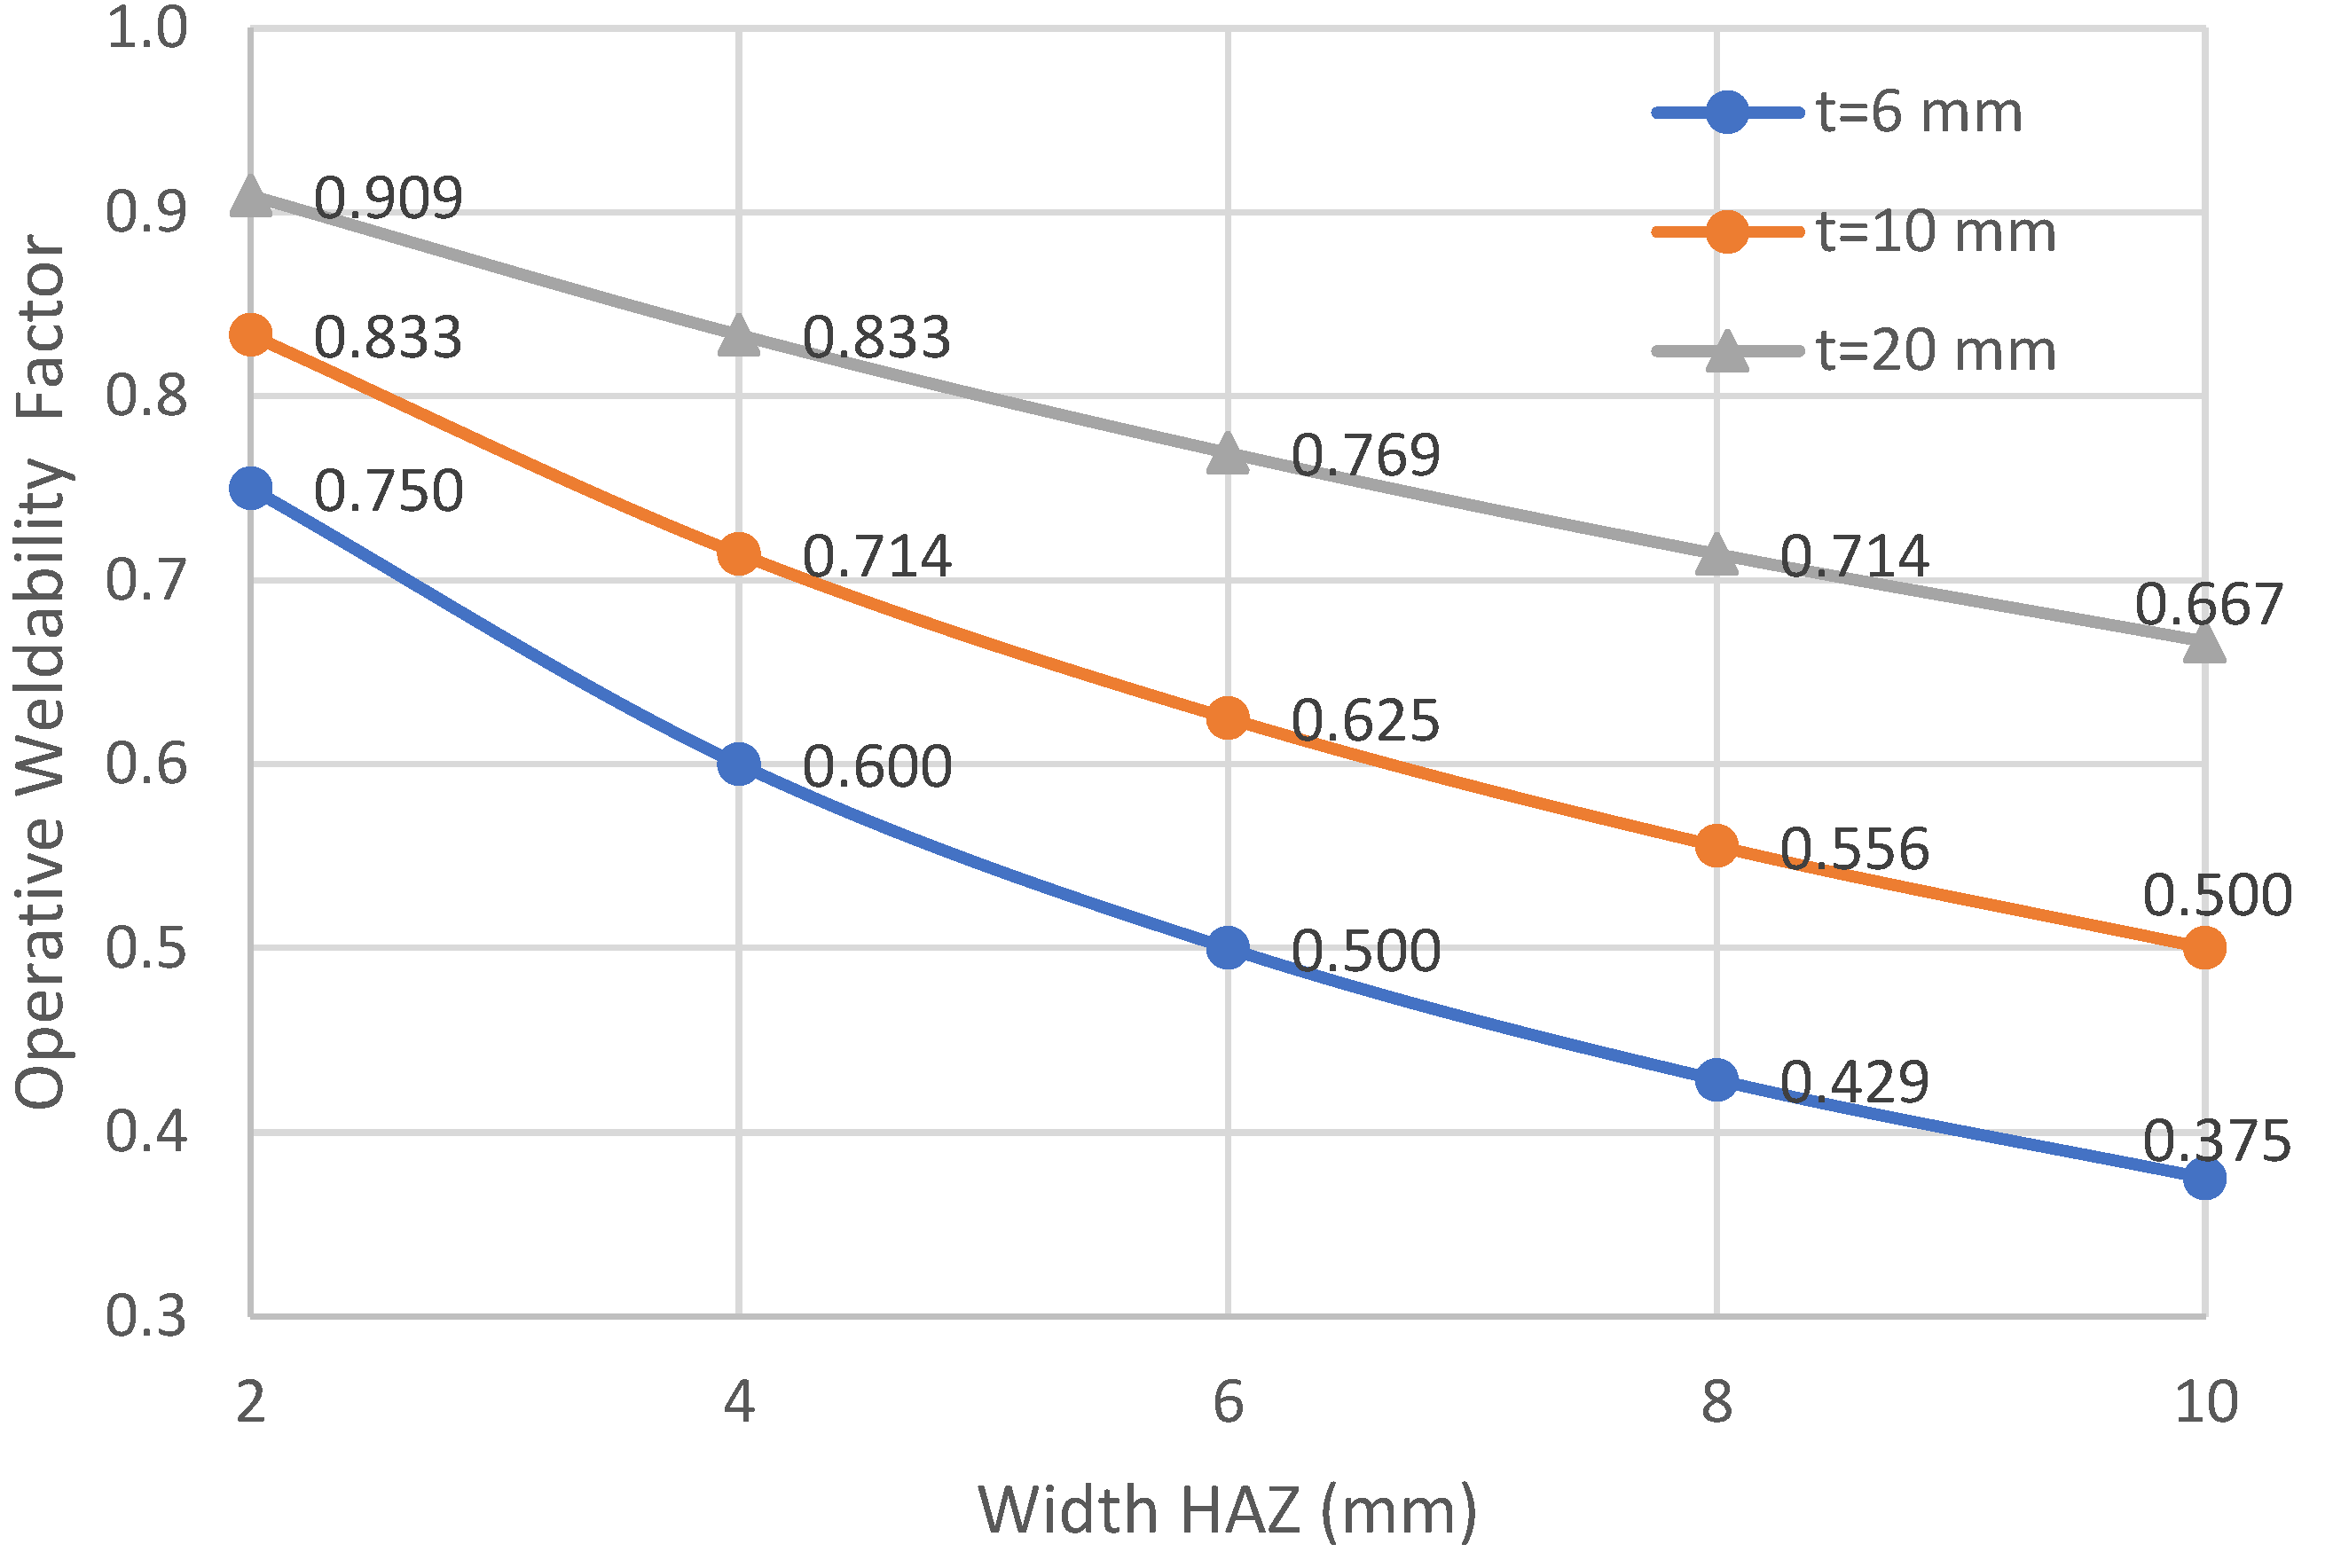
Figure 4.
Simulated values for metallurgical factors according to grain coarsening effect in HAZ.
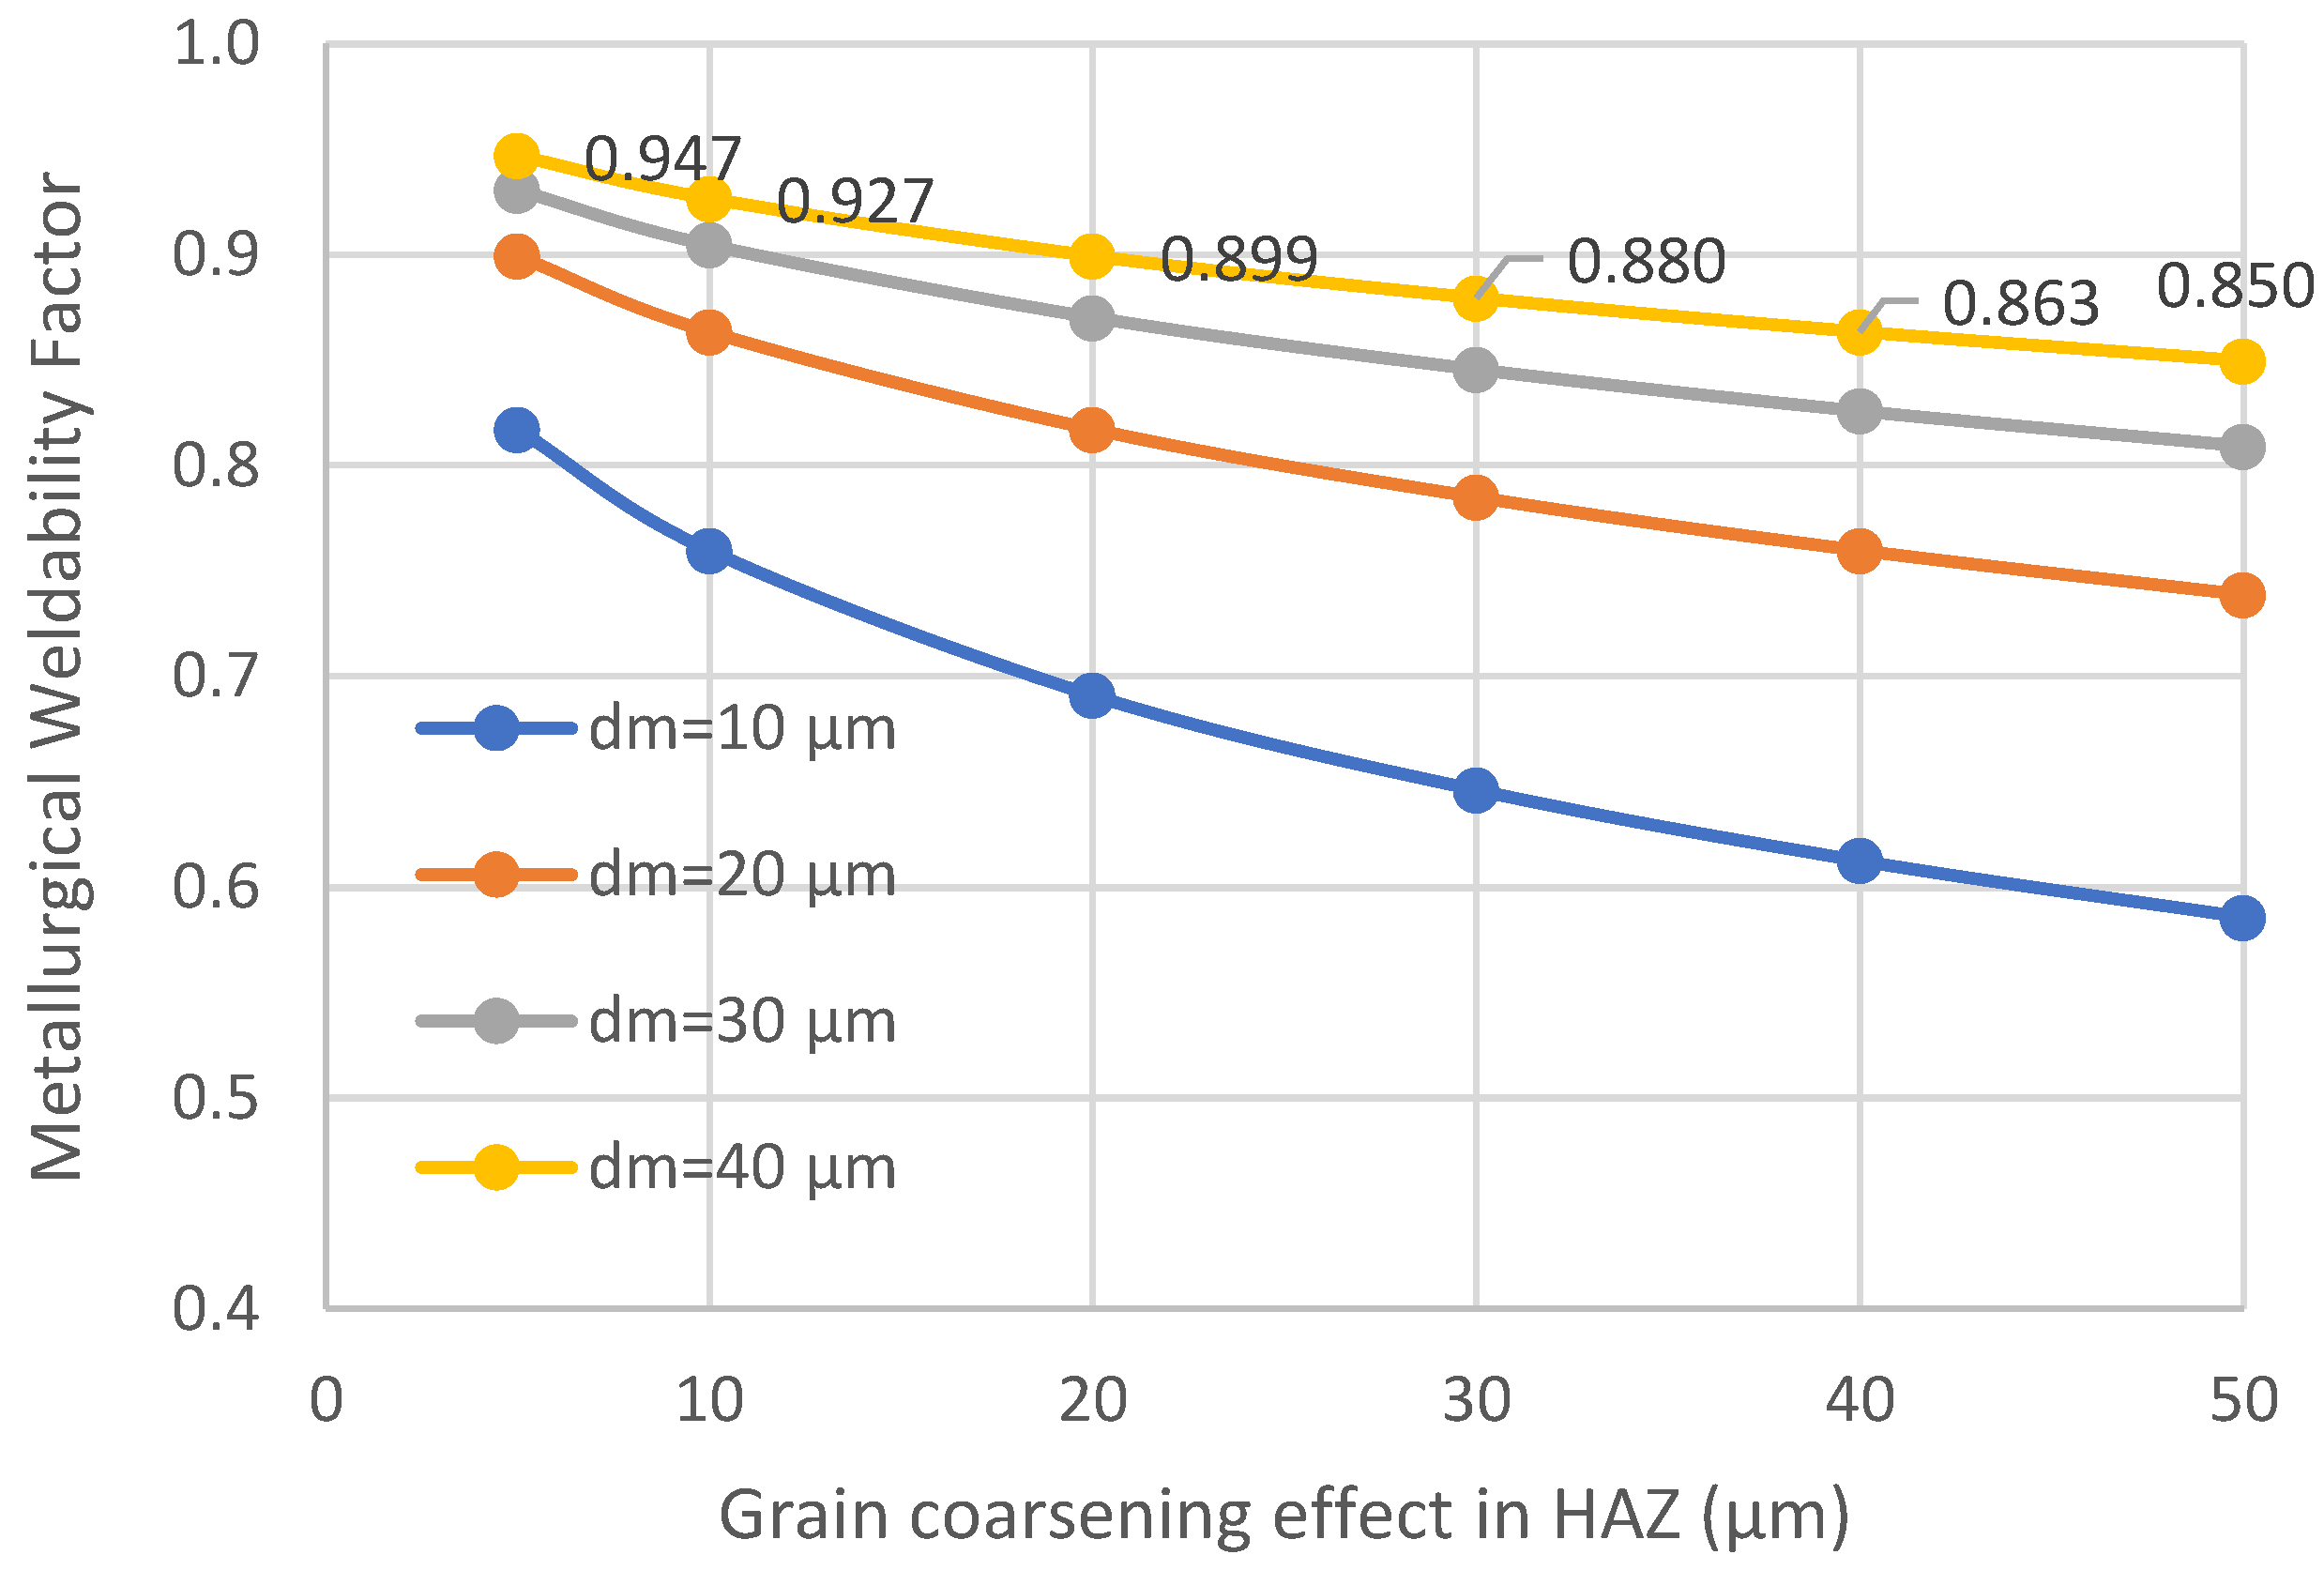
Figure 5.
Metallurgical factors based on grains size (S235JR welded samples).
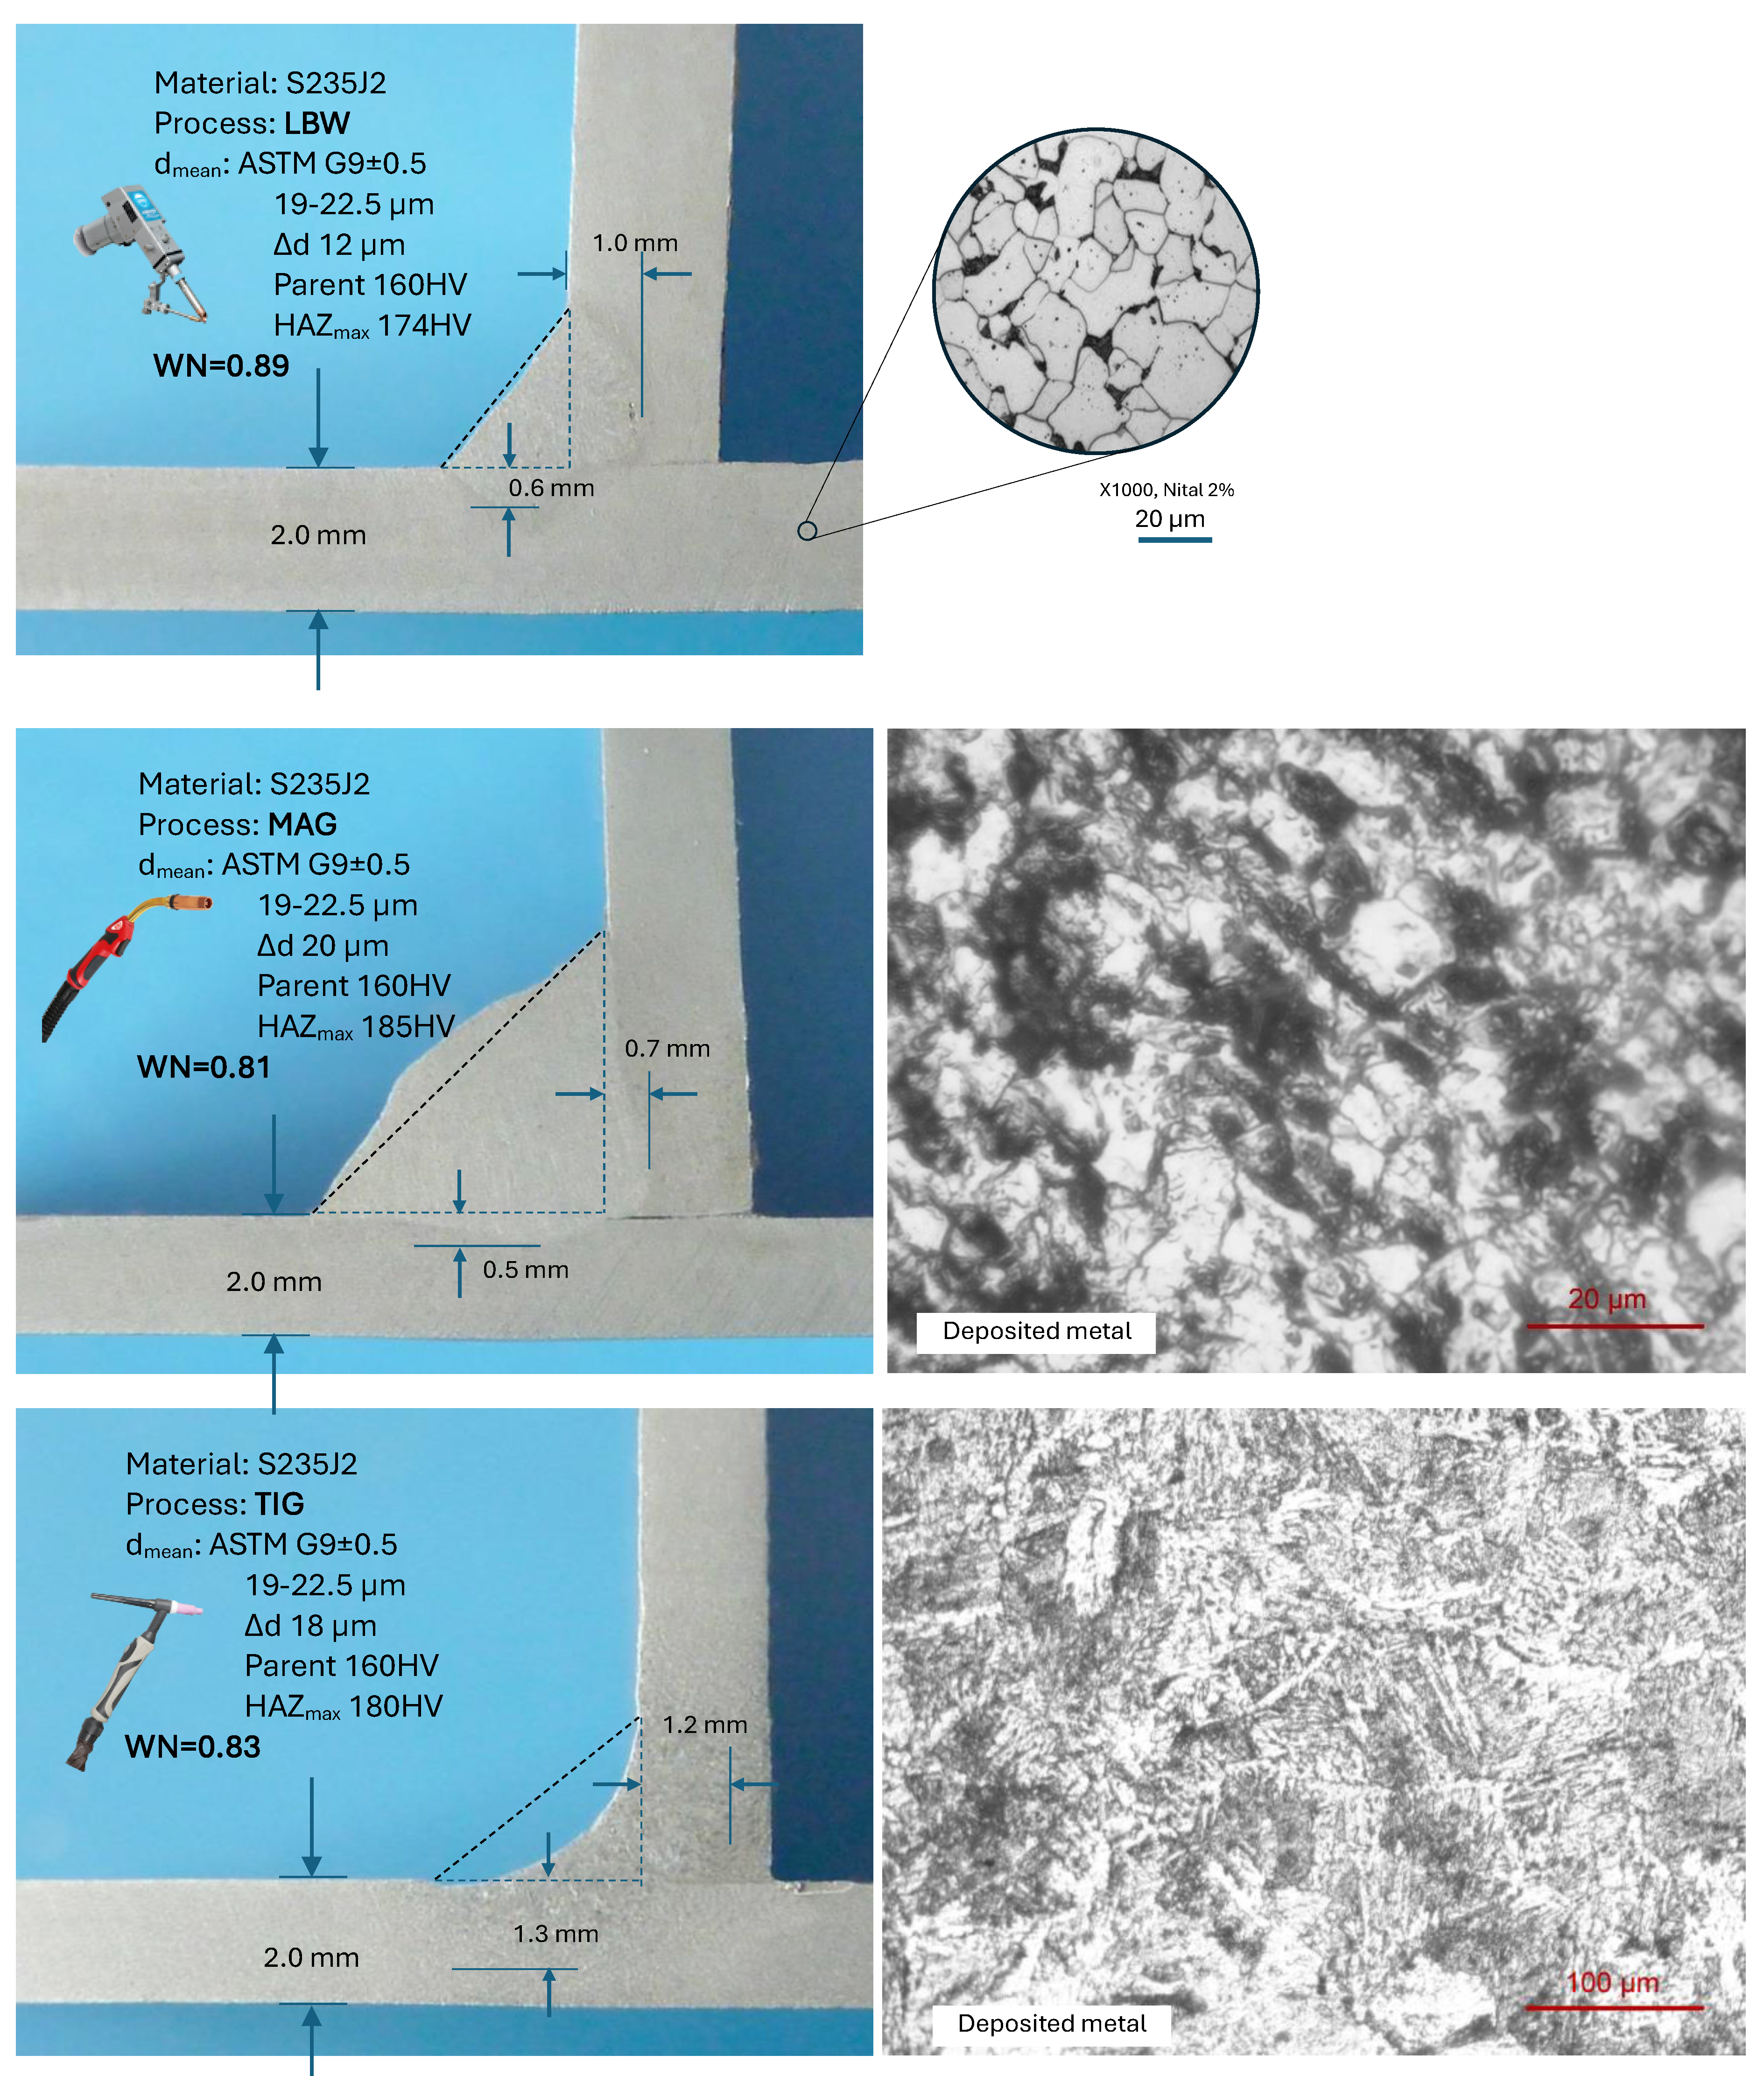
Figure 6.
Comparison between the predicted vs. measured weldability number for S235JR steel.
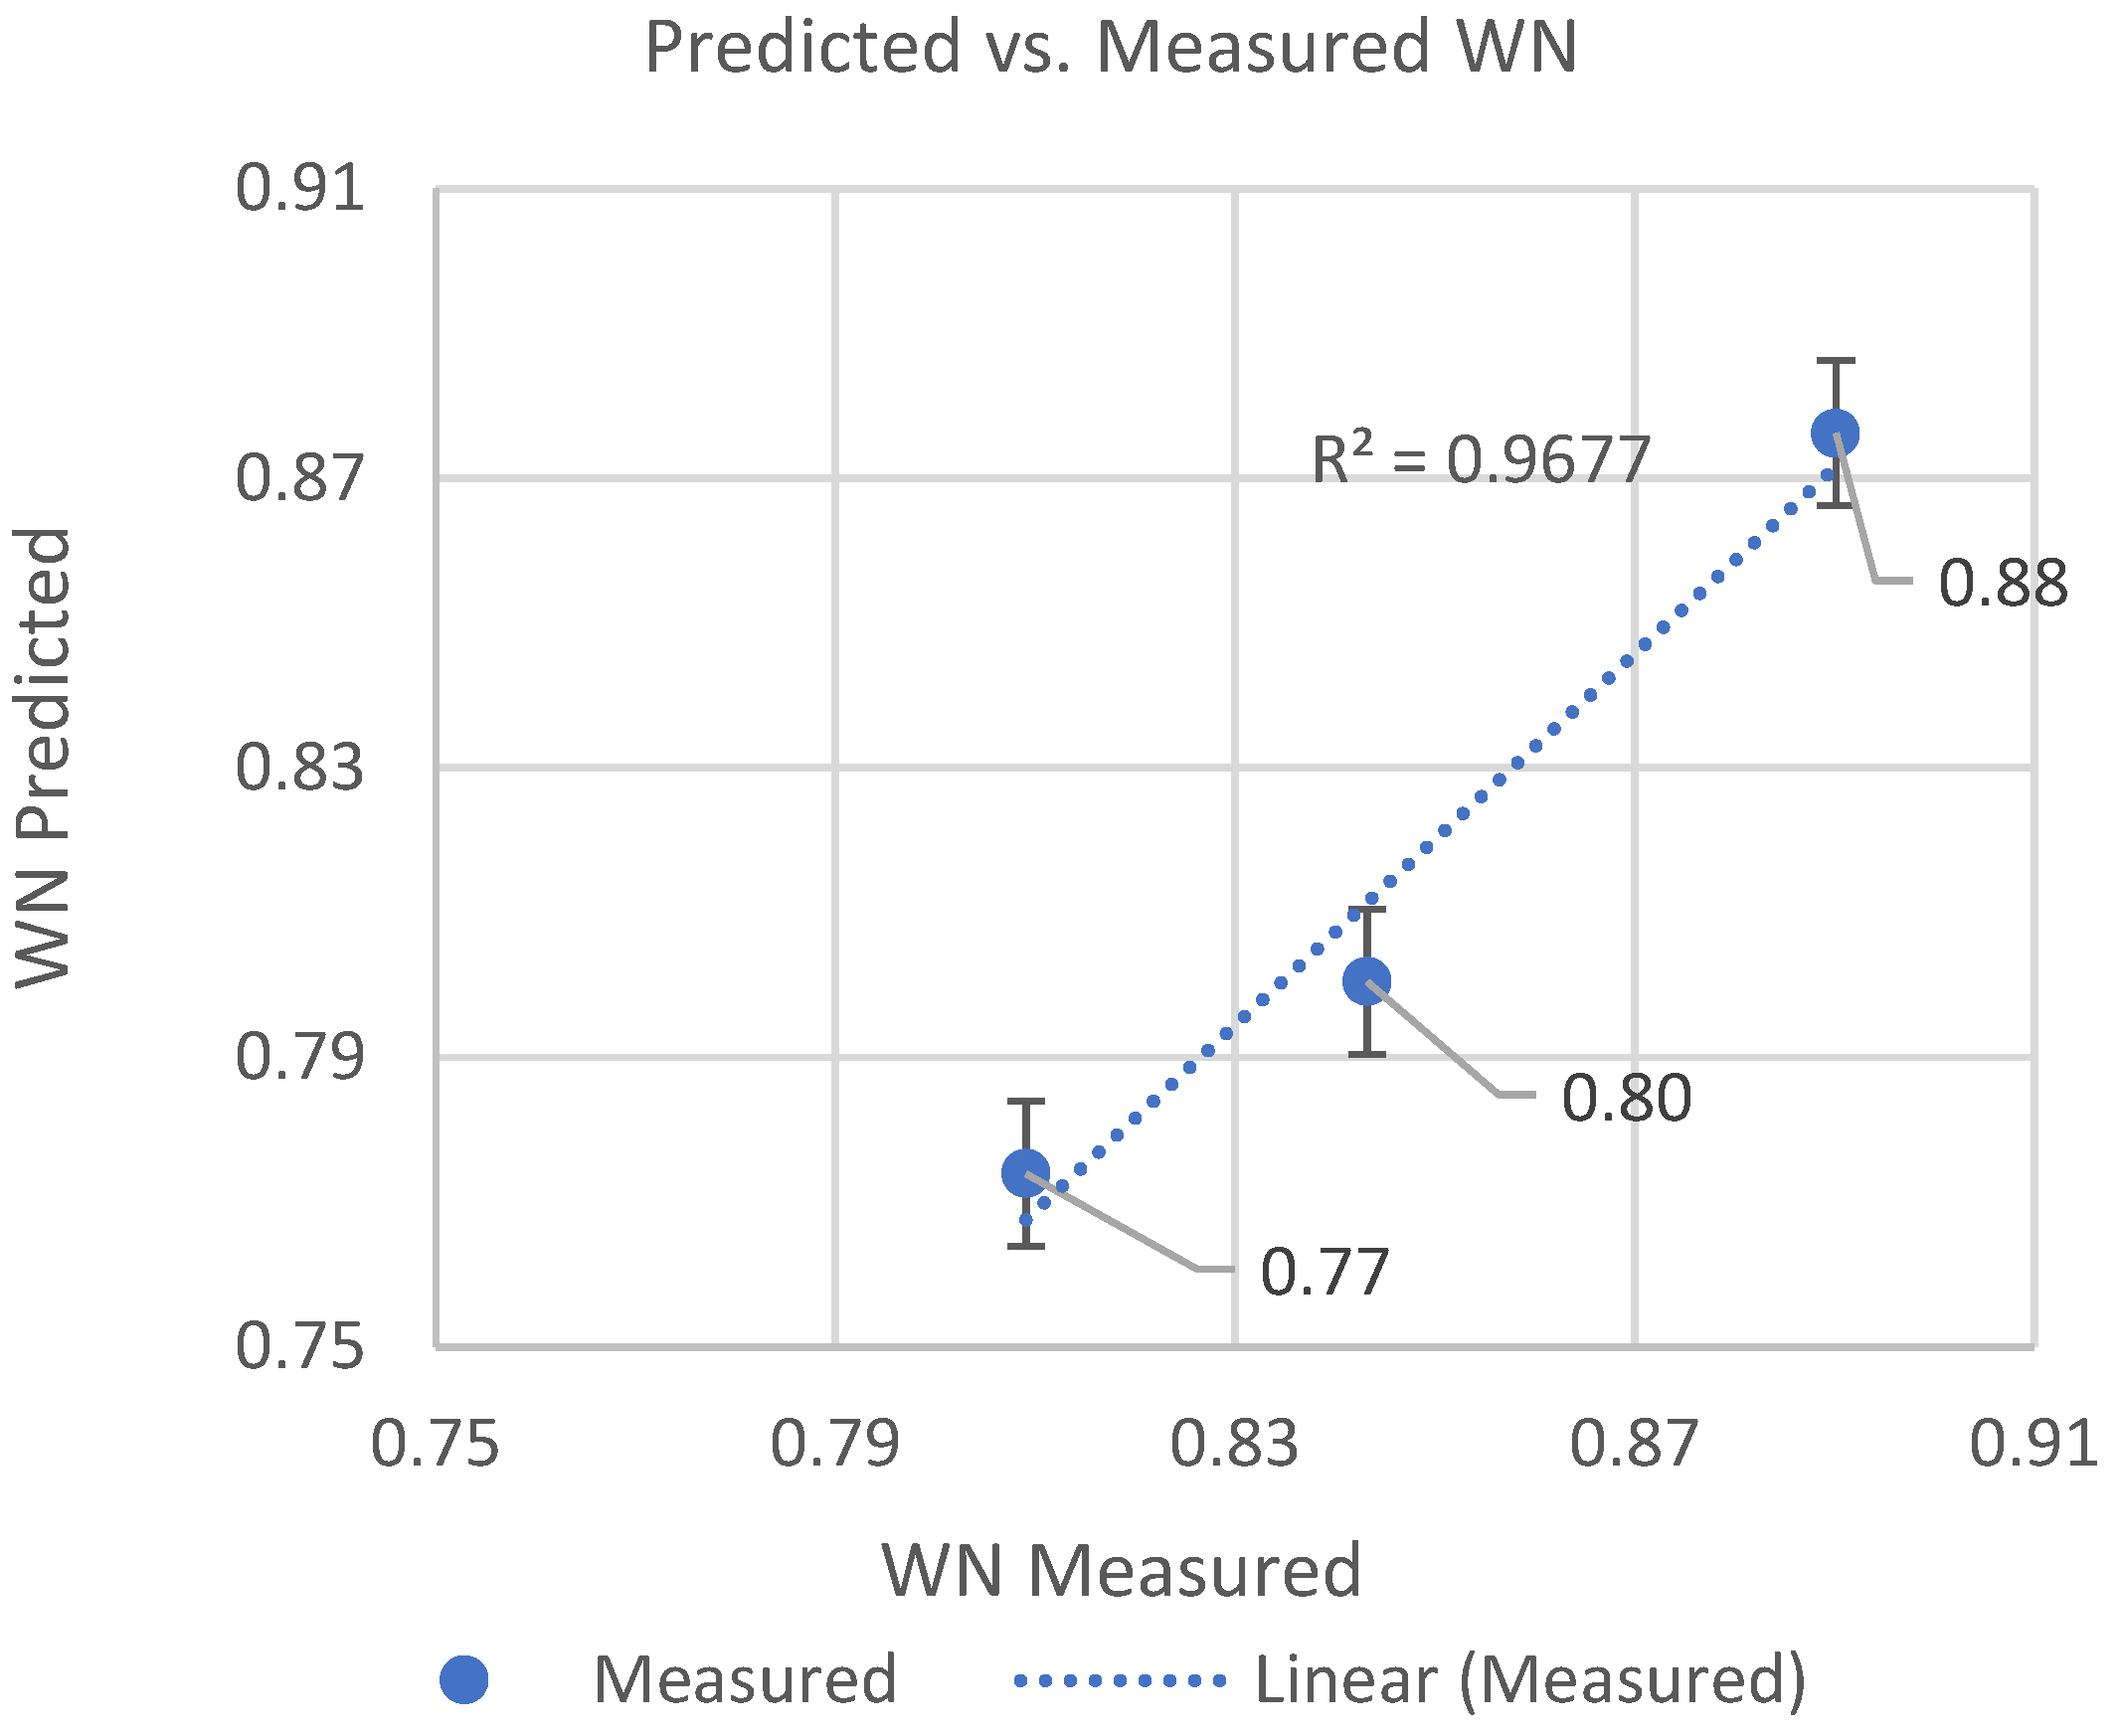

Table 1.
Weldability parameters according to ISO/TR 581:2005 [9].
Table 1.
Weldability parameters according to ISO/TR 581:2005 [9].
|
Metallurgical weldability Material properties |
Operative weldability Production properties |
Constructional weldability Design properties |
Chemical Composition
hot and cold working, heat treatment)
|
Welding preparation
|
Construction Design
|
Table 2.
Interpretation of weldability based on the Equivalent Risk Factor (ERF).
| Crt | Risk factor range ERF |
Weldability | Weldability description |
| 1 | < 0.25 | Excelent | Welding is straightforward and can be performed without special measures, offering wide flexibility in process selection |
| 2 | 0.25 - 0.40 | Good | Weldability remains good but may require additional controls such as preheating or filler metal adjustment |
| 3 | 0.40 – 0.60 | Limited | Weldability declines significantly; mechanical properties such as fatigue strength, toughness or corrosion resistance, may be compromised, requiring precise control of process parameters and possibly post-weld heat treatment |
| 4 | 0.60 – 0.80 | Poor | The probability of weld failure increases sharply, and welding may not be feasible without major changes in material selection or joint design |
| 5 | 0.80 – 1.00 | Not weldable | The risk of failure becomes severe |
Table 3.
The matrix of 20 risk factors.
| # | Variable |
Score = 0 Low Risk |
Score = 0.2 Minor Risk |
Score = 0.5 Moderate Risk |
Score = 1 High Risk |
| 1 | Carbon Equivalent (CE) | CE < 0.35 | CE 0.36–0.45 | CE 0.46–0.55 | CE > 0.55 |
| 2 | HAZ Sensitivity | Low-alloy, low-strength | Medium-strength steel (e.g., S355) | High-strength steel (S690–S960) |
Ultra-high-strength or dissimilar metals |
| 3 | Material Delivery State | Thermomechanically rolled or HTUFF steel | Normalized | As rolled | Cold worked / hardened |
| 4 | Anisotropy / Lamellar Tearing Risk | Z-quality plate or forged | Rolled plate with Z35 test | No Z-test / standard plate | Known lamellar tearing history |
| 5 | Welding Consumables | Correct type, dry, traceable | Slight deviation or exposure <4h | Reused, questionable storage | Moist, incorrect or expired |
| 1 | Welding Position | Flat (PA/1G) | Horizontal (PB/2G) | Vertical (PF/3G) | Overhead (PE/4G) |
| 2 | Welder Qualification | ISO 9606 certified, >5 yrs exp. |
Certified, <2 yrs experience |
Limited certification or re-cert pending | No valid certification |
| 3 | Welding Technique | EBW, LBW, GTAW full penetration, low heat | GMAW/MAG with controlled heat input | SAW, SMAW with variable control | High-heat manual (Oxy-fuel, high arc energy) |
| 4 | Joint Preparation | Fully machined, correct bevel, clean | Mechanically prepared, minor deviations | Hand-ground, inconsistent prep | Rough, rusted, or misaligned joint |
| 5 | Level of Automation | Fully robotic, adaptive control |
Mechanized with process monitoring | Manual semi-automatic |
Manual, uncontrolled parameters |
| 6 | Heat Input Control | Precise heat input logging | Some data available | Heat input estimated | No control or data |
| 7 | Interpass Temperature | Logged and maintained | Estimated manually | Uncontrolled but monitored | No control or recording |
| 8 | Preheating Practice Cooling Rate Management |
Preheat strictly per spec/ Controlled cooling, insulation used | Preheat slightly below spec/ Natural cooling, stable environment | No preheat for medium CE/ Rapid air cooling, variable | No preheat for high CE/ Forced cooling or temperature shock |
| 9 | Parent Metal Surface Condition | Clean, rust-free, degreased | Minor oxidation | Rusted with mill scale | Contaminated (paint, oil, grease) |
| 10 | Fit-up Tolerance | Perfect alignment, root gap optimized | Minor mismatch or undercut | Significant root opening or hi-lo | Severe misalignment, bridging needed |
| 11 | PWHT or Post Weld Cleaning | Full PWHT or clean grind | Minimal stress relief / brushing | No stress relief or brushing | No cleaning, heavy slag deposits |
| 1 | Restraint Level | Freely deformable | Low restraint (e.g., fillet welds) |
Moderate (plate butt welds) |
High (rigid, circular, thick sections) |
| 2 | Number of Passes | Single-pass, thin section | ≤3 passes | 4–6 passes | Multipass (>6), risk of residual stress buildup |
| 3 | Hot crack susceptibility (eq 3). | HCS ≤ 0.02 | 0.02 < HCS ≤ 0.04 | 0.04 < HCS ≤ 0.06 | HCS > 0.06 |
| 4 | Cold crack susceptibility (eq.5) | CCS ≤ 0.2 | 0.2 < CCS ≤ 0.4 | 0.4 < CCS ≤ 0.6 | CCS > 0.6 |
Table 4.
Cold cracking risk evaluated based on chemical composition of parent material.
| Crt | Parameter | Symbol | Formula | Interpretation AWS/IIW |
| 1 | Carbon equivalent (structural steels) |
CE (IIW) | CET ≤ 0.25: Low risk (no preheat) CET 0.25–0.35: Low risk (preheat required fot t > 25 mm) CET 0.35–0.40: Medium risk, preheat and interpass control CET > 0.40: High risk, strict preheat (≥150–200 °C), and slow cooling |
|
| 2 | Carbon equivalent (Thin plates, high alloys) |
CET | ||
| 3 | Welding Crack Susceptibility (HSLA steels) |
PCM | PCM < 0.20 Very low risk PCM 0.20–0.25 Medium risk PCM > 0.25 High risk |
Table 5.
Cold cracking susceptibility (CCS) index components.
| Crt | Parameter | Symbol | Min | Max | Normalised Formula | Observations |
| 1 | Carbon equivalent | CEnorm (%) |
0.10 | 0.70 | Typical for structural steels | |
| 2 | Material thickness | tnorm (mm) |
2 | 80 | Thin to thick plate welding | |
| 3 | Preheating temperature | Tp_norm (°C) |
5 | 200 | Most arc welding processes | |
| 4 | Diffusible hydrogen | H₂_norm (ml/100 g) |
2 | 50 | Low- to high-diffusible hydrogen |
Table 6.
Variable section of risk factors matrix for Alluminium alloys.
| Crt | Variable | Score = 0 Low Risk |
Score = 0.2 Minor Risk |
Score = 0.5 Moderate Risk |
Score = 1 High Risk |
| 1 | Hot Cracking Susceptibility (HCS) | Pure Al (1XXX), low alloyed 5XXX with <3% Mg | 5XXX with Mg < 4.5%, proper filler | 6XXX with Mg₂Si phase, medium-thick sections | 2XXX/7XXX (Cu, Zn rich), very crack-sensitive alloys |
| 2 | Porosity Sensitivity (PS) | Clean surface, dry gas, proper parameters | Minor porosity in thick sections or minor contamination | Visible gas porosity, moderate Mg content | Severe porosity due to poor shielding, high Mg (>5%), contamination |
| 3 | Alloy Type & Series (ATS) | 1XXX, 3XXX, 5XXX (non-heat-treatable, highly weldable) | 6XXX with matched filler and slow cooling | 6XXX with rapid cooling, softening; or high Si | 2XXX or 7XXX, prone to cracks, poor fusion |
| 4 | Filler Metal Compatibility (FMC) | Exact matching filler (e.g., ER5356 for 5XXX) | Acceptable mismatches with minor strength issues | Filler may lead to poor ductility or microcracks | No compatible filler, intermetallic formation |
| 5 | Thermal Conductivity Factor (TCF) | Thin plates, low heat sink, easy control | Moderate thickness with proper preheat | Thick sections without preheating | Very thick sections, fast heat dissipation, poor fusion |
| 6 | Oxide Film Risk (OFR) | Mechanically/chemically cleaned, freshly prepared | Minor delay between prep and weld (<30 min) | Moderate oxide build-up or old prep | No prep, thick oxide layer, erratic fusion |
| 7 | Post-Weld Softening Index (PWSI) | No strength loss (5XXX, strain hardened only) | Mild loss, easily restorable | 6XXX with moderate property loss after weld | 6XXX or 7XXX with severe softening, no aging recovery |
| 8 | Segregation Sensitivity (SS) | Uniform alloy, no critical minor elements | Minor segregation, manageable phases | Noticeable microsegregation (e.g., Cu, Fe) | Strong localized segregation, brittle intermetallics |
| 9 | Age-Hardening Sensitivity (AHS) | Non-heat-treatable alloy, no aging needed | Easy post-weld aging recovery | Post-weld aging requires precise cycles | Age hardening can't be recovered or is unstable after weld |
| 10 | Weld Joint Geometry Risk (WJG) | Flat, aligned butt weld, low restraint | Mildly constrained T-joint | Moderate misalignment, transition zones | Thick-to-thin joints, high restraint, complex shapes |
Table 7.
Matrix weldability scores based on quality control of welded samples.
| Crt | Variable | Score = 0.20 | Score = 0.50 | Score = 0.80 | Score = 1 |
| 1 | QFi | Quality Level < D | Quality Level D | Quality Level C | Quality Level B |
| 2 | Porosity | Quality levels according to EN ISO 5817: 2023 |
|||
| 3 | Lack of fusion | ||||
| … | ….. | ||||
| n | Geometric imperfections | ||||
Table 8.
Weldability Number (WN) calculated based on quality control and AI algorithms.
| Crt | Weldability Number |
Weldability |  |
| 1 | 0.80 – 1.00 | Excelent | |
| 2 | 0.60 – 0.80 | Good | |
| 3 | 0.40 – 0.60 | Limited | |
| 4 | 0.25 - 0.40 | Poor | |
| 5 | < 0.25 | Not weldable |
Table 9.
Experimental determination of weldability number for S235JR welded steel, 2 mm thickness.
| Welding Process | Grain coarsening effect (μm) |
HAZ width (mm) |
Maximum HV in HAZ |
Material factor | Metallurgical factor | Operative factor | Quality Control Factor | Weldability Score |
| LBW | +12 | 0.3 | 174 | 0.920 | 0.867 | 0.870 | 1.0 | 0.885 |
| MAG | +20 | 0.7 | 185 | 0.865 | 0.834 | 0.741 | 1.0 | 0.813 |
| TIG | +18 | 0.6 | 180 | 0.889 | 0.841 | 0.769 | 1.0 | 0.833 |
Disclaimer/Publisher’s Note: The statements, opinions and data contained in all publications are solely those of the individual author(s) and contributor(s) and not of MDPI and/or the editor(s). MDPI and/or the editor(s) disclaim responsibility for any injury to people or property resulting from any ideas, methods, instructions or products referred to in the content. |
© 2026 by the authors. Licensee MDPI, Basel, Switzerland. This article is an open access article distributed under the terms and conditions of the Creative Commons Attribution (CC BY) license (http://creativecommons.org/licenses/by/4.0/).
Copyright: This open access article is published under a Creative Commons CC BY 4.0 license, which permit the free download, distribution, and reuse, provided that the author and preprint are cited in any reuse.