

Submitted:
24 August 2026
Posted:
25 August 2026
You are already at the latest version
Abstract
Climate change influences crop prices through its impacts on agricultural production, costs, consumer and producer behavior, and the market equilibrium. Therefore, this study aims to examine the dynamic relationship between climate change and date palm producer prices in Saudi Arabia utilizing a Vector Autoregression (VAR) method to investigate short-run and long-run dynamics. The analysis incorporates impulse response functions (IRFs), forecast error variance decomposition (FEVD), and historical decomposition (HD). The empirical findings indicate that date palm producer prices exhibit strong persistence and are predominantly explained by their own innovations in the short run. Although climate factors’ shocks exert measurable short-run effects on producer prices, these responses diminish over time, indicating that the market effectively absorbs climate-related changes while maintaining long-run equilibrium. However, FEVD and HD results reveal that the contribution of temperature and relative humidity to producer price fluctuations increases steadily over time, highlighting the growing importance of climate change in shaping long-term market dynamics. The findings emphasize the need for policies that boost climate-smart agriculture and drought-tolerant date palm varieties. Increasing climate adaptation and risk management strategies will improve the resilience of the date palm sector, reduce long-term price volatility, promote sustainable agricultural development, and enhance food security in Saudi Arabia.
Keywords:
agricultural commodity price
; climate risk
; future precipitation
; market price shocks
1. Introduction
Climate change has become one of the major challenges affecting agricultural production and commodity markets worldwide. It is critically affecting farming systems globally due to increasing temperatures, fluctuating rainfall patterns, and other frequent extreme weather events. These fluctuations directly impact crop productivity and indirectly influence consumer willingness, agricultural prices, and market price stability [1,2] In arid and semi-arid regions such as Saudi Arabia, agriculture is mostly vulnerable due to harsh climatic conditions and inadequate water resources [3]. Agriculture remains a vital sector in Saudi Arabia, contributing to food security, rural livelihoods, and economic diversification under Vision 2030. Among agricultural commodities, the date palm (Phoenix dactylifera) holds particular importance for its nutritional components, cultural heritage, and economic significance as a strategic crop. Saudi Arabia is recognized as one of the world’s leading producers of date palms; in addition, the date palm industry represents a key factor in the country’s economic shape. However, this sector is increasingly exposed to the impacts of climate variability. The climatic shifts can directly and indirectly affect crop yields, production costs, and market prices in Saudi Arabia. Therefore, Climate change poses significant challenges to agricultural productivity and price stability.
Producers’ prices serve as a significant indicator of agricultural market dynamics, indicating the interaction between supply and demand forces and external shocks. Understanding the relationship between climate factors and date palm producers’ prices is therefore essential for designing effective agricultural policies and risk management strategies.
Despite the importance of this association, empirical evidence on the dynamic relationship between climate variables and agricultural prices in Saudi Arabia remains restricted. Limited studies have shown how temperature and humidity shocks convey to producers’ prices over time and whether these effects are temporary [4]. To address this gap, this study aims to explore the dynamic nexus between climate change and date palm producer prices in Saudi Arabia. It seeks to quantify the temperature, precipitation, and humidity shocks on date palm producers' prices and to assess the relative contribution of climate variables to price fluctuations. Therefore, the research hypothesized that:
H1: There is a dynamic interrelation between climate variables and date palm producers’ prices
H2: Climate change shocks significantly influence palm producers’ prices.
H3: A positive response of the date palm producers’ prices to climate change.
This study offers a novel contribution by focusing on price dynamics rather than production and specifying the transmission of precipitation, temperature, and humidity shocks. It advances the literature by providing new empirical evidence on short- and long-run adjustment mechanisms as well as climate-impacted price volatility. These findings guide decision-makers in enhancing agricultural development in arid environments and supporting the long-run sustainability of the date palm sector.
2. Literature Review
Several investigators indicated that climatic shocks reduce production efficiency, increase production uncertainty, and alter market supply, ultimately affecting the agricultural price mechanism [5,6]
Temperature is one of the most important climatic determinants of date palm growth and productivity. Date palms grow best under warm, dry conditions during flowering and fruit development [7]; however, excessive heat disrupts pollination, fruit development, and physiological processes, leading to lower yields and poorer fruit quality ([8,9]. Similarly,[10] reported that warmer environments with lower humidity promote earlier fruit maturation and higher productivity. In Algeria, [11] found that air temperature is a key determinant of date palm phenology, fruit development, and yield. Beyond biological production, several researchers applied econometric methods to examine the impact of climate change on crop prices, for instance [12] used a copula-based econometric approach focusing on empirical marginal probability, and the results showed that climate extremes significantly influence crop yield, production, and prices, while [13] employed panel econometric analysis considering the simple revenue model with heterogeneity investigation, and the results conveyed that extreme weather events increase crop revenue variability despite partial price compensation for yield losses.
In addition, precipitation also plays a vital role in date palm production despite the crop's adaptation to arid environments. Excessive rainfall during flowering and fruit ripening reduces fruit quality, disrupts pollination, delays maturation, and lowers productivity [8,14,15,16]. Baaghideh et al [17] applied the Mann–Kendall trend test together with CMIP5 climate projections and stated that future climate change will alter the climatic suitability of date palm cultivation, requiring adaptation to changing environmental conditions. Likewise, Dhaouadi et al. [18] found that poor irrigation management, inadequate water quality, and climate variability reduced palm productivity and fruit quality, threatening the long-term sustainability of production systems. In Ethiopia, Lemlem et al. [19] further showed that traditional production practices and management constraints limit date palm productivity, emphasizing the importance of improved cultivation and management strategies.
Relative humidity is an additional important climatic factor affecting date palm production and fruit quality. Low humidity favors fruit ripening, whereas excessive humidity delays maturation and increases physiological disorders and disease incidence [8,9]. Mohammed et al[20] confirmed the importance of temperature and relative humidity in fruit development, showing that controlled environmental conditions substantially improve fruit quality and reduce postharvest losses.
Climate variability affects agricultural markets by influencing both production and producer prices. Changes in yield and fruit quality alter market supply, resulting in fluctuations in producer revenues and price formation [16]. The study investigated the effects of climate change and agricultural prices on the production of crops using an econometric supply response model with country-level production, price, and climate data. The results showed climate change adversely affected agricultural production and intensified production fluctuations, contributing to increased price volatility [21].
Another study examined the impact of climate change on crop prices and price volatility in the United States using statistical crop models integrated with an economic model. The findings indicated that climate change reduced crop yields and increased yield variability. However, the effects on price volatility were relatively limited because crop storage and agricultural support policies helped stabilize markets [22].
A recent study investigated the factors influencing consumer purchasing decisions for Khalas dates variety in Saudi Arabia using the entropy weighting method and binary logit models. The results showed that price was among the key attributes affecting consumers' purchasing decisions, alongside size, mellowness, and color [23].
Although previous studies have extensively examined the effects of climate change on date palm growth, productivity, and fruit quality, limited attention has been given to the dynamic effects of climatic shocks on date palm producer prices, particularly in arid and semi-arid regions. Therefore, this study addresses this gap by employing a Vector Autoregression (VAR) model to examine the dynamic effects of shocks in temperature, precipitation, and relative humidity on date palm producer prices in Saudi Arabia. The analysis is further supported by post-estimation diagnostic and robustness tests, including impulse response functions (IRFs) and forecast error variance decomposition (FEVD), to evaluate the dynamic interactions and responses among the variables.
3. Materials and Methods
3.1. Data Sources
Based on data availability, this study employs annual time-series data for Saudi Arabia covering the period 1991–2024. The study collected data on producer prices of date palms (USD per ton) from the [24] Besides, the date of climate change factors involved precipitation (mm), mean surface air temperature (°C), and yearly average relative humidity (%), generated from the Global Data Lab [25] were collected. All data were treated as endogenous variables under the study econometric VAR approach.
The justification for selecting the date palm producer prices is that they directly reflect farm income and economic situations of the producers, making them a suitable indicator for assessing the economic impacts of climate variability on producers. Climate variables are selected due to their direct influence on date palm water requirements and physiological development, which can ultimately affect production levels and producer prices. Also, these factors are particularly relevant in arid environments, where climate variability significantly affects agricultural supply and, consequently, producer prices and consumer behavior.
Table 1 displays statistical information and normality test results for the selected variables. The descriptive statistics indicate that while climatic variables such as temperature and humidity are relatively stable over the sample period, precipitation and date palm producer prices exhibit greater variability. Likewise, the normality test indicates that date palm producer price (DPP) and yearly average relative humidity (YARH) are normally distributed. Precipitation (PRE) and average mean surface air temperature (ASAT) deviate from normality. Therefore, all data were transformed into natural logarithms to ensure reliable results.
3.2. Preliminary Tests
To examine the stationarity properties of the selected variables, the study employs the Phillips–Perron (PP) unit root test [26] .The PP test is preferred because it suggests robust results in the presence of heteroskedasticity and serial correlation, which are common in time-series data such as climate variables and agricultural prices.
3.3. VAR and its Environment Tests.
After ensuring that the selected variables are stationary, we proceeded to estimate the VAR model. The VAR model was introduced by [27] as a flexible framework for analyzing dynamic relationships among multiple time-series variables without relying on priori theoretical constraints.
In the VAR model, represents a vector of endogenous variables that includes four variables: LnDPP, LnPRE, LnASAT, and LnYARH. The VAR model can be conveyed as:
Whereas: is a vector of endogenous variables at time, , and signifies lagged values of all variables in the system. = coefficient matrices; = lag length & = error term.
The equation for each variable in the study can be stated as follows:
Whereas: are constant terms, are coefficients & are error terms.
The optimal lag length in the VAR model (is clarified using universal information criteria. The lag order that minimizes these criteria is selected as the optimal specification for the model.
3.3.1. Diagnostic Validation of the VAR Model
The Autocorrelation LM diagnostic test, based on auxiliary regression, is employed to detect serial correlation in the residuals, following [28]. After estimating a VAR, we got residuals , Then the auxiliary regression takes the form:
The LM test statistic is computed as:
following a chi-square distribution.
Whereas: = residuals from the VAR model; = original regressors (lagged endogenous variables); = number of lags tested for autocorrelation; = number of observations
= coefficient determination from auxiliary regression; = error term.
Then, to confirm the stability of the VAR results, the Eigenvalue stability condition was checked using the eigenvalues of the companion matrix. A VAR model is considered stable or stationary if all eigenvalues lie inside the unit circle. Then the VAR model is stable if it follows:
, whereas: = eigenvalues of the companion matrix and = modulus (absolute value).
3.3.2. Post-Estimation Dynamic Analysis
Following the estimation and stability of the VAR model, post-estimation dynamic investigations are conducted using IRFs and FEVD to examine dynamic interactions amongst the selected variables. IRFs are adopted to trace the time path of the effects of structural shocks on the endogenous variables within the VAR system. The IRFs illustrate the direction (+) or (-) impact, magnitude, and persistence of shocks. Therefore, the VAR model can be expressed in its moving average (MA) form as:
Whereas: = vector of endogenous variables, = matrices of impulse response coefficients, which measure the response of variables to shocks over time. represents the vector of innovations (shocks). IRFs are typically orthogonalized using Cholesky decomposition, which imposes an ordering of variables. IRFs show how climate shocks affect producer prices over time.
FEVD is usually used to compute the relative contribution of each structural shock to the variability of the endogenous variables over different forecast horizons (periods). Then the FEV for horizon is:
The contribution of shocks from variable to variable is:
whereas: = covariance matrix of residuals and , = selection vectors. In our selected variables (LnDPP, LnPRE, LnASAT, LnYARH), the FEVD reveals which variable contributes most to price variations
. The contribution of shocks from variable to variable is: whereas: = covariance matrix of residuals and , = selection vectors. Among our selected variables (LnDPP, LnPRE, LnASAT, LnYARH), the FEVD indicates which variable contributes most to price variation.
In addition, historical decomposition (HD) was employed to attribute observed fluctuations in the variables to current and past shocks. Based on the moving average of the VAR model, HD expresses each variable as the cumulative effect of current and past structural shocks. HD is obtained via Cholesky decomposition and follows the form:
Whereas: represents a vector of endogenous variables at time ; represents a deterministic component (constant or trend); stands for impulse response coefficients examing the effect of a shock at lag ; is the structural shock at time and n is the number of variables (shocks).
4. Results
4.1. Unit Root Results
As shown in Table 2, the Phillips-Perron unit root results indicate that all selected variables are stationary at levels. Specifically, LnPRE and LnYARH are stationary at the 1% significance level, suggesting strong verification against the presence of a unit root. In contrast, LnDPP and LnASAT are stationary at the 10% level, indicating acceptable evidence of stationarity. Therefore, the findings confirm that the variables are integrated of order zero, I(0), supporting their suitability for estimation within a VAR framework. Furthermore, the Phillips–Perron results indicate that all variables are stationary at first difference at the 1% significance level. The test statistics are significantly more negative than the corresponding critical values, and the MacKinnon p-values are effectively zero.
4.2. VAR Results
The VAR results indicate strong persistence in producer prices of date palms, as the LnDPP(-1) has a positive and statistically significant coefficient, suggesting that past producer prices exert a strong influence on current price levels (coefficient = 0.7651, t = 3.6929). In contrast, most climatic variables show weak or not statistically significant short-run effects. The results also confirme that LnASAT(-2) is marginally significant (coefficient = 0.3375, t = 1.8030 at 10% level), while precipitation and humidity variables are largely insignificant. We concluded that the VAR system is mainly driven by own-variable dynamics, indicating weak short-run interdependence among climate variables and producer prices (Table 3).
The general system results indicate strong model performance. The determinant of the residual covariance matrix is very small (1.01×10⁻¹¹, adjusted; 2.68×10⁻¹², unadjusted), suggesting low residual interdependence across equations. The results also show a high log-likelihood value (244.686), implying a good fit. In addition, the information criteria are negative (AIC = -13.043 and SC = -11.394), validating the suitability of the VAR condition and supporting the reliability of the estimates.
4.3. VAR Diagnosis Results
4.3.1. VAR Lag Order Selection Analysis
To ensure the reliability of the long-run estimates and avoid issues of serial correlation, we determined the optimal lag length for the VAR system using five standard criteria: the Likelihood Ratio (LR), Final Prediction Error (FPE), Akaike Information Criterion (AIC), Schwarz Criterion (SC), and Hannan-Quinn Criterion (HQ). As displayed in Table 4, there is a strong consensus among the selection criteria. The LR, FPE, AIC, and HQ all collectively select Lag 1 as the optimal structure, as indicated by the more asterisks. While the SC suggests a lag of 0, the preference is for Lag 1 to examine historical dynamics and dependencies between the selected variables.
4.3.2. Autocorrelation LM Test
From Table 5, the VAR residual serial correlation results, estimated by the LM test, indicate that the VAR model does not suffer from serial correlation problems in the residuals. At lag 1, the p-value is 0.2751, at lag 2 it is 0.8424, and at lag 3 it is 0.4399, all of which are above the 5% significance level. Similarly, the joint tests for lags 1 to 3 also show insignificant results (p-values = 0.2751, 0.2544, and 0.0975), indicating that the null hypothesis of no serial correlation cannot be rejected. Therefore, these outcomes confirm that the VAR model residuals are free from autocorrelation, supporting the reliability and validity of the estimated model.
4.3.3. Eigenvalue Stability Results
To assess the stability of the estimated VAR system, the roots of the characteristic polynomial were examined. As reported in Table 6, the results confirm that the VAR system is stable and satisfies the stationarity condition. Specifically, all estimated eigenvalues (roots) have less than one, ranging from 0.223 to 0.774.
This finding indicates that the dynamic relationships among date palm producer prices (DPP), precipitation (PRE), mean surface air temperature (ASAT), and relative humidity (YARH) are stable, confirming the reliability of the estimated VAR model. This stability confirms that any external shocks to these climatic or price factors will ultimately return to equilibrium. This stability is essential as it ensures that the IRFs and FEVD derived from this model are valid.
4.4. Dynamic Analysis: Innovations, Shocks, and Forecasting
To further explore the dynamic interactions between the variables, IRF, FEVD, and HD methods were employed.
4.4.1. Impulse Response Functions Results
Based on the results depicted in Figure 1, the IRF traces the dynamic transmission of climatic shocks to date palm producer prices throughout a 10-year forecast horizon. A one-standard-deviation shock to LnDPP generated an immediate and substantial own response of approximately 0.08 units, which declined gradually but remained positive throughout the forecast horizon. This persistent response indicates a high degree of price persistence, suggesting that adjustments to producer price shocks occur gradually over time. Regarding the climate–price nexus, a shock to LnASAT caused a reasonable increase in producer prices, peaking in the second period before gradually converging to equilibrium. In contrast, LnPRE shocks caused a negligible positive response, indicating a limited short-run influence on producer prices. Cross-variable responses remained small throughout the forecast horizon, and all impulse response functions converged to zero by the end of the analysis period, confirming the stability of the estimated VAR system. The findings suggest that although date palm producer prices respond to short-term climatic shocks, these effects are temporary and do not compromise the long-run stability of the date market.
4.4.2. Empirical Results of FEVD
As reported in Table 7, the FEVD results are interpreted over the short-run (periods 1–4) and long-run (periods 5–10) horizons. In the short run, the FEVD of LnDPP is overwhelmingly explained by its own innovations (approximately 96–100%), whereas the contributions of LnPRE, LnASAT, and LnYARH remain negligible. These findings indicate strong price persistence and suggest that climatic factors exert only limited short-run influence on producer price dynamics. LnPRE is also largely driven by its own innovations (around 73–99%), although the influence of LnDPP starts to emerge by periods 3–4. For LnASAT, own shocks dominate (about 78–86%), with limited effects from LnDPP and LnPRE, while LnYARH is mainly influenced by LnASAT (around 66–72%) rather than its own shocks. In the long run (periods 5–10), the importance of own shocks declines slightly across all variables, and cross-variable effects become more evident: LnDPP remains predominantly self-driven (around 95%) but shows increasing contributions from LnYARH and LnASAT; LnPRE is increasingly influenced by LnDPP (about 17–20%); LnASAT reflects stronger contributions from LnPRE and LnDPP (above 20%); and LnYARH continues to be largely explained by LnASAT (around 66%). Table 7 highlights that while own shocks dominate in the short run, climate variables, particularly temperature, play a more significant role in explaining variations in the long run.
The FEVD results can be explained by the persistence of producer prices and the gradual transmission of climatic effects. In the short run, the dominance of own innovations, particularly for date palm producer prices and precipitation, indicates that market adjustments occur gradually and that immediate climatic influences on producer prices are limited. Across the long run, the increasing contribution of cross-variable innovations suggests that climatic conditions progressively influence producer price dynamics through their cumulative effects on agricultural production. These findings indicate that short-run dynamics are primarily driven by internal market persistence, whereas long-run variations increasingly reflect climate–price interactions.
4.4.3. Historical Decomposition Results
As shown in Figure 2, the historical decomposition illustrates the relative contributions of own and climatic innovations to fluctuations in date palm producer prices over the study period. The historical decomposition indicates that fluctuations in date palm producer prices (LnDPP) are predominantly explained by their own innovations, with the largest positive deviations occurring during 2008–2013 and the most pronounced negative deviations during 2015–2018. Temperature (LnASAT) and relative humidity (LnYARH) contributed modestly to these fluctuations, while the influence of precipitation (LnPRE) remained limited. Likewise, the historical variations in precipitation, temperature, and relative humidity were largely driven by their own innovations, with minor cross-variable effects. The results confirm that own innovations dominate short-run dynamics, whereas climatic factors, particularly temperature and relative humidity, contribute gradually to longer-term producer price variability.
4.5. Sensitivity Analysis: Alternative Cholesky Ordering and Structural Stability
To verify the sensitivity of the IRFs to the specific causal assumptions of the model, a robustness check was conducted by altering the Cholesky ordering. In this case the date producers price order after the climate change factors. As shown in Figure 3, the robustness analysis demonstrates that the main dynamic relationships remain unchanged under an alternative ordering of the endogenous variables. In particular, the strong persistence of date palm producer prices and the delayed responses to temperature and relative humidity shocks are consistently observed across model specifications. These findings indicate that the estimated impulse responses are robust to variable ordering, confirming the stability of the dynamic relationship between date palm producer prices and climatic variables.
5. Discussions
The findings indicate that date palm producer prices exhibit a high degree of persistence, with current prices being largely explained by their own past innovations. This pattern suggests that short-run price dynamics are primarily driven by internal market mechanisms rather than external climatic shocks. The strong persistence observed is consistent with previous studies on Saudi Arabian agricultural markets, which report that producer prices are largely influenced by domestic market conditions, production structures, and institutional characteristics, thereby limiting the immediate transmission of external shocks [29]
In contrast, climatic variables, including precipitation, temperature, and relative humidity, exhibit limited short-run effects on date palm producer prices and other endogenous variables, indicating that climatic shocks are not immediately transmitted into price fluctuations. This delayed response may reflect the gradual adjustment process through which climate conditions influence agricultural production, market supply, and price formation. These findings are consistent with [30] who demonstrated that crop prices are shaped by the combined effects of climate-related factors, technological developments, and broader economic conditions, with the magnitude and direction of impacts varying across production systems and contexts. The limited statistical significance of most climate variables in the short run may be attributed to the gradual transmission of climatic effects through agricultural production processes. Climate conditions typically influence crop performance through biological and production cycles, resulting in delayed effects rather than immediate price adjustments. Furthermore, adaptation practices and production management strategies may reduce the short-run sensitivity of the date palm sector to climate variability. These findings suggest that climate–price interactions are characterized by delayed transmission mechanisms, highlighting the importance of considering long-run dynamics when assessing the economic effects of climate change on agricultural markets.
The integrated evidence from impulse response functions (IRFs), historical decomposition (HD), and forecast error variance decomposition (FEVD) confirms a stable but evolving relationship between climate variables and date palm producer prices in Saudi Arabia. The IRF results demonstrate strong price persistence, with producer prices primarily responding to their own innovations, while climatic shocks generate relatively gradual and limited effects. This pattern suggests that climate variability may influence price dynamics through gradual adjustments in production conditions and market supply rather than through immediate price responses.
Similarly, [31] demonstrated that climatic conditions influence date palm productivity through cumulative effects on crop growth and water-use efficiency across successive growing seasons. Al-Wabel et al. [32] further highlighted that water scarcity and climate-related environmental stresses can affect date palm performance and fruit quality, emphasizing the importance of long-term adaptation strategies. Collectively, these studies support the present findings by suggesting that climatic shocks may influence date palm markets indirectly through gradual changes in biological productivity, resulting in delayed effects on producer prices.
The FEVD results further show that producer prices are predominantly explained by their own innovations in the short run, indicating strong market persistence and limited immediate transmission of climatic shocks. Over longer horizons, however, the contribution of climatic variables, particularly temperature and relative humidity, becomes more pronounced, suggesting that climate factors play an increasing role in explaining price variability over time. The HD results provide additional evidence that historical price movements were mainly driven by internal market dynamics, while climatic innovations contributed to fluctuations during specific periods. These findings are consistent with [33] , who highlighted the growing importance of climate-related supply shocks in shaping agricultural price dynamics. The results suggest that maintaining long-term stability in the Saudi date palm sector requires consideration of both market mechanisms and climate adaptation strategies.
6. Conclusions and Policy Implications
This study examined the dynamic relationship between climate variability and date palm producer prices in Saudi Arabia using annual time-series data from 1991 to 2024. A Vector Autoregression (VAR) framework was employed to analyze the interactions among producer prices, precipitation, mean surface air temperature, and relative humidity. The analysis incorporated impulse response functions (IRFs), forecast error variance decomposition (FEVD), and historical decomposition (HD), while robustness checks based on alternative Cholesky orderings confirmed the stability of the estimated relationships.
The empirical findings indicate that date palm producer prices exhibit strong persistence and are primarily explained by their own innovations in the short run. Climatic shocks generate relatively limited immediate responses, suggesting that climate effects are transmitted gradually through agricultural production and market adjustment processes. However, the FEVD and HD results show that the contribution of temperature and relative humidity to producer price fluctuations becomes more evident over longer horizons, highlighting the increasing relevance of climatic conditions in explaining long-term price dynamics. The robustness analysis further confirms that these results are not sensitive to the ordering of variables within the VAR framework.
The findings demonstrate that while the Saudi date palm market remains resilient to short-term climatic disturbances, long-term price stability increasingly depends on the sector’s capacity to adapt to changing climatic conditions. These results provide important implications for policymakers by highlighting the need to complement short-term market management with long-term climate adaptation strategies. Priority should be given to climate-smart agricultural practices, efficient water management, improved climate monitoring systems, and the dissemination of adaptive technologies that enhance farmers’ capacity to manage climate risks. Strengthening extension services, climate information systems, and risk-management mechanisms can further support the sustainability and resilience of the date palm sector under future climate uncertainty.
7. Limitations and Future Research
This study has several limitations that provide opportunities for future research. First, the analysis focuses on selected climatic variables and producer prices, while other economic, technological, institutional, and market factors, such as water availability, policy interventions, trade conditions, and input costs, may also influence date palm price dynamics. Second, the use of annual data may limit the ability to estimate short-term seasonal variations in climatic conditions and market responses.
Future studies could address these limitations by incorporating farm-level or regional datasets, including additional socioeconomic and institutional variables, and employing higher-frequency data, such as monthly or quarterly observations. Furthermore, comparative analyses across major date palm-producing countries could provide deeper insights into how differences in climatic conditions, production systems, and policy frameworks shape the resilience and price stability of the date palm sector.
Author Contributions
Conceptualization, methodology, validation, empirical analysis, investigations, and results interpretation, RE; data generation, RE & AA; literature review and related study AA; writing original draft, editing and final draft, RE & AA; funding acquisition, RE.
Funding
This research was funded by the Deanship of Scientific Research, King Faisal University, Al-Ahsa, Saudi Arabia, through financial support under the Ambitious Researcher Track.
Institutional Review Board Statement
Not applicable.
Data Availability Statement
The data presented in this study are available in open-access repositories in the public domain FAOSTAT and Global Data Lab. These data were derived from the following resources available in the public domain: (1) FAOSTAT: https://www.fao.org/faostat/en/#data/QCL, (2) Global Data Lab: https://globaldatalab.org/geos/table/relhumidityyear/.
Conflicts of Interest
The authors declare no conflicts of interest.
References
- Asfew, M.; Mitiku, F.; Gemechu, A.; Bekele, Y.; Lemma, T. Do Climate Change and Political Instability Affect Crop Production in Sub-Saharan Africa Countries? J. Agric. Food Res. 2023, 12, 100576. [Google Scholar] [CrossRef]
- Nguyen, H.; Randall, M.; Lewis, A. Factors Affecting Crop Prices in the Context of Climate Change—A Review. Agriculture 2024, 14, 135. [Google Scholar] [CrossRef]
- El-Rawy, M.; Batelaan, O.; Al-Arifi, N.; Alotaibi, A.; Abdalla, F.; Gabr, M. Climate Change Impacts on Water Resources in Arid and Semi-Arid Regions: A Case Study in Saudi Arabia. Water 2023, 15, 606. [Google Scholar] [CrossRef]
- Alotaibi, B.A.; Xu, W.; Shah, A.A.; Ullah, W. Exploring Climate-Induced Agricultural Risk in Saudi Arabia: Evidence from Farming Communities of Medina Region. Sustainability 2024, 16, 4245. [Google Scholar] [CrossRef]
- Brizmohun, R.; Elzaki, R.; Ozturk, O.; Al-Mahish, M.; Emam, A.A. Economics and Marketing of Dates in Saudi Arabia. In Date Palm; CABI: GB, 2023; pp. 580–613. [Google Scholar]
- Chatzopoulos, T.; Pérez Domínguez, I.; Zampieri, M.; Toreti, A. Climate Extremes and Agricultural Commodity Markets: A Global Economic Analysis of Regionally Simulated Events. Weather Clim. Extrem. 2020, 27, 100193. [Google Scholar] [CrossRef]
- Alotaibi, K.D.; Alharbi, H.A.; Yaish, M.W.; Ahmed, I.; Alharbi, S.A.; Alotaibi, F.; Kuzyakov, Y. Date Palm Cultivation: A Review of Soil and Environmental Conditions and Future Challenges. Land Degrad. Dev. 2023, 34, 2431–2444. [Google Scholar] [CrossRef]
- Hadi Ismail, M.; Abd Ali, S.; Ibrahim Abd, G. The Seasonal Fluctuations in Weather and Their Impact on the Flowering, Fruit Setting, and Growth of Date Palm Fruits (Phoenix Dactylifera L.) in Iraq. Samarra J. Pure Appl. Sci. 2023, 5, 190–206. [Google Scholar] [CrossRef]
- Iqbal, Z.; Munir, M.; Alshoaibi, A.; Alqahtani, N.K. Environmental Drivers of Date Fruit Unripening Syndrome in Dryland Regions of Saudi Arabia. Front. Plant Sci. 2025, 16. [Google Scholar] [CrossRef]
- Ahmed-Amen, K.; Mostafa, R.; El- Azab, D.; Ali, A. Evaluation of Sewy Date Palm Productivity under Different Climatic Conditions. Assiut J. Agric. Sci. 2018, 49, 69–78. [Google Scholar] [CrossRef]
- Faci, M.; Benziouche, S.E. Contribution to Monitoring the Influence of Air Temperature on Some Phenological Stages of the Date Palm (Cultivar ‘Deglet Nour’) in Biskra. J. Saudi Soc. Agric. Sci. 2021, 20, 248–256. [Google Scholar] [CrossRef]
- Alidoost, F.; Su, Z.; Stein, A. Evaluating the Effects of Climate Extremes on Crop Yield, Production and Price Using Multivariate Distributions: A New Copula Application. Weather Clim. Extrem. 2019, 26, 100227. [Google Scholar] [CrossRef]
- Lee, S. Effects of Extreme Heat Events on Crop Revenues for U.S. Corn and Soybeans. Am. J. Agric. Econ. 2026, 108, 176–203. [Google Scholar] [CrossRef]
- Alabdulkader, A.M.; Al-Amoud, A.I.; Awad, F.S. Adaptation of the Agricultural Sector to the Effects of Climate Change in Arid Regions: Competitive Advantage Date Palm Cropping Patterns under Water Scarcity Conditions. J. Water Clim. Change 2016, 7, 514–525. [Google Scholar] [CrossRef]
- Noor, W.N.W.M.; Nawi, N.M.; Seng, K.W.K.; Buda, M. Supply Response Analysis on the Impact of Climate Change on Oil Palm Production in Malaysia. IOP Conf. Ser. Earth Environ. Sci. 2021, 757, 012009. [Google Scholar] [CrossRef]
- Oktarina, S.D.; Nurkhoiry, R.; Pradiko, I. The Effect of Climate Change to Palm Oil Price Dynamics: A Supply and Demand Model. IOP Conf. Ser. Earth Environ. Sci. 2021, 782, 032062. [Google Scholar] [CrossRef]
- Baaghideh, M.; Azizzadeh, J.; Ahmadi, H.; Entezari, A. Climate Change Impacts on the Cultivation Areas of Date Palm Tree in Iran. Arab. J. Geosci. 2020, 13, 1188. [Google Scholar] [CrossRef]
- Dhaouadi, L.; Besser, H.; Karbout, N.; Al-Omran, A.; Wassar, F.; Wahba, M.S.; Yaohu, K.; Hamed, Y. Irrigation Water Management for Sustainable Cultivation of Date Palm. Appl. Water Sci. 2021, 11, 171. [Google Scholar] [CrossRef]
- Lemlem, A.; Alemayehu, M.; Endris, M. Date Palm Production Practices and Constraints in the Value Chain in Afar Regional State, Ethiopia. Adv. Agric. 2018, 2018, 1–10. [Google Scholar] [CrossRef]
- Mohammed, M.; Sallam, A.; Alqahtani, N.; Munir, M. The Combined Effects of Precision-Controlled Temperature and Relative Humidity on Artificial Ripening and Quality of Date Fruit. Foods 2021, 10, 2636. [Google Scholar] [CrossRef]
- Haile, M.G.; Wossen, T.; Tesfaye, K.; von Braun, J. Impact of Climate Change, Weather Extremes, and Price Risk on Global Food Supply. Econ. Disaster. Clim. Chang. 2017, 1, 55–75. [Google Scholar] [CrossRef]
- Thompson, W.; Lu, Y.; Gerlt, S.; Yang, X.; Campbell, J.E.; Kueppers, L.M.; Snyder, M.A. Automatic Responses of Crop Stocks and Policies Buffer Climate Change Effects on Crop Markets and Price Volatility. Ecol. Econ. 2018, 152, 98–105. [Google Scholar] [CrossRef]
- Al-Mahish, M.; Almulhim, T.; Alali, M. Purchasing Decisions on Date Palm Fruits: A Quantitative Analysis of the Khalas Cultivar. PLoS ONE 2023, 18, e0289512. [Google Scholar] [CrossRef]
- FAO. FAOSTAT Producer Price for Date Production. Available online: https://www.fao.org/faostat/en/#data/P (accessed on 11 July 2026).
- GDL Global Data Lab. Cent. At. Nijmegen Sch. Manag. Radboud Univ.
- PHILLIPS, P.C.B.; PERRON, P. Testing for a Unit Root in Time Series Regression. Biometrika 1988, 75, 335–346. [Google Scholar] [CrossRef]
- Sims, C.A. Macroeconomics and Reality. Econometrica 1980, 48, 1. [Google Scholar] [CrossRef]
- Breusch, T.S.G.G. A Review of Recent Work on Testing for Auto-Correlation in Dynamic Simultaneous Models. In Macroeconomic Analysis: Essays in Macroeconomics and Econometrics, 1st Edition.; DA Currie, R.N., Peel, D., Eds.; London, 2015. [Google Scholar]
- Dehghanisanij, H.; Salamati, N.; Emami, S.; Emami, H.; Fujimaki, H. An Intelligent Approach to Improve Date Palm Crop Yield and Water Productivity under Different Irrigation and Climate Scenarios. Appl. Water Sci. 2023, 13, 56. [Google Scholar] [CrossRef]
- Nguyen, H.; Randall, M.; Lewis, A. Factors Affecting Crop Prices in the Context of Climate Change—A Review. Agriculture 2024, 14, 135. [Google Scholar] [CrossRef]
- Dehghanisanij, H.; Salamati, N.; Emami, S.; Emami, H.; Fujimaki, H. An Intelligent Approach to Improve Date Palm Crop Yield and Water Productivity under Different Irrigation and Climate Scenarios. Appl. Water Sci. 2023, 13, 56. [Google Scholar] [CrossRef]
- Al-Wabel, M.I.; Almutari, M.M.; Ahmad, M.; Al-Swadi, H.A.; Ahmad, J.; Al-Farraj, A.S.F. Impacts of Aquaculture Wastewater Irrigation on Soil Health, Nutrient Availability, and Date Palm Fruit Quality. Sci. Rep. 2024, 14, 18634. [Google Scholar] [CrossRef]
- Wheeler, T.; von Braun, J. Climate Change Impacts on Global Food Security. Science (1979) 2013, 341, 508–513. [Google Scholar] [CrossRef]
Figure 1.
Impulse Response Functions of the VAR Approach. Note: The solid blue lines represent the estimated impulse responses to one-standard-deviation Cholesky shocks, while the dashed red lines indicate the ±2 standard error confidence bands. The horizontal axis shows the forecast horizon (1-10 years), and the vertical axis represents the magnitude of the impulse response. Original Cholesky ordering: LnDPP LnPRE LnASAT LnYARH.
Figure 1.
Impulse Response Functions of the VAR Approach. Note: The solid blue lines represent the estimated impulse responses to one-standard-deviation Cholesky shocks, while the dashed red lines indicate the ±2 standard error confidence bands. The horizontal axis shows the forecast horizon (1-10 years), and the vertical axis represents the magnitude of the impulse response. Original Cholesky ordering: LnDPP LnPRE LnASAT LnYARH.
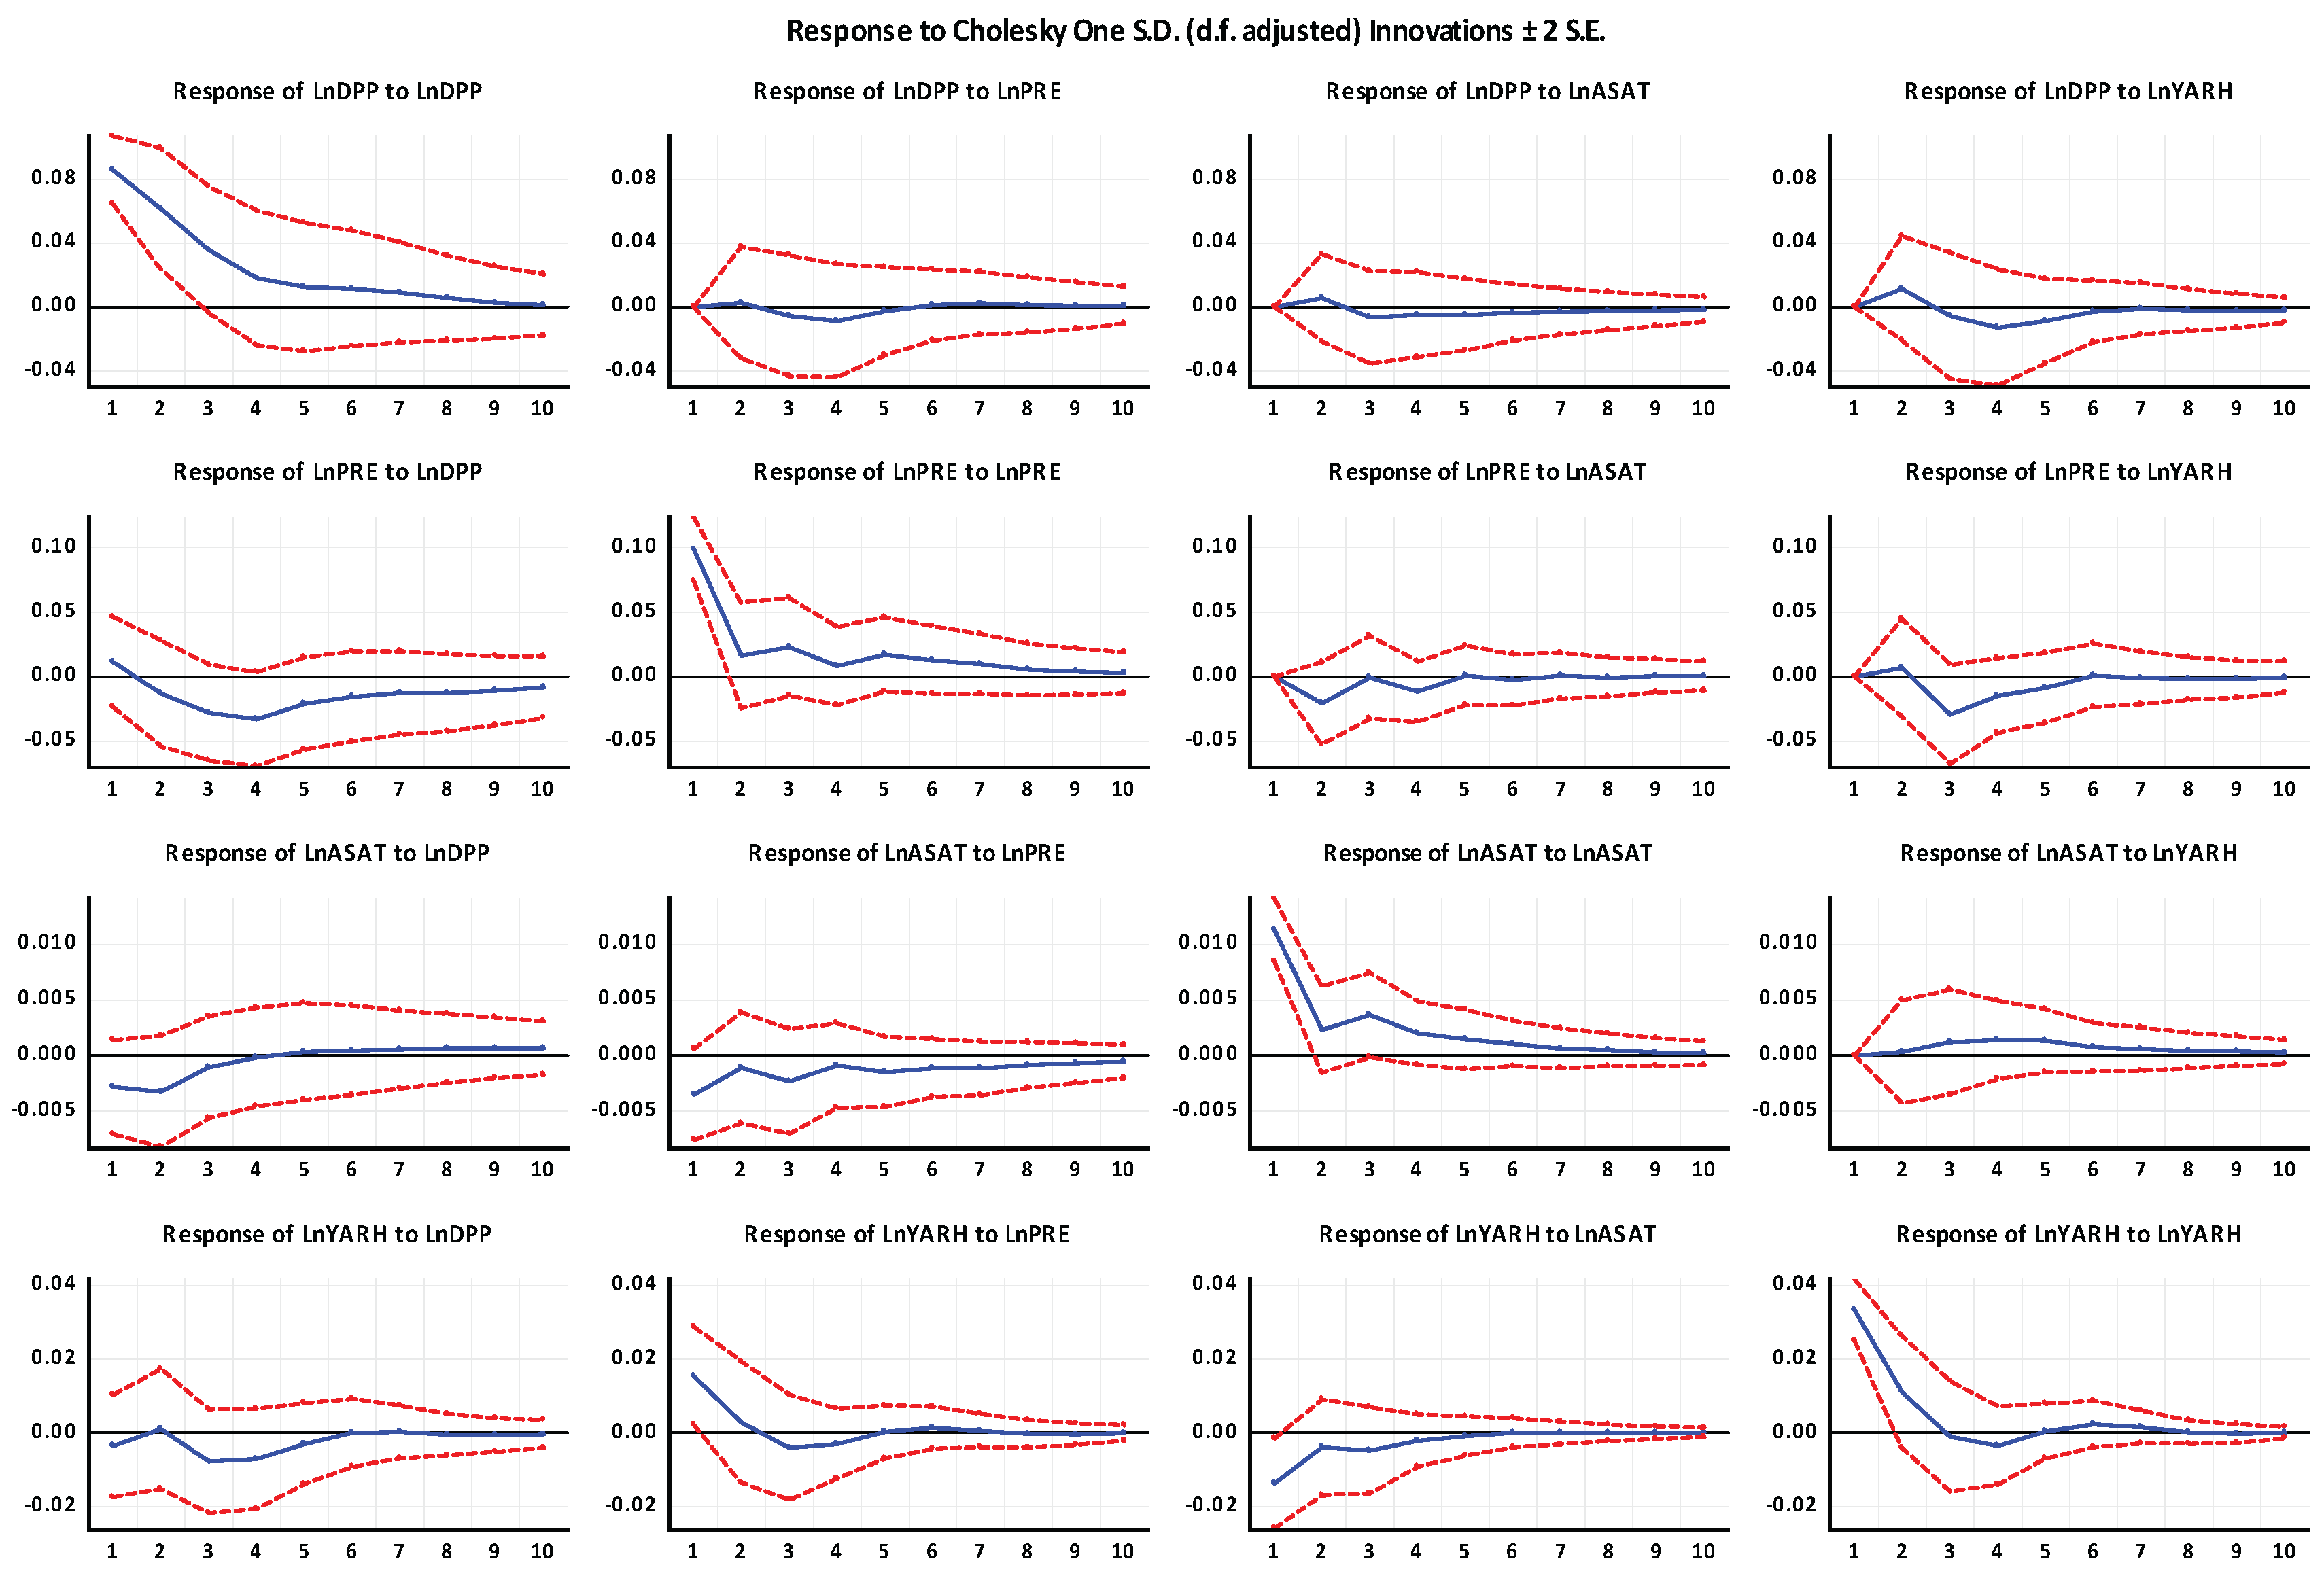
Figure 2.
Historical Decomposition of Date Palm Producer Prices and Climatic Factors. Note: The blue bars represent the total historical innovations (actual deviations from the baseline) for each variable. The colored lines indicate the contributions of Cholesky-identified innovations from each endogenous variable to these fluctuations.
Figure 2.
Historical Decomposition of Date Palm Producer Prices and Climatic Factors. Note: The blue bars represent the total historical innovations (actual deviations from the baseline) for each variable. The colored lines indicate the contributions of Cholesky-identified innovations from each endogenous variable to these fluctuations.
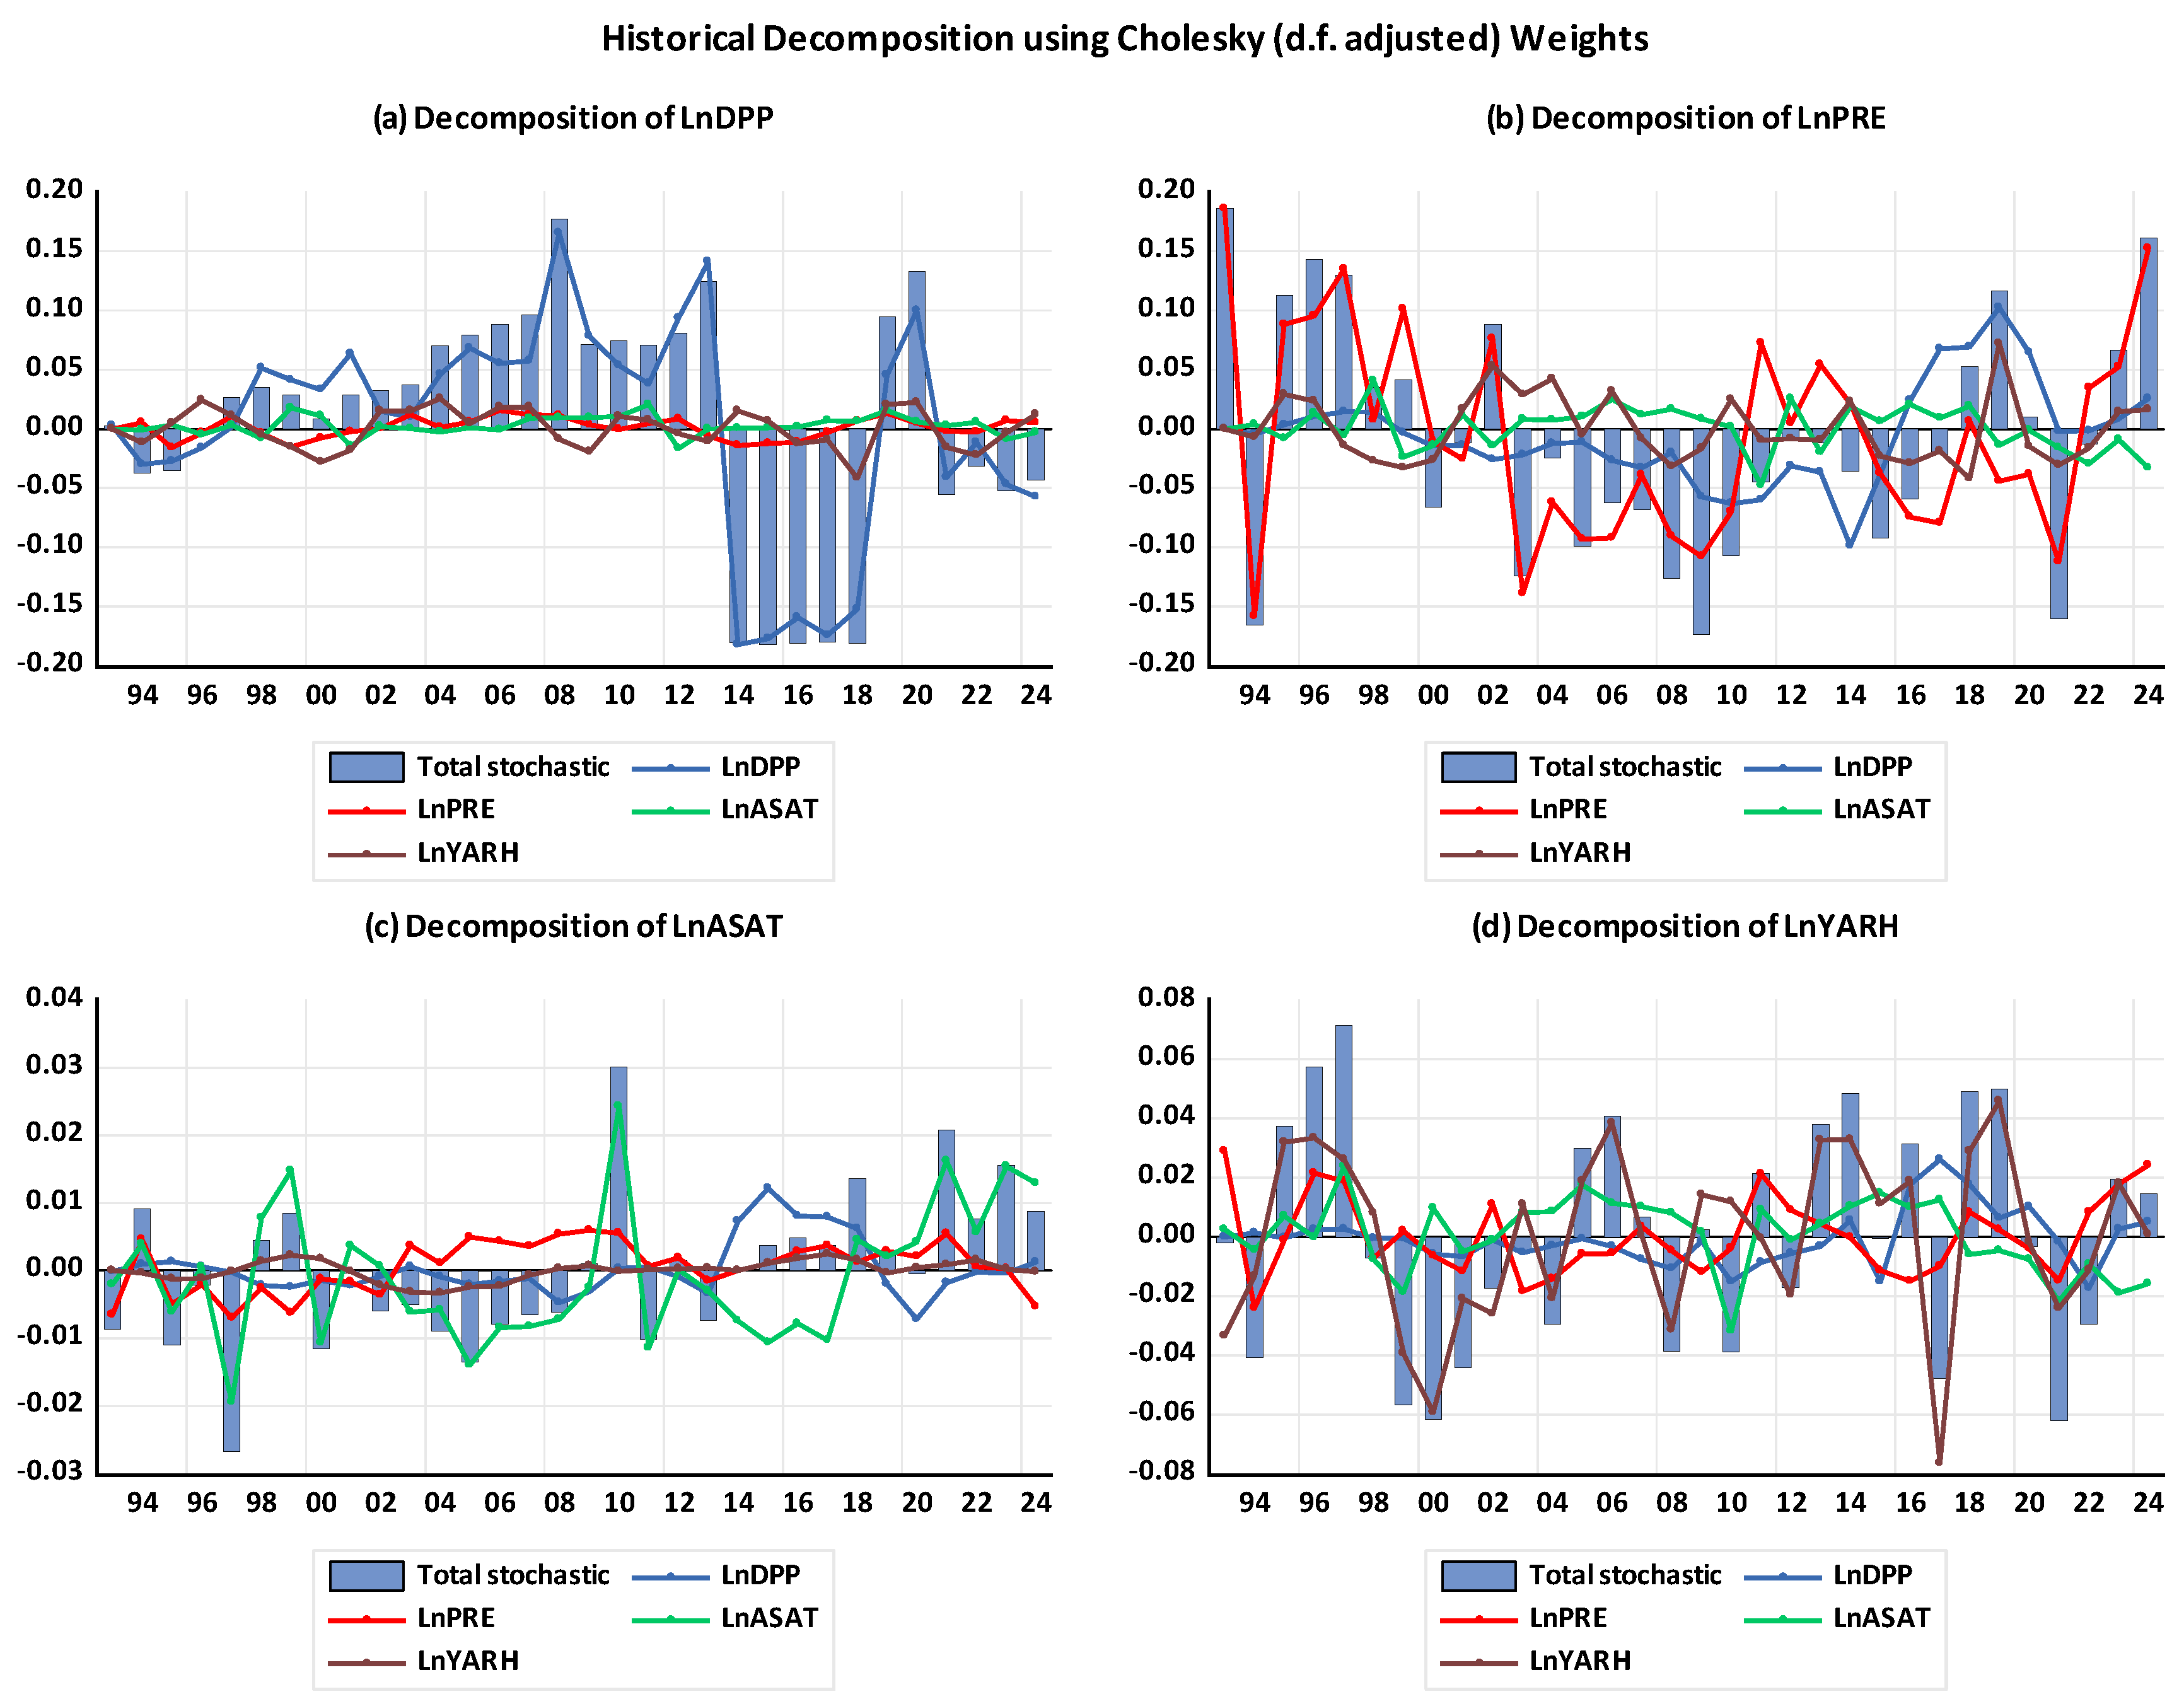
Figure 3.
Alternative Ordering IRFs for Model Validation. Note: This figure presents the IRF results using a changed Cholesky ordering to test model sensitivity. Cholesky Ordering: LnPRE LnASAT LnYARH LnDPP.
Figure 3.
Alternative Ordering IRFs for Model Validation. Note: This figure presents the IRF results using a changed Cholesky ordering to test model sensitivity. Cholesky Ordering: LnPRE LnASAT LnYARH LnDPP.
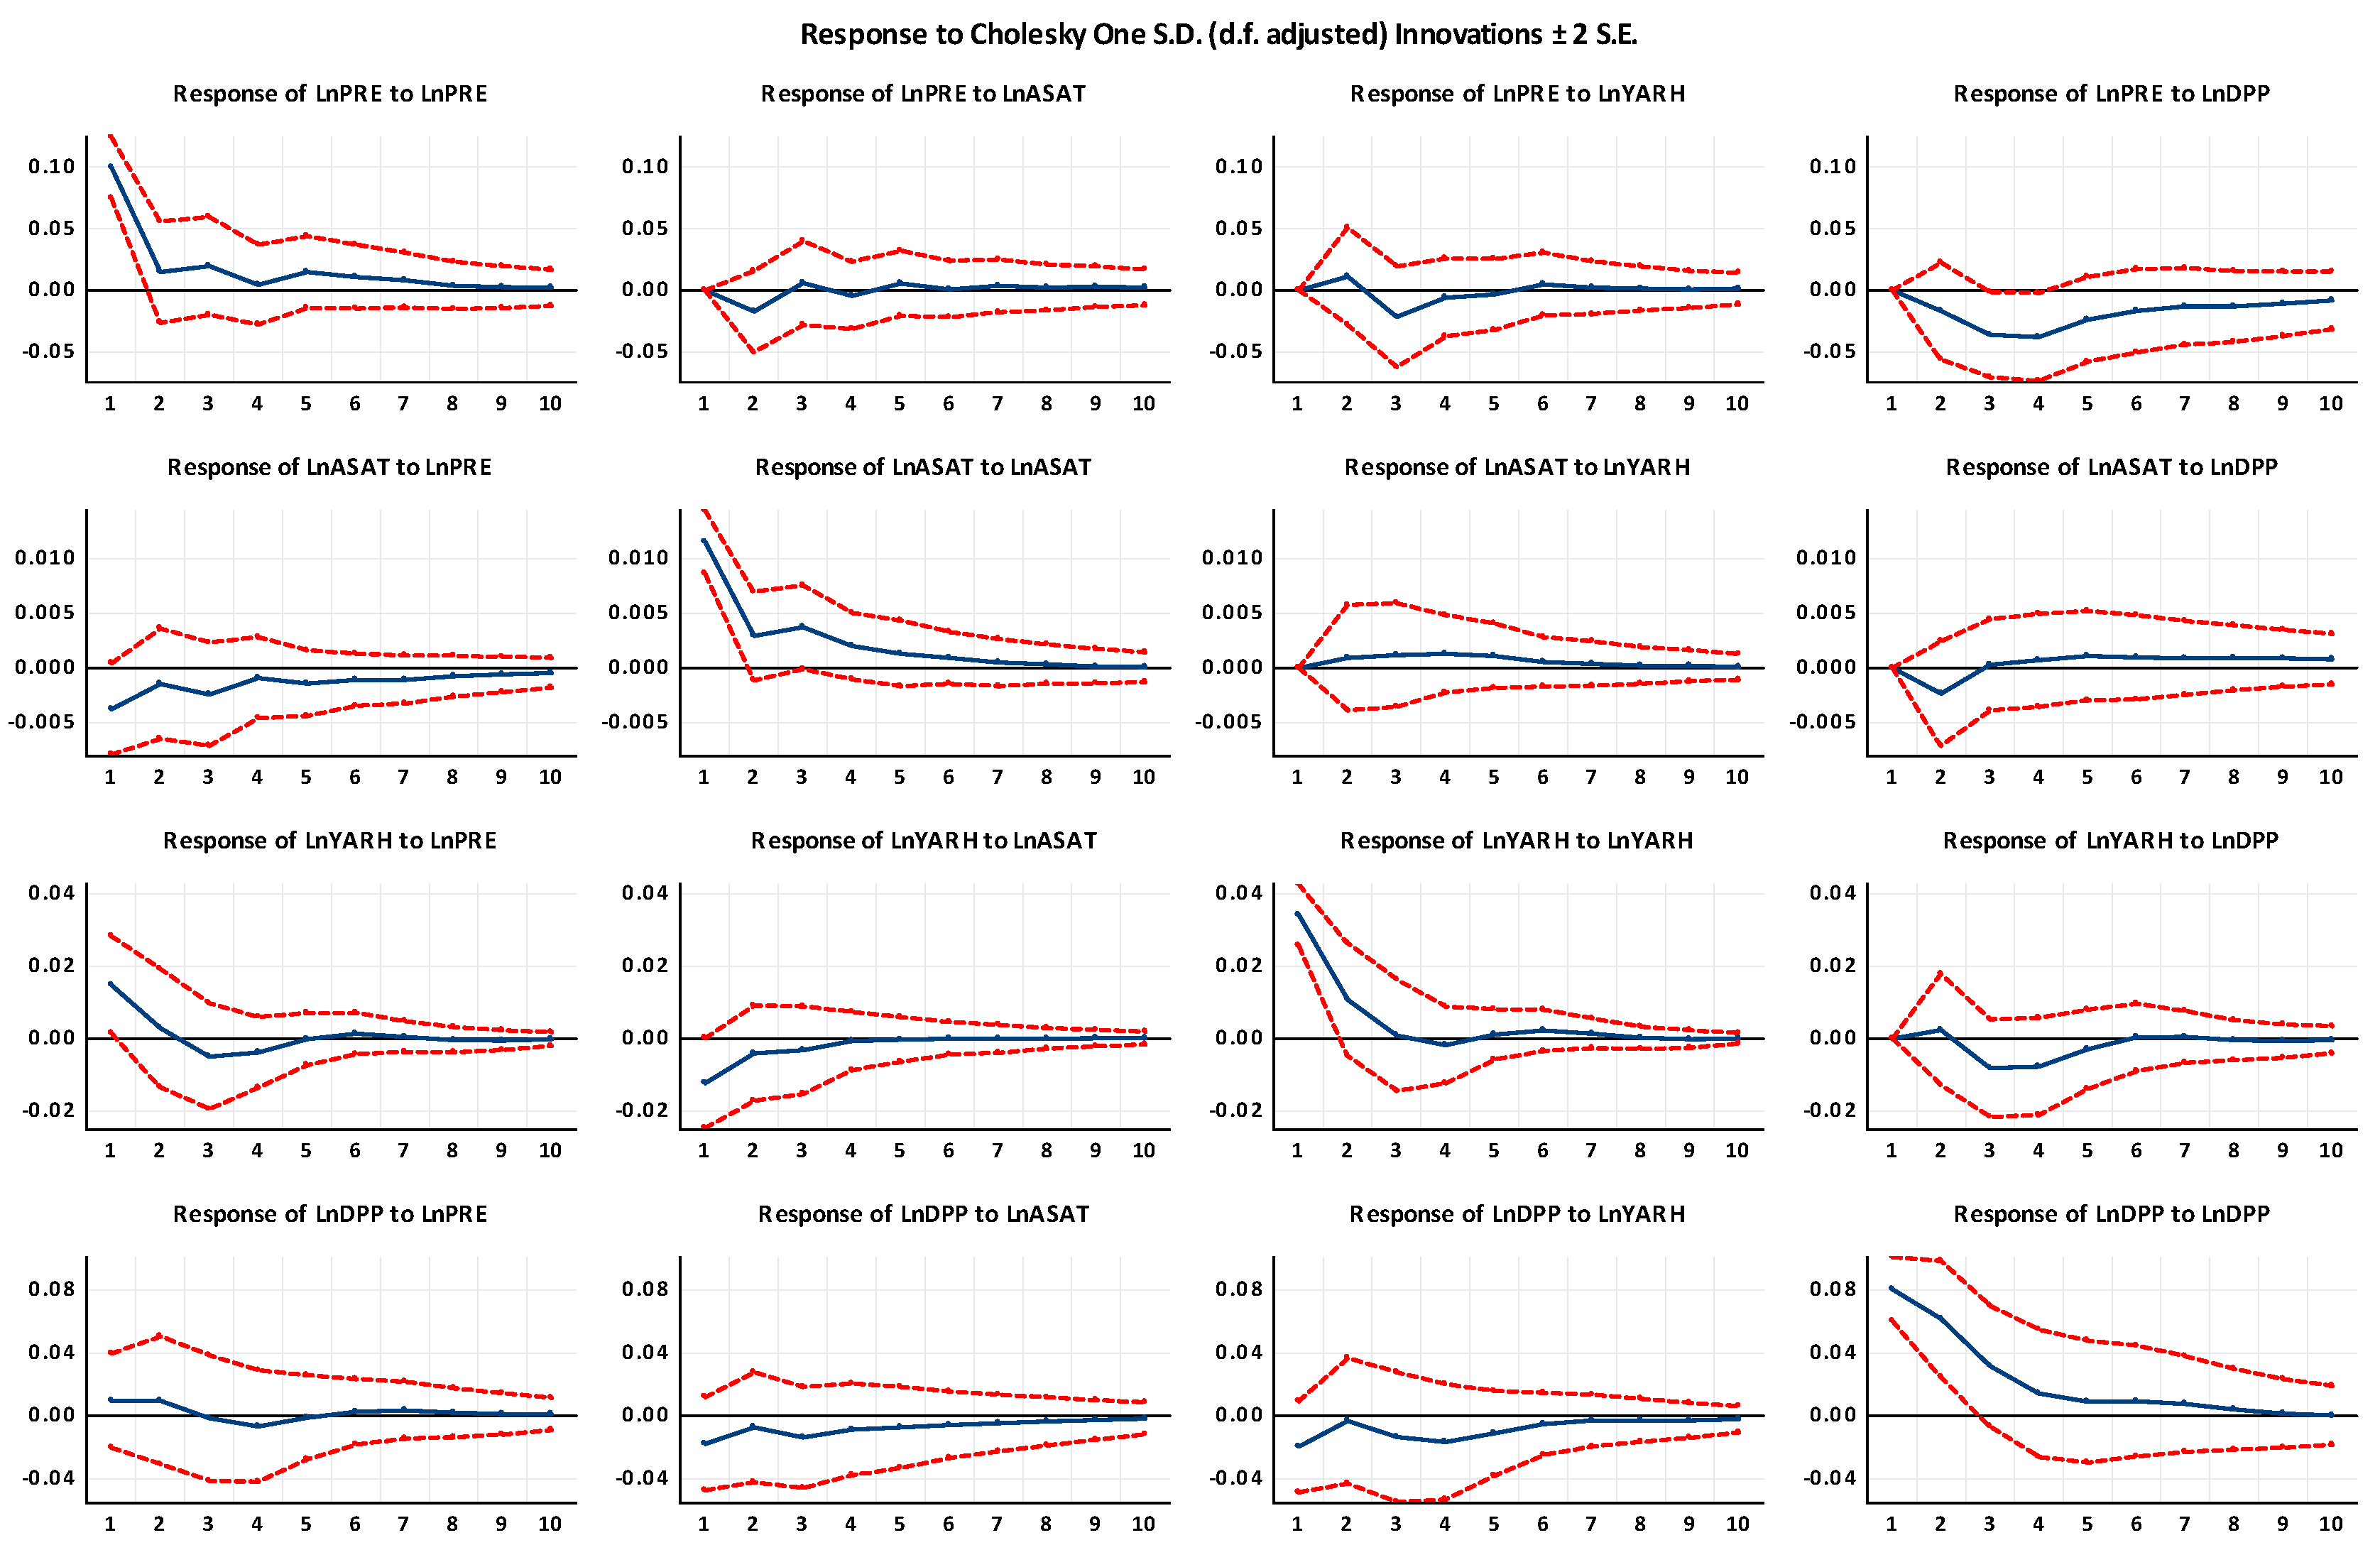

Table 1.
Descriptive Analysis.
| Study variables (Units) | Abbreviation | Mean | Std. Dev. | Min | Max |
|---|---|---|---|---|---|
| Date palm producer price (USD) | DPP | 3215.396 | 305.688 | 2634.70 | 3781.30 |
| Precipitation (mm) | PRE | 101.990 | 12.264 | 84.310 | 141.29 |
| Average Mean Surface Air Temperature (°C) | ASAT | 25.957 | 0.472 | 24.50 | 26.92 |
| Yearly-Average-Relative-Humidity (%) | YARH | 27.218 | 1.008 | 25.470 | 28.98 |
| Normality tests | |||||
| Skewness and Kurtosis normality | Jarque-Bera (JB) | ||||
| Variable | Pr(Skewness) | Pr(Kurtosis) adj | chi2(2) | X2 | |
| DPP | 0.0878 | 0.9213 | 3.17 | 2.618 | |
| PRE | 0.0064 | 0.0549 | 9.29 *** | 10.35 *** | |
| ASAT | 0.0315 | 0.0578 | 7.28 ** | 7.005 ** | |
| YARH | 0.8004 | 0.0739 | 3.54 | 1.513 | |
| Note: *** & ** = significant at 1% & 5% , respectively. Null hypothesis (H₀): The variable is normally distributed. Alternative hypothesis (H₁): The variable is not normally distributed. Source: Authors’ calculations (2026). | |||||
Table 2.
Phillips-Perron Unit Root Results.
| Phillips–Perron Unit Root Test at Level I(0) | |||
|---|---|---|---|
| Variable | Z(ρ) Statistic Z(rho) | Z(t) Statistic | MacKinnon p-value for Z(t) |
| LnDPP | -12.509* | -2.681* | 0.07 |
| LnPRE | -18.256** | -3.329** | 0.01 |
| LnASAT | -10.118 | -2.686* | 0.07 |
| LnYARH | -20.886*** | -3.926*** | 0.00 |
| Phillips–Perron Unit Root Test at First Difference I(1) | |||
| ΔLnDPP | -30.966*** | -6.114*** | 0.00 |
| ΔLnPRE | -41.330*** | -10.292*** | 0.00 |
| ΔLnASAT | -44.415*** | -12.452*** | 0.00 |
| ΔLnYARH | -35.007*** | -7.963*** | 0.00 |
| Note: H₀: Variable has a unit root, H₁: Variable is stationary. *** & * = significant at 1% & 10%, respectively. For Z(ρ), the Interpolated Dickey-Fuller critical values at 1%, 5%, and 10% significance levels are -17.744, -12.756, and -10.360, respectively. For Z(t), the corresponding critical values at 1%, 5%, and 10% levels are -3.696, -2.978, and -2.620, respectively. Source: Authors' calculations (2026). | |||
Table 3.
VAR Estimates for the Date Palm Price-Climate Nexus.
| Model | LnDPP | LnPRE | LnASAT | LnYARH |
|---|---|---|---|---|
| LnDPP(-1) | 0.765093 | -0.207118 | -0.029547 | 0.030103 |
| [ 3.69289]*** | [-0.85718] | [-1.00049] | [ 0.31556] | |
| LnDPP(-2) | -0.174523 | -0.325309 | 0.031124 | -0.137285 |
| [-0.78513] | [-1.25483] | [ 0.98228] | [-1.34130] | |
| LnPRE(-1) | 0.006150 | 0.078254 | -0.005097 | -0.021597 |
| [ 0.03181] | [ 0.34707] | [-0.18497] | [-0.24261] | |
| LnPRE(-2) | -0.051143 | 0.323536 | -0.014438 | -0.043970 |
| [-0.29283] | [ 1.58840] | [-0.57995] | [-0.54677] | |
| LnASAT(-1) | 0.915721 | -1.581260 | 0.217636 | 0.049722 |
| [ 0.75946] | [-1.12447] | [ 1.26625] | [ 0.08956] | |
| LnASAT(-2) | -1.676230 | -0.472065 | 0.337484 | -0.559700 |
| [-1.27651] | [-0.30824] | [ 1.80297]* | [-0.92568] | |
| LnYARH(-1) | 0.347094 | 0.207421 | 0.009675 | 0.332520 |
| [ 0.70977] | [ 0.36368] | [ 0.13880] | [ 1.47675] | |
| LnYARH(-2) | -0.558556 | -0.880611 | 0.042370 | -0.148997 |
| [-1.14718] | [-1.55077] | [ 0.61047] | [-0.66460] | |
| C | 6.685990 | 15.96977 | 1.357135 | 5.524118 |
| [ 1.10007] | [ 2.25296] | [ 1.56647] | [ 1.97394]** | |
| General results indicators | ||||
| Determinant of the residual covariance matrix (adjusted) | 1.01×10⁻¹¹, | |||
| Determinant resid covariance | 2.68×10⁻¹², | |||
| Log likelihood | 244.6859 | |||
| Akaike information criterion | -13.04287 | |||
| Schwarz criterion | -11.39392 | |||
| Note: t-statistics in [ ]. ***, ** & * = significant at 1% , 5% & 10%. Source: Authors’ calculations (2026) | ||||
Table 4.
Lag Length Results At 5% Level.
| Lag | LogL | LR | FPE | AIC | SC | HQ |
|---|---|---|---|---|---|---|
| 0 | 213.0944 | NA | 2.48e-11 | -13.06840 | -12.88518* | -13.00767 |
| 1 | 235.4384 | 37.70562* | 1.69e-11* | -13.46490* | -12.54882 | -13.16125* |
| 2 | 244.6859 | 13.29330 | 2.71e-11 | -13.04287 | -11.39392 | -12.49629 |
| Note: * Signifies lag order selected by the criterion, LR: sequential modified LR test statistics, at 5% level of significance. Source: Authors’ calculations (2026). | ||||||
Table 5.
VAR Residual Serial Correlation LM Tests.
| : No serial correlation at lag h | ||||||
|---|---|---|---|---|---|---|
| Lag | LRE* stat | df | P- value | Rao F-stat | df | P- value |
| 1 | 18.87598 | 16 | 0.2751 | 1.227172 | (16, 49.5) | 0.2819 |
| 2 | 10.44446 | 16 | 0.8424 | 0.628187 | (16, 49.5) | 0.8455 |
| 3 | 16.18853 | 16 | 0.4399 | 1.026467 | (16, 49.5) | 0.4469 |
| : No serial correlation at lags 1 to h | ||||||
| Lag | LRE* stat | df | P- value | Rao F-stat | df | P- value |
| 1 | 18.87598 | 16 | 0.2751 | 1.227172 | (16, 49.5) | 0.2819 |
| 2 | 36.85066 | 32 | 0.2544 | 1.192599 | (32, 45.8) | 0.2881 |
| 3 | 61.07490 | 48 | 0.0975 | 1.358395 | (48, 32.9) | 0.1788 |
| Note: *Edgeworth expansion corrected likelihood ratio statistic.P- value > 0.05 = no autocorrelation. The Authors’ calculations (2026). | ||||||
Table 6.
Roots Of Characteristic Polynomial.
| Eigenvalue (Root) | Modulus |
|---|---|
| 0.769178 - 0.094252i | 0.774931 |
| 0.769178 + 0.094252i | 0.774931 |
| 0.236943 - 0.583818i | 0.630068 |
| 0.236943 + 0.583818i | 0.630068 |
| 0.554331 | 0.554331 |
| -0.475030 - 0.061789i | 0.479032 |
| -0.475030 + 0.061789i | 0.479032 |
| -0.223009 | 0.223009 |
| Note: No root lies outside the unit circle. The VAR satisfies the stability condition. The i stands for the imaginary unit. Endogenous variables: LnDPP; LnPRE; LnASAT and LnYARH. Source: Authors’ calculations (2026). | |
Table 7.
Forecast Error Variance Decompositions results.
| FEVD of LnDPP: | FEVD of LnPRE: | |||||||
|---|---|---|---|---|---|---|---|---|
| Period | LnDPP | LnPRE | LnASAT | LnYARH | LnDPP | LnPRE | LnASAT | LnYARH |
| 1 | 100.000 | 0.000 | 0.000 | 0.000 | 1.280 | 98.720 | 0.000 | 0.000 |
| 2 | 98.472 | 0.067 | 0.276 | 1.185 | 2.745 | 92.847 | 3.968 | 0.439 |
| 3 | 97.818 | 0.312 | 0.569 | 1.301 | 8.318 | 81.393 | 3.304 | 6.985 |
| 4 | 95.925 | 0.876 | 0.719 | 2.479 | 14.984 | 73.392 | 3.881 | 7.743 |
| 5 | 95.208 | 0.907 | 0.883 | 3.002 | 17.040 | 71.446 | 3.681 | 7.833 |
| 6 | 95.104 | 0.907 | 0.962 | 3.027 | 18.142 | 70.601 | 3.626 | 7.631 |
| 7 | 95.031 | 0.940 | 1.013 | 3.015 | 18.850 | 70.064 | 3.572 | 7.513 |
| 8 | 94.958 | 0.950 | 1.060 | 3.032 | 19.612 | 69.417 | 3.532 | 7.440 |
| 9 | 94.878 | 0.954 | 1.092 | 3.076 | 20.151 | 68.944 | 3.505 | 7.401 |
| 10 | 94.821 | 0.961 | 1.112 | 3.106 | 20.475 | 68.669 | 3.490 | 7.366 |
| FEVD of LnASAT: | FEVD of LnYARH: | |||||||
| Period | LnDPP | LnPRE | LnASAT | LnYARH | LnDPP | LnPRE | LnASAT | LnYARH |
| 1 | 5.468 | 8.228 | 86.304 | 0.000 | 0.858 | 15.297 | 12.270 | 71.576 |
| 2 | 11.227 | 8.123 | 80.588 | 0.063 | 0.839 | 14.430 | 12.155 | 72.575 |
| 3 | 10.554 | 10.118 | 78.488 | 0.840 | 4.167 | 14.537 | 12.790 | 68.506 |
| 4 | 10.190 | 10.183 | 77.798 | 1.828 | 6.737 | 14.425 | 12.512 | 66.325 |
| 5 | 9.934 | 10.967 | 76.432 | 2.667 | 7.191 | 14.348 | 12.490 | 65.971 |
| 6 | 9.886 | 11.458 | 75.764 | 2.892 | 7.165 | 14.390 | 12.445 | 66.001 |
| 7 | 9.905 | 11.985 | 75.087 | 3.023 | 7.157 | 14.386 | 12.429 | 66.029 |
| 8 | 10.034 | 12.244 | 74.636 | 3.086 | 7.169 | 14.388 | 12.427 | 66.016 |
| 9 | 10.204 | 12.405 | 74.248 | 3.143 | 7.193 | 14.391 | 12.422 | 65.994 |
| 10 | 10.377 | 12.492 | 73.964 | 3.167 | 7.200 | 14.390 | 12.421 | 65.989 |
| Note: original Cholesky ordering: LnDPP LnPRE LnASAT LnYARH. Source: Authors’ calculations. | ||||||||
Disclaimer/Publisher’s Note: The statements, opinions and data contained in all publications are solely those of the individual author(s) and contributor(s) and not of MDPI and/or the editor(s). MDPI and/or the editor(s) disclaim responsibility for any injury to people or property resulting from any ideas, methods, instructions or products referred to in the content. |
© 2026 by the authors. Licensee MDPI, Basel, Switzerland. This article is an open access article distributed under the terms and conditions of the Creative Commons Attribution (CC BY) license (http://creativecommons.org/licenses/by/4.0/).
Copyright: This open access article is published under a Creative Commons CC BY 4.0 license, which permit the free download, distribution, and reuse, provided that the author and preprint are cited in any reuse.