

Submitted:
24 August 2026
Posted:
25 August 2026
You are already at the latest version
Abstract
Graf’s Developmental dysplasia of the hip (DDH) ultrasound screening is a validated method for early diagnosis. This study aimed to validate a sequential artificial-intelligence-assisted workflow following the Graf method and to determine whether computer-aided diagnosis (CAD) improves clinicians’ Checklist I assessment. This retrospective single-center study included 1803 images from 679 examinations. ResTransUNet segmented the eight Checklist I structures and classified image reportability. 15 clinicians assessed a separate independent set of 100 images without and, four weeks later, with CAD support. Checklist I classification achieved 95.61% accuracy, 96.65% precision, 97.74% recall, and an F1-score of 97.19%. Of the 1024 downstream images, 846 completed the workflow. Binary DDH classification achieved 81.09% accuracy, 82.67% sensitivity, and 80.59% specificity; exact Graf-type agreement was 40.07%. Mean absolute errors were 3.59∘ for the α angle and 11.91∘ for the β angle. Mean clinician accuracy increased from 72.3% to 90.2% with CAD, a paired improvement of 17.9 percentage points (95% CI, 10.3–25.4; p<0.001; Cohen’s dz=1.31); all 15 clinicians improved. The workflow provided accurate Checklist I reportability assessment and substantially improved clinician performance, although β-angle estimation and exact Graf classification require further refinement before prospective clinical implementation.
Keywords:
developmental dysplasia of the hip
; hip ultrasonography
; Graf method
; artificial intelligence
; deep learning
; computer-aided diagnosis
; image quality assessment
; clinical validation
; interobserver reliability
; pediatric radiology
; screening
1. Introduction
Developmental dysplasia of the hip (DDH) comprises a spectrum of abnormal acetabular development and femoral-head instability, ranging from mild dysplasia to fixed dislocation. Its reported frequency varies according to population, diagnostic criteria, patient age, and screening policy, but DDH remains one of the most common musculoskeletal disorders of infancy. If not detected, it can cause progressive deformity, gait disturbance, pain, and premature osteoarthritis, while a delayed presentation is more likely to require complex treatment. By contrast, detection in early infancy allows treatment to begin while the hip retains substantial remodeling potential and is generally amenable to less invasive management. Clinical examination and assessment of risk factors remain essential, while ultrasonography provides direct, radiation-free visualization of the cartilaginous hip and is the preferred imaging examination during early infancy [1,2,3], even in complex skeletal anatomies [4]. The clinical value of ultrasound screening, however, depends on the acquisition and interpretation of diagnostically adequate images.
Among the available sonographic techniques, the Graf method provides a standardized morphological and quantitative framework and is widely used, particularly in Europe [5,6]. Graf assessment follows a prescribed sequence rather than relying on angle measurement alone. Checklist I requires identification of eight anatomical structures: the chondro-osseous border, femoral head, synovial fold, joint capsule, labrum, cartilage, bony roof, and bony rim (turning point). Checklist II subsequently establishes image usability by confirming the lower limb of the ilium, the correct imaging plane, and the labrum. Only after both checklists have been satisfied should the and angles be measured and the hip assigned a Graf type [5,6]. This sequence provides an intrinsic quality-control mechanism by preventing technically inadequate images from proceeding to quantitative interpretation. Nevertheless, both image acquisition and interpretation remain operator-dependent. Probe orientation, incomplete visualization of anatomical structures, and incorrect placement of reference lines can alter angle measurements and final classification. Interobserver variability therefore persists, with the angle generally being less reproducible than the angle and agreement on the final Graf classification frequently being only moderate [7,8].
Artificial intelligence (AI) has been applied to scan-adequacy assessment, standard-plane recognition, anatomical segmentation, landmark detection, automated angle measurement, and DDH or Graf-type classification [9,10,11,12]. Image quality has a material effect on automated interpretation, supporting the need to identify inadequate images before diagnostic outputs are generated [13]. AI-supported handheld-ultrasound workflows have also demonstrated the feasibility of extending DDH screening beyond specialist imaging settings [14]. More recently, the QualityDDH framework operationalized Checklist I and Checklist II for image standardization and was prospectively evaluated with readers of different experience levels [15]. Despite these advances, the evidence remains heterogeneous and many studies address isolated components of the diagnostic process. Recent evidence syntheses found high reported diagnostic performance but also identified limited clinically relevant validation, infrequent external validation, and a predominance of retrospective single-centre studies [16,17]. Evidence therefore remains limited for a clinically evaluated sequential workflow that combines formal Checklist I and Checklist II quality control with angle estimation, Graf classification, and binary DDH identification while also quantifying its effects on clinician accuracy and assessment time.
The aims of this study were: (1) to determine the technical performance of each component of the complete workflow using a clinically acquired infant hip ultrasound dataset; (2) to quantify interobserver variability among three physicians and establish a consensus reference standard for clinical validation; and (3) to determine, in a paired reader study involving 15 clinicians, whether computer-aided diagnosis improves Checklist I accuracy and reduces assessment time, and whether the magnitude of any improvement is associated with career level (resident versus consultant), years of experience, or monthly hip-ultrasound volume.
2. Materials and Methods
2.1. Study Design, Dataset, and Reference Standard
This retrospective single-center study evaluated a sequential AI-assisted Graf workflow and a paired CAD reader study. Hip ultrasonograms were obtained at Regina Margherita Children’s Hospital, Turin, Italy, between March 2021 and February 2026 from infants aged 0–6 months referred for reassessment of suspected or previously identified DDH. The local ethics committee approved the study (Città della Salute e della Scienza, Turin, Italy; Study Protocol: DB2021; Approval code: 1489/2021; Approval date: 14/11/2021) and waived informed consent for retrospective analysis of anonymized images. Examinations used an InnoSight system with an L12-4 linear-array transducer (Philips; 4–12 MHz).
The initial dataset comprised 1846 images from 679 examinations. After excluding 43 Graf type IV images, 1803 remained: 1332 Checklist I-compliant and 471 non-compliant. Examination-level partitioning produced training, validation, and held-out test sets of 1082, 360, and 361 images. A random 1024-image subset with clinical / measurements and Graf labels was used to evaluate the complete workflow. A separate temporal set of 100 images acquired after January 2026 (70 compliant and 30 non-compliant) was reserved for the reader study and excluded from model development.
Pixelwise masks for background and the eight Checklist I structures were created in CVAT [6,18]. All images were independently assessed by a pediatric radiologist with 15 years of experience and two pediatric orthopaedic surgeons with 16 and 5 years of experience. Disagreements in angle measurements or Graf classification were jointly reviewed to establish consensus. OCR-extracted measurements and labels were manually verified against the source images. Full eligibility, annotation, preprocessing, and implementation details are provided in Supplementary Methods S1–S3.
2.2. AI-Assisted Graf Workflow
After removal of acquisition overlays, images were denoised, contrast-enhanced, normalized, and resized to pixels. ResTransUNet combined a residual encoder, multiscale dilated convolutions, bottleneck self-attention, attention-gated skip connections, and a residual decoder to segment the eight Checklist I structures. Class-specific morphological filtering was applied; an image was accepted only when every structure exceeded its validation-derived minimum-area threshold. A conventional U-Net trained on the same partitions served as the baseline. The Checklist I workflow is summarized in Figure 1.
Checklist II was assessed only after Checklist I acceptance and required the lower iliac limb, standard acetabular-roof section, and labrum [5,6]. A baseline was fitted to the segmented iliac contour; the prespecified inclination tolerance was . Representative decisions are shown in Figure 2. For images passing both checklists, the bony-roof line was fitted through the turning point and bony roof, and the cartilaginous-roof line through the turning point and labral centroid. Automated / angles, Graf type, and a study-defined binary endpoint were then generated (Figure 3). Types Ia/Ib were coded as no DDH and IIa/IIb, IIc, D, and III as DDH. Detailed thresholds, training settings, and classification rules are reported in Supplementary Methods S2–S3.
2.3. Paired Reader Study
Fifteen clinicians (nine consultants/specialists and six residents; 12 in orthopaedics and three in pediatric radiology) classified the same 100 independent images as Checklist I compliant or non-compliant. Microsoft Forms was used for an unaided session and, four weeks later, a CAD-assisted session with independently re-randomized image order. CAD displayed the original image, segmentation overlay, complete/incomplete output, and missing structures. Readers received standardized instructions but no training cases. Accuracy was agreement with the independent reference; completion time was calculated from session timestamps.
2.4. Outcomes and Statistical Analysis
Segmentation was evaluated using Dice, IoU, and pixel accuracy; Checklist I using accuracy, precision, recall, and F1-score; Checklist II using these metrics plus specificity and Matthews correlation coefficient; and diagnostic classification using exact Graf agreement and binary accuracy, sensitivity, specificity, precision, and F1-score. Angle agreement was summarized using mean absolute error, automated-minus-clinical bias, Bland–Altman limits, and ICC(3,1); clinician reliability used ICC(2,1) [19,20].
Paired reader accuracy was compared using a two-sided paired t-test with 95% CI and Cohen’s ; completion time used the Wilcoxon signed-rank test. Career-level gain used Welch’s t-test, monthly-volume gain the Kruskal–Wallis test, and associations with experience Spearman correlations with Holm correction. Subgroup analyses were exploratory. Analyses used Python 3.12.13, pandas 2.2.3, NumPy 2.3.5, and SciPy 1.17.0; was significant. No a priori sample-size calculation was performed. Additional statistical definitions are provided in Supplementary Methods S4.
3. Results
3.1. Checklist I Segmentation and Reportability
On the held-out test set, ResTransUNet achieved a mean Dice coefficient of 0.759, mean intersection over union (IoU) of 0.641, and pixel accuracy of 97.38%. For Checklist I classification, accuracy was 95.61%, precision 96.65%, recall 97.74%, and F1-score 97.19% (Table 1). The U-Net baseline yielded slightly higher mean Dice (0.766) and IoU (0.654), but lower classification accuracy (91.67%), precision (96.47%), recall (92.66%), and F1-score (94.52%). Thus, ResTransUNet improved Checklist I accuracy, recall, and F1-score by 3.94, 5.08, and 2.67 percentage points, respectively. At the class level, the femoral head had the highest overlap (Dice, 0.902; IoU, 0.845), whereas the synovial fold had the lowest (Dice, 0.654; IoU, 0.527).
Although the U-Net baseline produced comparable mean overlap values, its Checklist I accuracy and recall were lower than those of ResTransUNet (Table 1). Errors were concentrated mainly at boundaries of thin or low-contrast structures.
3.2. Sequential Workflow Performance
Of the 1024 images entering the sequential workflow, 18 were rejected at Checklist I and 160 of the remaining 1006 at Checklist II; 846 images therefore proceeded to angle measurement and classification (Table 2). Checklist II classification achieved 87.18% accuracy. Among the 846 images completing the workflow, the -angle error was smaller than the -angle error, with mean absolute errors of and , respectively.
Exact Graf-type agreement was 40.07% (339/846; Table 3). Disagreement was driven principally by differentiation between types Ia and Ib, which share the same binary no-DDH designation. Consequently, binary DDH classification performed better than exact Graf typing, with 81.09% accuracy, 82.67% sensitivity, and 80.59% specificity.
Interobserver reliability was higher for the angle [ICC(2,1), 0.872; 95% CI, 0.804–0.916] than for the angle [ICC(2,1), 0.722; 95% CI, 0.558–0.823]. Pairwise MAEs ranged from to for and from to for .
3.3. Paired Clinical Reader Study
Fifteen clinicians completed both sessions. Mean accuracy increased from 72.3% without CAD to 90.2% with CAD, corresponding to a mean paired improvement of 17.9 percentage points (95% CI, 10.3–25.4; , ; Cohen’s ; Table 4). The paired differences did not depart significantly from normality (Shapiro–Wilk , ). All 15 clinicians improved, producing 268 additional correct classifications across 1500 reader–image assessments. The stand-alone CAD model correctly classified 93 of the 100 reader-study images.
Residents improved more than consultants/specialists (between-group difference, 15.8 percentage points; 95% CI, 0.9–30.7; Welch , ). Accuracy gain did not differ among monthly-volume categories [, ; Table 5]. Completion time decreased numerically from a median of 13.1 to 9.0 minutes, but the paired difference was not statistically significant ().
Years of experience showed a positive unadjusted association with unaided accuracy, but this did not remain significant after Holm correction (, adjusted ). Experience was not significantly associated with CAD-assisted accuracy or accuracy gain after correction.
4. Discussion
This study evaluated an AI-assisted workflow designed to reproduce the sequential methodology described by Graf [5,6]. Within this methodology, image validity is not a secondary technical consideration: the required anatomical structures must first be visible and the standard plane must then be confirmed before the and angles can be measured and a Graf type assigned. The workflow performed best at this initial gate. Checklist I accuracy and recall were 95.61% and 97.74%, respectively, and CAD increased mean clinician accuracy from 72.3% to 90.2%. Performance declined at subsequent stages, particularly for -angle estimation and exact Graf classification. The findings therefore support the system principally as clinician-facing decision support for verifying whether an image is suitable for Graf assessment, rather than as an autonomous diagnostic pipeline.
These results should be interpreted within a rapidly expanding but heterogeneous literature. A recent systematic review identified 15 ultrasound studies comprising 8315 images and reported AUC values of 0.90–0.99, sensitivities of 86.54–100%, and specificities of 62.5–100%; however, the certainty of evidence was rated low because of methodological heterogeneity, small samples in some studies, suspected publication bias, and limited external validation [21]. Individual studies illustrate both the promise and the difficulty of cross-study comparison. Gong et al. reported 85.89% accuracy for direct DDH classification, whereas Atalar et al. achieved 93% accuracy and an AUC of 0.99 when distinguishing normal, dysplastic, and incorrectly positioned images [22,23]. Kinugasa et al. reported perfect test-set classification metrics using transfer learning, while other systems have targeted standard-plane recognition, angle measurement, or Graf typing with high internal performance [10,11,12,14,15,24]. These studies establish technical feasibility, but high performance on a final classification task does not by itself demonstrate that every input image satisfied the preceding Graf requirements. The present study instead evaluated the consequences of enforcing those requirements sequentially, showing that strong performance at one stage did not guarantee comparable performance across the complete workflow.
Previous work on acquisition adequacy supports this validity-first interpretation. Quader et al. obtained an AUC of 0.985 for distinguishing adequate from inadequate scans before extracting dysplasia metrics [9]. Lee et al. required visible key anatomical points and iliac inclination within ; only 320 of 921 images (34.7%) were considered appropriate by both the model and the human observer, demonstrating how substantially the analyzable dataset can contract when validity criteria are applied [25]. Using images from multiple ultrasound systems, Li et al. reported 95.4% accuracy and an AUC of 0.982 for standard-plane recognition, and Xu et al. reported 96.70% standard-plane accuracy with a Cohen’s of 0.925 against senior physicians [26,27]. Atalar et al.’s deliberate inclusion of 365 images acquired with incorrect probe positioning likewise showed the importance of training systems to reject, rather than diagnose from, unsuitable inputs [23]. Together, these studies indicate that automated hip-ultrasound screening should explicitly represent invalid and non-standard images instead of assuming that all submitted images are ready for measurement.
The segmentation findings further emphasize the distinction between technical overlap and clinical adequacy. The femoral head achieved the greatest overlap, whereas errors were concentrated at thin, low-contrast structures such as the synovial fold. Although the conventional U-Net produced slightly higher aggregate Dice and IoU values, ResTransUNet performed better for the clinically relevant Checklist I decision. A small omitted region may have little effect on mean overlap yet cause a required structure to fall below its area threshold and render the image unsuitable for Graf classification. This discrepancy supports evaluating segmentation according to its intended clinical endpoint and agrees with evidence that scan quality materially affects automated interpretation [13]. Approaches that jointly learn landmarks and structures may help preserve these clinically important relationships: Hu et al., for example, combined both tasks and reported mean - and -angle errors of and , respectively [28]. Nevertheless, the relevant question for a validity gate is not only how closely a mask overlaps a reference annotation, but whether every structure required for reliable measurement is demonstrably present.
Published measurement results also clarify where the present downstream pipeline requires improvement. In a dataset of more than 300,000 images, Oelen et al. reported an -angle root-mean-square error of for landmark-based automation versus for physicians in routine practice [29]. Hu et al. reported errors below for 93% of and 85% of estimates, while Huang et al. reported ICCs of 0.96 and 0.97 for the two angles in abnormal hips [11,28]. However, measurement has not been uniformly robust. Quader et al. found a mean automated–manual difference of , and Chen et al. reported only 35.3% sensitivity for identifying despite high specificity [9,12]. In the present study, the angle had a mean absolute error of , positive bias of , and ICC of 0.561, consistent with the known difficulty and lower clinician reproducibility of the cartilaginous-roof line [7,8]. This error probably contributed to frequent Ia–Ib disagreement and an exact Graf agreement of only 40.07%, despite 81.09% accuracy for the study-defined binary DDH endpoint. Differences in cohorts, image-selection rules, reference standards, and reported metrics preclude direct ranking of these systems, but the comparison identifies -landmark localization and exact category assignment as priorities for further development. Binary performance cannot replace exact Graf typing when category influences management, and the grouping of IIa/IIb as DDH in this study must not be interpreted as an autonomous treatment recommendation because type IIa may represent physiological immaturity depending on age.
The paired reader study supported the proposed clinician-facing role. All 15 clinicians improved with CAD, and the aided display allowed them to inspect the segmentation, completeness decision, and missing structures rather than receive only a binary recommendation. In a sweep-ultrasound study spanning poor-to-excellent image quality, Ghasseminia et al. found greater agreement among subspecialists () than for the AI system (), and AI reliability deteriorated more than human reliability on the poorest-quality images [30]. This result reinforces the value of both explicit quality control and retained clinician oversight. Evidence from another orthopaedic imaging task similarly showed that clinicians assisted by AI achieved 97% accuracy, exceeding the 83% accuracy of the model alone [31]. The present reader study is concordant with that human–AI complementarity: the clinically relevant unit was the clinician supported by an inspectable output, not the stand-alone algorithm. Residents showed a larger gain than consultants or specialists, but this subgroup comparison involved only six residents and was exploratory. Completion time decreased numerically but not significantly. Although rapid automated measurement has been demonstrated elsewhere, including a reported processing time of 1.1 seconds with DDHnet, the present study supports improved Checklist I accuracy rather than improved efficiency [11].
Three-dimensional and multisource approaches suggest potential routes toward broader screening, while also illustrating the importance of rigorous validation. AI-assisted three-dimensional ultrasound identified Graf-compatible sections with good agreement in 216 hips [32]. In a two-center, multi-year study of 2492 hips, automated analysis of three-dimensional sweeps correctly identified 90% of dysplastic hips and achieved against clinical diagnosis; however, the positive predictive value was 32% and agreement for the angle was more modest, showing that large and diverse evaluations can reveal trade-offs not evident in restricted internal datasets [33]. Multiplanar or sweep acquisition may reduce dependence on a single manually selected frame by allowing automated selection of the most appropriate plane, but poor acquisition quality remains consequential. Future studies should therefore improve automated angle measurement and exact Graf classification only after confirming adherence to both Checklist I and Checklist II, and should validate the entire sequence prospectively across centers, devices, operators, and screening populations. They should also include Graf type IV hips and complex or atypical anatomies so that automated screening is tested across the full morphological spectrum.
Several limitations restrict the present study’s generalizability. It was retrospective and single-center, used one ultrasound platform and transducer, and included a referred population rather than a universal-screening cohort. Exclusion of type IV hips narrowed disease severity, and static-image analysis did not evaluate real-time acquisition or patient-level outcomes. Although examination-level partitioning reduced leakage, sequential gating produced different denominators across stages, and estimates of angle and classification performance were conditional on prior automated acceptance. Independent expert-group comparison can strengthen ground-truth validation in orthopaedic imaging AI [34]; nevertheless, the present clinician-derived annotations and consensus reference remained susceptible to uncertainty at poorly visualized boundaries.
The reader study was also limited by 15 clinicians, 100 images, and a test-set prevalence of non-compliance that may differ from clinical screening. All readers completed the unaided session first and reassessed the same images four weeks later; re-randomization reduced but did not eliminate recall, learning, and period effects, while the absence of a randomized crossover design limited causal inference. These constraints limit the conclusions to internal validation of Checklist I decision support under the tested conditions.
5. Conclusions
The AI-assisted workflow accurately identified Checklist I-compliant hip-ultrasound images, and CAD improved mean clinician accuracy by 17.9 percentage points, with all 15 clinicians improving. These findings support its use as a clinician-facing tool for verifying image validity before Graf measurement and classification. Future studies should focus on improving automated angle measurement and Graf classification only after confirming that each image satisfies both Checklist I and Checklist II. Development and validation cohorts should also include Graf type IV hips and complex or atypical hip anatomies to assess automated ultrasound screening across the full spectrum of neonatal hip morphology.
Author Contributions
Conceptualization, A.Au.; methodology, A.Au., M.S., G.M., A.Ap., L.U. and M.P.; software, M.S. and G.M.; validation, A.Ap., M.P., A.M., E.V. and S.M.; formal analysis, M.S., G.M., A.Ap. and M.P.; investigation, J.H.; resources, A.M., E.V. and S.M.; data curation, A.Au. and J.H.; writing—original draft preparation, A.Au.; writing—review and editing, M.S., G.M., A.Ap. and L.U.; supervision, A.Ap. and L.U. All authors have read and agreed to the published version of the manuscript.
Funding
This research received no external funding
Institutional Review Board Statement
The study was conducted in accordance with the Declaration of Helsinki, and approved by the Institutional Review Board of Città della Salute e della Scienza di Torino (Study Protocol: DB2021; Approval code: 1489/2021; Approval date: 14/11/2021).
Informed Consent Statement
Patient consent was waived due to full anonymization before images’ processing
Data Availability Statement
Appropriately de-identified data may be made available by the corresponding author upon reasonable request on a case-by-case basis, subject to institutional authorization, in accordance with Regulation (EU) 2016/679 (General Data Protection Regulation; GDPR) and applicable national data-protection legislation.
Conflicts of Interest
The authors declare no conflicts of interest.
Abbreviations
The following abbreviations are used in this manuscript:
| AI | Artificial intelligence |
| AUC | Area under the receiver operating characteristic curve |
| CAD | Computer-aided diagnosis |
| CI | Confidence interval |
| CUDA | Compute Unified Device Architecture |
| CVAT | Computer Vision Annotation Tool |
| DDH | Developmental dysplasia of the hip |
| F1 | Harmonic mean of precision and recall |
| FN | False negative |
| FP | False positive |
| FT | Focal Tversky loss |
| GPU | Graphics processing unit |
| ICC | Intraclass correlation coefficient |
| IoU | Intersection over union |
| MAE | Mean absolute error |
| MCC | Matthews correlation coefficient |
| OCR | Optical character recognition |
| pp | Percentage points |
| SD | Standard deviation |
| TN | True negative |
| TP | True positive |
References
- De Pellegrin, M.; Tessari, L. Early Ultrasound Diagnosis of Developmental Dysplasia of the Hip. Bull. Hosp. Jt. Dis. 1996, 54, 222–225. [Google Scholar] [PubMed]
- Agostiniani, R.; Atti, G.; Bonforte, S.; Casini, C.; Cirillo, M.; De Pellegrin, M.; Di Bello, D.; Esposito, F.; Galla, A.; Marrè Brunenghi, G.; et al. Recommendations for Early Diagnosis of Developmental Dysplasia of the Hip (DDH): Working Group Intersociety Consensus Document. Ital. J. Pediatr. 2020, 46, 150. [Google Scholar] [CrossRef] [PubMed]
- Rosendahl, K.; Tomà, P. Ultrasound in the Diagnosis of Developmental Dysplasia of the Hip in Newborns: The European Approach—A Review of Methods, Accuracy and Clinical Validity. Eur. Radiol. 2007, 17, 1960–1967. [Google Scholar] [CrossRef] [PubMed]
- De Pellegrin, M.; Filisetti, C.; Cossutta, M.; Colombo, M.; Consiglieri, G.; Tucci, F.; Aiuti, A.; Bernardo, M.E. Ultrasonographic Hip Morphology in Mucopolysaccharidosis Type I Hurler after Hematopoietic Stem Cell Gene Therapy. J. Child. Orthop. 2025, 19, 377–385. [Google Scholar] [CrossRef] [PubMed]
- Graf, R. Hip Sonography: Background; Technique and Common Mistakes; Results; Debate and Politics; Challenges. Hip Int. 2017, 27, 215–219. [Google Scholar] [CrossRef] [PubMed]
- Graf, R.; Maizen, C.; Seidl, T. Sonography of the Infant’s Hip: Principles, Implementation and Therapeutic Consequences; Springer: Cham, Switzerland, 2024. [Google Scholar] [CrossRef]
- Peterlein, C.D.; Schüttler, K.F.; Lakemeier, S.; Timmesfeld, N.; Görg, C.; Fuchs-Winkelmann, S.; Schofer, M.D. Reproducibility of Different Screening Classifications in Ultrasonography of the Newborn Hip. BMC Pediatr. 2010, 10, 98. [Google Scholar] [CrossRef] [PubMed]
- Roposch, A.; Graf, R.; Wright, J.G. Determining the Reliability of the Graf Classification for Hip Dysplasia. Clin. Orthop. Relat. Res. 2006, 447, 119–124. [Google Scholar] [CrossRef] [PubMed]
- Quader, N.; Hodgson, A.J.; Mulpuri, K.; Schaeffer, E.K.; Abugharbieh, R. Automatic Evaluation of Scan Adequacy and Dysplasia Metrics in 2-D Ultrasound Images of the Neonatal Hip. Ultrasound Med. Biol. 2017, 43, 1252–1262. [Google Scholar] [CrossRef] [PubMed]
- Chen, T.; Zhang, Y.; Wang, B.; Wang, J.; Cui, L.; He, J.; Cong, L. Development of a Fully Automated Graf Standard Plane and Angle Evaluation Method for Infant Hip Ultrasound Scans. Diagnostics 2022, 12, 1423. [Google Scholar] [CrossRef] [PubMed]
- Huang, B.; Xia, B.; Qian, J.; Zhou, X.; Zhou, X.; Liu, S.; Chang, A.; Yan, Z.; Tang, Z.; Xu, N.; et al. Artificial Intelligence-Assisted Ultrasound Diagnosis on Infant Developmental Dysplasia of the Hip Under Constrained Computational Resources. J. Ultrasound Med. 2023, 42, 1235–1248. [Google Scholar] [CrossRef] [PubMed]
- Chen, Y.P.; Fan, T.Y.; Chu, C.C.J.; Lin, J.J.; Ji, C.Y.; Kuo, C.F.; Kao, H.K. Automatic and Human Level Graf’s Type Identification for Detecting Developmental Dysplasia of the Hip. Biomed. J. 2024, 47, 100614. [Google Scholar] [CrossRef] [PubMed]
- Hareendranathan, A.R.; Chahal, B.; Ghasseminia, S.; Zonoobi, D.; Jaremko, J.L. Impact of Scan Quality on AI Assessment of Hip Dysplasia Ultrasound. J. Ultrasound 2022, 25, 145–153. [Google Scholar] [CrossRef] [PubMed]
- Jaremko, J.L.; Hareendranathan, A.; Seyed Bolouri, S.E.; Frey, R.F.; Dulai, S.; Bailey, A.L. AI-Aided Workflow for Hip Dysplasia Screening Using Ultrasound in Primary Care Clinics. Sci. Rep. 2023, 13, 9224. [Google Scholar] [CrossRef] [PubMed]
- Liu, R.; Zhang, Y.; Luo, X.; Zheng, Y.; Liu, Q.; Liu, M.; Jiang, L. QualityDDH: Visualized Standardization of Neonatal Hip Ultrasound via a Structural Prior Regression Framework. Vis. Comput. 2025, 41, 11589–11602. [Google Scholar] [CrossRef]
- Azmi, A.; McArthur, A.; McDonald, S.; Hareendranathan, A.; Jaremko, J.L. Diagnostic Accuracy of Artificial Intelligence-Assisted Infant Hip Ultrasound Interpretation for Developmental Dysplasia of the Hip: Systematic Review and Meta-Analysis. Pediatr. Radiol. 2026, 56, 1165–1173. [Google Scholar] [CrossRef] [PubMed]
- Carnazzo, S.M.; Balconara, D.; La Quatra, M.; Praticò, A.D. Artificial Intelligence in Neonatal Hip Ultrasound: A Scoping Review of Methods and Clinical Evidence. J. Paediatr. Child Health Advance online publication. 2026. [Google Scholar] [CrossRef] [PubMed]
- CVAT.ai Corporation. Computer Vision Annotation Tool (CVAT). Zenodo Accessed on. 2023. (accessed on 14 August 2026). [Google Scholar] [CrossRef]
- Bland, J.M.; Altman, D.G. Statistical Methods for Assessing Agreement between Two Methods of Clinical Measurement. Lancet 1986, 1, 307–310. [Google Scholar] [CrossRef]
- Koo, T.K.; Li, M.Y. A Guideline of Selecting and Reporting Intraclass Correlation Coefficients for Reliability Research. J. Chiropr. Med. 2016, 15, 155–163. [Google Scholar] [CrossRef] [PubMed]
- Bhavsar, S.; Gowda, B.B.; Bhavsar, M.; Patole, S.; Rao, S.; Rath, C. Artificial Intelligence to Detect Developmental Dysplasia of Hip: A Systematic Review. J. Paediatr. Child Health 2025, 61, 1712–1727. [Google Scholar] [CrossRef] [PubMed]
- Gong, B.; Shi, J.; Han, X.; Zhang, H.; Huang, Y.; Hu, L.; Wang, J.; Du, J.; Shi, J. Diagnosis of Infantile Hip Dysplasia With B-Mode Ultrasound via Two-Stage Meta-Learning Based Deep Exclusivity Regularized Machine. IEEE J. Biomed. Health Inform. 2022, 26, 334–344. [Google Scholar] [CrossRef] [PubMed]
- Atalar, H.; Üreten, K.; Tokdemir, G.; Tolunay, T.; Çiçeklidağ, M.; Atik, O.Ş. The Diagnosis of Developmental Dysplasia of the Hip From Hip Ultrasonography Images With Deep Learning Methods. J. Pediatr. Orthop. 2023, 43, e132–e137. [Google Scholar] [CrossRef] [PubMed]
- Kinugasa, M.; Inui, A.; Satsuma, S.; Kobayashi, D.; Sakata, R.; Morishita, M.; Komoto, I.; Kuroda, R. Diagnosis of Developmental Dysplasia of the Hip by Ultrasound Imaging Using Deep Learning. J. Pediatr. Orthop. 2023, 43, e538–e544. [Google Scholar] [CrossRef] [PubMed]
- Lee, S.W.; Ye, H.U.; Lee, K.J.; Jang, W.Y.; Lee, J.H.; Hwang, S.M.; Heo, Y.R. Accuracy of New Deep Learning Model-Based Segmentation and Key-Point Multi-Detection Method for Ultrasonographic Developmental Dysplasia of the Hip (DDH) Screening. Diagnostics 2021, 11, 1174. [Google Scholar] [CrossRef] [PubMed]
- Li, X.; Zhang, R.; Wang, Z.; Wang, J. Semi-Supervised Learning in Diagnosis of Infant Hip Dysplasia Towards Multisource Ultrasound Images. Quant. Imaging Med. Surg. 2024, 14, 3707–3716. [Google Scholar] [CrossRef] [PubMed]
- Xu, Y.Y.; Lin, H.; Zhao, X.; et al. Artificial Intelligence Technology Used in Ultrasound Screening of Infant Development Hip Dysplasia. China Med. Imaging Technol. 2023, 39, 1229–1233. [Google Scholar]
- Hu, X.; Wang, L.; Yang, X.; Zhou, X.; Xue, W.; Cao, Y.; Liu, S.; Huang, Y.; Guo, S.; Shang, N.; et al. Joint Landmark and Structure Learning for Automatic Evaluation of Developmental Dysplasia of the Hip. IEEE J. Biomed. Health Inform. 2022, 26, 345–358. [Google Scholar] [CrossRef] [PubMed]
- Oelen, D.; Kaiser, P.; Baumann, T.; Schmid, R.; Bühler, C.; Munkhuu, B.; Essig, S. Accuracy of Trained Physicians Is Inferior to Deep Learning-Based Algorithm for Determining Angles in Ultrasound of the Newborn Hip. Ultraschall Med. 2022, 43, e49–e55. [Google Scholar] [CrossRef] [PubMed]
- Ghasseminia, S.; Lim, A.K.S.; Concepcion, N.D.P.; Kirschner, D.; Teo, Y.M.; Dulai, S.; Mabee, M.; Kernick, S.; Brockley, C.; Muljadi, S.; et al. Interobserver Variability of Hip Dysplasia Indices on Sweep Ultrasound for Novices, Experts, and Artificial Intelligence. J. Pediatr. Orthop. 2022, 42, e315–e323. [Google Scholar] [CrossRef] [PubMed]
- Tanzi, L.; Audisio, A.; Cirrincione, G.; Aprato, A.; Vezzetti, E. Vision Transformer for Femur Fracture Classification. Injury 2022, 53, 2625–2634. [Google Scholar] [CrossRef] [PubMed]
- He, J.; Cui, L.; Chen, T.; Lyu, X.; Yu, J.; Guo, W.; Wang, D.; Qin, X.; Zhao, Y.; Zhang, S. Study on Multiplanar Measurements of Infant Hips With Three-Dimensional Ultrasonography. J. Clin. Ultrasound 2022, 50, 639–645. [Google Scholar] [CrossRef] [PubMed]
- Ghasseminia, S.; Seyed Bolouri, S.E.; Dulai, S.; Kernick, S.; Brockley, C.; Hareendranathan, A.R.; Zonoobi, D.; Rao, P.; Jaremko, J.L. Automated Diagnosis of Hip Dysplasia From 3D Ultrasound Using Artificial Intelligence: A Two-Center Multi-Year Study. Inform. Med. Unlocked 2022, 33, 101082. [Google Scholar] [CrossRef]
- Audisio, A.; Zhu, T.; Joeris, A.; Sermon, A.; IJpma, F.F.A.; Giordano, V.; Desai, D.; Giannoudis, P.V.; Aprato, A. Pilot Validation Study for a Large Image Database of Proximal Femur Fracture Anteroposterior Radiographs: Searching for the Ground Truth. Injury 2026, 57, 113056. [Google Scholar] [CrossRef] [PubMed]
Figure 1.
Checklist I workflow. ResTransUNet generates masks for the eight required structures; post-processing and class-specific area thresholds determine whether the image is complete and may proceed to Checklist II.
Figure 1.
Checklist I workflow. ResTransUNet generates masks for the eight required structures; post-processing and class-specific area thresholds determine whether the image is complete and may proceed to Checklist II.
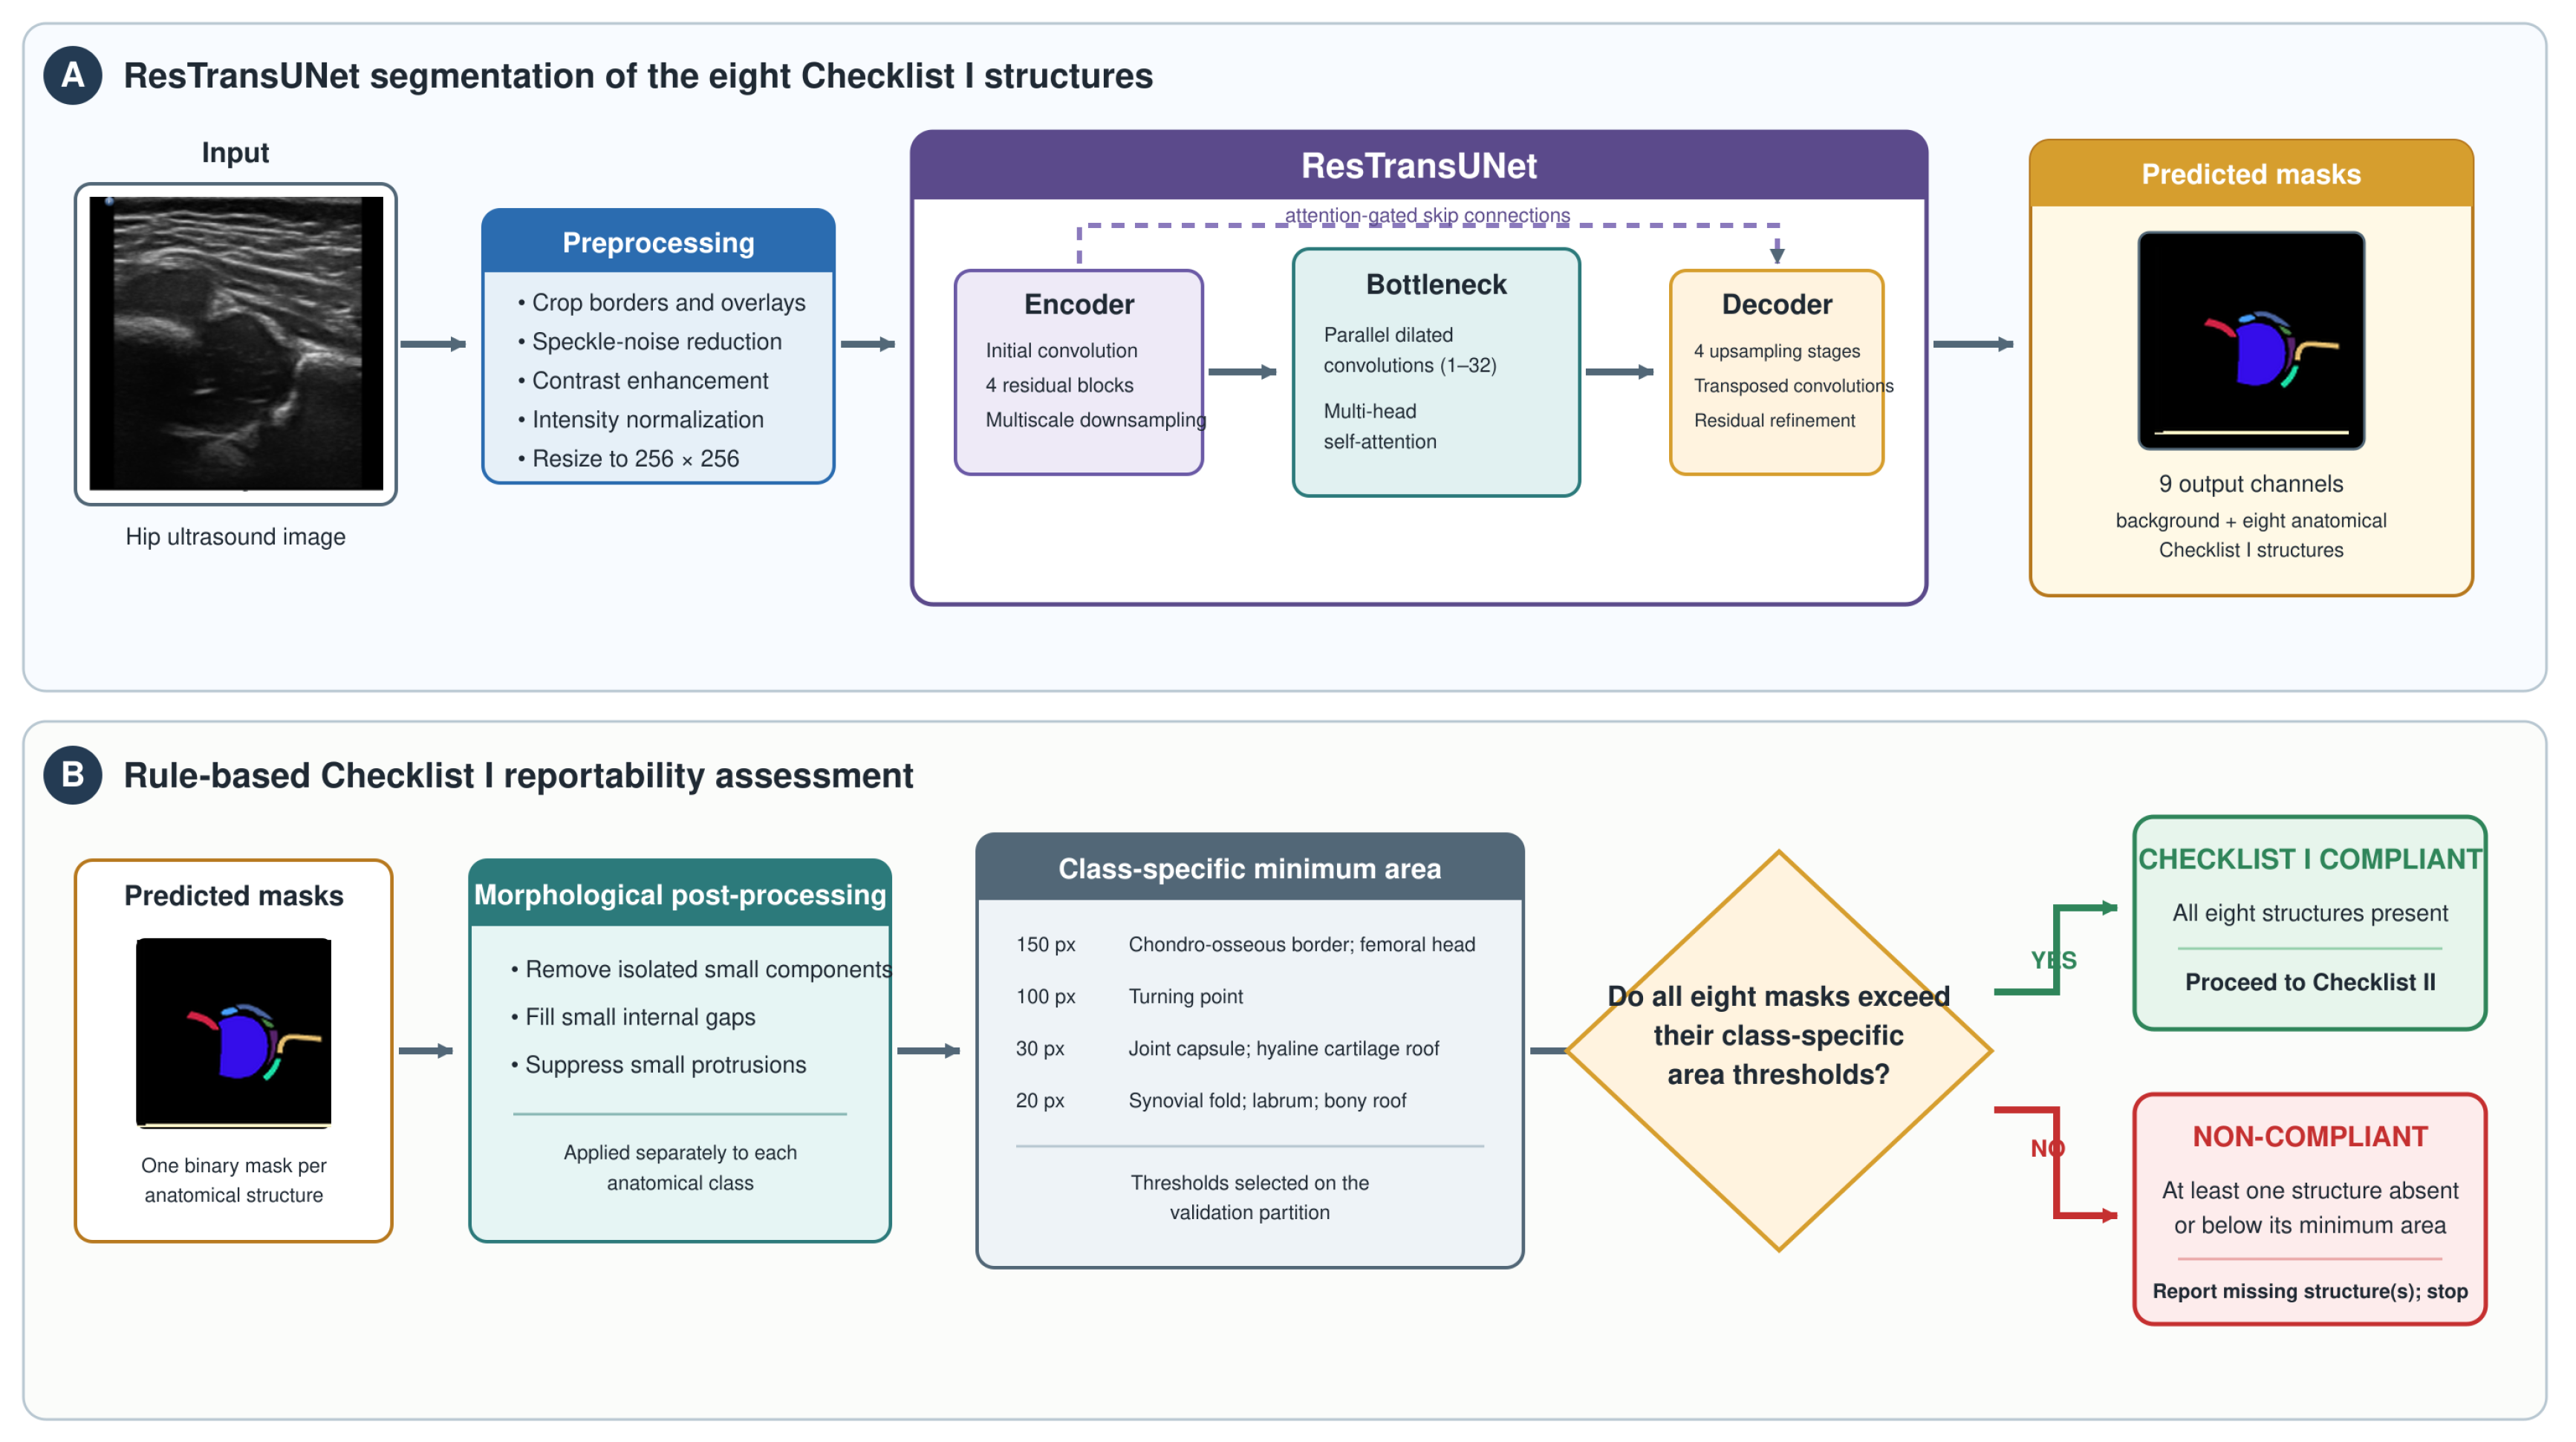
Figure 2.
Representative Checklist II inclination assessment. The fitted iliac baseline (yellow) is outside the prespecified tolerance in (A,C) and within tolerance in (B). SN, left; DX, right.
Figure 2.
Representative Checklist II inclination assessment. The fitted iliac baseline (yellow) is outside the prespecified tolerance in (A,C) and within tolerance in (B). SN, left; DX, right.
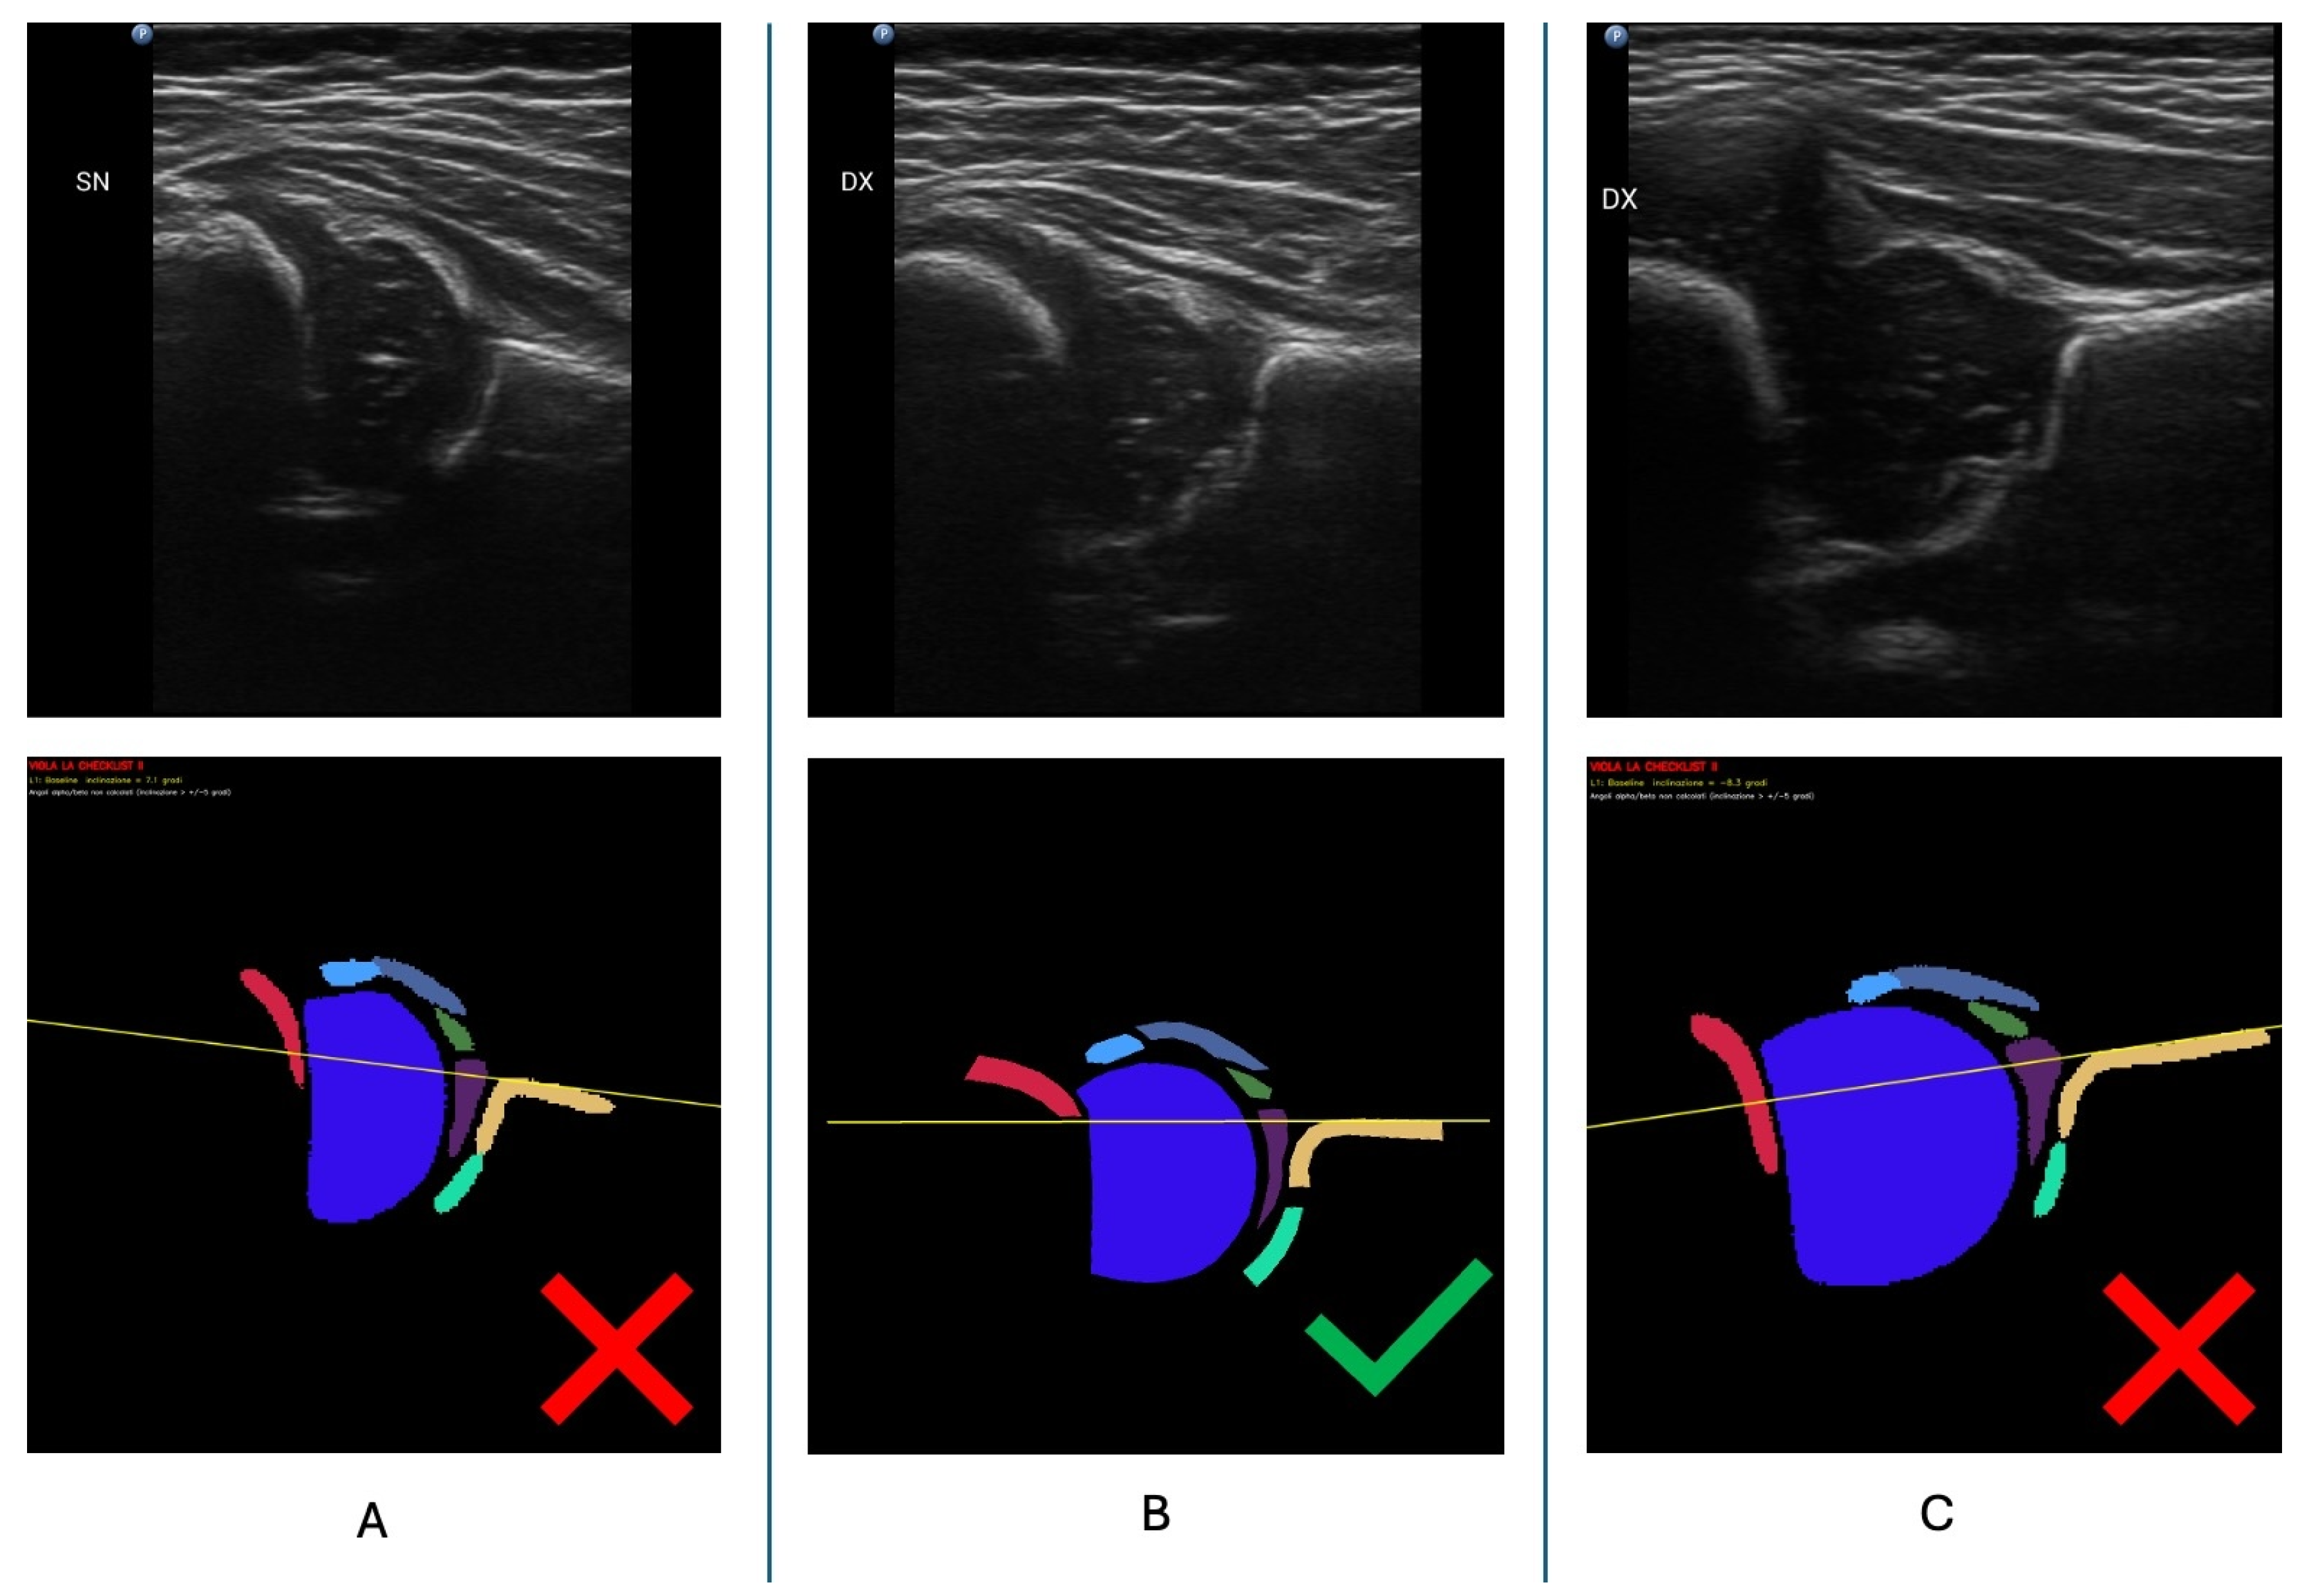
Figure 3.
Graf measurement example: (A) original image; (B) clinician-generated angles; and (C) automated baseline, bony-roof line, cartilaginous-roof line, and / measurements. DX, right.
Figure 3.
Graf measurement example: (A) original image; (B) clinician-generated angles; and (C) automated baseline, bony-roof line, cartilaginous-roof line, and / measurements. DX, right.
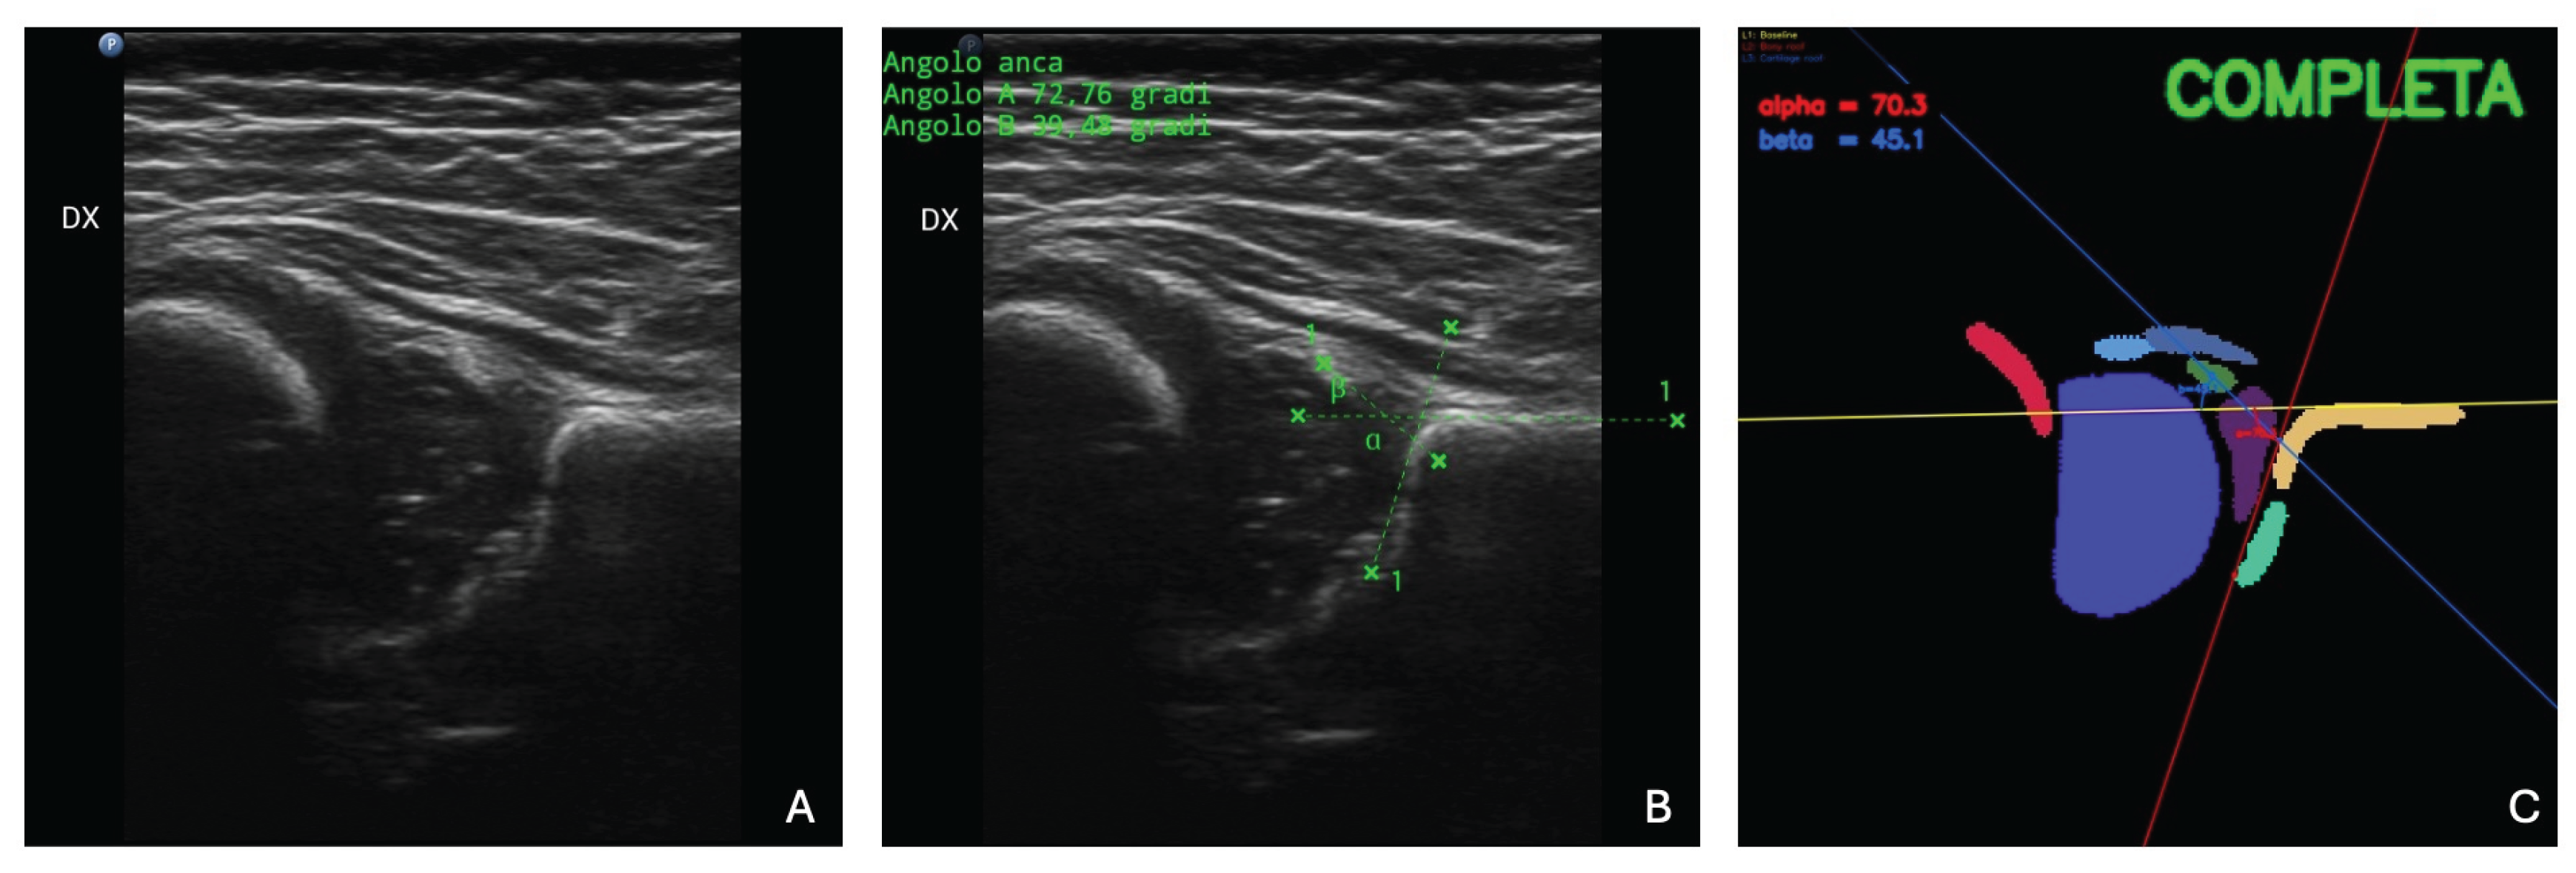

Table 1.
Segmentation and Checklist I reportability performance.
| A. ResTransUNet segmentation performance | ||
|---|---|---|
| Anatomical class | Dice | IoU |
| Chondro-osseous border | 0.795 | 0.681 |
| Femoral head | 0.902 | 0.845 |
| Synovial fold | 0.654 | 0.527 |
| Joint capsule | 0.720 | 0.586 |
| Labrum | 0.743 | 0.617 |
| Hyaline cartilage roof | 0.750 | 0.618 |
| Bony roof | 0.732 | 0.605 |
| Turning point | 0.776 | 0.646 |
| Mean | 0.759 | 0.641 |
| B. Model-level and Checklist I classification performance | |||||||
|---|---|---|---|---|---|---|---|
| Model | Mean Dice | Mean IoU | Pixel accuracy (%) | Accuracy (%) | Precision (%) | Recall (%) | F1-score (%) |
| ResTransUNet | 0.759 | 0.641 | 97.38 | 95.61 | 96.65 | 97.74 | 97.19 |
| U-Net baseline | 0.766 | 0.654 | – | 91.67 | 96.47 | 92.66 | 94.52 |
Table 2.
Sequential workflow, quality-control classification, and angle-measurement performance.
| A. Image flow through the sequential workflow | |||||||
|---|---|---|---|---|---|---|---|
| Stage | Evaluated, n | Not forwarded, n | Forwarded, n (% of initial set) | ||||
| Checklist I | 1024 | 18 | 1006 (98.24) | ||||
| Checklist II | 1006 | 160 | 846 (82.62) | ||||
| Angle measurement and classification | 846 | – | 846 (82.62) | ||||
| B. Checklist II and binary DDH classification | |||||||
| Endpoint | n | Accuracy (%) | Precision (%) | Recall/sensitivity (%) | Specificity (%) | F1-score (%) | MCC |
| Checklist II non-compliance | 1006 | 87.18 | 48.13 | 62.60 | 90.60 | 54.42 | 0.477 |
| Binary DDH | 846 | 81.09 | 57.19 | 82.67 | 80.59 | 67.61 | – |
| C. Automated versus clinical consensus angle measurements | |||||||
| Angle | n | MAE () | Bias () | SD () | 95% limits of agreement () | ICC(3,1) (95% CI) | |
| 846 | 3.59 | 4.20 | to 6.58 | 0.795 (0.769–0.819) | |||
| 846 | 11.91 | 11.07 | 8.36 | to 27.45 | 0.561 (0.513–0.606) | ||
Table 3.
Graf-type classification and interobserver angle agreement.
| A. Confusion matrix for automated Graf classification | |||||||
|---|---|---|---|---|---|---|---|
| Reference type | Automated type | Total | |||||
| D | III | IIa/IIb | IIc | Ia | Ib | ||
| D | 1 | 1 | 4 | 0 | 0 | 0 | 6 |
| III | 2 | 2 | 0 | 2 | 0 | 0 | 6 |
| IIa/IIb | 16 | 2 | 116 | 6 | 5 | 30 | 175 |
| IIc | 4 | 2 | 5 | 4 | 0 | 0 | 15 |
| Ia | 0 | 0 | 47 | 0 | 62 | 299 | 408 |
| Ib | 1 | 0 | 78 | 0 | 3 | 154 | 236 |
| Total | 24 | 7 | 250 | 12 | 70 | 483 | 846 |
| B. Pairwise interobserver agreement in the random 100-image subset | |||||||
| Angle | Observer pair | MAE () | Bias () | SD () | 95% limits of agreement () | ||
| Clinician 1–Clinician 2 | 3.52 | 3.86 | to 4.89 | ||||
| Clinician 1–Clinician 3 | 3.31 | 4.14 | to 6.59 | ||||
| Clinician 2–Clinician 3 | 3.26 | 1.16 | 4.27 | to 9.53 | |||
| Clinician 1–Clinician 2 | 6.58 | 6.26 | to 6.94 | ||||
| Clinician 1–Clinician 3 | 4.84 | 6.33 | to 11.11 | ||||
| Clinician 2–Clinician 3 | 5.79 | 4.03 | 6.79 | to 17.35 | |||
| Angle | ICC(2,1) | 95% CI | |||||
| 0.872 | 0.804–0.916 | ||||||
| 0.722 | 0.558–0.823 | ||||||
Table 4.
Accuracy and completion time in the paired clinical reader study.
| A. Accuracy overall and by reader characteristics | ||||
|---|---|---|---|---|
| Group | n | Unaided accuracy (%) | CAD-assisted accuracy (%) | Gain (percentage points) |
| All clinicians | 15 | |||
| Consultants/specialists | 9 | |||
| Residents | 6 | |||
| Monthly volume | 6 | |||
| Monthly volume 5–20 | 1 | 88.0 | 94.0 | 6.0 |
| Monthly volume | 8 | |||
| B. Session completion time | ||||
| Outcome | Unaided | CAD-assisted | Paired change | p-value |
| Time, min | 13.1 (12.5–16.5) | 9.0 (7.9–16.3) | ( to 1.2) | 0.177 |
Table 5.
Exploratory analyses of factors associated with reader accuracy and CAD-related improvement.
Table 5.
Exploratory analyses of factors associated with reader accuracy and CAD-related improvement.
| Factor | Outcome/comparison | Estimate or statistic | Unadjusted p | Holm-adjusted p |
|---|---|---|---|---|
| Career level | Gain: residents vs. consultants | pp (95% CI, 0.9–30.7) | 0.041 | – |
| Monthly volume | Gain across , 5–20, and | 0.767 | – | |
| Years of experience | Unaided accuracy | 0.046 | 0.138 | |
| Years of experience | CAD-assisted accuracy | 0.103 | 0.207 | |
| Years of experience | Accuracy gain | 0.149 | 0.207 |
Disclaimer/Publisher’s Note: The statements, opinions and data contained in all publications are solely those of the individual author(s) and contributor(s) and not of MDPI and/or the editor(s). MDPI and/or the editor(s) disclaim responsibility for any injury to people or property resulting from any ideas, methods, instructions or products referred to in the content. |
© 2026 by the authors. Licensee MDPI, Basel, Switzerland. This article is an open access article distributed under the terms and conditions of the Creative Commons Attribution (CC BY) license.
Copyright: This open access article is published under a Creative Commons CC BY 4.0 license, which permit the free download, distribution, and reuse, provided that the author and preprint are cited in any reuse.