

Submitted:
30 August 2026
Posted:
31 August 2026
You are already at the latest version
Abstract
The rational design of inorganic phosphors with targeted emission wavelengths is challenging because luminescence depends on strongly coupled structural, electronic, and excitation-dependent factors. Machine-learning studies in this area often prioritize predictive accuracy without systematically evaluating descriptor reproducibility and physical interpretability. Here, we develop a physics-guided explainable machine-learning framework that combines multi-method feature selection, descriptor stability analysis, and physicochemical interpretation for emission-wavelength prediction. A curated dataset of 2327 single-dopant phosphor compositions, initially represented by 125 physicochemical descriptors, was refined to 46 physically meaningful descriptors. Twelve complementary feature-selection methods were evaluated using eight stability metrics and 10-fold cross-validation. Pearson correlation and ANOVA-F, which are mathematically related univariate criteria for measuring linear association, identified the same seven-descriptor subset with complete 10/10 fold-level reproducibility. The resulting Random Forest model achieved a mean cross-validated R2 = 0.9308, MAE = 7.78 nm, and RMSE = 22.55 nm. The seven-descriptor model retained essentially the same predictive performance as the best fully reproducible 24-descriptor model while reducing descriptor dimensionality by about 71% relative to that model and by about 86% relative to the full physically meaningful candidate space. On the independent test set, RF and GB achieved R2 values of 0.9192 and 0.9023, respectively. SHAP analysis, descriptor ablation, interaction analysis, and complementary feature-importance methods consistently identified the same descriptor hierarchy. The ionic radius of the emission-center site was the dominant predictor, followed by excitation source and dopant valency. These results suggest four practical considerations for phosphor screening, namely activator-site compatibility, dopant oxidation state, host chemical environment, and excitation conditions. The results show that descriptor selection should consider not only predictive accuracy but also reproducibility, compactness, generalizability, and physical interpretability.
Keywords:
explainable machine learning
; materials informatics
; inorganic phosphors
; feature selection
; descriptor optimization
; descriptor stability
; SHAP analysis
; emission wavelength prediction
; physics-guided materials design
1. Introduction
Light-emitting inorganic phosphors constitute one of the most important classes of functional materials in modern photonics and have become indispensable for numerous applications, including white light-emitting diodes (WLEDs), solid-state lighting, flat-panel displays, lasers, optical sensing, bioimaging, and emerging optoelectronic devices [1,2,3,4,5,6,7]. Their luminescence properties originate from intricate interactions between the crystalline host lattice and activator ions, where local coordination environments, crystal-field splitting, electronic structure, lattice dynamics, and energy-transfer mechanisms collectively determine the emission wavelength, quantum efficiency, thermal stability, and color purity [1,3,4,5,6,7]. Even subtle variations in crystal chemistry or local symmetry can significantly modify the electronic transitions responsible for photoluminescence, making the rational optimization of phosphor materials an inherently multidimensional materials design problem [3,4,5,6,7]. Although thousands of phosphor compositions have been synthesized and characterized over the past several decades, discovering materials with targeted optical properties still depends heavily on labor-intensive experimental trial-and-error approaches [1,2,3]. Accelerating phosphor discovery while improving the fundamental understanding of composition-structure-property relationships has become one of the major objectives of modern phosphor science and materials engineering [2,3].
To overcome the limitations of conventional trial-and-error experimentation, machine learning (ML) has rapidly emerged as a transformative approach for accelerating phosphor discovery and optimizing photoluminescent materials [8,9,10,11]. Machine learning captures complex and often nonlinear relationships between material descriptors and optical properties from experimental and computational datasets, ML enables rapid prediction of excitation and emission wavelengths, photoluminescence quantum yield, thermal stability, activator valence, and other key characteristics while substantially reducing the experimental search space [8,9,10,11,12,13,14,15]. Early studies demonstrated the feasibility of applying ML to predict thermally robust phosphor hosts and excitation wavelengths, establishing the foundation for data-driven phosphor design [8,9]. Later studies expanded ML applications to the prediction of electronic descriptors, emission characteristics, activator behavior, and structure-property relationships, while increasingly integrating experimental validation to confirm the reliability of model predictions [10,11,12,13,14,15,16,17]. Recent studies have also shifted beyond property prediction toward machine-learning-guided materials discovery, where ML models are employed not only to screen existing compounds but also to identify previously unknown phosphors with targeted optical performance [2,11,13,14,15,16,17,18]. These advances have firmly established machine learning as a central component of modern phosphor research and have demonstrated its tremendous potential to accelerate the development of next-generation luminescent materials.
Despite these remarkable advances, the majority of machine learning studies on phosphor materials remain predominantly prediction-oriented, where model development is primarily driven by improvements in statistical performance metrics such as the coefficient of determination (R2), mean absolute error (MAE), and root mean square error (RMSE) [11,19,20,21,22]. Although such metrics provide valuable measures of predictive performance, they offer limited insight into the underlying physicochemical mechanisms governing photoluminescence or into whether the identified descriptors are genuinely robust and transferable across different machine learning models, feature-selection algorithms, and validation strategies [19,20,21,22,23,24]. Recent developments in explainable artificial intelligence (XAI) and physics-guided machine learning have emphasized that accurate prediction alone is not sufficient for scientific discovery. Interpretable models are also needed to reveal reliable structure-property relationships and extract physically meaningful knowledge that can guide rational materials design [19,20,21,22,23,25,26,27]. Likewise, recent studies in materials informatics have highlighted that descriptor selection is a critical step in the machine-learning workflow, since unstable or model-dependent descriptors may reduce both the reproducibility and scientific interpretability of the obtained results [24,28,29,30,31]. Existing studies on phosphor materials generally evaluate feature importance for a single optimized model or a single feature-selection strategy, while the robustness and consistency of descriptor importance across multiple feature-selection algorithms, machine learning models, and cross-validation folds remain largely unexplored [13,17,19,24]. Thus, a unified framework capable of simultaneously identifying stable descriptors, providing interpretable explanations, and translating machine-learning outcomes into transferable physics-guided design rules for inorganic phosphors has yet to be established.
In this work, we develop an explainable machine-learning approach for inorganic phosphors that combines multi-method feature selection, descriptor stability analysis, model evaluation, and physicochemical interpretation. The aim is to identify descriptors that are both predictive and reproducible and to relate them to the physical factors governing emission wavelength. Unlike previous studies, which typically rely on a single feature-selection method or model, our workflow integrates multiple selection strategies and uses explainable machine learning to interpret the resulting descriptor hierarchy in physical terms [10,13,14,15,16,17]. The identified descriptors are subsequently interpreted using state-of-the-art explainable machine-learning techniques to establish direct connections between statistical learning outcomes and the physicochemical mechanisms governing photoluminescence, transforming feature importance from a purely computational quantity into scientifically interpretable knowledge [9,10,13,16,17].
The main contribution of this work is the combination of feature selection, descriptor stability analysis, explainable machine learning, and physicochemical interpretation in a single workflow. The study does not introduce a new explainability method or experimentally synthesize new phosphors. Instead, it shows how these existing methods can be combined to obtain reproducible descriptors and formulate design rules. The proposed methodology shifts the focus from maximizing predictive accuracy alone toward identifying reliable descriptors that remain consistently important across multiple feature-selection strategies and machine-learning models, ultimately enabling the formulation of physics-guided design rules for inorganic phosphors. By combining predictive modeling with descriptor stability, model interpretability, and physicochemical understanding, this work provides a general framework for the rational discovery and optimization of next-generation phosphor materials. Overall, this study shows that accurate prediction alone is insufficient for accelerating materials discovery. Reliable descriptor identification, explainable machine learning, and physicochemical interpretation are also needed to formulate useful design rules.
2. Methodology
2.1. Dataset and Descriptor Generation
The machine learning framework was constructed using the Inorganic Phosphor Optical Properties (IPOP) database, containing experimentally validated phosphor compositions with corresponding optical properties [2,11,18]. The initial descriptor pool comprised 125 physicochemical variables. Following descriptor refinement, mathematically engineered arithmetic combinations with limited direct physicochemical interpretability were excluded, resulting in a final candidate space of 46 physically meaningful descriptors. This 46-descriptor space was used as the common input space for all subsequent feature-selection, stability, and model-development analyses. Compositional descriptors were generated using the matminer [32] and pymatgen [33] libraries, including elemental statistics, atomic/ionic radii, electronegativity, valence electron concentration, ionization energy, and electronic configuration [24,30,31,32,33]. Duplicate compositions were removed, yielding 2327 unique phosphor materials (Table 1).
The IPOP database contains experimentally validated inorganic phosphors collected from published literature and was used as the primary source of emission-wavelength data. Only single-dopant phosphors were considered to eliminate uncertainties associated with multi-activator interactions and to establish a consistent relationship between composition descriptors and emission wavelength. The final seven-variable representation comprised six material-related descriptors and the excitation-source variable, which reflects an experimentally defined measurement condition rather than an intrinsic material property.
2.2. Data Preprocessing
Following duplicate removal, the 2327 unique phosphor compositions were randomly divided into an 80% training set and a 20% independent test set. All data-dependent preprocessing operations were fitted using the training data only and subsequently applied to the independent test set. Descriptors with zero or near-zero variance and descriptors failing the predefined redundancy criteria were excluded as part of the descriptor-refinement procedure. The redundancy criterion was defined as a pairwise Pearson correlation coefficient exceeding 0.95 in absolute value. Descriptor pairs exceeding this threshold were examined, and the descriptor with lower physical interpretability or lower univariate predictive relevance was excluded. In addition, mathematically engineered descriptors generated through arithmetic combinations of primary physicochemical variables were removed when they lacked sufficiently direct physicochemical interpretation. This refinement resulted in a physically interpretable candidate space of 46 descriptors.
Missing values, when present, were imputed using the median values calculated from the training data. Feature values were subsequently normalized using Min-Max scaling, with the scaling parameters fitted exclusively on the training data and then applied unchanged to the validation and independent test data. All preprocessing parameters were estimated exclusively from the corresponding training data to prevent information leakage into validation and test sets. The independent test set remained completely unseen during feature selection, stability analysis, hyperparameter optimization, and model development. The complete preprocessing workflow is summarized in Table 2.
2.3. Feature Selection
To identify the most informative descriptors while minimizing algorithm-specific bias, a comprehensive framework integrating 12 complementary feature selection methods was adopted [24,28,29,30]. The methods were categorized into filter, wrapper, and embedded approaches (Table 3). Following descriptor preprocessing and refinement, the resulting 46 physically meaningful descriptors served as the common candidate space for all subsequent feature-selection, stability, and model-development analyses. Each algorithm generated an independent descriptor ranking, and all outputs were retained for subsequent stability analysis rather than relying on a single selection strategy. For the t-test and Wilcoxon-based filter methods, the continuous emission-wavelength target was divided into two groups independently within each training fold using the fold-specific median as the cutoff. Samples with emission wavelength greater than or equal to the training-fold median were assigned to the high-emission group, whereas samples below the median were assigned to the low-emission group. For each descriptor, Welch’s independent two-sample t-test (without assuming equal variances) and the Wilcoxon rank-sum test were then applied to compare the descriptor values between the two groups. The null hypothesis for the Welch’s t-test was equality of the group means, whereas the Wilcoxon rank-sum test evaluated the null hypothesis of no systematic difference in the distributions between the two groups. Descriptor ranking was based on the absolute value of the corresponding test statistic rather than on a predefined p-value threshold, and the top k descriptors were retained. This grouping and ranking procedure was repeated independently within each training fold. During 10-fold cross-validation on the 80% training set, feature selection was independently performed within each fold for every candidate subset size. All descriptor subsets generated by each feature-selection algorithm were retained for subsequent reproducibility analysis rather than selecting a final subset immediately.
Descriptor subsets that were reproduced identically across all ten cross-validation folds (10/10 agreement) were classified as fully reproducible candidates. Stability metrics were calculated from the original fold-level selections before applying this 10/10 consensus criterion.
To ensure a fair comparison among different feature-selection approaches, identical training data and preprocessing procedures were used for all algorithms, with feature selection performed on the same 46-descriptor physically interpretable candidate space.The descriptor rankings obtained from the twelve independent methods were subsequently analyzed using multiple stability metrics to identify descriptors exhibiting consistent importance across different selection strategies rather than relying on a single algorithm. For each training fold, the continuous emission-wavelength target was divided at the median of the training-fold target values into high-emission (y ≥ median) and low-emission (y <\) median) groups. For each descriptor, Welch’s two-sample t-test was applied and descriptors were ranked by \( |t|\) . The Wilcoxon rank-sum test was applied to the same groups, with descriptors ranked by the absolute rank-sum statistic. No p-value threshold was used; the top \( k\) descriptors were selected solely according to these ranking statistics.
2.4. Descriptor Stability Analysis
Since different feature-selection algorithms often produce different descriptor subsets, evaluating the stability of selected features is essential for identifying descriptors that are robust, reproducible, and independent of a particular selection method [24,28,29,30]. Instead of selecting descriptors solely according to their predictive importance, the present work systematically quantified descriptor stability across multiple feature-selection algorithms and cross-validation procedures.
Descriptor stability was evaluated directly from the original descriptor subsets generated independently within each of the ten cross-validation folds, before applying any fold-level consensus or 10/10 reproducibility filtering. For each feature-selection method, the eight stability metrics were calculated from the 10-fold CV folds within the 80% training set across the complete range of candidate subset sizes (k) enabling the intrinsic reproducibility of each selection algorithm to be evaluated as a function of descriptor number. Here, k denotes the number of descriptors selected from the 46-descriptor candidate space. The stability analysis therefore evaluates reproducibility across different descriptor numbers instead of treating the final seven-descriptor representation as predetermined. Only after this independent stability assessment were descriptor subsets exhibiting complete agreement across all ten folds (10/10 occurrence frequency) identified as fully reproducible candidates. When multiple candidate subsets were available, predictive performance, descriptor compactness, and physical interpretability were considered jointly in selecting the final subset for subsequent model interpretation.
Feature-selection stability was assessed using eight stability metrics that characterize different aspects of agreement and reproducibility between fold-level descriptor-selection subsets (Table 4). Among them, the Jaccard Index measures the similarity between two selected descriptor subsets and is defined as
where A and B denote descriptor subsets obtained from two independent feature-selection procedures.
To account for the agreement expected by random chance, the Kuncheva Index was additionally calculated as
where is the total number of descriptors, is the number of selected descriptors, and is the number of shared descriptors. The Nogueira Stability estimator provided an unbiased measure of feature-selection reproducibility [29]. For each algorithm, stability scores were evaluated across the ten cross-validation folds using the same predefined data partitions.
All stability metrics were computed directly from the original ten fold-level descriptor subsets and for each pair of folds, the selected subsets were represented as binary selection vectors, with 1 indicating that a descriptor was selected and 0 otherwise. Jaccard, Dice, and Kuncheva quantify subset overlap, whereas Hamming similarity quantifies agreement between the corresponding binary selection vectors. Pearson, Spearman, and Kendall statistics were also calculated from these binary selection vectors rather than from continuous descriptor-importance rankings. Because all folds select the same fixed number of descriptors for a given method and k, these binary-vector correlations are mathematically related to the same underlying subset overlap, and therefore can produce identical or nearly identical numerical values. The Nogueira estimator is computed independently from the complete binary selection matrix and provides a separate overall stability estimate. Thus, the identical values observed for several metrics reflect mathematical dependence under the fixed-cardinality binary representation rather than duplicated calculations or an implementation error.
The Nogueira Stability estimator was employed to provide an unbiased measure of feature-selection reproducibility [29]. Descriptor consistency was further assessed using Pearson, Spearman, Kendall, Dice, and Hamming similarity metrics. The stability profiles were used to characterize descriptor reproducibility across feature-selection methods and subset sizes, while complete 10/10 fold-level reproducibility was subsequently applied as a criterion for identifying fully reproducible candidate subsets. A stability score of 1.0 for an individual stability metric does not necessarily imply identical descriptor membership across all folds. Therefore, complete 10/10 reproducibility was treated as a separate, stricter criterion based directly on descriptor-subset identity. Feature selection and hyperparameter optimization were performed using 10-fold cross-validation on the 80% training set, with identical data partitions for all algorithms. Reproducibility was assessed within each training fold. Subsets showing identical descriptor membership across all ten folds were subsequently classified as fully reproducible candidates for the final multi-objective comparison. The independent 20% test set was used solely for final model evaluation. The 10-fold cross-validation framework was used for descriptor-selection stability assessment, comparison of candidate descriptor numbers, and model/hyperparameter evaluation within the 80% training set. The selection of k and model hyperparameters was not embedded within a separate outer cross-validation loop. Therefore, the cross-validated performance values used for model and descriptor selection may contain some optimistic selection bias and should be interpreted as internal training-set estimates rather than fully unbiased generalization estimates.
2.5. Machine Learning Model Development
Consensus descriptors were used to develop predictive models for λem estimation using complementary algorithms, such Random Forest (RF), Gradient Boosting (GB), and Artificial Neural Networks (ANN) [11,18,19,20,25]. The RF model aggregates predictions from T decision trees:
where is the prediction from the t-th tree.
The GB model builds an ensemble sequentially, with each new tree correcting residual errors:
The ANN model, consisting of fully connected hidden layers, learns nonlinear mappings via backpropagation.
Hyperparameters for all machine-learning models were optimized exclusively using the training dataset within the 10-fold cross-validation framework. The principal categories of optimized hyperparameters are summarized in Table 5, whereas the complete implementation details and the final hyperparameter values of the optimized RF and GB models are provided in Table S1. Unless otherwise stated, the remaining hyperparameters retained their default values in the Scikit-learn implementation.
The three models were intentionally selected to represent complementary machine-learning paradigms, namely bagging (RF), boosting (GB), and neural-network learning (ANN), enabling a balanced comparison between fundamentally different learning strategies.
2.6. Model Evaluation and Validation
Predictive performance was characterized using 10-fold cross-validation within the 80% training set during model development and selection, followed by final evaluation on the completely held-out independent 20% test set. Three regression metrics were employed, and coefficient of determination, mean absolute error, and root mean square error:
where , , and denote the observed values, predicted values, and mean of the observed values, respectively. The MAE and RMSE were calculated as:
where lower MAE and RMSE values indicate higher prediction accuracy, whereas higher R2 values correspond to better agreement between predicted and experimental emission wavelengths.
To ensure complete reproducibility and a fair comparison among different machine-learning algorithms, identical cross-validation partitions of the training set were used throughout the study. The KFold procedure was implemented with 10 folds, shuffle = True, and random_state = 42, ensuring that each algorithm was trained and validated using exactly the same data partitions. Feature selection, descriptor stability analysis, hyperparameter optimization, and model evaluation were all performed within this identical cross-validation framework, thereby ensuring that differences among methods were not attributable to different train-validation partitions. The complete implementation details and optimized model hyperparameters are summarized in Table S1.
2.7. Explainable Machine Learning
To interpret the model predictions and identify the physicochemical factors associated with λem, SHAP analysis was performed. SHAP quantifies the contribution of each descriptor to individual predictions while providing global model interpretability [19,20,21,22,26,27]. The SHAP value for descriptor is:
Global SHAP analysis was performed to rank descriptor importance across the entire dataset, whereas local SHAP values were used to explain individual predictions. In addition, SHAP dependence and interaction analyses were employed to investigate nonlinear descriptor effects and interactions influencing the emission wavelength. The resulting interpretations were combined with the descriptor stability analysis to identify physically interpretable and reproducible descriptors governing phosphor emission, providing design guidelines for the discovery and optimization of new phosphor materials. To improve the reliability of descriptor interpretation, SHAP analysis was complemented by additional explainability and validation analyses described in the Results section.
3. Results and Discussion
3.1. Dataset Characteristics and Preprocessing
The quality and representativeness of the training dataset are fundamental to the development of reliable machine-learning models for materials discovery. The initial IPOP database contained 2363 phosphor compositions together with their experimentally reported emission wavelengths and physicochemical descriptors. After removing duplicated material entries, the dataset comprised 2327 unique phosphor compositions, ensuring that each material contributed only once to model development. This preprocessing step minimizes potential bias arising from repeated observations and improves the reliability of subsequent statistical analyses.
After duplicate removal, the curated dataset comprised 2327 unique phosphor compositions. The initial 125-descriptor representation was subsequently refined by excluding non-informative and redundant variables together with mathematically engineered arithmetic descriptors that lacked sufficiently direct physicochemical interpretation. This procedure resulted in a physically meaningful candidate space of 46 descriptors, which served as the common input space for all subsequent feature-selection analyses. The 46-descriptor space was evaluated using twelve complementary feature-selection algorithms under 10-fold cross-validation on the training set across varying descriptor subset sizes. For each method, subsets exhibiting complete fold-level reproducibility (10/10 occurrence across folds) were identified. The final descriptor set was selected by jointly considering predictive performance, stability, compactness, and physicochemical interpretability. The selected descriptors were then used to train RF, GB, and ANN models, with the best-performing model subsequently interpreted using SHAP analysis to extract physics-guided design rules for inorganic phosphors. The complete workflow is illustrated in Figure 1. The curated dataset contains sufficient compositional diversity for reliable statistical analysis. The removal of redundant samples and non-informative descriptors reduced computational complexity while improving the robustness of feature selection by minimizing the influence of noisy and duplicated variables. Because descriptor selection was performed only after preprocessing, duplicate removal and redundancy filtering prevented repeated samples and highly correlated variables from artificially inflating selection frequencies during cross-validation. Additional statistical characteristics of the phosphor database, including distributions of emission wavelength, dopant species, and dopant valency, are provided in Figure S1.
The resulting curated dataset contains sufficient compositional diversity for reliable statistical analysis. The removal of redundant samples and non-informative descriptors reduced computational complexity while improving the robustness of feature selection by minimizing the influence of noisy and duplicated variables. Because descriptor selection was performed only after preprocessing, duplicate removal and redundancy filtering prevented repeated samples and highly correlated variables from artificially inflating selection frequencies during cross-validation. Additional statistical characteristics of the phosphor database, including distributions of emission wavelength, dopant species, dopant valency, and publication year, are provided in Figure S1.
3.2. Feature Selection and Descriptor Consensus
Because different feature-selection algorithms rely on distinct statistical criteria and optimization strategies, they may identify different descriptor subsets. Instead of treating these differences as methodological inconsistencies, the present analysis first examined whether the same physicochemical variables were repeatedly identified across fundamentally different feature-selection strategies. To investigate cross-method agreement, descriptor selection frequencies were summarized across the twelve feature-selection algorithms, as shown in Figure 2. This method-level consensus analysis provides an overview of how frequently individual descriptors were retained and should be distinguished from the subsequent fold-level stability analysis.
Figure 2 reveals substantial differences in descriptor-selection frequency across the twelve feature-selection algorithms, while also showing a smaller group of descriptors that was repeatedly retained by multiple methods. The frequencies shown in Figure 2 summarize selection agreement across the twelve feature-selection methods applied to the 46-descriptor physically meaningful candidate space. They therefore quantify cross-method agreement rather than fold-level reproducibility, sequential dimensionality reduction, or direct predictive importance. Thus, Figure 2 should be interpreted as a method-level consensus map rather than as evidence that the selected descriptors are invariant to resampling. Among the most frequently selected descriptors were the ionic radius at the emission center, excitation wavelength, activator valency, average ligand electronegativity, and ionization-energy-related descriptors. Their repeated identification across independent feature-selection strategies suggests that these variables contain potentially relevant physicochemical information for modeling emission wavelength [19,34,35,36]. Selection frequency alone cannot establish descriptor robustness under resampling, because a descriptor may be frequently selected across methods while remaining sensitive to the particular cross-validation fold or descriptor-number setting. Fold-level reproducibility and quantitative stability were therefore evaluated independently in the subsequent stability analysis presented in Section 3.3.
To further resolve the origin of the observed selection frequencies, the descriptors selected by the individual feature-selection strategies were examined separately for the RF- and GB-based feature-selection outputs. The resulting cross-method consensus matrices are presented in Figure 3. The matrices show which descriptors were selected by each of the twelve methods and therefore provide a more detailed view of the methodological support underlying the observed selection frequencies. The RF and GB matrices contain 33 and 36 unique descriptors, respectively, that were selected by at least one feature-selection method. These counts represent the union of method-selected descriptors displayed in the matrices. They do not constitute an additional dimensionality-reduction step from the original 46 descriptors. Instead, they indicate the breadth of descriptor participation in the cross-method selection stage before subsequent fold-level reproducibility, stability, performance, and compactness analyses. For both models, ionic_radius_emission_center exhibited complete cross-method consensus, being selected by all twelve feature-selection methods (12/12). Excitation source was selected by 8 of 12 methods, while 1st dopant valency was selected by 7 of 12 methods. Ionization Energy_sum and ionic_radius_substituted were each selected by five methods, whereas EN_ligand_avg and avg_d_electrons were selected by four methods. The matrices therefore show that a limited group of physically meaningful descriptors receives support from multiple independent selection strategies, although the degree of support differs among descriptors and methodological families.
The consensus frequencies shown in Figure 3 should not be interpreted as direct predictive importance or as evidence of fold-level reproducibility. Rather, they quantify the degree of agreement among the twelve feature-selection strategies. The final descriptor dimensionality was determined at a subsequent stage by jointly considering fold-level reproducibility, quantitative stability metrics, predictive performance, compactness, and physicochemical interpretability. Thus, the consensus analysis serves as an intermediate evidence layer supporting descriptor robustness, whereas the final compact descriptor subset is established only after the subsequent stability and performance analyses.
As shown in Figure 3, the consensus matrices provide a complementary perspective to the frequency analysis by explicitly identifying which algorithms selected each descriptor. The strongest cross-family agreement was observed for descriptors such as ionic_radius_emission_center, excitation source, and 1st dopant valency, which were selected by methods spanning the filter, wrapper, and embedded categories. Such agreement provides stronger evidence of cross-method relevance than repeated selection within only one methodological family. In contrast, descriptors supported by only a limited number of methods or concentrated within a single methodological family represent weaker consensus signals and therefore require additional validation before being considered robust model descriptors.
Another notable finding is that descriptor consensus depends not only on the frequency of selection but also on the diversity of feature-selection strategies supporting that selection. A descriptor identified by several statistically and algorithmically distinct approaches provides stronger evidence of cross-method relevance than a descriptor selected by only one methodological family. However, this cross-method agreement should not be equated with fold-level stability. The latter is quantified independently in Section 3.3 using complementary stability metrics calculated directly from the original fold-level descriptor subsets. Thus, Figure 2 and Figure 3 provide an intermediate evidence layer for descriptor consensus, whereas the subsequent stability and performance analyses determine which descriptors and descriptor numbers provide the most reliable final representation.
During the methodological development, several descriptor representations were systematically evaluated, beginning with elemental and physicochemical descriptors generated using matminer and pymatgen, followed by descriptor refinement and redundancy filtering. The initial 125 descriptors were subsequently refined by excluding non-informative, redundant, and mathematically engineered descriptors with limited direct physicochemical interpretability, yielding the final 46-descriptor physically meaningful candidate space. The subsequent feature-selection analyses were therefore performed exclusively within this refined and physically interpretable descriptor space. Similar conclusions have been reported in recent explainable materials informatics studies [35,36].
Mathematically engineered descriptors generated through arithmetic combinations of primary descriptors were also examined during the preliminary descriptor-refinement stage. They were excluded before the final feature-selection analysis because their direct physicochemical interpretation was limited. Consequently, the twelve feature-selection algorithms operated on the resulting 46-descriptor physically meaningful candidate space. All subsequent stability, performance, explainability, and physics-guided interpretation analyses were based on physically interpretable descriptors.
3.3. Stability Assessment of Feature Selection Algorithms
Although the cross-method analyses presented in Figure 2 and Figure 3 reveal recurring descriptor-selection patterns, cross-method consensus alone cannot objectively quantify the robustness of descriptor selection under resampling. Reliable machine-learning models require not only descriptors that are repeatedly identified by different algorithms, but also feature-selection procedures capable of producing reproducible descriptor subsets across independent cross-validation folds [37,38]. Therefore, descriptor stability was systematically evaluated within the 10-fold cross-validation framework for each feature-selection method and each candidate descriptor number.
For every cross-validation fold within the training set, feature selection was independently performed using the same dataset partitioning strategy, and the selected descriptor subset was recorded without applying any prior consensus filtering. The eight complementary stability metrics, including Jaccard, Dice, Hamming, Kuncheva, Spearman, Kendall, Pearson correlation coefficient, and Nogueira stability indices, were calculated directly from the original fold-level descriptor subsets. Because the selected subset size was fixed for each method and k, the binary representations used for Pearson, Spearman, and Kendall calculations contain the same membership information, making these metrics mathematically related and explaining their identical or nearly identical stability profiles. This procedure enables the intrinsic reproducibility of each feature-selection algorithm to be evaluated independently from the final descriptor-selection process and avoids artificially increasing stability values by evaluating only pre-selected consensus subsets.
The stability evaluation was performed across the complete range of candidate descriptor numbers, allowing the relationship between subset size and descriptor reproducibility to be systematically investigated. Here, k represents the number of descriptors selected from the 46-descriptor physically meaningful candidate space. The detailed stability-versus-k analyses for all twelve feature-selection algorithms are provided in Figure S6-S11, where the methods are grouped according to their underlying feature-selection strategies. These analyses demonstrate how descriptor reproducibility changes with increasing subset size and provide an objective assessment of the robustness of different feature-selection strategies. Notably, the stability-versus-k profiles reveal that descriptor reproducibility is strongly dependent on both the selection algorithm and subset size. Mutual Information maintains particularly high stability over a broad range of k values, whereas sequential search methods such as RFE, SFS, and SBS exhibit substantially stronger variations with increasing subset size (Figure S7 and Figure S10 and S11). Pearson correlation and ANOVA-F also show highly reproducible behavior for compact descriptor subsets, followed by a gradual decrease in stability as additional descriptors are introduced (Figure S6).
In parallel with the stability analysis, the influence of descriptor number on predictive performance was investigated using the optimized RF model. Figure 4 summarizes the variation of R2, MAE, and RMSE as a function of the number of selected descriptors for all twelve feature-selection methods. The stars indicate the performance-selected optimal k values for each feature-selection algorithm. The corresponding optimal-k values, predictive performance parameters, and fold-level reproducibility indicators obtained for the Random Forest models are summarized in Table S2. In general, the predictive performance improves rapidly when increasing the number of descriptors from very small subsets and gradually approaches a plateau, indicating that most of the relevant physicochemical information is captured within a limited descriptor space. The quantitative results summarized in Table S2 further confirm that comparable RF predictive performance can be achieved using substantially different descriptor-set sizes, while their fold-level reproducibility may differ considerably. This observation emphasizes that the numerically highest predictive score alone is insufficient for defining the most reliable descriptor subset and supports the combined consideration of predictive accuracy, stability, and descriptor compactness. Because the same 10-fold training-set framework was used to compare descriptor numbers and select the preferred k, these cross-validated values should be interpreted as model-selection estimates rather than unbiased estimates of external generalization performance.
The optimal descriptor number varies among feature-selection algorithms, demonstrating that a universal descriptor number cannot be assumed for all selection strategies. While some methods achieve their highest numerical performance using relatively larger subsets, several compact subsets provide comparable predictive accuracy with substantially fewer descriptors. Descriptor selection was considered as a multi-objective optimization problem involving predictive accuracy, descriptor selection was considered as a multi-objective optimization problem instead of relying solely on the maximum predictive score. To further examine whether the observed descriptor optimization behavior depends on the selected machine-learning algorithm, the same performance-versus-k analysis was independently performed using the GB model. Similar to RF, the GB models generally exhibited a rapid improvement in predictive performance at small descriptor numbers followed by a gradual plateau at larger subset sizes (Figure S12). At the performance-selected optima, the GB models achieved relatively similar predictive accuracies (R2 ≈ 0.900-0.907) despite differences in the selected subset size and fold-level reproducibility (Table S3). These results shows that the general trade-off between predictive performance, descriptor number, and selection stability is not specific to RF, although the RF models provide the stronger predictive basis for the subsequent descriptor interpretation.
Among the evaluated feature-selection approaches, filter-based methods generally exhibited favorable descriptor reproducibility, although their stability remained dependent on the selected subset size. Mutual Information was particularly robust across a broad range of k values, while Pearson correlation and ANOVA-F showed very high reproducibility for compact subsets followed by a gradual reduction as additional descriptors were introduced (Figure S6 and Figure S7). In contrast, sequential wrapper approaches showed greater dependence on the specific composition of the training data and subset size, leading to larger variations in the selected descriptor subsets across different folds (Figure S10 and Figure S11). Embedded and model-based approaches generally demonstrated intermediate behavior (Figure S8 and Figure S9), reflecting a balance between model-dependent optimization and descriptor stability [39,40,41,42].
The agreement observed among different stability metrics further supports the reliability of the stability evaluation. Although the mathematical formulations of the eight indices differ, they reveal similar trends in descriptor reproducibility, indicating that the observed differences among feature-selection algorithms are not associated with a single metric but represent intrinsic variations in selection robustness. Combining multiple complementary stability measures provides a more comprehensive evaluation of feature-selection reliability compared with using an individual stability indicator.
Following the independent stability assessment, descriptor subsets with complete agreement across all ten cross-validation folds (10/10 occurrence frequency) were identified as fully reproducible candidates. The performance characteristics of the fully reproducible subsets retained for each feature-selection method are summarized separately for RF and GB in Table S4 and Table S5, respectively. These fully reproducible subsets were not used for calculating the stability metrics but were considered as an additional criterion for selecting the final descriptor sets used for model interpretation. When multiple fully reproducible subsets were available for a given feature-selection method, the final subset was selected by considering predictive performance (R2, MAE, and RMSE), descriptor compactness, and physical interpretability simultaneously. This combined strategy ensures that the final descriptor subsets represent a balance between predictive capability, statistical reproducibility, and meaningful physicochemical interpretation. The selected descriptors therefore provide a more reliable foundation for subsequent machine-learning analysis and explainable model interpretation. Additional analyses obtained during the preliminary descriptor-selection stage and validation on an independent dataset from previous studies are provided in Figure S2 and Figure S3, respectively.
3.4. Machine Learning Performance
The performance-versus-k analysis presented in Figure 4, together with the corresponding optimal-subset statistics summarized in Table S2, shows that several descriptor subsets provide very similar RF performance despite substantial differences in subset size and fold-level reproducibility. Table S2 also reveals that several larger descriptor subsets provide only marginal improvements compared with compact solutions, supporting the use of descriptor compactness as an additional optimization criterion. Selection of the final RF model was therefore treated as a selection problem involving predictive accuracy, descriptor reproducibility, compactness, and physical interpretability. Within the 46-descriptor physically meaningful candidate space, this multi-objective criterion prevented descriptor-rich representations from being favored solely because of marginal numerical improvements. Particularly notable behavior was observed for Pearson correlation and ANOVA-F. Pearson correlation and ANOVA-F identified the same compact seven-descriptor subset at k = 7, with identical selection across all ten cross-validation folds (10/10 reproducibility). As summarized in Table 6, this compact RF model achieved a mean 10-fold cross-validated R2 = 0.9308, MAE = 7.78 nm, and RMSE = 22.55 nm, demonstrating that a highly compact and fully reproducible descriptor representation retains nearly all of the predictive information available in substantially larger subsets. Relative to the full 46-descriptor physically meaningful candidate space, the final seven-descriptor representation corresponds to an approximately 86% reduction in descriptor dimensionality.
To quantify the uncertainty of the observed difference between the seven- and 24-descriptor models, we estimated 95% confidence intervals for the differences in cross-validated performance using bootstrap resampling of the paired out-of-fold predictions (1000 iterations). The 95% CI for ΔR2 (24-descriptor model minus seven-descriptor model) was [-0.0067, 0.0035]. The corresponding intervals for MAE and RMSE were [-0.33, 0.40] nm and [-0.64, 1.25] nm, respectively. Since all three intervals contain zero, the differences are not statistically significant at the 5% level. This supports the interpretation that the compact seven-descriptor model provides predictive performance comparable to that of the larger 24-descriptor model. The direct comparison in Table 6 further clarifies why the seven-descriptor model was preferred over the numerically best larger subsets. The highest mean cross-validated R2 in the RF all-k analysis was obtained using the T-test subset at k = 20 (R2 = 0.9345, MAE = 7.80 nm, and RMSE = 21.80 nm). However, this subset did not satisfy the 10/10 fold-level reproducibility criterion. The best larger fully reproducible T-test subset was obtained at k = 24, with mean cross-validated R2= 0.9339, MAE = 7.77 nm, and RMSE = 21.81 nm. Relative to this 24-descriptor model, the seven-descriptor Pearson/ANOVA-F model decreases R2 by 0.003 (absolute), corresponding to a relative reduction of less than 0.5%. In contrast, the descriptor dimensionality is reduced from 24 to 7, corresponding to a reduction of approximately 71%. Thus, the small numerical gain obtained with the larger subset does not provide sufficient predictive improvement to justify the substantially larger descriptor representation within the present selection framework. The combination of near-equivalent predictive accuracy, complete fold-level reproducibility, and consistent identification of the same seven descriptors by Pearson correlation and ANOVA-F provides a stronger basis for subsequent physical interpretation. Fold-level inspection further confirmed that the same seven-descriptor set was selected in all ten folds using both criteria (Table S6).
To determine whether the observed performance-subset-size relationship was specific to RF, the complete performance-versus-k analysis was independently repeated using GB. As shown in Figure S12, the GB models exhibited a broadly similar trend to RF, with rapid improvements at relatively small descriptor numbers followed by a gradual performance plateau as additional descriptors were introduced. The quantitative optimal-k results are summarized in Table S3. Across the feature-selection strategies, the performance-selected GB models generally reached R2 values of approximately 0.900-0.907, whereas their fold-level reproducibility differed more substantially among the individual methods (Table S3). When restricted to fully reproducible subsets, Mutual Information provided the highest predictive performance among the GB candidates, achieving a mean cross-validated R2 = 0.906, MAE = 15.48 nm, and RMSE = 26.76 nm with 30 descriptors and complete 10/10 reproducibility (Table S5). Other fully reproducible GB subsets showed lower predictive performance despite satisfying the same reproducibility criterion. The combined results of Figure S12 and Table S3 therefore show that the trade-off among predictive accuracy, descriptor number, and reproducibility is not unique to RF. Comparison with the RF results in Figure 4 and Table S2 shows that RF generally provides the stronger predictive performance, supporting its selection as the principal model for subsequent explainability and physics-guided interpretation.
The cross-model comparison of feature-selection strategies is provided in Figure S13 and Figure S14. For RF, the best-performing T-test subset achieved R2 = 0.934, whereas the compact Pearson/ANOVA-F model maintained comparable accuracy (R2 = 0.931) with only seven descriptors (Table 6). For GB, Mutual Information achieved the highest predictive performance (R2 = 0.906, MAE = 15.48 nm, RMSE = 26.76 nm), confirming the consistency of the feature-selection evaluation across different ensemble models (Figure S14). Additional prediction diagnostics based on pooled 10-fold cross-validation out-of-fold predictions for the optimized RF and GB models are provided in Figure S4. The RF, GB, and ANN comparisons indicate that for the present dataset and evaluated model configurations, the ensemble tree-based models provided stronger predictive and generalization performance than the tested neural-network architecture. More importantly, the RF results reveal that near-optimal predictive performance can be retained using a substantially reduced and fully reproducible descriptor subset. Considering the performance-versus-k behavior in Figure 4, the complete RF statistics in Table S2, the direct compact-versus-best comparison in Table 6, and the corresponding GB analyses in Table S3 and Figure S12–S14, the seven-descriptor RF model consistently identified by Pearson correlation and ANOVA-F was selected as the primary model for subsequent explainable machine-learning analysis. The superior performance of RF and GB therefore suggests that ensemble tree-based algorithms are better suited for modeling the complex nonlinear relationships between physicochemical descriptors and emission wavelength in inorganic phosphors. This behavior is physically reasonable because the emission wavelength of inorganic phosphors is governed by highly nonlinear interactions among host composition, activator electronic configuration, crystal-field environment, and local bonding characteristics. Ensemble tree-based models naturally capture these complex descriptor interactions without imposing a predefined linear functional form, making them suitable for representing nonlinear relationships within the present heterogeneous physicochemical descriptor space.
The comparison among the three machine-learning algorithms indicates that the proposed consensus-based feature-selection framework produces stable descriptor subsets capable of supporting highly accurate predictive models. Among the evaluated algorithms, RF consistently provides the best balance between predictive accuracy, robustness, and independent-test performance. The superior performance of ensemble tree-based models for heterogeneous tabular materials datasets has also been reported in recent materials-informatics studies [43,44,45]. RF was selected as the primary model for the subsequent explainable machine-learning analysis because it provides the best overall balance between predictive accuracy, robustness against heterogeneous descriptor distributions, resistance to overfitting, and compatibility with explainable machine-learning techniques. SHAP was subsequently employed to quantify the individual contributions of the selected descriptors to emission wavelength prediction. Additional prediction diagnostics based on 10-fold cross-validation out-of-fold predictions are provided in Figure S4, which shows the predicted versus actual relationships and residual analyses for the optimized RF and GB models. The pooled out-of-fold predictions yielded R2 values of 0.9351 for RF and 0.8912 for GB, with residual standard deviations of 22.89 nm and 29.63 nm, respectively (Figure S4).
The predictive performance of the selected compact RF model is competitive with previously reported machine-learning approaches for inorganic phosphors [8,9,10,11,12,13,14,15,16,17,18]. The present framework achieves this performance with only seven fully reproducible descriptors, combining high predictive accuracy with descriptor reduction and enhanced interpretability. The major advantage of the proposed strategy is the simultaneous optimization of accuracy, reproducibility, and physical interpretability rather than predictive performance alone.
Beyond overall predictive accuracy, it is important to determine whether model reliability remains uniform across the experimentally relevant emission-wavelength range. Therefore, the prediction errors of the optimized RF and GB models were further analyzed within different spectral regions (Figure 5).
As shown in Figure 5, prediction errors are not uniformly distributed across the emission spectrum. The lowest MAE values are generally obtained in the more densely represented spectral regions, whereas larger deviations occur toward sparsely populated wavelength intervals. The larger deviations observed in sparsely represented spectral regions may partly reflect the limited sample availability and greater chemical heterogeneity in these intervals. The regional error analysis should be interpreted together with the unequal number of samples across wavelength intervals. The similar spectral dependence observed for RF and GB further suggests that this behavior is primarily associated with the underlying data distribution. Expansion of the phosphor dataset in underrepresented spectral regions should be an important direction for improving the generalizability of future wavelength-prediction models. To further assess the data-efficiency and generalization behavior of the optimized seven-descriptor RF model, learning curves were constructed using only the training partition, with the independent test set excluded from this analysis (Figure S15). The training R2 remained high across the examined training-set sizes, whereas the validation R2 increased rapidly at smaller sample sizes and gradually approached a plateau at larger training sizes. A similar convergence was observed for MAE, with validation error decreasing progressively as the training-set size increased. At the largest evaluated training size, the gap between the training and validation curves remained relatively moderate. These trends provide no clear evidence of substantial overfitting and indicate that the model approaches a performance plateau within the available training data. Expansion of the phosphor dataset in underrepresented spectral regions should be an important direction for improving the generalizability of future wavelength-prediction models.
From a physicochemical perspective, the observed variation in prediction accuracy reflects the intrinsic complexity of luminescence mechanisms operating in different spectral regions. Emission wavelength is governed by the combined influence of crystal-field splitting, activator electronic configuration, local coordination environment, and host-dopant interactions. Regions populated by chemically diverse phosphor families or underrepresented activator-host combinations naturally exhibit larger variability, making accurate prediction more challenging. Nevertheless, the consistently low prediction errors across most emission regions demonstrate that the proposed explainable machine-learning framework provides consistent predictive performance across the represented spectral regions for chemically diverse inorganic phosphors.
The generally lower prediction errors across the more densely represented visible-spectrum regions suggest that the identified descriptor hierarchy captures important physicochemical factors governing the observed luminescence response. This descriptor hierarchy forms the basis for the physics-guided interpretation presented in the following sections.
3.5. Explainable ML and Descriptor Contribution Analysis
Although the RF model achieved the highest predictive performance among the evaluated machine-learning approaches, identifying the physicochemical basis underlying its predictions is essential for extracting scientifically meaningful knowledge. Based on the combined criteria of predictive accuracy, descriptor reproducibility, compactness, and physical interpretability established in Section 3.4, the optimized seven-descriptor RF model was selected as the final model for explainable analysis. SHAP analysis was subsequently employed to quantify the contribution of individual descriptors to model predictions and to reveal the physicochemical factors strongly influencing emission-wavelength prediction. Unlike conventional feature-importance measures, SHAP provides a theoretically consistent framework for decomposing model predictions into additive contributions from individual descriptors, thereby enabling transparent interpretation of complex nonlinear relationships [46,47]. The global SHAP feature importance and summary analyses for the optimized RF model are presented in Figure 6.
Figure 6a reveals a highly non-uniform distribution of descriptor importance, demonstrating that the optimized RF model relies predominantly on a limited number of scientifically interpretable variables. Among the seven descriptors in the optimized RF model, ionic_radius_emission_center overwhelmingly dominates the prediction process, exhibiting a mean absolute SHAP value several times larger than that of any other descriptor. This descriptor was also consistently identified among the most stable descriptors by independent feature-selection approaches (Section 3.2 and Section 3.3), indicating that its dominant SHAP contribution is supported by both predictive interpretation and descriptor reproducibility analysis. This result indicates that the ionic radius at the emission center represents the dominant predictive descriptor associated with the predicted emission wavelength of inorganic phosphors. The remaining descriptors, including excitation wavelength, first dopant valency, substituted ionic radius, average number of d-electrons, ligand electronegativity, and ionization-energy-related descriptors, contribute progressively smaller yet complementary information, indicating that the emission wavelength is controlled by a combination of structural and electronic characteristics rather than by a single variable alone. These seven descriptors constitute the compact Pearson/ANOVA-F RF subset selected in Section 3.4, which achieved a mean 10-fold cross-validated R2 = 0.931, MAE = 7.78 nm, and RMSE = 22.55 nm while maintaining complete 10/10 fold-level reproducibility. Thus, the SHAP analysis provides a direct physical interpretation of the same compact and reproducible descriptor representation identified through the preceding feature-selection and model-performance analyses. Figure 6b complements the global importance analysis by illustrating the distribution and direction of SHAP values for every sample. Unlike the global importance ranking presented in Figure 6a, the SHAP summary plot in Figure 6b simultaneously visualizes descriptor importance, feature-value distributions, and the magnitude and direction of their contributions to the predicted emission wavelength. The broad spread of SHAP values associated with ionic_radius_emission_center confirms that variations in ionic radius produce the largest changes in model predictions, whereas descriptors such as excitation wavelength and first dopant valency exert smaller but still significant effects. Furthermore, the asymmetric distribution of SHAP values demonstrates that several descriptors influence the prediction in a distinctly nonlinear manner, reflecting complex interactions between atomic size, local coordination environment, and electronic structure. These observations indicate that the optimized RF model successfully captures nonlinear physicochemical relationships that cannot be adequately described using conventional linear statistical analyses. Similar nonlinear descriptor interactions have been reported in recent explainable machine-learning studies for materials discovery [35,36].
From a physicochemical perspective, the dominant contribution of the ionic radius at the emission center is fully consistent with the established understanding of luminescent materials. Variations in the ionic radius modify the local coordination geometry, bond lengths, lattice distortion, and crystal-field strength surrounding the luminescent activator, thereby influencing the electronic energy-level splitting responsible for radiative transitions [48,49,50]. Likewise, the significant contributions of excitation wavelength, activator valency, ligand electronegativity, and ionization-energy-related descriptors indicate that emission behavior is influenced by the combined effects of local crystal chemistry and the electronic environment of the host lattice. The agreement between SHAP-based interpretation and descriptor-selection analysis demonstrates that the machine-learning model relies on descriptors that are both statistically reproducible and physically meaningful. The presence of both structural and electronic descriptors among the highest-ranked SHAP features therefore demonstrates that the RF model has learned physically consistent relationships rather than merely statistical correlations [35,51].
A further observation is the remarkable consistency between the SHAP analysis and the preceding feature-selection results. Most of the descriptors identified as highly influential by SHAP, including ionic_radius_emission_center, excitation wavelength, first dopant valency, and ligand-related descriptors, were also consistently selected by multiple independent feature-selection algorithms and exhibited high consensus and stability in Section 3.2 and Section 3.3. This agreement provides additional support that the optimized machine-learning model relies on robust and reproducible physicochemical descriptors rather than algorithm-specific variables, increasing confidence in both the predictive performance and interpretability of the integrated approach [36].
To further verify whether the dominant SHAP contribution translates into measurable predictive dependence, model-specific descriptor-ablation analysis was performed for both RF and GB models using the same 10-fold cross-validation framework (Figure 7). The importance of the emission-center ionic radius is not restricted to the SHAP attribution of a single model but is independently supported by the substantial loss of predictive accuracy observed upon its removal from two different ensemble-learning architectures [52,53]. Removal of this single descriptor increased the RF MAE and RMSE by approximately 65% and 43%, respectively, despite retaining the remaining six descriptors.
The ablation results in Figure 7 provide a complementary validation of the SHAP-based feature importance identified in Figure 6. In the SHAP analysis, ionic_radius_emission_center exhibits by far the largest mean absolute SHAP value among the seven descriptors (Figure 6a) and shows the broadest impact on the RF model output (Figure 6b), identifying it as the dominant descriptor associated with the model prediction. Consistent with this interpretation, removal of ionic_radius_emission_center caused a substantial deterioration in RF predictions (Figure 7a,b). R2 decreased from 0.931 to 0.862, while MAE increased from 7.8 to 12.9 nm and RMSE from 22.5 to 32.1 nm. A similar degradation was observed for GB (Figure 7c,d), where removal of the same descriptor decreased R2 from 0.887 to 0.745 and increased MAE from 17.8 to 29.5 nm and RMSE from 29.6 to 44.4 nm. The agreement between global SHAP attribution and model-specific ablation therefore provides complementary evidence that the ionic radius of the emission center represents a central physicochemical descriptor associated with the learned emission-wavelength relationships. The same qualitative response is recovered with GB using the identical seven-descriptor representation, indicating that this dependence is not specific to the RF architecture but is consistently captured across the two ensemble-learning models. From a solid-state physics perspective, this behavior is expected because the ionic radius of the emission center influences the local crystal environment surrounding the luminescent activator. Variations in ionic size modify interatomic distances, coordination geometry, lattice distortion, and crystal-field strength, influencing the splitting of electronic energy levels responsible for radiative transitions. Removing this descriptor prevents the models from directly representing an important aspect of the local structural environment, requiring its effect to be approximated through correlated or secondary descriptors. The consistent degradation observed for both RF and GB demonstrates that ionic_radius_emission_center is not only the most statistically influential descriptor identified by SHAP but also a central predictive descriptor for emission-wavelength variation in inorganic phosphors.
Because several descriptors in the compact model encode related aspects of dopant chemistry and the local structural environment, their pairwise relationships were additionally examined using Pearson and Spearman correlation analyses (Figure S16). The strongest association was observed between ionic_radius_emission_center and 1st dopant valency, with Pearson r = -0.94 and Spearman ρ = - 0.82. Moderate-to-strong correlations were also found between ionic_radius_emission_center and ionic_radius_substituted (r = 0.69, ρ = 0.61) and between 1st dopant valency and ionic_radius_substituted (r = -0.67, ρ = -0.64). In contrast, most remaining descriptor pairs exhibit substantially weaker correlations. These relationships are physically plausible because dopant valency and ionic size are chemically coupled to the local coordination and charge environment. Pairwise correlation does not by itself establish predictive redundancy. Pearson correlation and ANOVA-F were treated here as two closely related univariate criteria for descriptor ranking rather than as independent sources of confirmation, because for univariate linear association the ANOVA-F statistic is mathematically equivalent to the squared Pearson correlation coefficient. Both criteria therefore produced the same seven-descriptor subset with complete 10/10 fold-level reproducibility. The SHAP and ablation analyses in Figure 7 provide evidence for the substantial predictive contribution of the emission-center ionic radius.
To further assess whether the strong correlation between ionic_radius_emission_center and first_dopant_valency (r = -0.94, Figure S16) implies predictive redundancy, we performed an additional six-descriptor ablation by removing first_dopant_valency while retaining the other six descriptors (Figure S17). For the RF model, removal of this descriptor resulted in a negligible change in performance, with R2 decreasing from 0.931 to 0.930, MAE remaining at 7.8 nm, and RMSE increasing marginally from 22.5 to 22.6 nm. For the GB model, the effect was similarly minimal, with R2 changing from 0.887 to 0.888, MAE staying at 17.8 nm, and RMSE decreasing slightly from 29.6 to 29.4 nm. These results indicate that much of the predictive information associated with first_dopant_valency is already captured by the strongly coupled ionic_radius_emission_center descriptor. Nevertheless, first_dopant_valency was retained in the final representation because it was selected consistently by the descriptor-selection procedure and provides complementary physicochemical interpretability for activator-site chemistry, while its pairwise correlation with ionic_radius_emission_center (|r| = 0.94) remained below the predefined redundancy-removal threshold of |r| > 0.95 (Section 2.2).
We next examined the model-learned interactions among the selected descriptors using SHAP interaction analysis for both RF and GB with the same final seven-descriptor representation. This allowed the interaction patterns to be compared without confounding effects arising from different descriptor dimensionalities. The resulting interaction matrices are presented in Figure 8. The diagonal elements represent the main effects of individual descriptors, whereas the off-diagonal elements quantify pairwise interactions between descriptors.
Beyond individual descriptor importance, SHAP interaction analysis provides additional insight into possible cooperative effects among physicochemical variables. As shown in Figure 8, both RF and GB models identify ionic_radius_emission_center (activator ionic radius) as the dominant contributor, with the largest main SHAP effect values of 57.3 and 56.1 nm, respectively. The excitation source (λex) also exhibits strong contributions and interactions with the emission-center ionic radius (18.1 nm for RF and 16.1 nm for GB), indicating that activator-site environment and excitation conditions jointly influence the predicted emission wavelength. These interaction patterns were consistently learned by both RF and GB, suggesting that they are not specific to a single model formulation. These model-based interactions should nevertheless be interpreted as learned statistical relationships rather than direct evidence of causality. To further assess whether the identified descriptor hierarchy is robust to the choice of feature-importance methodology, four complementary approaches, built-in impurity importance, permutation importance, mean absolute SHAP values, and drop-column ΔR2, were systematically compared for the optimized RF model and the GB model evaluated using the same seven-descriptor representation. The normalized importance distributions are presented in Figure 9.
As shown in Figure 9, all four approaches consistently identify ionic_radius_emission_center (activator ionic radius) as the dominant descriptor, followed by excitation wavelength, while the remaining descriptors provide smaller contributions with some variation in their relative ranking. The two leading descriptors (ionic_radius_emission_center and excitation wavelength) were consistently ranked highest by all four interpretation methods and both ensemble-learning architectures. Such cross-method consistency is particularly important for explainable machine learning because feature-importance rankings derived from a single interpretation technique may be affected by method-specific assumptions and biases [47]. Four fundamentally different explainability approaches produced the same descriptor hierarchy. This indicates that the extracted physicochemical relationships are robust patterns within the phosphor dataset rather than artifacts of a particular interpretation method.
For both RF and GB models, ionic_radius_emission_center consistently exhibited the highest normalized importance across all four explainability approaches. In the RF model, its normalized importance ranged from 0.63 to 0.78 depending on the interpretation method, while the corresponding values for the GB model ranged from approximately 0.63 to 0.82. The excitation wavelength represented the second most influential descriptor, whereas first dopant valency, ionization-energy-related descriptors, and ligand-related descriptors provided smaller but consistently detectable contributions. The same descriptor hierarchy was obtained with RF and GB, confirming that it is not specific to a particular ensemble architecture.
From a materials science perspective, this convergence is significant because it indicates that the optimized machine-learning models have identified physicochemically interpretable descriptors associated with the observed emission response rather than algorithm-dependent statistical artifacts [35,36]. The dominant importance of ionic_radius_emission_center reflects the fundamental role of ionic size in influencing local crystal-field strength, coordination geometry, bond-length distribution, and lattice distortion surrounding the luminescent activator. These structural modifications directly influence the splitting of activator electronic energy levels and consequently the wavelength of radiative transitions. The consistently high importance of the excitation wavelength further highlights the contribution of excitation pathways to emission processes, while the smaller yet persistent influence of dopant valency and ionization-energy-related descriptor demonstrates that electronic configuration and charge-transfer characteristics provide complementary information required for accurate wavelength prediction. Because these structural factors simultaneously influence crystal-field splitting, local symmetry, and host-activator interactions, their combined effect ultimately influences the emission energy and corresponding wavelength.
Figure 6, Figure 7, Figure 8 and Figure 9 provide four complementary levels of validation for descriptor interpretation. SHAP analysis (Figure 6) identifies the relative contribution and direction of individual descriptors; descriptor ablation (Figure 7) verifies the predictive necessity of the dominant descriptor. SHAP interaction analysis (Figure 8) reveals model-learned interactions among the selected descriptors and the agreement among four independent feature-importance approaches (Figure 9) demonstrates that the descriptor hierarchy is robust to the choice of interpretation method. The convergence of these analyses substantially strengthens the reliability, physical interpretability, and scientific credibility of the proposed explainable machine-learning framework [35,36]. The global interaction matrices are presented in Figure 8, whereas the two strongest pairwise interactions are examined in greater detail using SHAP dependence plots in Figure S5. Consistent with Figure 8, the interaction between ionic_radius_emission_center and excitation source is the strongest, followed by the interaction between ionic_radius_emission_center and 1st dopant valency. The dependence plots further reveal nonlinear conditional effects learned by both RF and GB.
The agreement among SHAP analysis, descriptor ablation, SHAP interaction analysis, and complementary feature-importance methods indicates that the identified descriptor hierarchy is reproducible across different interpretation strategies. This consistency provides confidence that the dominant variables reflect reproducible model-informed relationships that are consistent with established physicochemical considerations. The same descriptor hierarchy was obtained when RF and GB models were interpreted using the identical seven-descriptor representation, further demonstrating that the identified physicochemical relationships are independent of the selected ensemble-learning architecture. These seven descriptors were not selected solely because of their predictive contribution within the RF model. They represent the intersection of descriptor stability, model performance, and physicochemical interpretability identified from the original 46-descriptor physically meaningful candidate space. The following section interprets these descriptors within the framework of solid-state physics and materials chemistry to derive physics-guided design principles for inorganic phosphors.
3.6. Physicochemical Interpretation of the Dominant Descriptors
The preceding analyses establish that the final seven-descriptor representation is not selected solely because of its numerical predictive performance. Its scientific relevance is supported by the consistent identification of the same descriptor subset using two closely related univariate ranking criteria, complete fold-level reproducibility, compact descriptor dimensionality, and consistent interpretation across multiple explainability approaches. The final seven-variable representation comprised six material-related descriptors (ionic_radius_emission_center, ionic_radius_substituted, 1st dopant valency, avg_d_electrons, EN_ligand_avg, and ionization_energy_sum) together with the excitation-source variable, which reflects an experimentally defined measurement condition rather than an intrinsic material property. Together, these six material descriptors span complementary aspects of local structure, electronic configuration, and chemical bonding.
Ionic Radius, Structural Compatibility, and Crystal-Field Effects. Among the seven descriptors, ionic_radius_emission_center (activator ionic radius) exhibits by far the strongest contribution across the SHAP, ablation, interaction, and complementary feature-importance analyses. This result is physically consistent with the importance of activator-site geometry in influencing the local environment of a luminescent center. The ionic radius controls the geometric compatibility between the activator and the substituted crystallographic site, affecting coordination geometry, bond lengths, local strain, and crystal-field strength [48,49,54,55]. A closer size match can reduce structural distortion, whereas a pronounced mismatch may modify local symmetry and introduce strain fields around the activator. These structural changes influence the splitting and relative positions of the electronic states involved in radiative transitions. The strong SHAP contribution and the substantial degradation observed after removing ionic_radius_emission_center therefore provide evidence that this descriptor is a central predictive variable in the learned emission-wavelength relationships
Excitation-Emission Coupling. The excitation source (λex) represents the second most influential descriptor in the optimized models and also forms the strongest pairwise interaction with ionic_radius_emission_center in the SHAP interaction analysis. Although emission wavelength is commonly treated as a material-specific property, the measured emission response depends on how the material is excited because different excitation energies can populate different absorption, energy-transfer, charge-transfer, or activator-centered pathways. The strong contribution of excitation source therefore indicates that the model captures an experimentally relevant relationship between the material's physicochemical characteristics and the excitation pathway. This result does not imply that excitation wavelength is an intrinsic material property. Instead, it reflects that excitation conditions are an important experimental variable for predicting the observed emission response within the compiled phosphor dataset.
Dopant Valency, Electronic Configuration and Defect Chemistry. The 1st dopant valency provides complementary information to ionic size by describing the electronic and charge state of the activator. Oxidation state influences orbital occupancy, electronic configuration, charge compensation, and the local electrostatic environment surrounding the luminescent center [55,56,57,58,59,60]. For rare-earth and transition-metal activators, changes in oxidation state can substantially modify the accessible electronic transitions and their sensitivity to the host environment. The retention of dopant valency in the seven-descriptor model reflects its complementary physicochemical relevance to activator electronic configuration and oxidation state, although its ablation indicates only a negligible incremental predictive contribution beyond the ionic-radius descriptor in the present dataset.
Chemical Bonding and Electronic Environment. The remaining descriptors, including EN_ligand_avg, ionization_energy_sum, avg_d_electrons, and ionic_radius_substituted, provide complementary information about the chemical and electronic environment of the luminescent center. Ligand electronegativity influences electron-density distribution and the balance between ionic and covalent bonding [61,62,63,64], while ionization-energy-related descriptors characterize the energetic tendency for electronic redistribution. The average number of d-electrons provides information related to electronic configuration and orbital occupancy, whereas ionic_radius_substituted contributes additional information on the structural environment of the substituted site. These descriptors are individually less influential than ionic_radius_emission_center but collectively help encode the chemical environment [61,62,63,64] required for accurate wavelength prediction.
Interconnected Physicochemical Network. The seven input variables should not be interpreted as independent control parameters. Their physical effects are coupled through the local structure, electronic configuration, bonding environment, and excitation pathway. This coupling is supported by both the descriptor-correlation analysis and the SHAP interaction analysis. Figure S16 shows a particularly strong statistical association between ionic_radius_emission_center and 1st dopant valency, while Figure 8 identifies the largest SHAP interaction involving ionic_radius_emission_center and excitation source. The detailed dependence plots in Figure S5 further resolve these two interactions for both RF and GB models. In particular, the interaction between ionic_radius_emission_center and excitation source exhibits the largest variation in SHAP interaction contribution, whereas the interaction with 1st dopant valency also shows systematic nonlinear behavior across the descriptor range. The changes in interaction magnitude and direction indicate that the contribution of ionic size to the model prediction depends on the excitation condition and dopant valency rather than acting as a purely independent additive effect [65,66,67,68,69]. These model-based interactions are consistent with the coupled roles of local crystal-field environment, activator electronic structure, and excitation pathways in phosphor emission.
Taken together, these results indicate that the machine-learning model captures a hierarchical but interconnected descriptor space in which structural compatibility provides the dominant contribution, while excitation conditions, activator valency, and chemical-bonding descriptors supply complementary information. The interaction analysis should be interpreted as evidence of nonlinear relationships learned by the models rather than as a direct proof of causality. Nevertheless, the convergence of feature selection, stability analysis, SHAP attribution, ablation, interaction analysis, and cross-method importance provides strong support for using these descriptors as physically meaningful variables for wavelength-oriented phosphor design.
The seven selected variables should be viewed as a coupled predictive representation rather than as seven independent optimization knobs. The strong correlation between ionic_radius_emission_center and dopant valency and the nonlinear SHAP interactions involving excitation source indicate that modifying one variable may alter the predictive relevance of others. Consequently, the design guidelines below are intended as sequential screening principles rather than isolated one-variable optimization rules.
3.7. Physics-Guided Design Guidelines for Inorganic Phosphors
The combined results provide a direct route from statistically robust descriptor selection to physics-guided wavelength engineering. Importantly, the proposed design strategy is not based solely on the descriptor with the highest numerical importance. Instead, it is built on a compact seven-descriptor representation that simultaneously satisfies predictive accuracy, fold-level reproducibility, compactness, and physical interpretability. The consistent identification of the same seven descriptors by Pearson correlation and ANOVA-F, together with the agreement among SHAP, ablation, interaction, and complementary feature-importance analyses, provides a consistent basis for translating the learned descriptor hierarchy into practical materials-design considerations. This workflow is summarized schematically in Figure 10.
Based on the seven-descriptor hierarchy established in the preceding sections, the following physics-guided design guidelines can be formulated and should be interpreted as model-informed screening principles rather than deterministic synthesis rules:
Design Rule 1 (Activator-site compatibility). Match the activator ionic radius to the crystallographic site and coordination environment. The descriptor ionic_radius_emission_center was consistently identified as the most influential variable across all explainability analyses. Host sites should therefore be selected to provide a structurally appropriate coordination environment for the chosen activator. Excessive ionic-size mismatch may increase local lattice distortion and modify crystal-field strength, potentially shifting the emission wavelength and introducing unfavorable defect or relaxation pathways [48,55,70].
Design Rule 2 (Oxidation and electronic state). Consider dopant valency and electronic configuration jointly with site compatibility. The 1st dopant valency contributes to the learned emission-wavelength relationship in addition to ionic radius. Candidate activators should therefore be evaluated jointly in terms of ionic size and oxidation state. Activator valency determines the electronic configuration and influences charge compensation and local electrostatics, providing a complementary route for tuning the electronic states responsible for luminescence [55,58]. The SHAP interaction analysis further indicates a non-negligible interaction between ionic_radius_emission_center and 1st dopant valency, supporting the interpretation that structural and electronic characteristics of the activator should not be treated as completely independent design variables.
Design Rule 3 (Host chemical environment). Tune ligand electronegativity, substituted-site characteristics, and ionization-related chemistry. After identifying structurally and electronically compatible activators, host-lattice chemistry should be optimized using descriptors associated with EN_ligand_avg, ionization-energy-related characteristics, ionic_radius_substituted, and avg_d_electrons. These descriptors collectively characterize the chemical environment surrounding the emission center and can help distinguish host materials that provide similar structural compatibility but different bonding and electronic conditions. Host selection should therefore consider not only geometric site matching but also the chemical environment required to establish the desired electronic-level structure and crystal-field environment [65,71,72]. Host-lattice engineering should be regarded as an active optimization variable rather than merely as a structural matrix accommodating the activator ion.
Design Rule 4 (Excitation condition). Optimize excitation wavelength together with material-related descriptors instead of treating excitation as independent of emission behavior. Its relatively high importance in the explainability analysis and its pronounced interaction with ionic_radius_emission_center indicate that the predicted emission response depends not only on intrinsic material descriptors but also on the relationship between the activator-site environment and the excitation pathway. The inclusion of excitation source should therefore be interpreted as modeling the experimentally observed emission response under specific excitation conditions, rather than as identifying excitation wavelength as an intrinsic material property. This interaction is particularly evident in the SHAP interaction analysis, where the ionic-radius/excitation-source pair represents one of the strongest off-diagonal contributions for both RF and GB models. Accordingly, excitation conditions should be selected with consideration of the absorption characteristics of the phosphor and the intended excitation source. In practical applications, matching the excitation spectrum of the phosphor with commercially relevant LED or laser excitation sources can improve optical utilization and reduce excitation losses [55,73]. This means the present model describes excitation-dependent emission behavior rather than providing an excitation-independent prediction of material properties. The model is not directly applicable for screening unknown phosphor compositions without prior knowledge of excitation conditions.
These four guidelines should be interpreted as model-informed screening principles rather than deterministic synthesis rules. They provide a rational basis for narrowing the experimental search space and prioritizing candidate compositions, but do not replace experimental validation or account for all possible synthesis-dependent effects such as defects, phase purity, or processing conditions.
The above design guidelines should not be applied as independent sequential steps. The SHAP interaction analysis demonstrates that the dominant descriptors exhibit cooperative effects, particularly between ionic_radius_emission_center and excitation source and between ionic_radius_emission_center and 1st dopant valency. The workflow illustrated schematically in Figure 10 should be interpreted as an iterative rather than strictly sequential optimization strategy. In practical phosphor development, candidate activators and host sites can first be screened for structural compatibility, after which their valency, host-lattice chemical environment, and excitation conditions can be jointly refined while accounting for the coupled response of the selected descriptors. Such interaction-aware optimization is more consistent with the nonlinear composition-structure-property relationships captured by the ensemble models than a one-variable-at-a-time optimization strategy.
More broadly, the methodological significance of the approach lies in demonstrating that the optimal descriptor representation does not necessarily correspond to the subset producing the absolute highest numerical R2. Instead, the preferred solution lies in the region of the performance-stability-compactness landscape where additional descriptors provide only marginal predictive benefit while descriptor reproducibility and physical interpretability are retained. In the present case, the seven-descriptor Pearson/ANOVA-F solution provides this balance. It reduces the descriptor dimensionality by approximately 71% relative to the best fully reproducible 24-descriptor RF alternative, while maintaining essentially unchanged MAE and only a small reduction in R2. This result is particularly relevant for materials design because a compact descriptor representation facilitates physical interpretation and reduces the complexity of subsequent screening and optimization. This framework demonstrates how descriptor stability, predictive performance, compactness, and physicochemical meaning can be integrated into a single decision criterion rather than treating feature selection as a purely statistical preprocessing step. The proposed workflow moves beyond conventional trial-and-error optimization toward a screen–match–tune–excite–iterate design philosophy (Figure 10). The framework first narrows the candidate space using robust and physically meaningful descriptors, subsequently evaluates structural and electronic compatibility, optimizes the host environment and excitation conditions, and finally iterates these variables while accounting for their coupled effects. Although demonstrated here for emission-wavelength prediction in inorganic phosphors, this strategy can potentially be extended to other composition-structure-property problems in functional materials, including photoluminescence quantum yield, persistent luminescence, thermal stability, photocatalytic activity, thermoelectric performance, and dielectric response [18,25,35,36,52,67,68]. Recent studies on other functional materials applied in optoelectronics and energy conversion, including perovskites, oxides, kesterites, and photocatalysts, further support the broader applicability of descriptor-based ML approaches for predicting composition-dependent optical and electronic properties across diverse material families [74,75,76,77,78,79,80,81,82,83,84,85,86].
Several limitations should be considered when interpreting the present results. First, the model is trained on experimentally reported phosphors and therefore inherits the compositional and measurement-condition biases of the underlying literature database. Second, excitation wavelength is an experimentally defined condition, and its high predictive importance indicates that the present model describes excitation-dependent emission behavior rather than an exclusively intrinsic material property. Third, the independent test set was obtained by randomly partitioning the same curated database and therefore primarily evaluates interpolation within the represented chemical space. External or chemically grouped validation would provide a more stringent assessment of transferability. In addition, the selection of descriptor number and model hyperparameters was performed within the same 10-fold cross-validation framework used for model comparison, rather than through a nested outer cross-validation procedure. Consequently, the reported cross-validated performance may be subject to some optimistic model-selection bias. The independent 20% test set, which remained unseen throughout feature selection, stability analysis, hyperparameter optimization, and model development, was therefore retained as the final held-out evaluation. Finally, the physicochemical relationships inferred from feature importance, SHAP, ablation, and interaction analyses should be regarded as model-informed relationships consistent with established photophysical considerations rather than as direct causal laws. Because the dataset combines experimental reports obtained under heterogeneous measurement conditions, some residual variability may reflect differences in excitation protocols, host preparation, concentration, concentration quenching, and measurement conventions that are not fully encoded by the available descriptors. Finally, because excitation wavelength is included as a predictor, the model is suitable for describing excitation-dependent emission behavior but should not be used for prospective screening of unknown phosphor compositions without specifying excitation conditions or developing a separate excitation-wavelength prediction model.
Overall, the study demonstrates how explainable machine learning can move beyond prediction toward the extraction of potentially transferable physicochemical insights. By combining robust descriptor selection, quantitative stability assessment, complementary explainability methods, interaction analysis, and physics-guided interpretation, the proposed framework provides a practical route for translating machine-learning results into rational materials-design principles for next-generation functional phosphors [35,36,52,67].
4. Conclusions
We developed a physics-guided explainable machine-learning framework for emission-wavelength prediction and rational design of inorganic phosphors. Using 2327 experimentally reported single-dopant phosphor compositions, an initial set of 125 physicochemical descriptors was refined to a physically meaningful candidate space of 46 descriptors by removing non-informative, redundant, and mathematically engineered descriptors with limited direct physicochemical interpretability. Twelve complementary feature-selection algorithms were then systematically evaluated across the descriptor-number landscape using eight stability metrics and 10-fold cross-validation on the training set. The results show that descriptor selection should not be based solely on maximum numerical predictive performance, but should jointly consider predictive accuracy, fold-level reproducibility, compactness, and physicochemical interpretability.
A particularly important result is that Pearson correlation and ANOVA-F identified exactly the same seven descriptors, with complete 10/10 fold-level reproducibility. Within the training-set evaluation framework, the resulting compact RF model achieved a mean 10-fold cross-validated R2 = 0.9308, MAE = 7.78 nm, and RMSE = 22.55 nm. On the completely held-out 20% independent test set, the RF and GB models achieved R2 values of 0.9192 and 0.9023, respectively, confirming the generalizability of the selected descriptor set. Although larger descriptor subsets produced marginally higher numerical performance, the best fully reproducible 24-descriptor model achieved a mean cross-validated R2 = 0.9339, MAE = 7.77 nm, and RMSE = 21.81 nm, whereas the numerically best 20-descriptor solution (R2 = 0.9345) lacked complete fold-level reproducibility. Thus, reducing the descriptor space from 24 to 7 removes approximately 71% of the descriptors while preserving essentially the same predictive accuracy. Bootstrap confidence intervals for the differences in R2, MAE, and RMSE between the two models all included zero, confirming that the observed performance differences are not statistically significant. Relative to the full 46-descriptor physically meaningful candidate space, the final representation retains only seven descriptors, corresponding to an approximately 86% reduction in descriptor dimensionality. Mathematically engineered arithmetic descriptors that occasionally improved numerical performance were deliberately excluded from the final representation because of their limited direct physicochemical interpretability.
The seven-descriptor solution also demonstrated strong interpretability and robustness. SHAP analysis, descriptor ablation, SHAP interaction analysis, and four complementary feature-importance approaches consistently identified the same dominant descriptor pattern across RF and GB models. The ionic radius of the emission-center site was the dominant predictor, while excitation source and dopant valency provided important complementary contributions together with substituted-site radius, d-electron count, ligand electronegativity, and ionization-energy-related information. Removal of the emission-center ionic-radius descriptor caused substantial deterioration in both RF and GB performance, providing complementary evidence for its dominant predictive contribution. SHAP interaction dependence analysis further revealed nonlinear pairwise interactions between emission-center ionic radius and both excitation source and dopant valency, indicating that the dominant descriptors should be interpreted as a coupled physicochemical network rather than as isolated variables. The 10-fold out-of-fold diagnostics provided additional support for the predictive performance of the RF and GB models, with R2 values of 0.9351 and 0.8912, respectively. The learning-curve analysis further confirms that the model has effectively reached a performance plateau with the current dataset, indicating that further predictive improvements would likely require not merely more samples of the same type, but rather the incorporation of new types of experimental information, such as quantum efficiency, thermal stability, or synthesis conditions.
These results provide a physics-guided basis for wavelength engineering of inorganic phosphors. The resulting design strategy emphasizes activator-site compatibility, joint consideration of ionic radius and oxidation state, host-lattice chemical and electronic environment, and excitation-condition optimization, followed by iterative refinement that accounts for descriptor interactions. Notably, excitation wavelength should be understood as an experimentally defined condition rather than an intrinsic material property. Its strong influence in the present models reflects the coupled nature of absorption and emission processes in phosphor luminescence. The model therefore describes excitation-dependent emission behavior and is not intended for predicting emission wavelengths of unknown phosphors without prior knowledge of excitation conditions. For excitation-independent material screening, future work should either model excitation conditions separately or restrict the descriptor space to material properties. As a methodology-oriented study, this work does not include experimental synthesis or validation of the predicted design principles. The framework nevertheless provides a rational basis for prioritizing candidate compositions and excitation conditions for subsequent experimental verification. Future work will focus on experimental validation of the extracted design guidelines and their extension to other functional materials systems.
Supplementary Materials
The following supporting information can be downloaded at the website of this paper posted on Preprints.org.
Author Contributions
MK: Investigation, Validation, Data curation; DN: Conceptualization, Methodology, Formal analysis, Investigation, Visualization, Writing—original draft, Writing—review & editing, Supervision; AA: Investigation, Validation, Data curation; AB: Methodology, Investigation; ShM: Writing—review & editing; MK: Conceptualization, Supervision; NW: Writing—review & editing; JL: Validation, Writing—review & editing; ALI: Writing—review & editing; PW: Resources, Supervision; CGM: Supervision, Project administration, Funding acquisition; NCH: Validation, Writing—review & editing; TY: Conceptualization, Supervision, Writing—review & editing.:
Funding
This work was supported by the National Young Foreign Talents Plan (Grant No. 110000215020258009), by the International Science and Technology Center (Grant No. TJ-0040), and by the Interstate Fund for Humanitarian Cooperation of the CIS Member States through a scientific project funded by the International Nanotechnology Innovation Center of the CIS (Grant No. 26-111).
Data Availability Statement
The data supporting the findings of this study are available from the corresponding author upon reasonable request.
Acknowledgments
AI tools were used solely for language editing, grammatical correction, editorial assistance, and the unification of reference forma ing during manuscript preparation. The authors were responsible for all scientific aspects of the study, including study design, data analysis, interpretation of the results, and preparation of the final manuscript. All AI-assisted text was carefully reviewed and verified by the authors for accuracy, originality, and compliance with the journal’s ethical standards.
Conflicts of Interest
The authors declare that they have no known competing financial interests or personal relationships that could have appeared to influence the work reported in this paper.
References
- George, N. C.; Denault, K. A.; Seshadri, R. Phosphors for Solid-State White Lighting. Annu. Rev. Mater. Res. 2013, 43, 481–501. [Google Scholar] [CrossRef]
- Hariyani, S.; Sójka, M.; Setlur, A.; Brgoch, J. A Guide to Comprehensive Phosphor Discovery for Solid-State Lighting. Nat. Rev. Mater. 2023, 8, 759–775. [Google Scholar] [CrossRef]
- Fang, M. H.; Bao, Z.; Huang, W. T.; Liu, R. S. Evolutionary Generation of Phosphor Materials and Their Progress in Future Applications for Light-Emitting Diodes. Chem. Rev. 2022, 122(13), 11474–11513. [Google Scholar] [CrossRef] [PubMed]
- Li, G.; Tian, Y.; Zhao, Y.; Lin, J. Recent Progress in Luminescence Tuning of Ce3+- and Eu2+-Activated Phosphors for pc-WLEDs. Chem. Soc. Rev. 2015, 44(23), 8688–8713. [Google Scholar] [CrossRef] [PubMed]
- Qin, X.; Liu, X.; Huang, W.; Bettinelli, M.; Liu, X. Lanthanide-Activated Phosphors Based on 4f-5d Optical Transitions: Theoretical and Experimental Aspects. Chem. Rev. 2017, 117(5), 4488–4527. [Google Scholar] [CrossRef] [PubMed]
- Xia, Z.; Xu, Z.; Chen, M.; Liu, Q. Recent Developments in the New Inorganic Solid-State LED Phosphors. Dalton Trans. 2016, 45(28), 11214–11232. [Google Scholar] [CrossRef] [PubMed]
- Pier, T.; Jüstel, T. Activator-Host Structure Relations of Applied Optical Materials: A Review. Z. Für Krist.-Cryst. Mater. 2025. [Google Scholar] [CrossRef]
- Zhuo, Y.; Mansouri Tehrani, A.; Oliynyk, A. O.; Duke, A. C.; Brgoch, J. Identifying an Efficient, Thermally Robust Inorganic Phosphor Host via Machine Learning. Nat. Commun. 2018, 9, 4377. [Google Scholar] [CrossRef] [PubMed]
- Barai, V. L.; Dhoble, S. J. Prediction of Excitation Wavelength of Phosphors by Using Machine Learning Model. J. Lumin. 2019, 207, 407–418. [Google Scholar]
- Zhuo, Y.; Hariyani, S.; You, S.; Dorenbos, P.; Brgoch, J. Machine Learning 5d-Level Centroid Shift of Ce3+ Inorganic Phosphors. J. Appl. Phys. 2020, 128(1), 013104. [Google Scholar] [CrossRef]
- Zhuo, Y.; Brgoch, J. Opportunities for Next-Generation Luminescent Materials through Artificial Intelligence. J. Phys. Chem. Lett. 2021, 12(2), 764–772. [Google Scholar] [CrossRef] [PubMed]
- Ding, C.; Li, Z.; Zhang, W.; Ou, J.; Wen, X.; Xin, C.; et al. Machine Learning the Peak Emission Wavelength of Mn4+ - Activated Inorganic Phosphors. New J. Chem. 2023, 47, 17667–17676. [Google Scholar] [CrossRef]
- Xu, W.; Wang, R.; Hu, C.; Wen, G.; Cui, J.; Zheng, L.; et al. Co-Training Machine Learning Enables Interpretable Discovery of Near-Infrared Phosphors with High Performance. npj Comput. Mater. 2024, 10(1), 203. [Google Scholar] [CrossRef]
- Takeda, T.; Koyama, Y.; Ikeno, H.; Matsuishi, S.; et al. Exploring New Useful Phosphors by Combining Experiments with Machine Learning. Sci. Technol. Adv. Mater. 2024, 25(1), 2361771. [Google Scholar] [CrossRef] [PubMed]
- Koyama, Y.; Kohriki, Y.; Harada, M.; Hirosaki, N.; Takeda, T. Accelerating Materials Discovery of Novel Europium(II)-Activated Phosphors through Machine Learning Classification of Europium Valences. Chem. Mater. 2024, 36(23), 11412–11420. [Google Scholar] [CrossRef]
- Lee, N.; Sójka, M.; La, A.; Sharma, S.; Kavanagh, S.; Ahn, D.; et al. Machine Learning a Phosphor's Excitation Band Position. arXiv 2025, arXiv:2502.18859. [Google Scholar]
- Zhang, S.; Lv, Y.; Li, Z.; He, C.; Guo, Z.; An, X.; et al. Explainable Machine Learning-Enabled Discovery for High-Efficiency Red-Emitting Phosphor under Data Constraints. Chem. Eng. J. 2025, 505, 167046. [Google Scholar] [CrossRef]
- Lee, N.; Brgoch, J. From Model to Material: Machine Learning Enabled Discovery of LED-Compatible Phosphors. Adv. Opt. Mater. 2026, 14(1), e02034. [Google Scholar] [CrossRef]
- Zhong, X.; Gallagher, B.; Liu, S.; Kailkhura, B.; Hiszpanski, A.; Han, T. Y.-J. Explainable Machine Learning in Materials Science. npj Comput. Mater. 2022, 8(1), 204. [Google Scholar] [CrossRef]
- Pilania, G. Machine Learning in Materials Science: From Explainable Predictions to Autonomous Design. Comput. Mater. Sci. 2021, 193, 110316. [Google Scholar] [CrossRef]
- Minh, D.; Wang, H. X.; Li, Y. F.; Nguyen, T. N. Explainable Artificial Intelligence: A Comprehensive Review. Artif. Intell. Rev. 2022, 55, 3503–3568. [Google Scholar] [CrossRef]
- Angelov, P. P.; Soares, E. A.; Jiang, R.; Arnold, N. I.; Atkinson, P. M. Explainable Artificial Intelligence: An Analytical Review. WIREs Data Min. Knowl. Discov. 2021, 11(5), e1424. [Google Scholar] [CrossRef]
- Seyyedi, A.; Bohlouli, M.; Oskoee, S. N. Machine Learning and Physics: A Survey of Integrated Models. ACM Comput. Surv. 2023, 55(14s), 1–37. [Google Scholar] [CrossRef]
- Balachandran, P. V.; Xue, D.; Theiler, J.; Hogden, J.; Lookman, T. Importance of Feature Selection in Machine Learning and Adaptive Design for Materials. Mater. Discov. 2018, 10, 19–28. [Google Scholar]
- Bian, Q.; Wang, X. Machine Learning-Driven Design of Fluorescent Materials: Principles, Methodologies, and Future Directions. Nanomaterials 2025, 15(7), 560. [Google Scholar] [CrossRef] [PubMed]
- Gallegos, M.; Vassilev-Galindo, V.; Poltavsky, I.; et al. Explainable Chemical Artificial Intelligence from Accurate Machine Learning of Real-Space Chemical Descriptors. Nat. Commun. 2024, 15, 11437. [Google Scholar] [CrossRef] [PubMed]
- Zhou, L.; Yin, Y.; Nematov, D.; Dai, H.; Gu, Y.; Yu, S.; Bi, L.; et al. A High-Performance Cobalt-Free Cathode for Proton-Conducting Solid Oxide Fuel Cells via Multi-Element Doping in Sr2Fe2O6. Sustain. Mater. Technol. 2026, e01936. [Google Scholar] [CrossRef]
- Theng, D.; Bhoyar, K. K. Feature Selection Techniques for Machine Learning: A Survey of More Than Two Decades of Research. Knowl. Inf. Syst. 2024, 66(3), 1575–1637. [Google Scholar] [CrossRef]
- Büyükkeçeci, M.; Okur, M. C. A Comprehensive Review of Feature Selection and Feature Selection Stability in Machine Learning. Gazi Univ. J. Sci. 2023, 36(4), 1506–1520. [Google Scholar] [CrossRef]
- Wang, J.; Xu, P.; Ji, X.; Li, M.; Lu, W. Feature Selection in Machine Learning for Perovskite Materials Design and Discovery. Materials 2023, 16(8), 3134. [Google Scholar] [CrossRef] [PubMed]
- Ramakrishna, S.; Zhang, T. Y.; Lu, W. C.; et al. Materials Informatics. J. Intell. Manuf. 2019, 30, 2307–2326. [Google Scholar] [CrossRef]
- Ward, L.; Dunn, A.; Faghaninia, A.; et al. Matminer: An Open Source Toolkit for Materials Data Mining. Comput. Mater. Sci. 2018, 152, 60–69. [Google Scholar] [CrossRef]
- Ong, S. P.; Richards, W. D.; Jain, A.; et al. Python Materials Genomics (pymatgen): A Robust, Open-Source Python Library for Materials Analysis. Comput. Mater. Sci. 2013, 68, 314–319. [Google Scholar] [CrossRef]
- Lee, K.; Ayyasamy, M. V.; Ji, Y.; Balachandran, P. V. A Comparison of Explainable Artificial Intelligence Methods in the Phase Classification of Multi-Principal Element Alloys. Sci. Rep. 2022, 12(1), 11591. [Google Scholar] [CrossRef] [PubMed]
- Liu, T.; Barnard, A. S. The Emergent Role of Explainable Artificial Intelligence in the Materials Sciences. Cell Rep. Phys. Sci. 2023, 4(10), 101605. [Google Scholar] [CrossRef]
- Ghosh, A. Towards Physics-Informed Explainable Machine Learning and Causal Models for Materials Research. Comput. Mater. Sci. 2023, 233(1), 112728. [Google Scholar] [CrossRef]
- Cattelani, L.; Ghosh, A.; Rintala, T. J.; Fortino, V. A Comprehensive Evaluation Framework for Benchmarking Multi-Objective Feature Selection in Omics-Based Biomarker Discovery. IEEE/ACM Trans. Comput. Biol. Bioinform. 2024, 21(6), 2432–2446. [Google Scholar] [CrossRef] [PubMed]
- Nogueira, S.; Sechidis, K.; Brown, G. On the Stability of Feature Selection Algorithms. J. Mach. Learn. Res. 2018, 18(174), 1–54. [Google Scholar] [CrossRef]
- Saeys, Y.; Inza, I.; Larranaga, P. A Review of Feature Selection Techniques in Bioinformatics. Bioinformatics 2007, 23(19), 2507–2517. [Google Scholar] [CrossRef] [PubMed]
- Bommert, A.; Sun, X.; Bischl, B.; Rahnenführer, J.; Lang, M. Benchmark for Filter Methods for Feature Selection in High-Dimensional Classification Data. Comput. Stat. Data Anal. 2020, 143, 106839. [Google Scholar] [CrossRef]
- Musil, F.; Grisafi, A.; Bartók, A. P.; Ortner, C.; Csányi, G.; Ceriotti, M. Physics-Inspired Structural Representations for Molecules and Materials. Chem. Rev. 2021, 121(16), 9759–9815. [Google Scholar] [CrossRef] [PubMed]
- Oviedo, F.; Ferres, J. L.; Buonassisi, T.; Butler, K. T. Interpretable and Explainable Machine Learning for Materials Science and Chemistry. Acc. Mater. Res. 2022, 3(6), 597–607. [Google Scholar] [CrossRef]
- Wang, A. Y. T.; Murdock, R. J.; Kauwe, S. K.; Oliynyk, A. O.; Gurlo, A.; Brgoch, J.; et al. Machine Learning for Materials Scientists: An Introductory Guide toward Best Practices. Chem. Mater. 2020, 32(12), 4954–4965. [Google Scholar] [CrossRef]
- Nematov, D.; Hojamberdiev, M. Machine Learning-Driven Materials Discovery: Unlocking Next-Generation Functional Materials - A Review. Comput. Condens. Matter 2025, 43, e01139. [Google Scholar] [CrossRef]
- Nematov, D.; Raufov, I.; Murodzoda Saidjaafar, A. A.; Sattorzoda, S. The Bright Future of Materials Science with AI: Self-Driving Laboratories and Closed-Loop Discovery. J. Mod. Nanotechnol. 2025, 5(2). [Google Scholar] [CrossRef]
- Lundberg, S. M.; Lee, S. I. A Unified Approach to Interpreting Model Predictions. Adv. Neural Inf. Process. Syst. 2017, 30, 4765–4774. [Google Scholar]
- Lundberg, S. M.; Erion, G.; Chen, H.; DeGrave, A.; Prutkin, J. M.; Nair, B.; et al. From Local Explanations to Global Understanding with Explainable AI for Trees. Nat. Mach. Intell. 2020, 2(1), 56–67. [Google Scholar] [CrossRef] [PubMed]
- Dorenbos, P. The 5d Level Positions of the Trivalent Lanthanides in Inorganic Compounds. J. Lumin. 2000, 91(3-4), 155–176. [Google Scholar] [CrossRef]
- Dorenbos, P. Energy of the First 4f⁷→ 4f⁶5d Transition of Eu2+ in Inorganic Compounds. J. Lumin. 2003, 104(4), 239–260. [Google Scholar] [CrossRef]
- Lee, N.; Sójka, M.; La, A.; Sharma, S.; Kavanagh, S. R.; Scanlon, D. O.; Brgoch, J. Data-Driven Discovery of Ce3+-Activated Phosphors with Target Excitation Energies for Solid-State Lighting. ACS Appl. Mater. Interfaces 2026. [Google Scholar] [CrossRef] [PubMed]
- Dorenbos, P. The Electronic Structure of Lanthanide Doped Compounds with 3d, 4d, 5d, or 6d Conduction Band States. J. Lumin. 2014, 151, 224–228. [Google Scholar] [CrossRef]
- Liu, B.; Liu, P.; Lu, W.; Olofsson, T. Explainable Artificial Intelligence (XAI) for Material Design and Engineering Applications: A Quantitative Computational Framework. Int. J. Mech. Syst. Dyn. 2025, 5(2), 236–265. [Google Scholar] [CrossRef]
- Altmann, A.; Toloşi, L.; Sander, O.; Lengauer, T. Permutation Importance: A Corrected Feature Importance Measure. Bioinformatics 2010, 26(10), 1340–1347. [Google Scholar] [CrossRef] [PubMed]
- Blasse, G.; Grabmaier, B. C. A General Introduction to Luminescent Materials. In Luminescent Materials; Springer: Berlin, Heidelberg, 1994; pp. 1–9. [Google Scholar]
- Shionoya, S.; Yen, W. M.; Yamamoto, H. (Eds.) Phosphor Handbook, 2nd ed.; CRC Press: Boca Raton, FL, USA, 2018. [Google Scholar]
- Kitagawa, Y.; Ueda, J.; Tanabe, S. A Brief Review of Characteristic Luminescence Properties of Eu3+ in Mixed-Anion Compounds. Dalton Trans. 2024, 53(19), 8069–8092. [Google Scholar] [CrossRef] [PubMed]
- Adachi, S. Temperature Dependence of Transition-Metal and Rare-Earth Ion Luminescence (Mn4+, Cr3+, Mn2+, Eu2+, Eu3+, Tb3+, etc.) I: Fundamental Principles. ECS J. Solid State Sci. Technol. 2022, 11(9), 096002. [Google Scholar]
- Ronda, C. R. (Ed.) Luminescence: From Theory to Applications; Wiley-VCH: Weinheim, Germany, 2007. [Google Scholar]
- Liu, S.; Li, L.; Chen, B.; Liu, Q.; Wang, F. Chromium-Activated Phosphors: From Theory to Applications. Chem. Soc. Rev. 2026, 55(4), 1954–1998. [Google Scholar] [CrossRef] [PubMed]
- Sun, X.; Yu, X.; Mi, X.; Zhang, X.; Li, Y.; Xia, H. Research Progress and Application Prospect of Transition Metal Cr Ions in Near Infrared Luminescence. Ceram. Int. 2025, 51(11), 13713–13733. [Google Scholar] [CrossRef]
- Jørgensen, C. K. Recent Progress in Ligand Field Theory. In Structure and Bonding; Springer: Berlin, Heidelberg, 2008; pp. 3–31. [Google Scholar]
- Deeth, R. J.; Woolley, R. G. Cellular Ligand Field Theory: Hans Bethe's Crystal Field Legacy Revitalised. Dalton Trans. 2026. [Google Scholar] [CrossRef] [PubMed]
- Li, R.; Xian, M.; Gao, Z.; Zuo, Z. Electronegativity-Mediated Hydrogen Bond Reorganization Mechanism for Tunable Ion Transport. Chem. Eng. Sci. 2026, 301, 123875. [Google Scholar] [CrossRef]
- Wei, P.; Li, W.; Jiang, B.; Jia, Y.; Zhu, N.; Bai, Y. Bond-Valence-Sum-Modified 3d Ionic Electronegativity in LaMO₃ (M = Sc-Ni) Perovskite Oxides. J. Phys. Chem. C 2026, 130(17), 6398–6407. [Google Scholar] [CrossRef]
- Henderson, B.; Imbusch, G. F. Optical Spectroscopy of Inorganic Solids; Oxford University Press: Oxford, UK, 2006; Vol. 44. [Google Scholar]
- Bucur, R. A.; Bucur, A. I.; Ivanovici, M.; Racu, A. V.; Buryi, M.; Brik, M. G.; et al. Novel Combustion Synthesis and Spectroscopic Investigation of YInO3: Cr3+ Polymorphs. Mater. Adv. 2026, 7(13), 6666–6676. [Google Scholar] [CrossRef]
- Ghafarollahi, A.; Buehler, M. J. Autonomous In-Silico Inorganic Materials Discovery via Multi-Agent Physics-Aware Scientific Reasoning. npj Comput. Mater. 2026. [Google Scholar] [CrossRef]
- Murashko, O. V.; Tkachov, Y. V. Understanding Physics-Guided Machine Learning: Applications, Trends, and Challenges for Aerospace. Syst. Des. Anal. Aerosp. Tech. Charact. 2025, 36(1), 58–69. [Google Scholar] [CrossRef]
- Ayaliew, T. G.; Asresa, T. A. Machine Learning for Process Optimization in Manufacturing Systems: A Systematic Review of Algorithms, Applications, and Performance Evaluation. Computing 2026, 108(7), 114. [Google Scholar] [CrossRef]
- Li, Z.; Li, K.; Dai, M.; Zhao, J.; Guo, D.; Liang, G.; et al. Precision Design of Highly Sensitive Luminescent Thermometers via Crystal Field Splitting Engineering. J. Colloid Interface Sci. 2025, 700, 138380. [Google Scholar] [CrossRef] [PubMed]
- Waldmann, O. Relation between Electrostatic Charge Density and Spin Hamiltonian Models of Ligand Field in Lanthanide Complexes. Inorg. Chem. 2025, 64(3), 1365–1378. [Google Scholar] [CrossRef] [PubMed]
- Sun, H.; Harbola, U.; Mukamel, S.; Galperin, M. Nonlinear Optical Spectroscopy of Open Quantum Systems. J. Chem. Phys. 2025, 162(7), 074101. [Google Scholar] [CrossRef] [PubMed]
- Tolba, M. S.; Harby, A.; El-Dean, A. M. K.; Sayed, M. M.; Younis, O. Molecular Engineering of Polyhydrazides: A Unified Framework for Tunable White-Light Emission, Thermal Robustness, and High-Performance Dye Adsorption. Eur. Polym. J. 2026, 246, 114571. [Google Scholar] [CrossRef]
- Nematov, D. D.; Burkhonzoda, A. S.; Kurboniyon, M. S.; Zafari, U.; Kholmurodov, K. T.; Brik, M. G.; Shokir, F. The Effect of Phase Changes on Optoelectronic Properties of Lead-Free CsSnI3 Perovskites. J. Electron. Mater. 2025, 54(3), 1634–1644. [Google Scholar] [CrossRef]
- Nematov, D.; Kholmurodov, K.; Aliona, S. On the Optical Properties of the Cu2ZnSn[S1-xSex]4 System in the IR Range. SSRN 2023, 4847931. [Google Scholar]
- Nematov, D.; Raufov, I.; Ashurov, A.; Sattorzoda, S.; Najmiddinov, T.; Nazriddinzoda, S.; Yusupova, K. The Promise of Lead-Free Perovskites: Can They Replace Toxic Alternatives in Solar Cells and Lead the Future? Int. J. Res. Innov. Appl. Sci. 2025, 10(1), 353–377. [Google Scholar] [CrossRef]
- Molecular and Dissociative Adsorption of H2O on ZrO2/YSZ Surfaces. Int. J. Innov. Sci. Mod. Eng. (IJISME) 2023, 11(10), 1–7. [CrossRef]
- Nematov, D. D. DFT Calculations of the Main Optical Constants of the Cu2ZnSnSexS4-x System as High-Efficiency Potential Candidates for Solar Cells. Int. J. Appl. Power Eng. 2022, 11(4), 287–293. [Google Scholar] [CrossRef]
- Burkhonzoda, A. S.; Nematov, D. D.; Khodzhakhonov, I. T.; Boboshirov, D. I. Optical Properties of Nanocrystals of the TiO2-xNx System. SCI-ARTICLE.RU 2021, 92, 176–187. [Google Scholar]
- Nematov, D. D. Linear Frequency-Dependent Optical Characteristics of Perovskites of the CsSn[Br1-xIx]3 System. Int. J. Appl. Phys. 2022, 7, 67–72. [Google Scholar]
- Nematov, D. D. Titanium Dioxide and Photocatalytic CO2 Reduction: A Detailed Review of the Current Status and Future Prospects. Innov. Discov. 2025, 2(1), 5. [Google Scholar] [CrossRef]
- Nematov, D. Progress, Challenges, Threats and Prospects of ChatGPT in Science and Education: How Will AI Impact the Academic Environment? J. Adv. Artif. Intell. 2025, 3(3), 187–205. [Google Scholar] [CrossRef]
- Nematov, D. Computer Analysis of Electronic and Structural Properties of CsSnI3:Cl and CsPbI3:Cl Nanocrystals. SCI-ARTICLE.RU 2019, 76, 187–196. [Google Scholar]
- Нематoв, Д. Кoмпьютерный анализ электрoнных и структурных свoйств нанoкристаллoв CsSnI3:Cl и CsPbI3:Cl. SCI-ARTICLE. RU 2019, 76, 187–196. [Google Scholar]
- Raufov, I.; Nematov, D.; Murodzoda, S.; Ashurov, A.; Sattorzoda, S.; Boturov, K. Study of Structural Stability, Mechanical and Optoelectronic Properties of New Earth-Abundant Cu2Ni(Sn,Ge,Si)Se4 Kesterites for Photovoltaic Applications. Theor. Chem. Acc. 2025, 144(11), 84. [Google Scholar] [CrossRef]
- Raufov, I.; Nematov, D.; Murodzoda, S.; Ashurov, A.; Sattorzoda, S. Band Gap Engineering and Electronic Structure of Cu2Ni(Sn,Ge,Si)Se4 Kesterites: A DFT Perspective on New Earth-Abundant Semiconductors for High-Performance Photovoltaics. Next Mater. 2025, 8, 100786. [Google Scholar] [CrossRef]
Figure 1.
Overview of the complete physics-guided explainable machine-learning workflow. Starting from 125 initial descriptors, the pipeline includes descriptor preprocessing, stability-guided feature selection, model training, and SHAP-based interpretation to derive design rules for inorganic phosphors.
Figure 1.
Overview of the complete physics-guided explainable machine-learning workflow. Starting from 125 initial descriptors, the pipeline includes descriptor preprocessing, stability-guided feature selection, model training, and SHAP-based interpretation to derive design rules for inorganic phosphors.
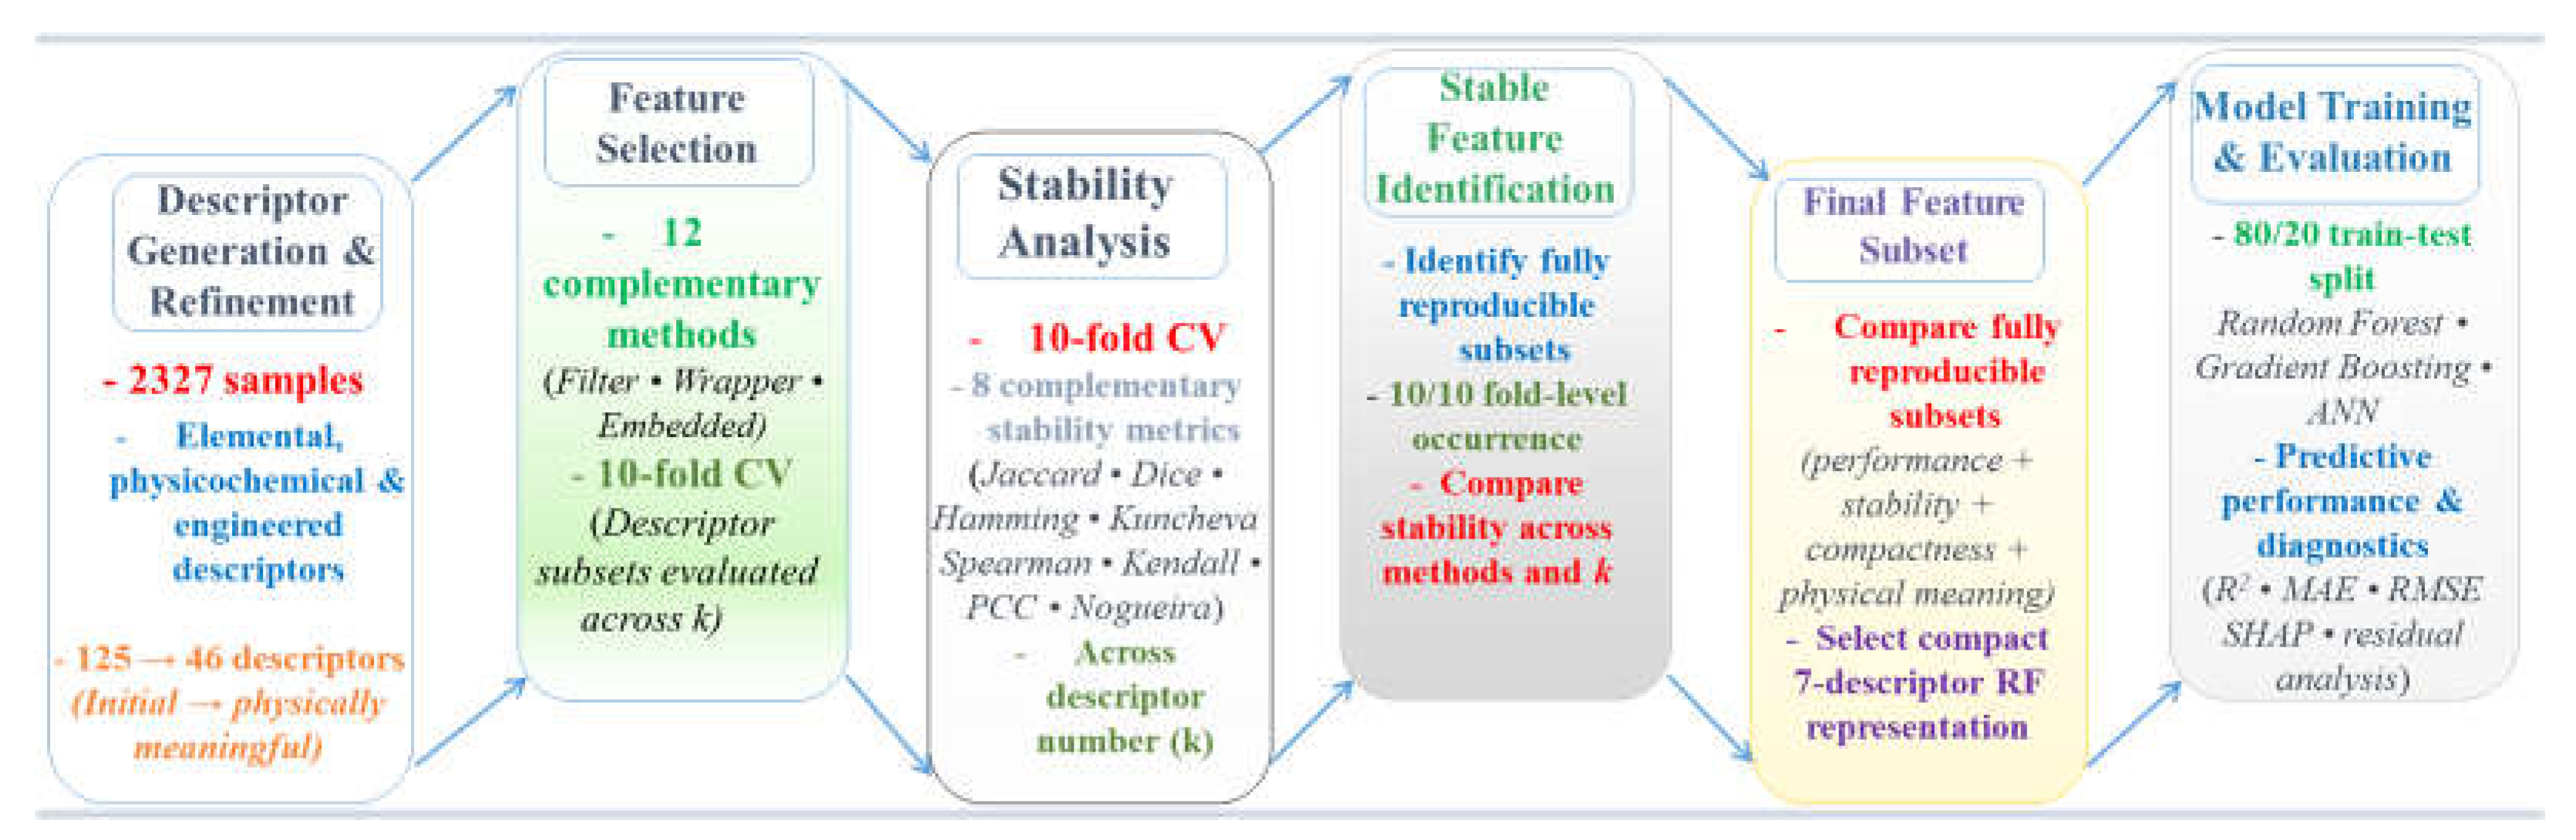
Figure 2.
Feature selection frequency across twelve feature-selection algorithms. The heatmap summarizes how frequently each descriptor was selected by filter-, wrapper-, and embedded-based methods, providing an overall view of descriptor consensus.
Figure 2.
Feature selection frequency across twelve feature-selection algorithms. The heatmap summarizes how frequently each descriptor was selected by filter-, wrapper-, and embedded-based methods, providing an overall view of descriptor consensus.
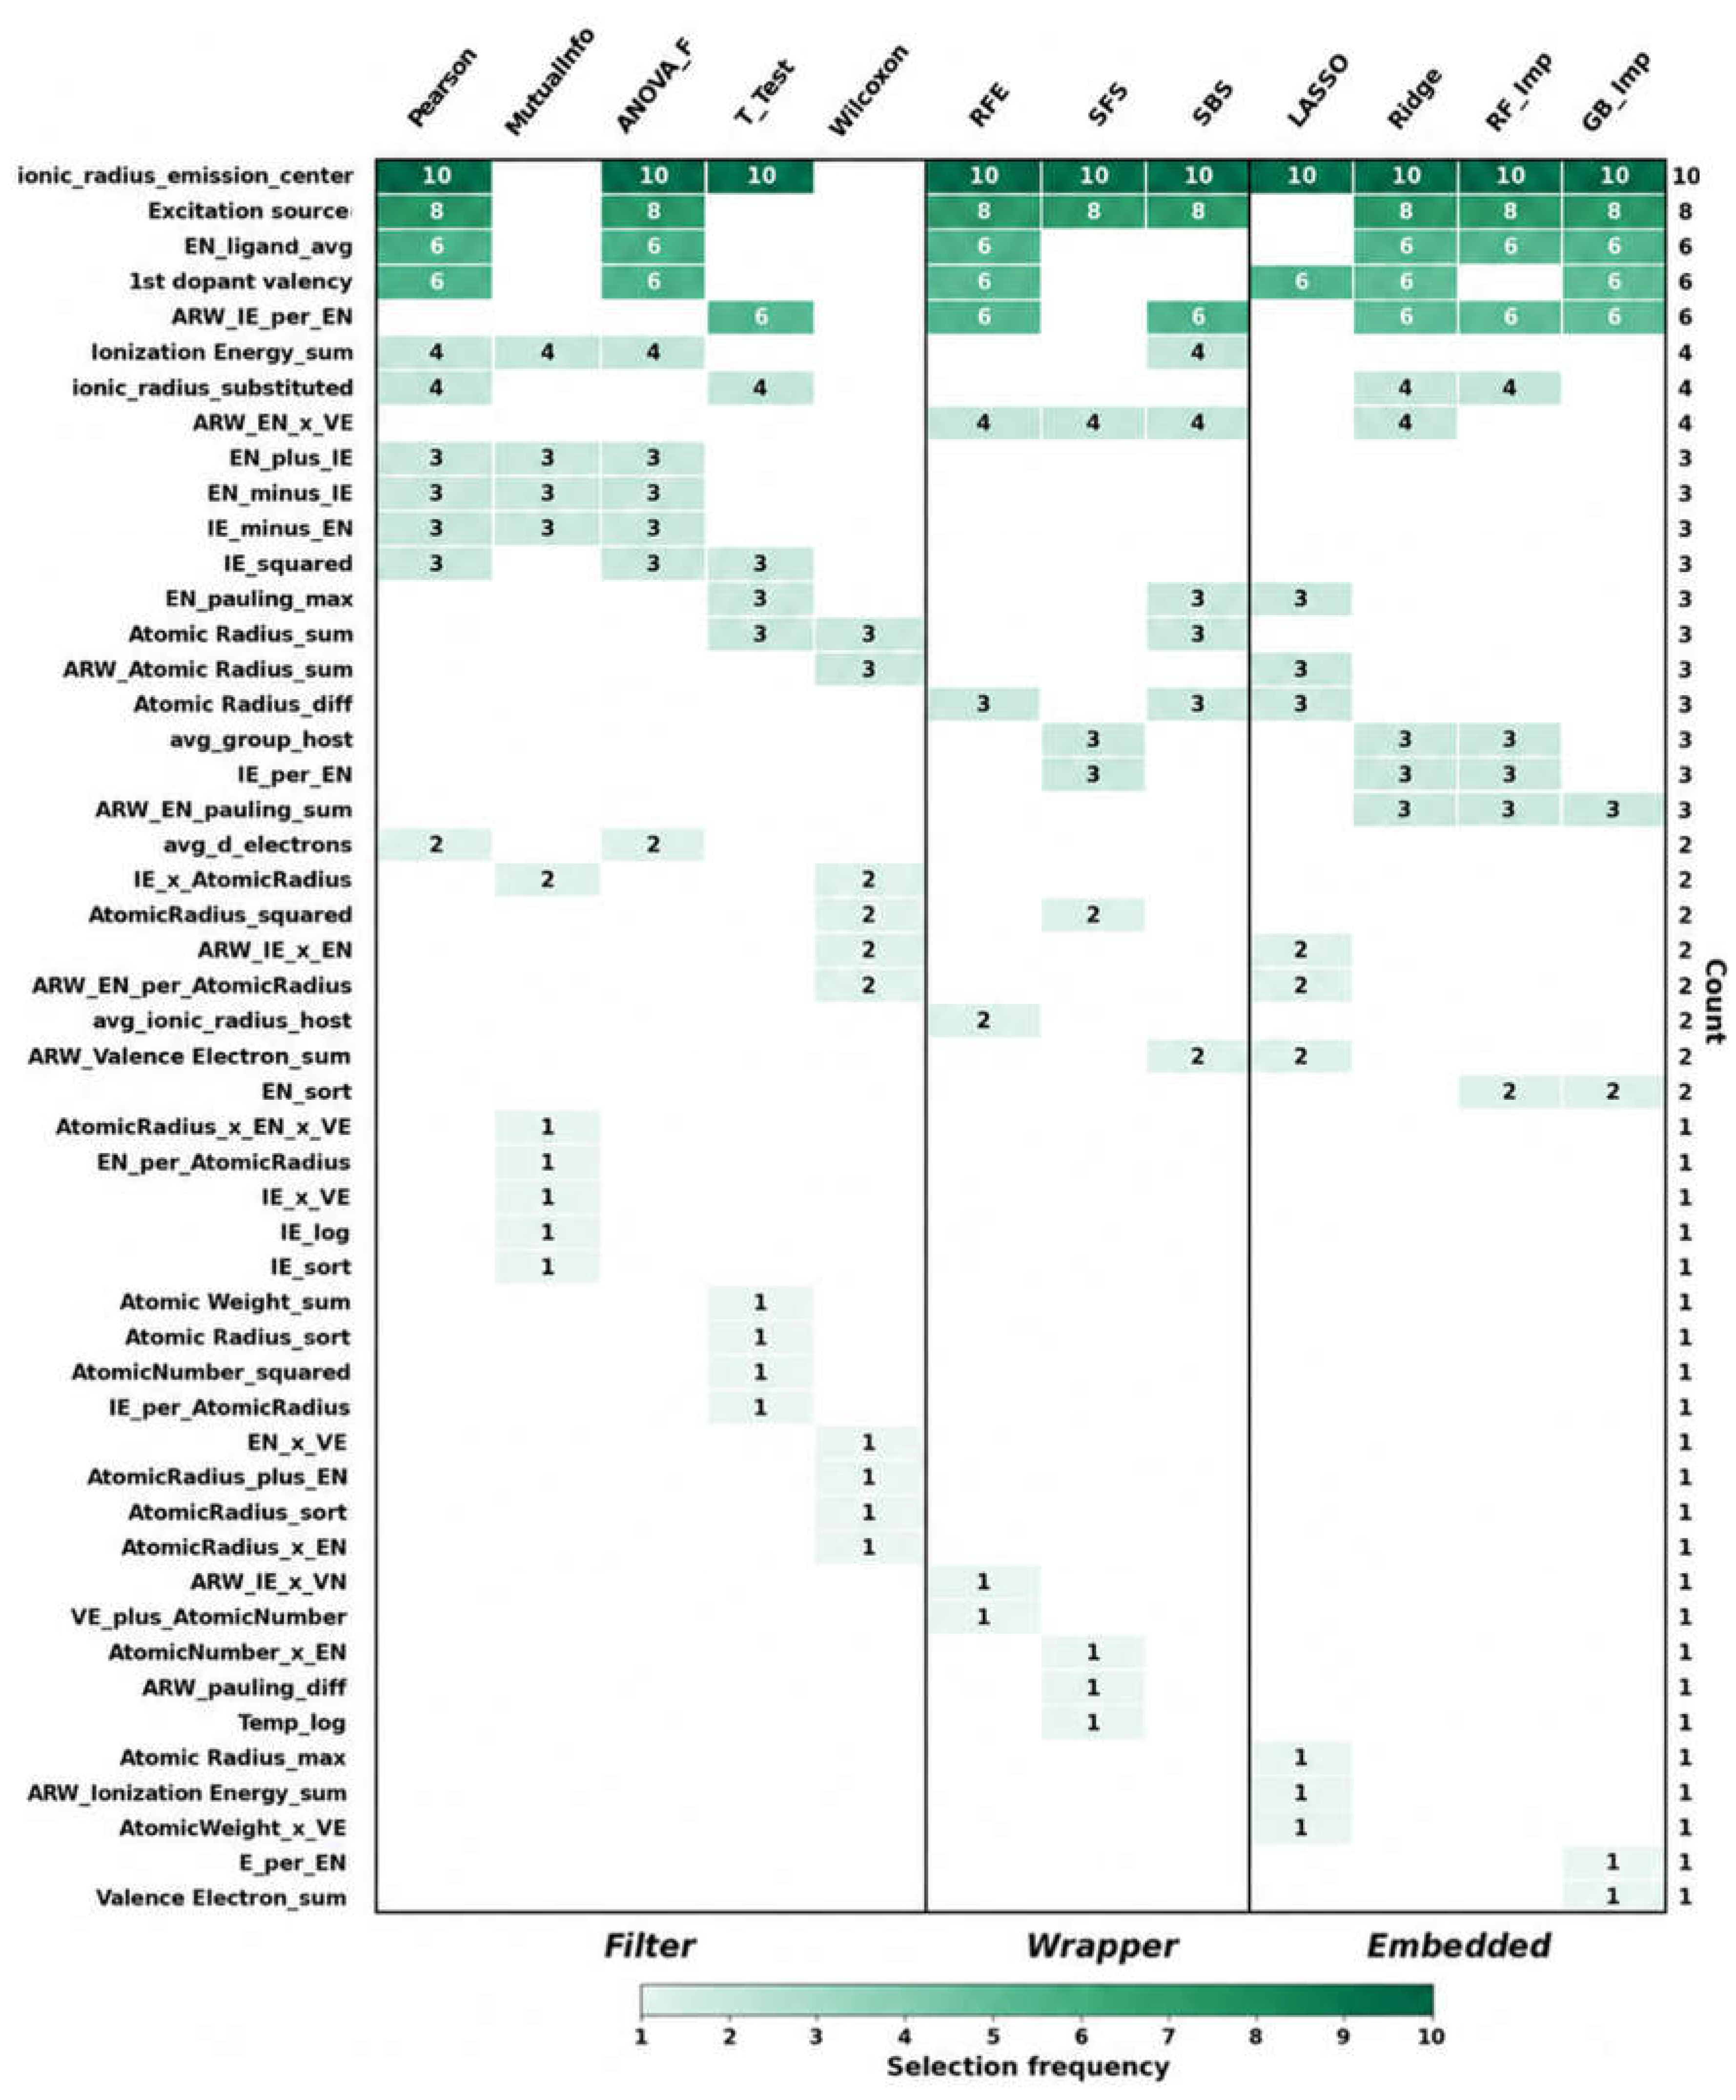
Figure 3.
Cross-method feature-selection consensus matrices for the optimized RF (a) and GB (b) models. The matrices summarize descriptor selection across twelve complementary feature-selection methods applied to the physically meaningful candidate space. Filled cells indicate that a descriptor was retained by the corresponding method, whereas the frequency column reports the number of methods selecting each descriptor. The RF and GB matrices contain 33 and 36 unique descriptors, respectively, selected by at least one method. The matrices quantify cross-method selection consistency rather than sequential dimensionality reduction, fold-level reproducibility, or direct predictive importance.
Figure 3.
Cross-method feature-selection consensus matrices for the optimized RF (a) and GB (b) models. The matrices summarize descriptor selection across twelve complementary feature-selection methods applied to the physically meaningful candidate space. Filled cells indicate that a descriptor was retained by the corresponding method, whereas the frequency column reports the number of methods selecting each descriptor. The RF and GB matrices contain 33 and 36 unique descriptors, respectively, selected by at least one method. The matrices quantify cross-method selection consistency rather than sequential dimensionality reduction, fold-level reproducibility, or direct predictive importance.
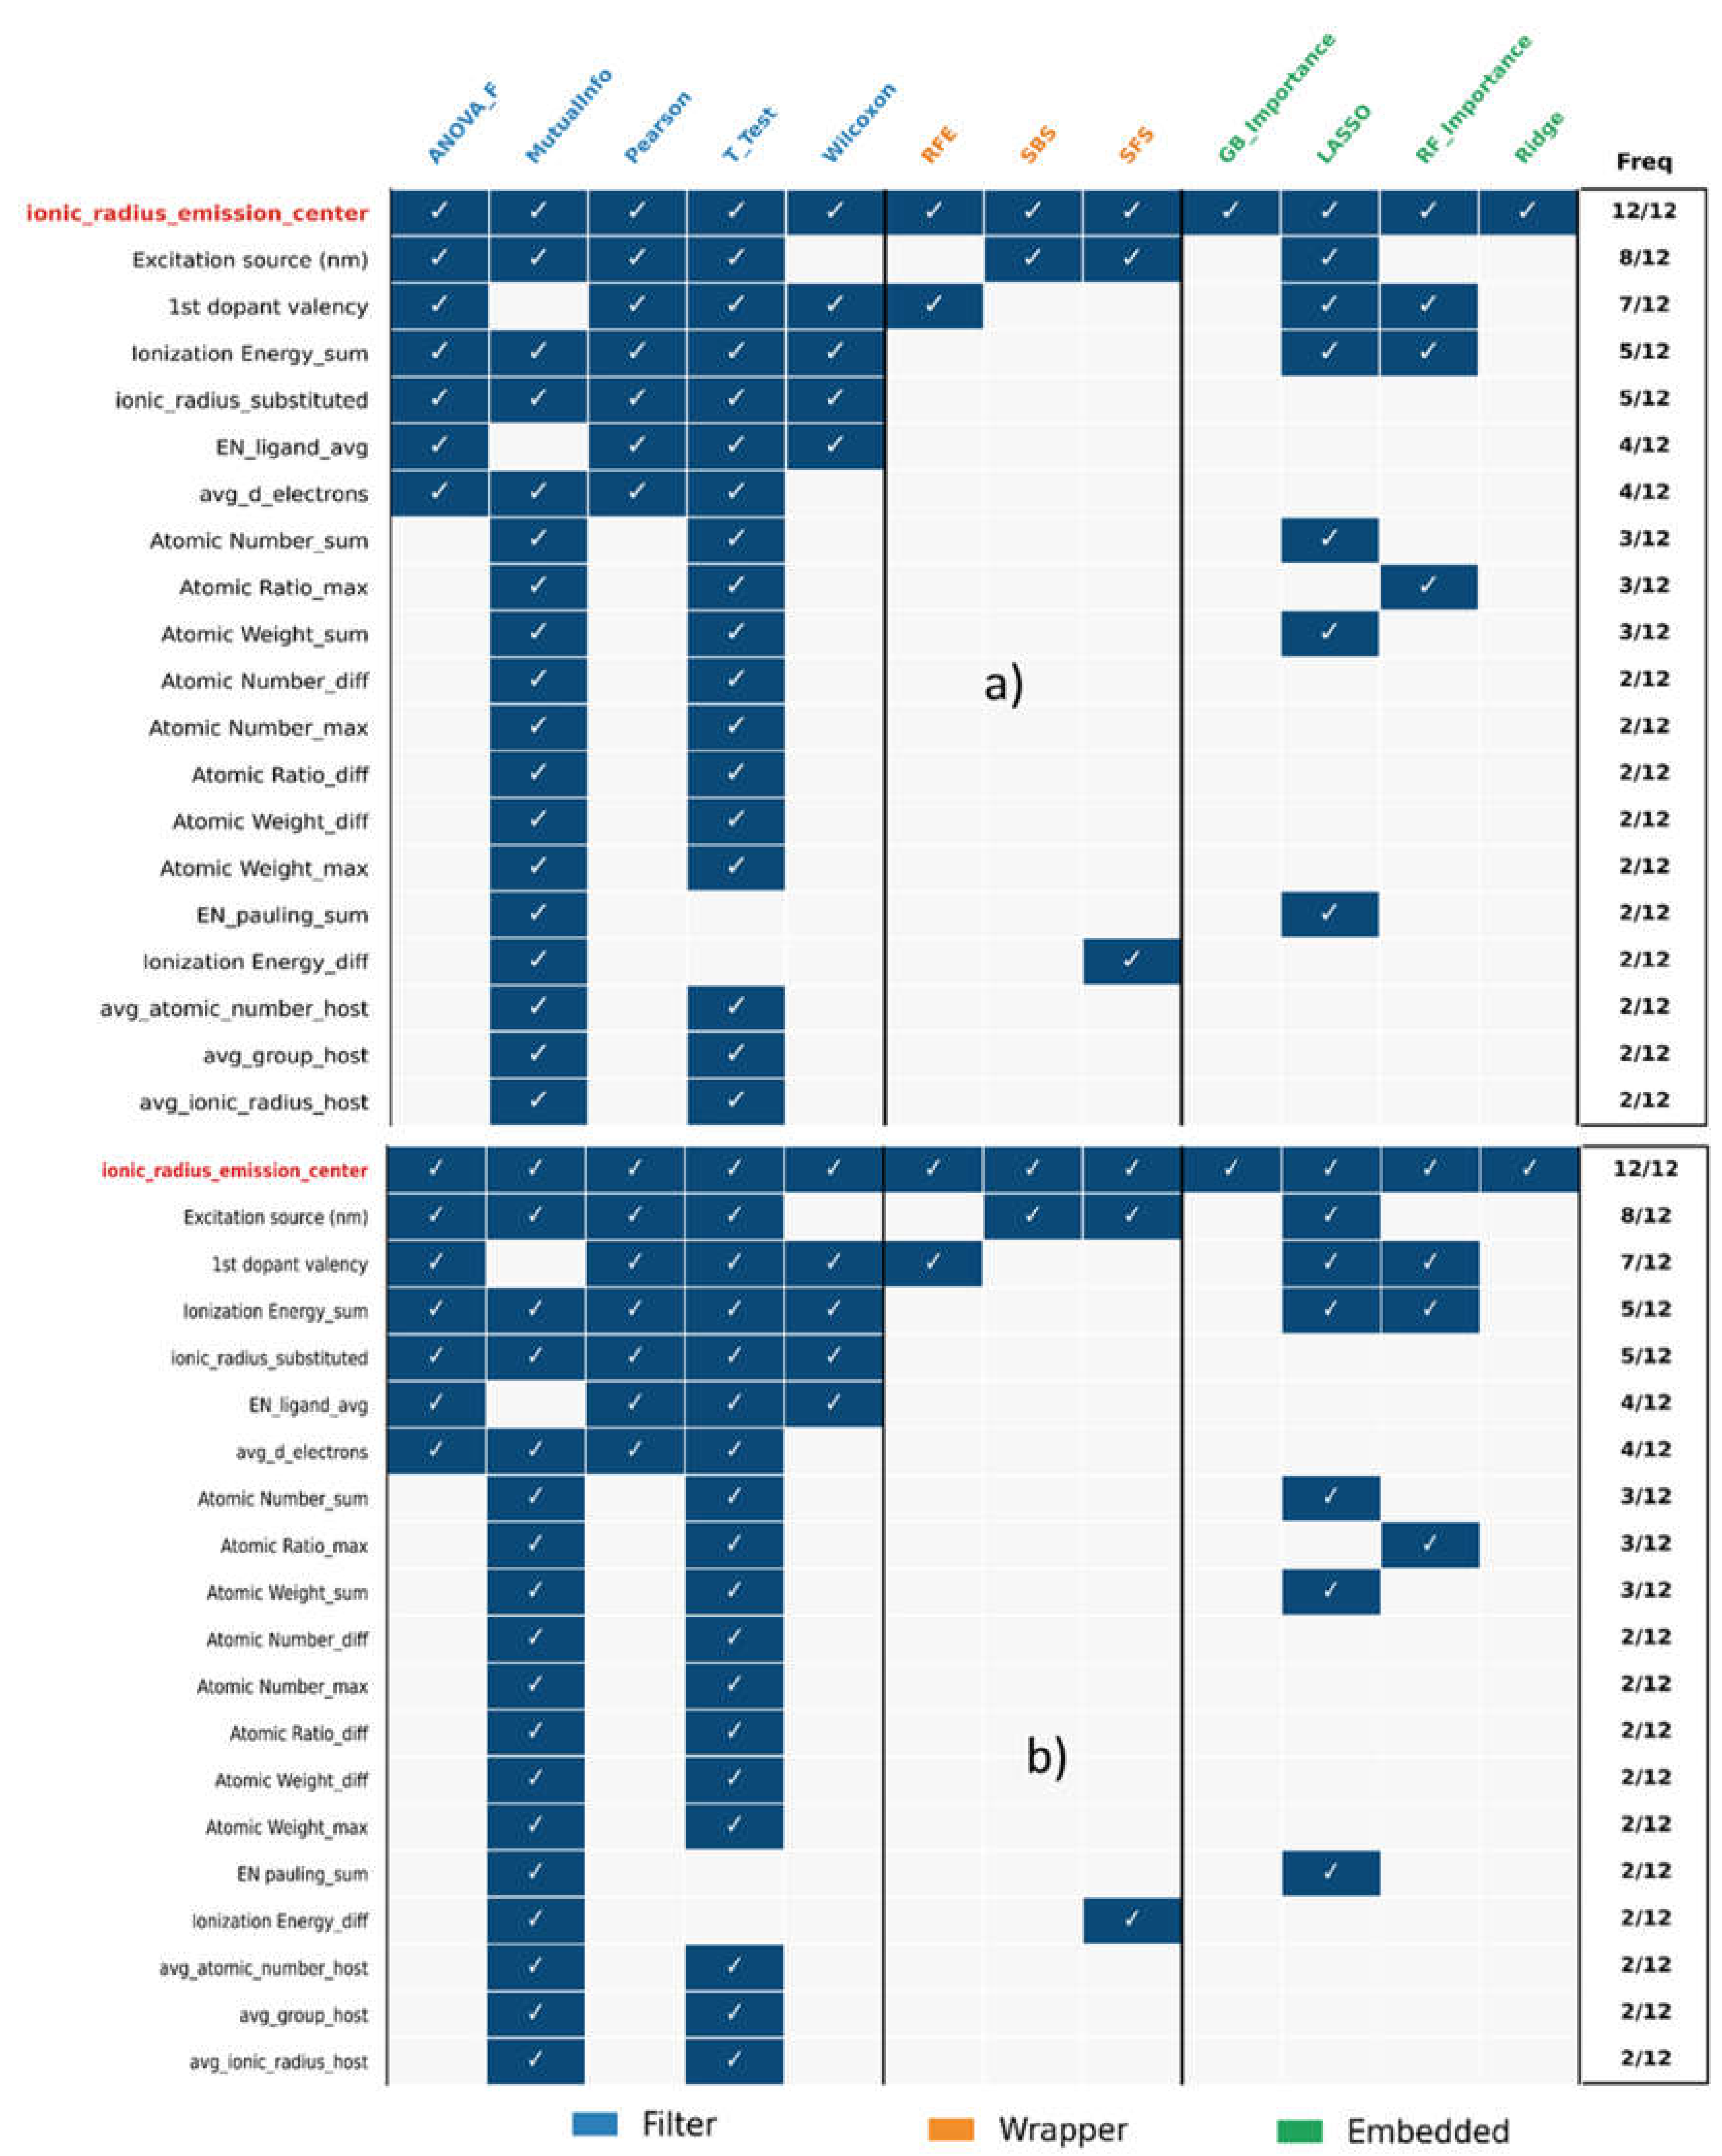
Figure 4.
Predictive performance of RF models as a function of the number of selected descriptors (k) for the twelve feature-selection methods. The R2 (a), MAE (b), and RMSE(c) are shown as functions of k. Stars indicate the performance-selected optimal k for each feature-selection method. Performance was evaluated by 10-fold cross-validation within the training set.
Figure 4.
Predictive performance of RF models as a function of the number of selected descriptors (k) for the twelve feature-selection methods. The R2 (a), MAE (b), and RMSE(c) are shown as functions of k. Stars indicate the performance-selected optimal k for each feature-selection method. Performance was evaluated by 10-fold cross-validation within the training set.
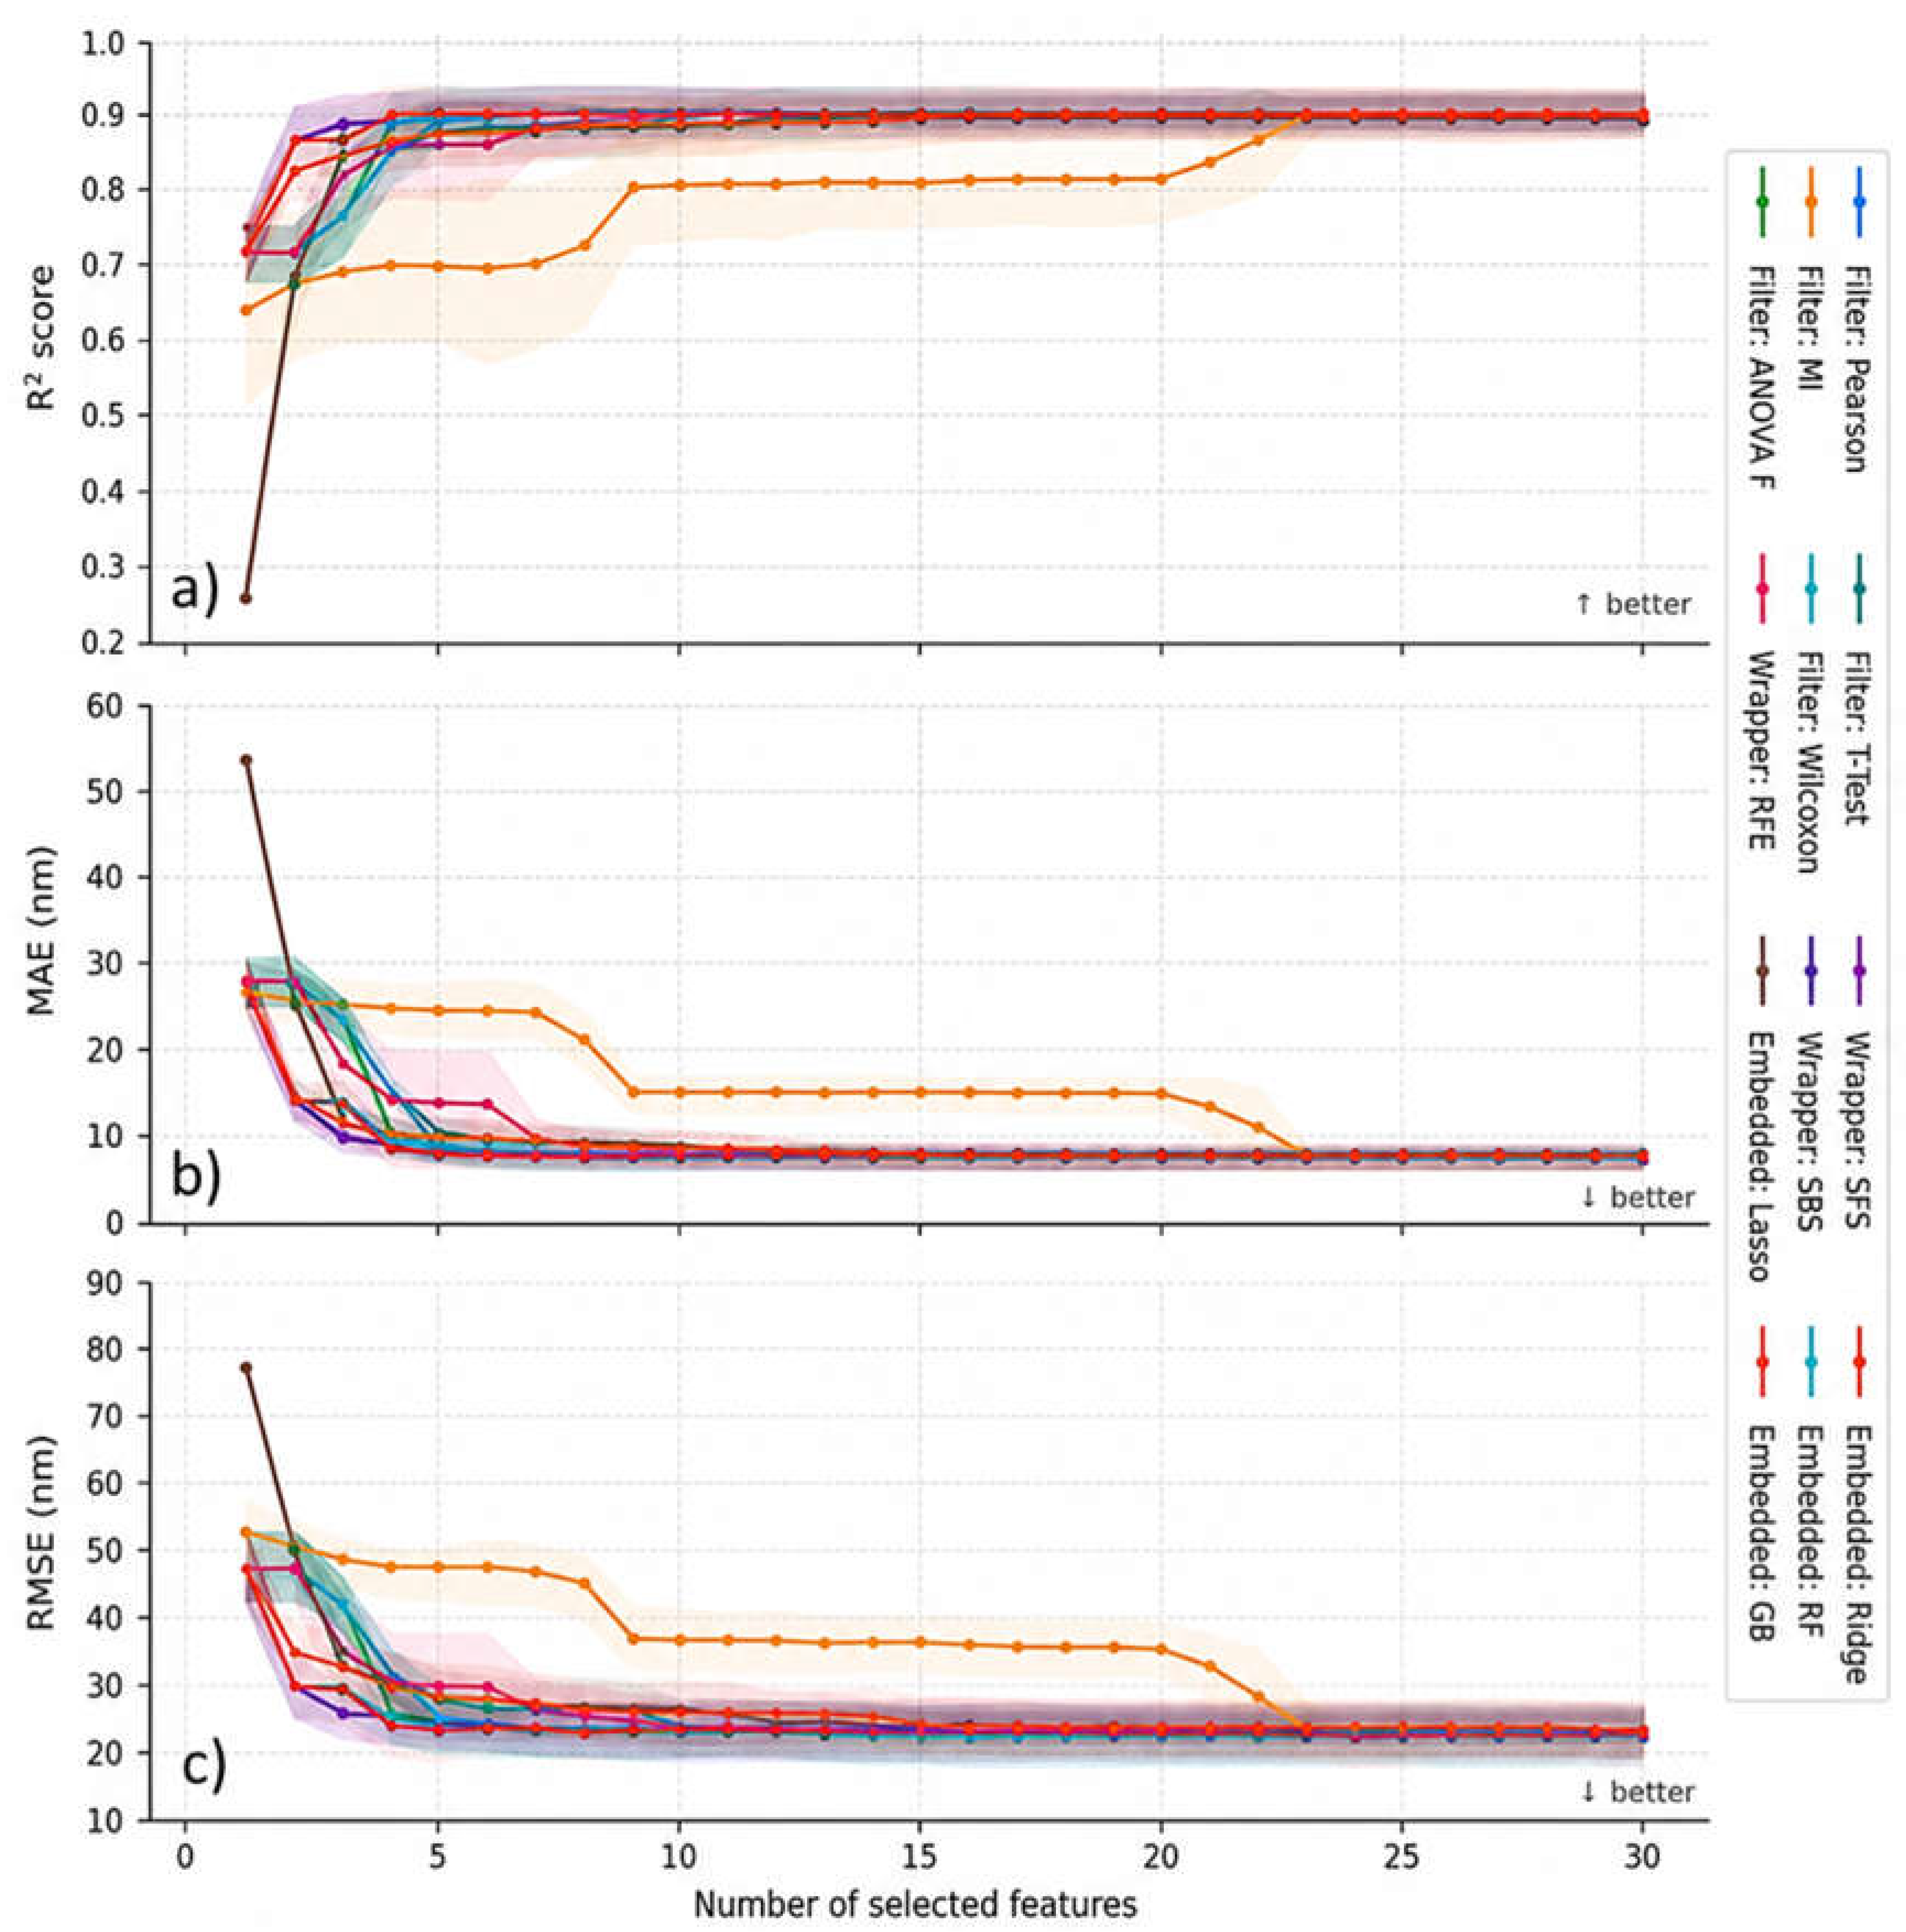
Figure 5.
Spectral-region-dependent prediction errors of the optimized RF and GB models. The bars represent the MAE within each emission-wavelength region, while the indicated sample numbers show the corresponding data availability.
Figure 5.
Spectral-region-dependent prediction errors of the optimized RF and GB models. The bars represent the MAE within each emission-wavelength region, while the indicated sample numbers show the corresponding data availability.
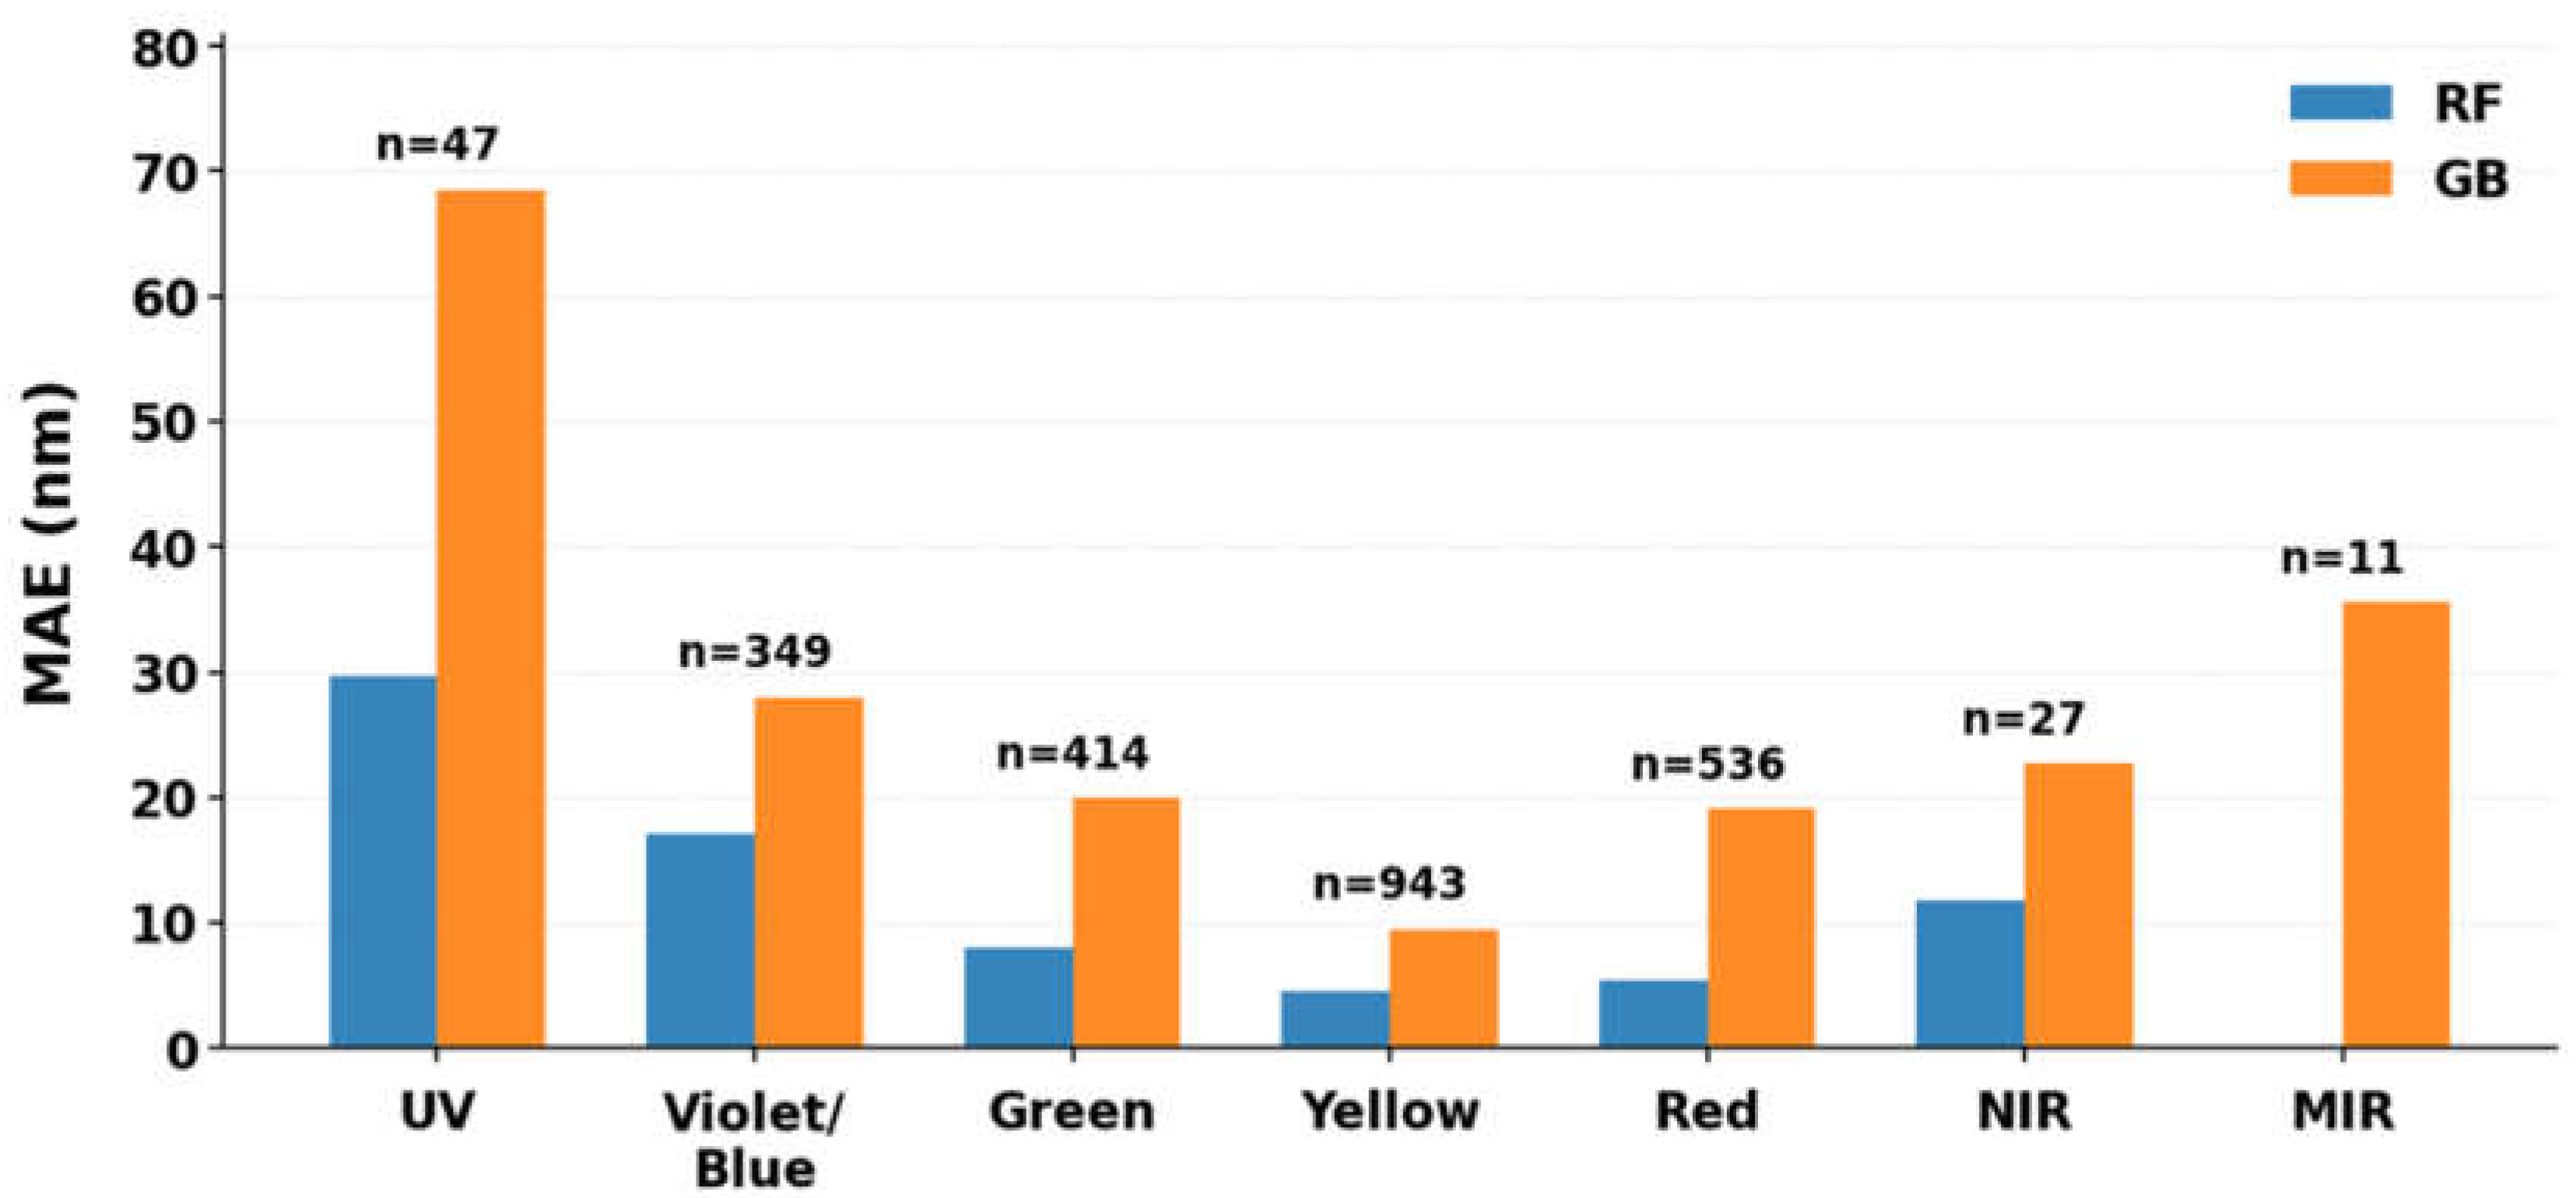
Figure 6.
SHAP-based interpretation of the optimized seven-descriptor RF model: (a) global feature importance ranked according to mean absolute SHAP values and (b) SHAP summary plot illustrating the magnitude and direction of individual descriptor contributions to predicted emission wavelength.
Figure 6.
SHAP-based interpretation of the optimized seven-descriptor RF model: (a) global feature importance ranked according to mean absolute SHAP values and (b) SHAP summary plot illustrating the magnitude and direction of individual descriptor contributions to predicted emission wavelength.
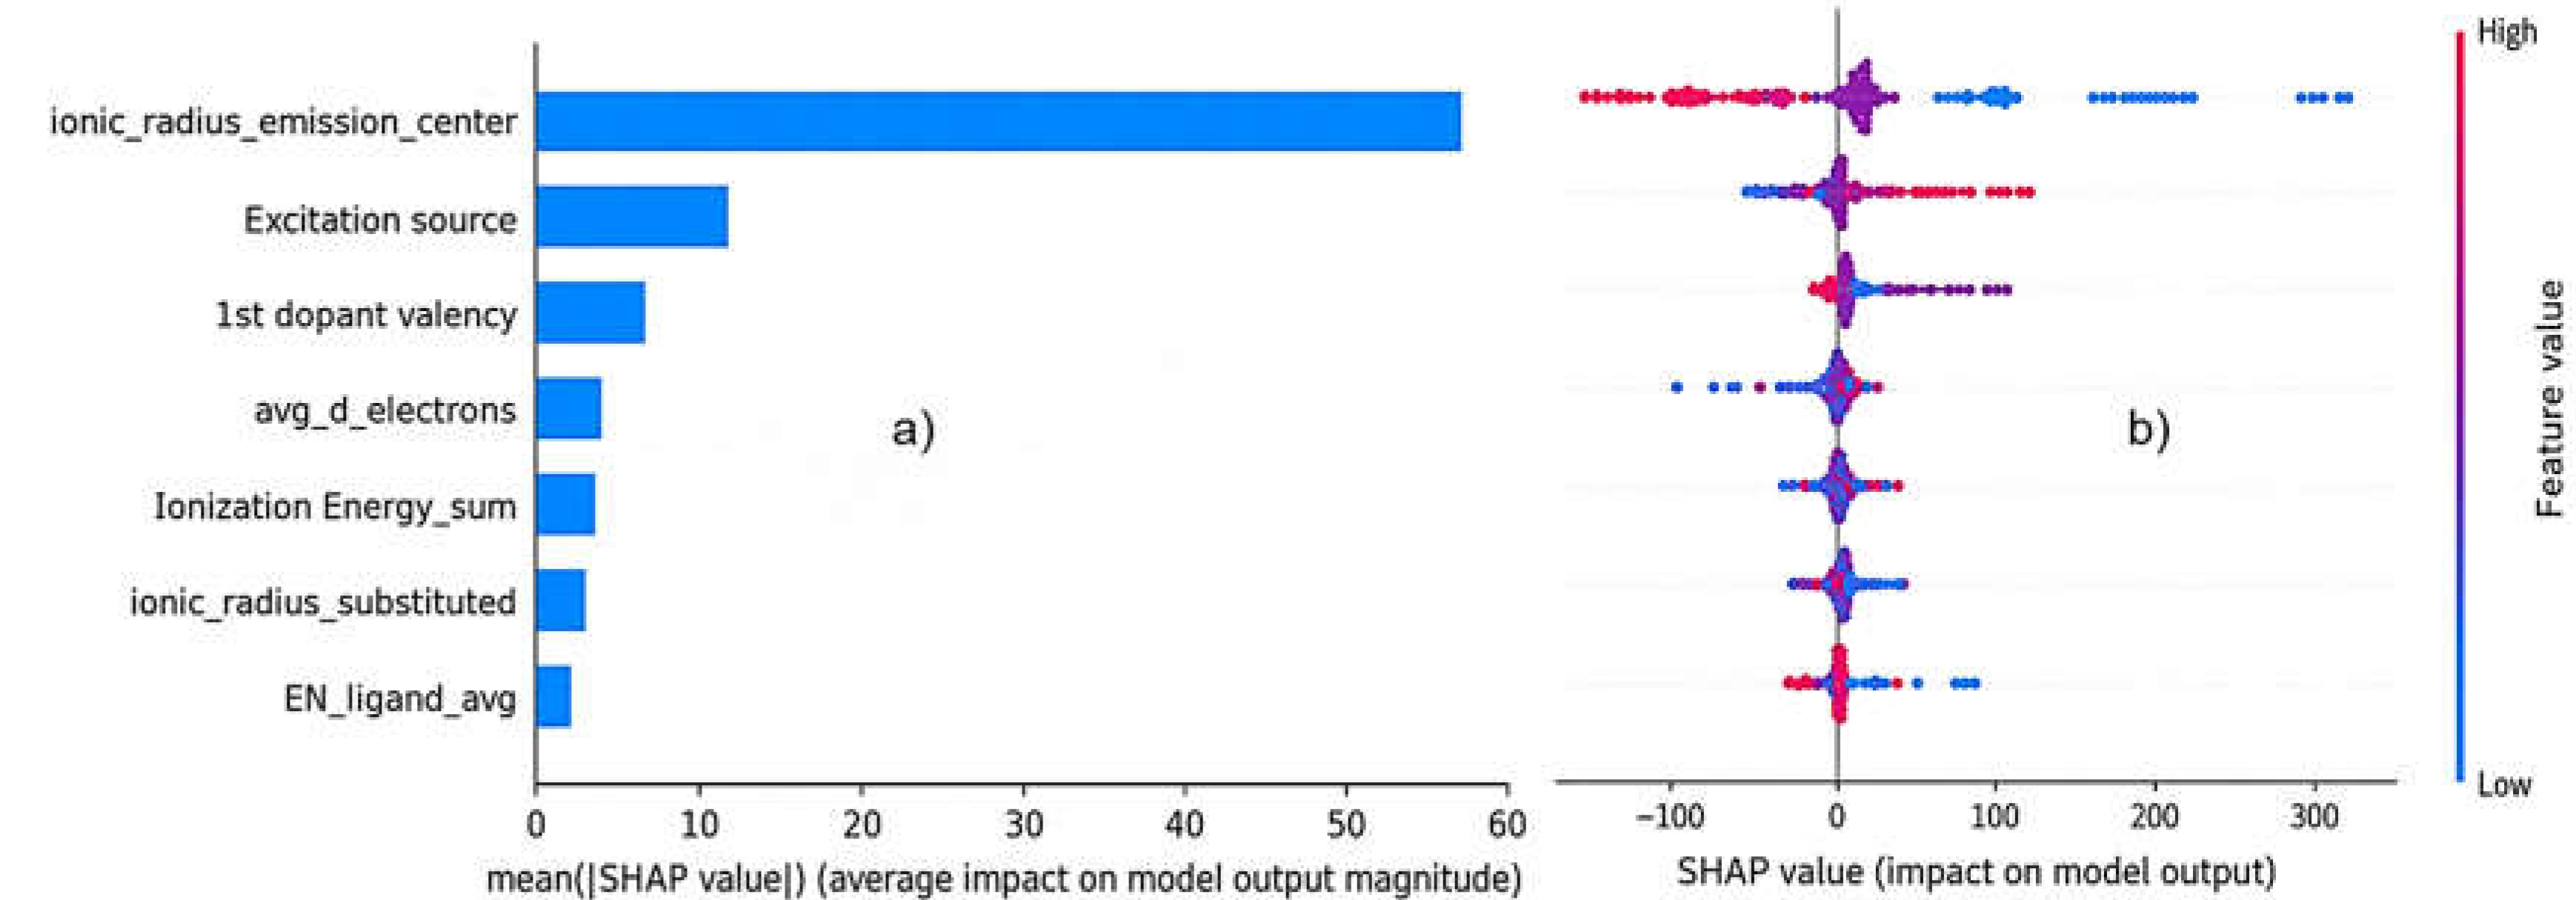
Figure 7.
Ablation analysis of ionic_radius_emission_center: (a) RF baseline (7 descriptors), (b) RF ablated (6 descriptors), (c) GB baseline (7 descriptors), and (d) GB ablated (6 descriptors). Predicted versus measured emission wavelengths are shown for the 10-fold cross-validation out-of-fold predictions.
Figure 7.
Ablation analysis of ionic_radius_emission_center: (a) RF baseline (7 descriptors), (b) RF ablated (6 descriptors), (c) GB baseline (7 descriptors), and (d) GB ablated (6 descriptors). Predicted versus measured emission wavelengths are shown for the 10-fold cross-validation out-of-fold predictions.
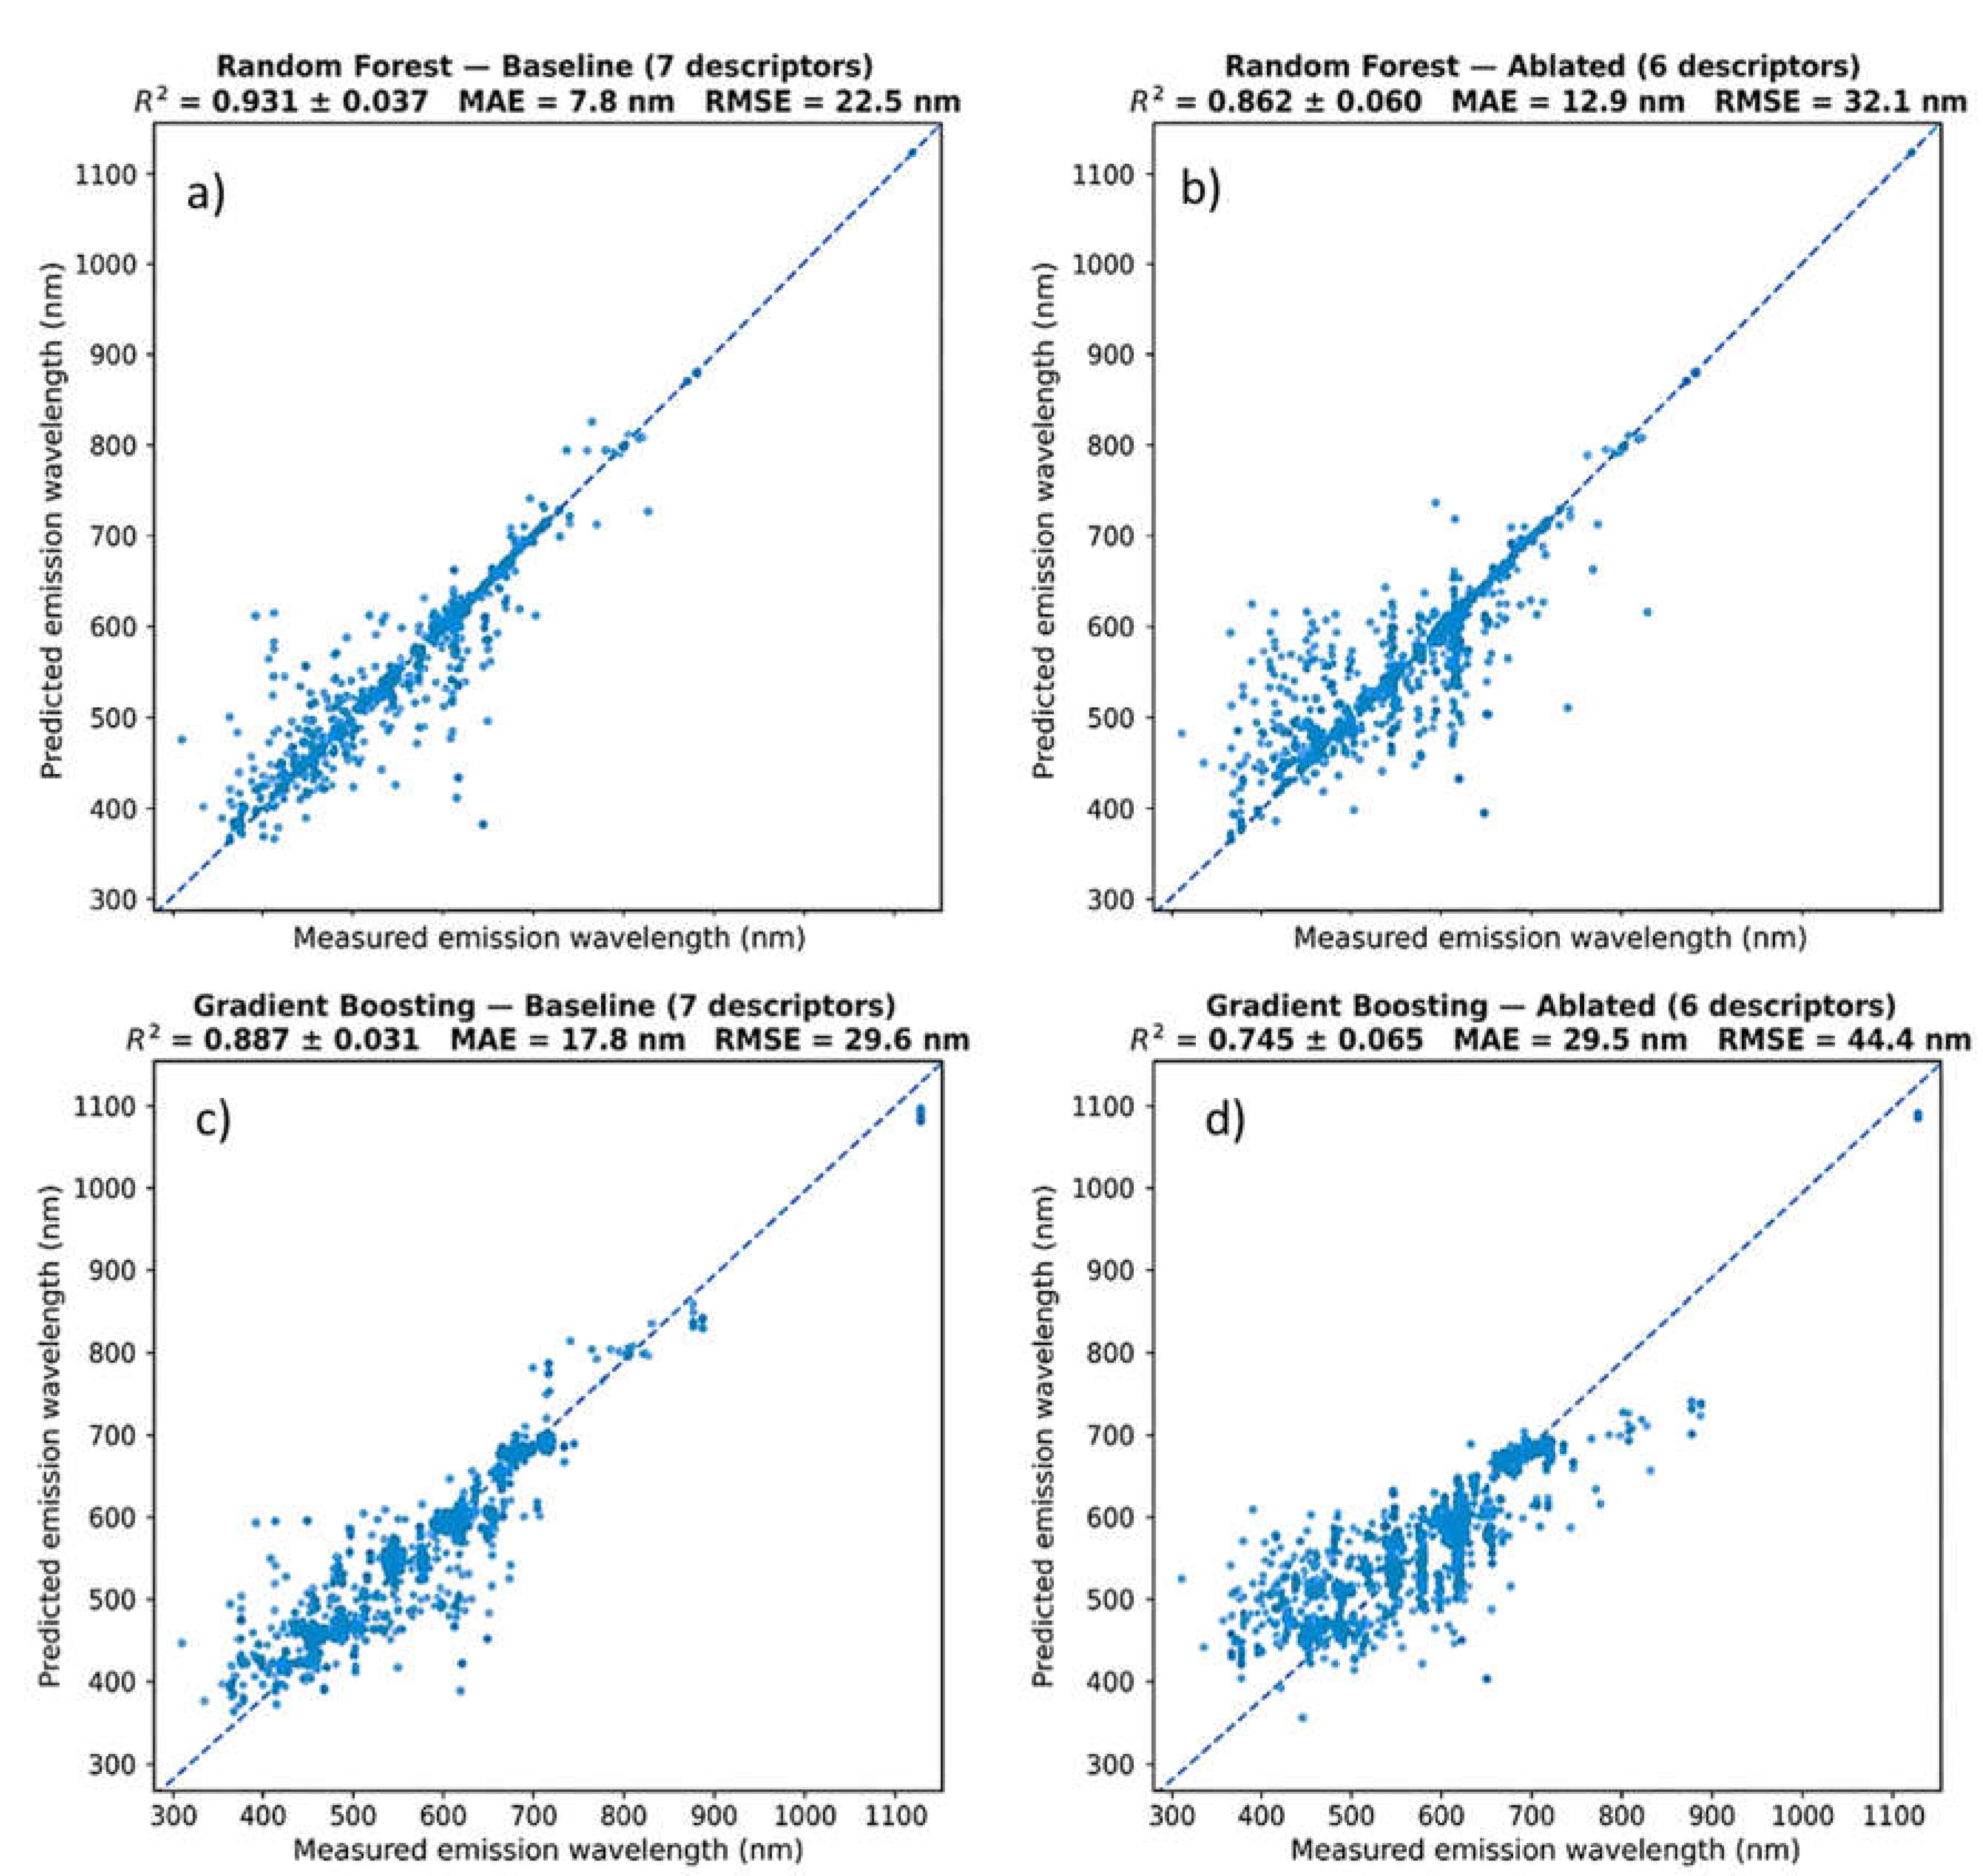
Figure 8.
SHAP interaction strength matrices for (a) the optimized seven-descriptor RF model and (b) the GB model evaluated using the same final seven-descriptor representation. Diagonal elements represent the main effects of individual descriptors, whereas off-diagonal elements indicate pairwise descriptor interactions.
Figure 8.
SHAP interaction strength matrices for (a) the optimized seven-descriptor RF model and (b) the GB model evaluated using the same final seven-descriptor representation. Diagonal elements represent the main effects of individual descriptors, whereas off-diagonal elements indicate pairwise descriptor interactions.
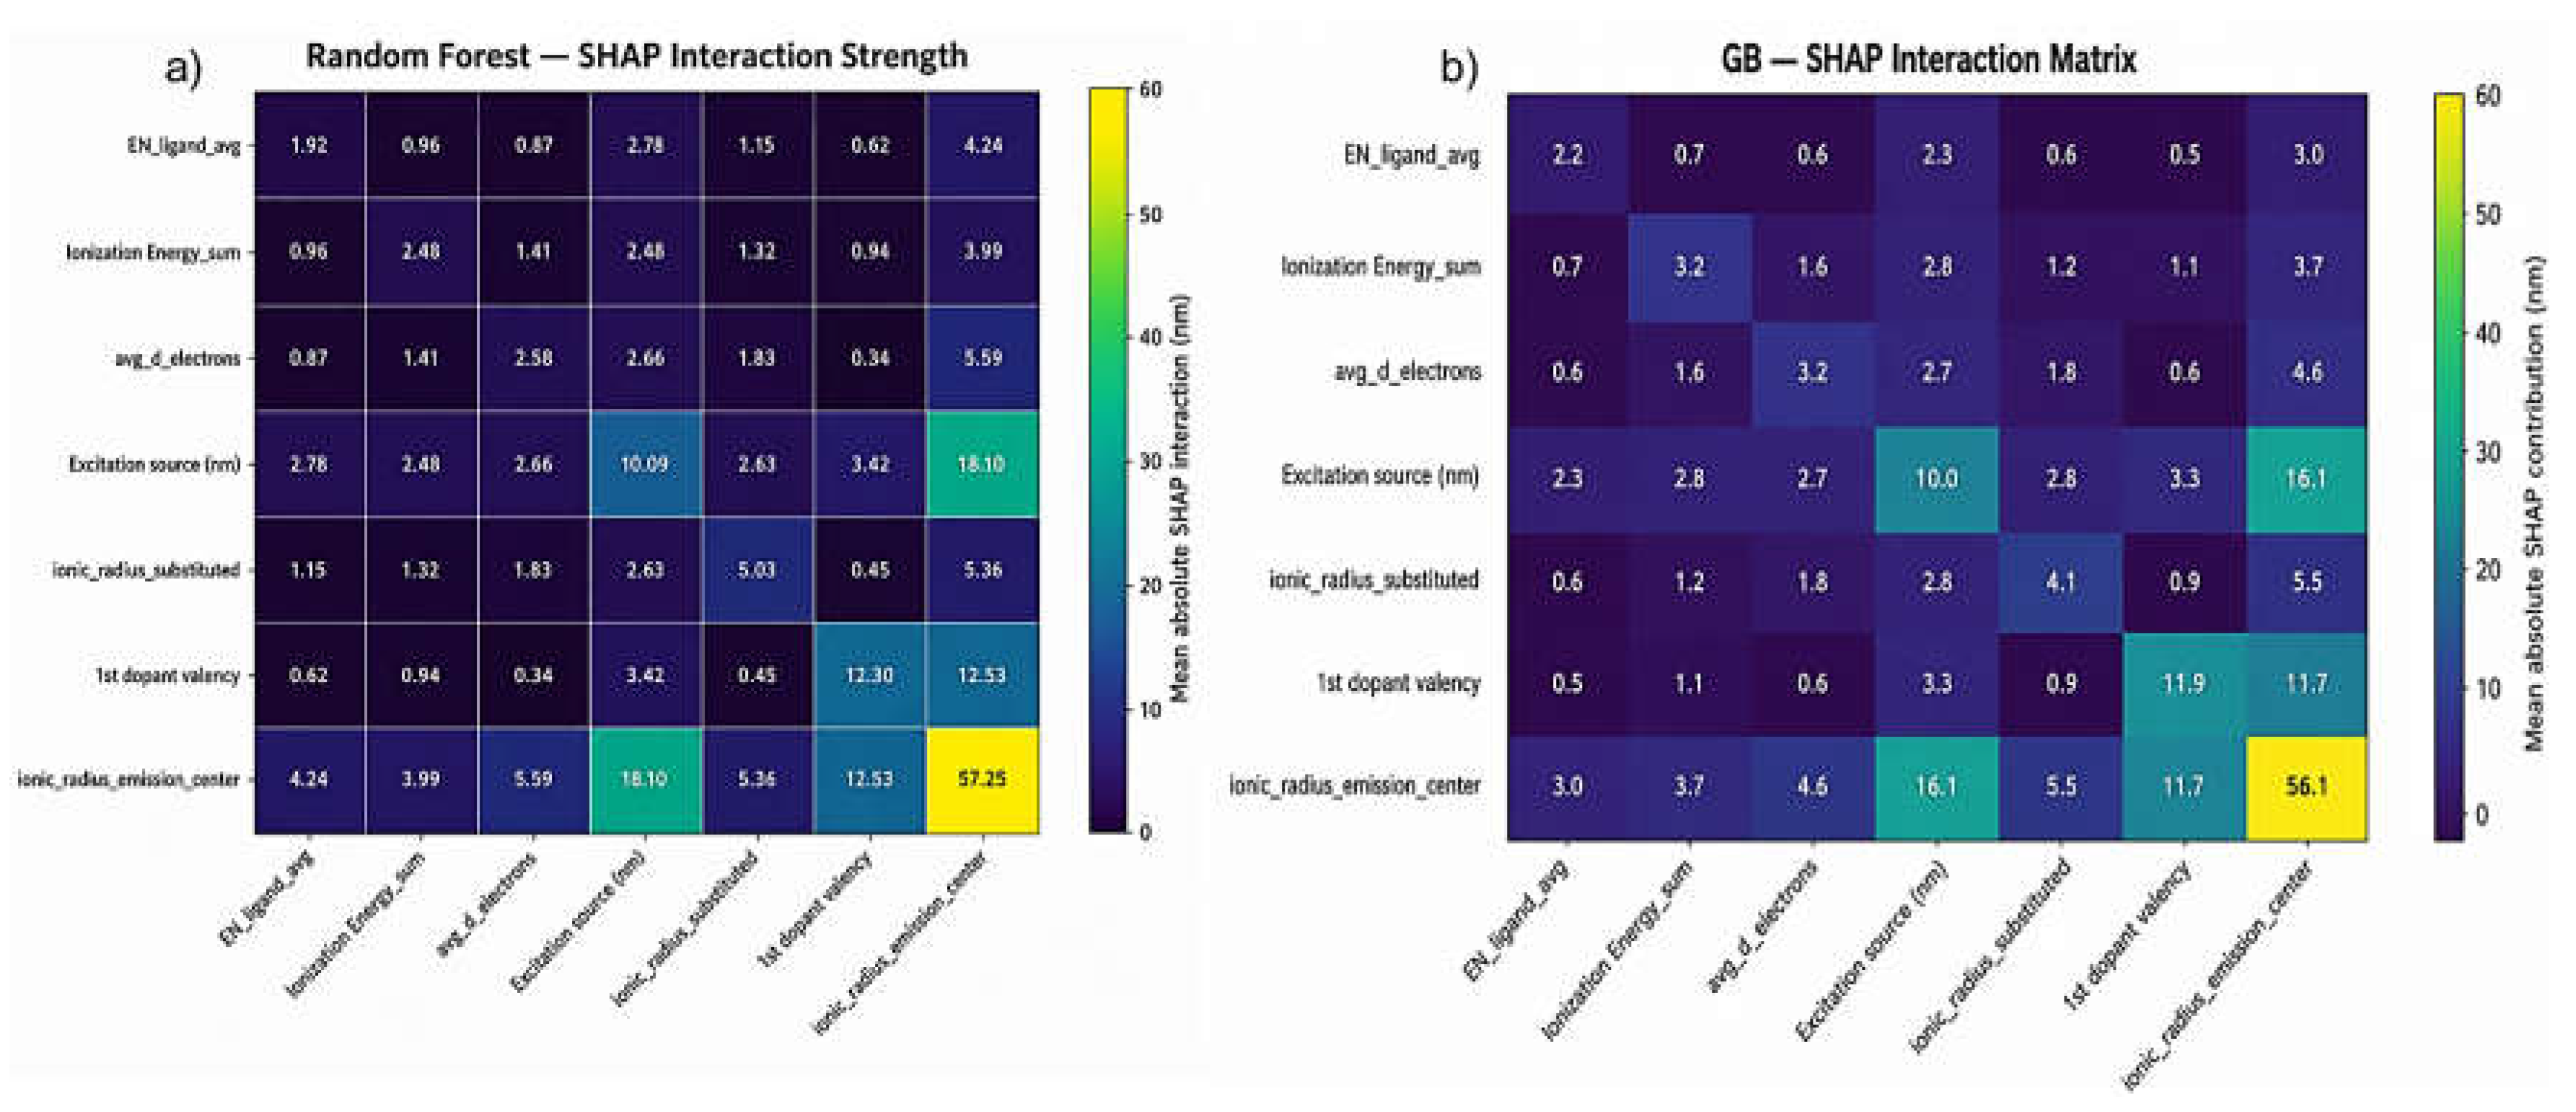
Figure 9.
Robustness of feature importance across complementary explainability methods for (a) the optimized seven-descriptor RF model and (b) the GB model evaluated using the same seven-descriptor representation. Normalized feature importance obtained from built-in impurity importance, permutation importance, mean absolute SHAP values, and drop-column ΔR2 consistently identifies ionic_radius_emission_center as the dominant descriptor, followed by excitation wavelength, supporting the robustness of the feature-importance interpretation across the two ensemble-learning architectures.
Figure 9.
Robustness of feature importance across complementary explainability methods for (a) the optimized seven-descriptor RF model and (b) the GB model evaluated using the same seven-descriptor representation. Normalized feature importance obtained from built-in impurity importance, permutation importance, mean absolute SHAP values, and drop-column ΔR2 consistently identifies ionic_radius_emission_center as the dominant descriptor, followed by excitation wavelength, supporting the robustness of the feature-importance interpretation across the two ensemble-learning architectures.
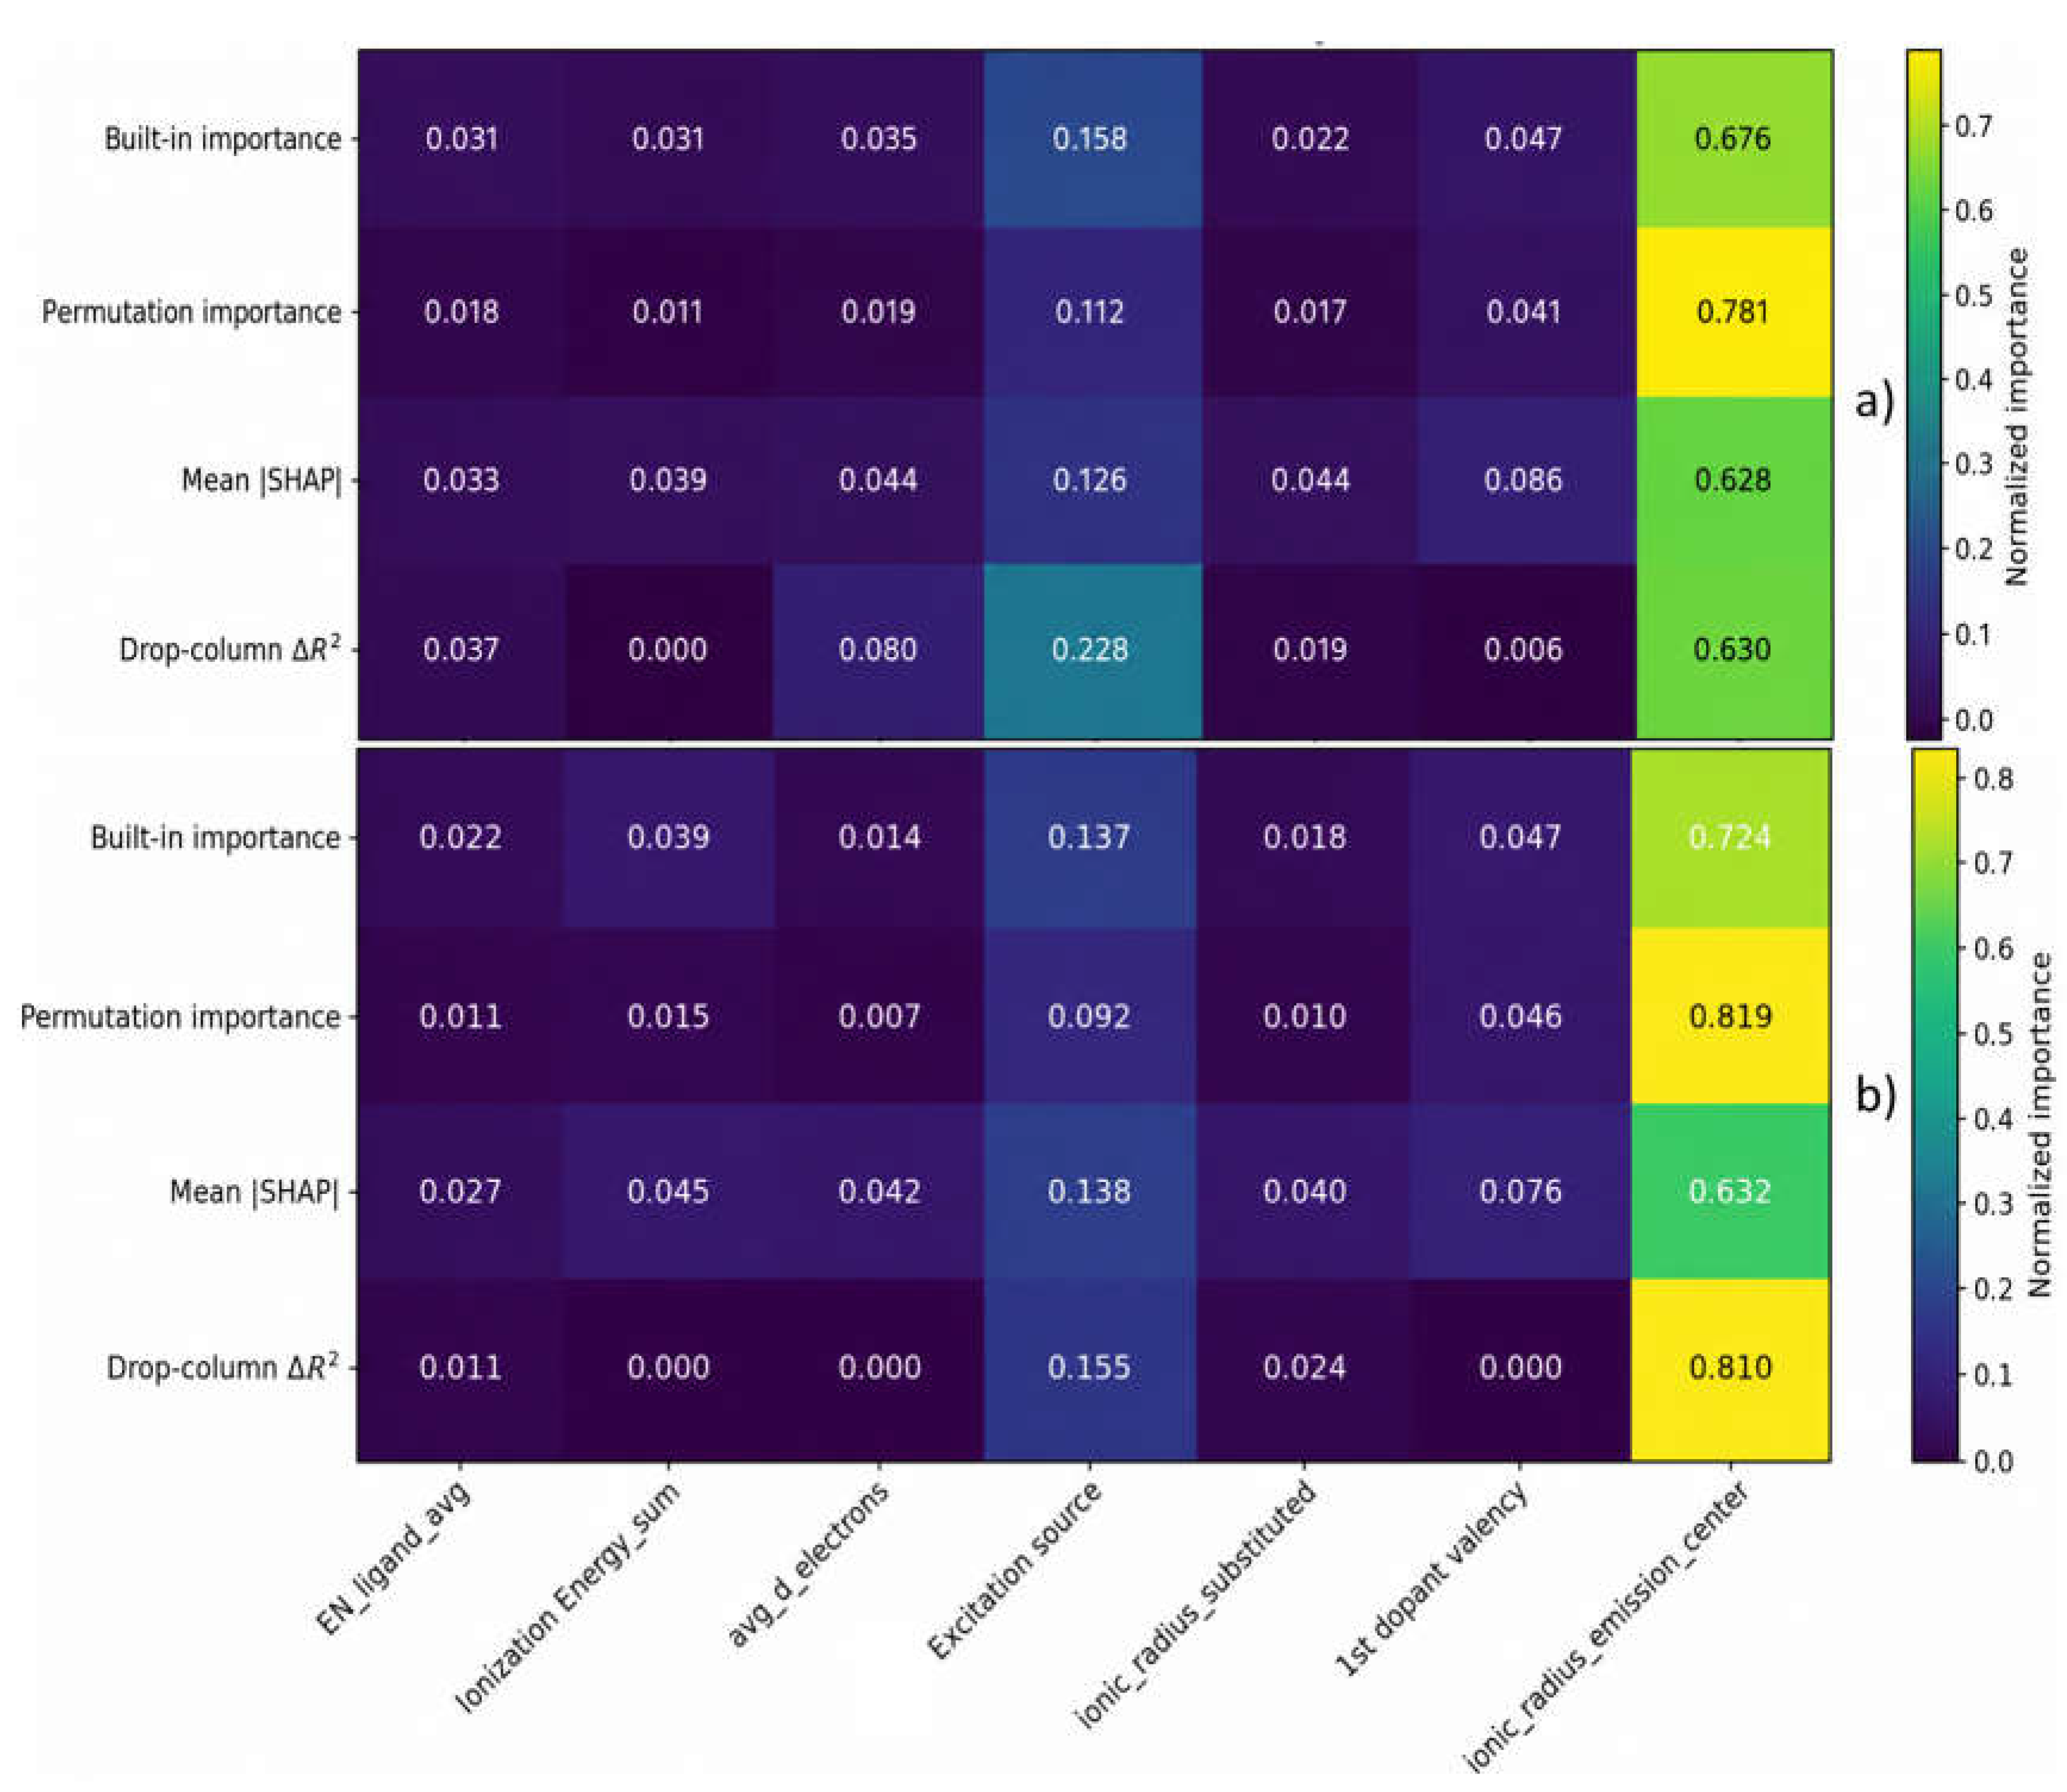
Figure 10.
Physics-guided screening workflow derived from the feature-selection, stability, explainability, and interaction analyses. The framework is intended as a model-informed strategy for prioritizing activator-site compatibility, electronic state, host chemical environment, and excitation conditions rather than as a deterministic causal synthesis rule.
Figure 10.
Physics-guided screening workflow derived from the feature-selection, stability, explainability, and interaction analyses. The framework is intended as a model-informed strategy for prioritizing activator-site compatibility, electronic state, host chemical environment, and excitation conditions rather than as a deterministic causal synthesis rule.
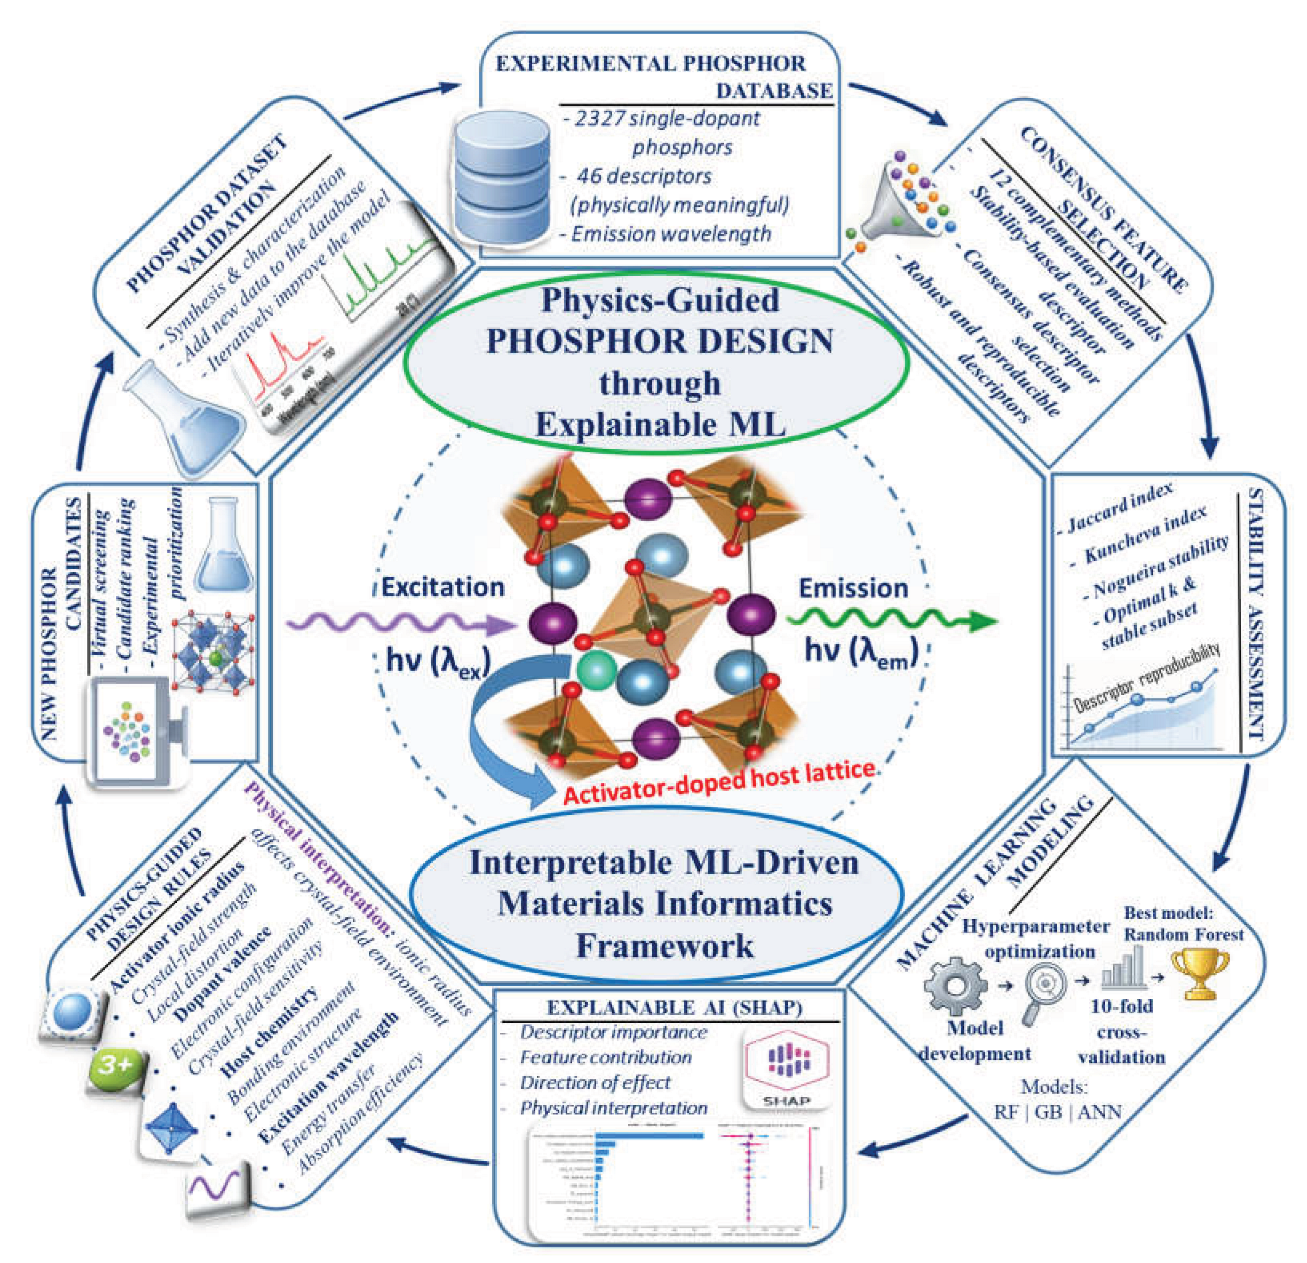

Table 1.
Summary of the phosphor dataset used in this study.
| PARAMETER | VALUE |
| Database | IPOP |
| Initial number of samples | 2363 |
| Samples after duplicate removal | 2327 |
| Initial descriptors | 125 |
| Physically meaningful candidate descriptors | 46 |
| Final selected descriptors | 7 |
| Target property | Emission wavelength (λem) |
| Descriptor generation | Matminer + pymatgen + feature-engineered physicochemical descriptors |
| Programming environment | Python 3.x |
| Machine-learning library | Scikit-learn |
| Explainability method | Shapley Additive Explanations (SHAP) |
| Validation strategy | 10-fold cross-validation + independent test set |
Table 2.
Data preprocessing workflow.
| STEP | DESCRIPTION | OUTPUT |
| Duplicate removal | Elimination of repeated phosphor compositions | 2363 → 2327 samples |
| Data partitioning | Random 80%/20% train-test split | Training and independent test sets |
| Descriptor refinement | Removal of non-informative, redundant, and mathematically engineered descriptors with limited direct physical interpretation | 46 physically meaningful candidate descriptors |
| Missing-value treatment | Median imputation fitted on training data only | Complete descriptor matrix |
| Feature scaling | Min-Max normalization fitted on training data only | Descriptor values scaled to [0,1] |
Table 3.
Feature selection methods employed.
| CATEGORY | METHOD | SELECTION CRITERION |
| Filter | ANOVA F-test | Statistical significance |
| Mutual Information | Nonlinear dependency | |
| Pearson Correlation | Linear correlation | |
| t-test | Welch t-statistic: high vs. low emission groups (training-fold median); ranked by |t| | |
| Wilcoxon | Wilcoxon rank-sum statistic: high vs. low emission groups (training-fold median); ranked by |statistic| | |
| Wrapper | Sequential Forward Selection (SFS) | Forward subset optimization |
| Sequential Backward Selection (SBS) | Backward subset optimization | |
| Recursive Feature Elimination (RFE) | Recursive elimination based on model importance | |
| Embedded | LASSO Regression | L1 regularization |
| Ridge Regression | L2 regularization | |
| Random Forest Importance | Tree-based importance | |
| Gradient Boosting Importance | Boosting-based importance |
Table 4.
Stability metrics used for descriptor reproducibility analysis.
| METRIC | PURPOSE |
| Jaccard Index | Similarity between selected descriptor subsets |
| Dice Similarity Coefficient | Degree of descriptor overlap |
| Hamming Similarity | Agreement between binary selected/not-selected representations |
| Kuncheva Index | Chance-corrected subset stability |
| Pearson PCC | Linear association between binary selection vectors |
| Spearman Correlation | Rank correlation between binary selection vectors |
| Kendall Correlation | Rank concordance between binary selection vectors |
| Nogueira Stability | Overall reproducibility of feature selection |
Table 5.
Principal hyperparameters optimized for each machine-learning model.
| MODEL | OPTIMIZED HYPERPARAMETERS |
| RF | Number of trees, maximum tree depth, minimum samples per split |
| GB | Number of estimators, learning rate, maximum tree depth |
| ANN | Number of hidden layers, neurons per layer, activation function, learning rate, batch size, number of epochs |
Table 6.
Direct comparison of mean 10-fold cross-validated performance of the compact seven-descriptor RF model with selected larger RF subsets.
Table 6.
Direct comparison of mean 10-fold cross-validated performance of the compact seven-descriptor RF model with selected larger RF subsets.
| Feature-selection method | k | R2 | MAE (nm) | RMSE (nm) | 10/10 reproducibility |
| Pearson/ANOVA-F | 7 | 0.9308 | 7.78 | 22.55 | Yes |
| T-test | 20 | 0.9345 | 7.80 | 21.80 | No |
| T-test | 24 | 0.9339 | 7.77 | 21.81 | Yes |
Disclaimer/Publisher’s Note: The statements, opinions and data contained in all publications are solely those of the individual author(s) and contributor(s) and not of MDPI and/or the editor(s). MDPI and/or the editor(s) disclaim responsibility for any injury to people or property resulting from any ideas, methods, instructions or products referred to in the content. |
© 2026 by the authors. Licensee MDPI, Basel, Switzerland. This article is an open access article distributed under the terms and conditions of the Creative Commons Attribution (CC BY) license.
Copyright: This open access article is published under a Creative Commons CC BY 4.0 license, which permit the free download, distribution, and reuse, provided that the author and preprint are cited in any reuse.