

Submitted:
21 August 2026
Posted:
25 August 2026
You are already at the latest version
Abstract
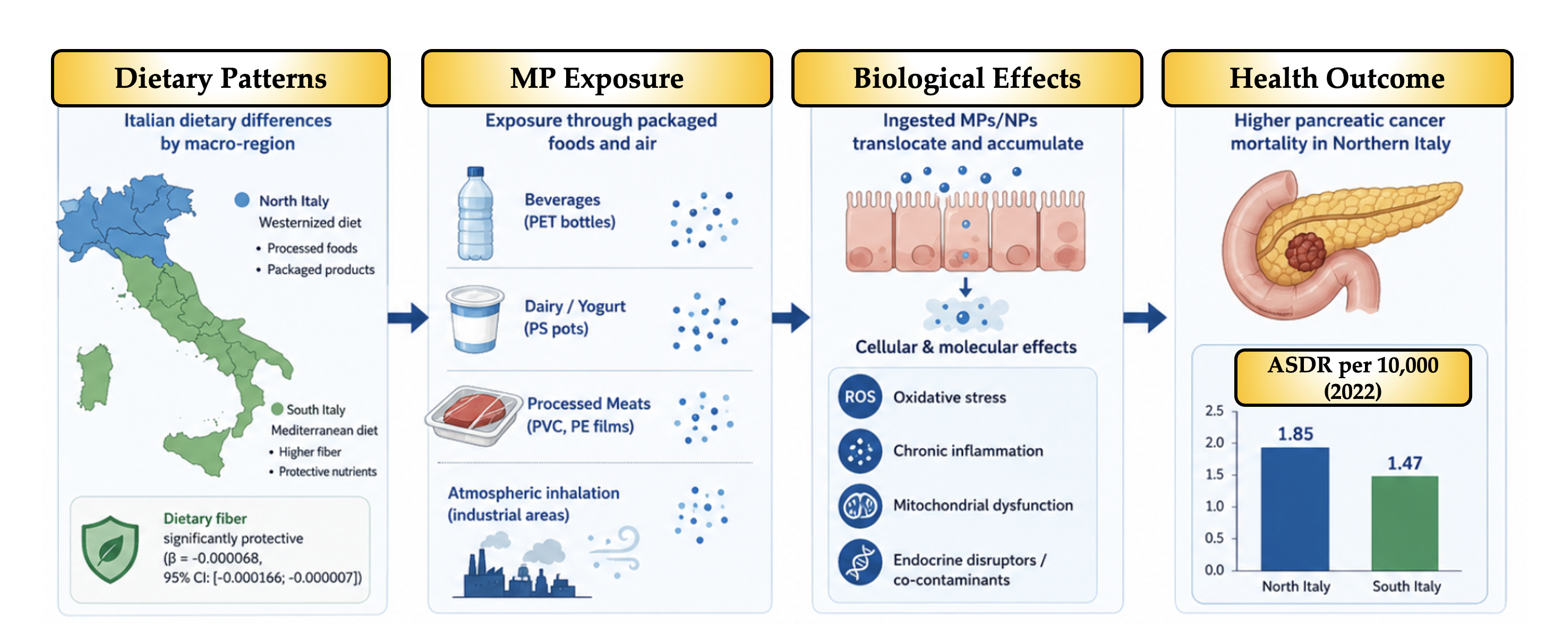
Pancreatic cancer (PC) mortality in Italy exhibits a persistent North–South macro-geographic gradient between 2003 and 2022, with significantly higher rates in northern regions. Whilst traditional risk factors partially explain this trend, the contribution of emerging dietary xenobiotics remains unexplored. This study presents an integrated ecological and ecotoxicological modelling framework combining long-term mortality rates, household dietary intake from ISTAT registries, and micro- and nanoplastic (MNP) exposure derived from the FOMIC-Py pyramid. Using robust linear models with 5,000-iteration bootstrap validation, we identified dietary fibre as a robust, independent protective factor against PC mortality. Conversely, higher regional reliance on packaged foods coupled with industrial airborne plastic deposition yields a 58.4% higher estimated annual MNP exposure in Northern Italy compared to Southern cohorts. Mechanistically, ingested plastics crossing the intestinal barrier can bioaccumulate in pancreatic tissue, inducing chronic oxidative stress, inflammation, and cellular dysfunction. Although ecological limitations preclude direct causality, this predictive exposure model establishes dietary plastics as plausible environmental cofactors modulating PC geographic disparities. These key findings highlight the dual importance of promoting high-fibre diets and mitigating single-use plastic exposure within food supply chains to address these emerging environmental cancer risks across European population cohort studies.
Keywords:
microplastics
; nanoplastics
; pancreatic cancer
; human ecotoxicology
; dietary exposure modelling
; geographic disparities
1. Introduction
Due to its intrinsic chemoresistance and late-stage detection, pancreatic cancer (PC)—which is primarily caused by pancreatic ductal adenocarcinoma (PDAC)—remains one of the most lethal tumours in worldwide incidence [1,2,3]. Over the past 20 years (2003–2022), there has been a consistent North–South macro-geographic gradient along with a gradual temporal rise in mortality. Standardized Mortality Ratios (SMRs) are consistently significantly greater in the northern regions than in the “Mezzogiorno” region (Southern Italy) [3]. PC includes a wide range of neoplasms, including endocrine (such as Pancreatic Neuroendocrine Tumour, PNET) and exocrine (such as PDAC). PDAC is the most prevalent and aggressive type (95% of cases). It is crucial to comprehend the genesis of these cancers, especially in consideration of potential dietary risk factors. In specific scenario of Italy, PC affects about 15,000 deaths annually. By 2040, the SMR, which is currently 1.78 per 10,000 individuals, is expected to rise to 1.92. ([3,4].
The significant geographic asymmetry strongly suggests the synergistic interaction of regional environmental determinants and dietary transitions that have not yet been fully characterised, even though as tobacco smoking, type II diabetes, and obesity—account for certain aspects of this variability. The traditional Mediterranean diet, which is naturally abundant in dietary fibre, natural antioxidants (including vitamin C), and selenium, has historically benefitted communities in Southern Italy. Conversely, Northern Italy has experienced a significant nutritional shift toward Westernised dietary habits, characterised by increased intake of processed meats, ultra-processed foods, and sugar-sweetened non-alcoholic drinks (NaD) [5,6,7]. Although the ethology of PC is still poorly understood, a wide range of risk factors have been identified. Tobacco use, diabetes, obesity, ethnicity, genetic risk, family history, occupational exposure (such as Ni, Cd, and As), Helicobacter pylori infection, and chronic pancreatitis are some of these [6]. A diet high in sugary foods, lipids, red meat, and processed meat may raise the risk of PC, according to studies on dietary patterns. By reducing chronic hyperinsulinemia and modifying the intestinal mucosal barrier, dietary fibre has a statistically significant, independent protective impact against PC mortality, according to robust linear regression models (RLM) using the Huber T-norm. Concurrently, dietary intake of foods packaged or stored in synthetic polymeric containers is strongly positively correlated with PDAC mortality, granular studies of household food expenditure matrices [8,9].
Microplastics (MPs) and nanoplastics (NPs) have emerged as a significant risk to worldwide public health in recent years due to their widespread presence in the food supply chain and broader ecosystems. Every day, humans are exposed to hundreds of thousands of plastic particles through the consumption of contaminated food, drinking water, and dust in the air. After crossing through the gastrointestinal barrier, these xenobiotics may migrate through the portal vein into the circulatory system, travel to distant organs, and bioaccumulate in deep tissues including the pancreatic parenchyma. According to recent studies, MNPs can transport adsorbed hydrophobic chemical contaminants (such persistent organic pollutants-POPs and polycyclic aromatic hydrocarbons-PAHs) directly into target cellular structures, acting as "non-genotoxic carcinogens" or cancer promoters [10,11,12,13]. Oral exposure to common polymers, such as polyethylene terephthalate (PET) and polystyrene (PS), has been demonstrated in studies using animal models and human cell lines to induce significant oxidative stress (OS) and a significant inflammatory immunological response in pancreatic tissue. PET exposure dose-dependently modifies the expression of cytokines, chemokines, and immune-cell markers in the pancreas at the transcriptome level, generating metabolic abnormalities, insulin resistance, and mitochondrial dysfunction similar to those observed in the pathophysiology of diabetes. Furthermore, a long-term accumulation of MNPs may serve as foreign niduses that promote the formation of stones inside the pancreatic ducts, leading to tissue fibrosis and ductal obstruction. It has also been demonstrated to increase the severity of acute and chronic pancreatitis, a recognised clinical precursor to PC [12,13,14,15].
By combining food expenditure data plastic exposure vectors, the spatial variation in Italian PDAC mortality interpreted in the framework of this toxicological paradigm. The inhabitants of the highly industrialised densely populated Northern regions (especially the Po Valley) are exposed to high levels of single-use plastics from food packaging (i.e., PS yoghurt pots, polyvinyl chloride-PVC films for meats, and PET bottles for soft drinks/NaD) in conjunction with higher levels of airborne MP inhalation. Conversely, the higher baseline consumption of food products in Southern Italy substantially minimises the systemic absorption and subsequent toxicity of MNPs due to the protective physiological effects of dietary fibre and selenium (which preserve the integrity of the gut barrier and accelerate the aforementioned excretion of MPs in the stool) [16,17,18,19].
Understanding the real health risks of MNPs requires a paradigm shift from observational clinical epidemiology to mechanistic human ecotoxicology. Non-linear absorption, distribution, metabolism, and excretion (ADME) pathways control the toxicological kinetics of ingested particles in the human body, which acts as a complex sink. Human ecotoxicology concentrates on the cellular and molecular interactions of MNPs rather than trying to identify direct clinical connections to putative systemic diseases, which are yet poorly characterised and clinically unproven. MPs < 10 μm may migrate across the intestinal mucosal barrier ingestion by either active persorption by microfold (M) cells in Peyer's patches or paracellular transit. This translocation sets off a series of physical and chemical stressors at the cellular level, such as localised oxidative stress brought on by the production of reactive oxygen species (ROS), disruption of tight junction proteins (such as occludin and ZO-1), and subsequent systemic pro-inflammatory reactions [3,5,7].
Assessments require the use of accurate demographic consumption data in order to establish these ecotoxicological processes in actual exposure scenarios. The Italian National Institute of Statistics (ISTAT) provides extensive temporal data on household spending and consumption amounts, particularly monitoring the shift toward highly processed and packaged food categories. Bypassing the constraints of extensive environmental monitoring, a statistically valid framework of human dietary intake could be developed by combining quantitative ISTAT registries on packaged food consumption with empirical contamination matrices [7,20,21,22,23].
This study presents an ecological exposure modelling framework integrating regional dietary habits, estimated dietary MP exposure, and PC mortality patterns across Italy. The aim is to identify geographic exposure gradients and generate biologically plausible hypotheses for future individual-level investigations. By combining long-term ecological trends in PC mortality (2003–2022), regional dietary consumption patterns, and environmental exposure estimates derived from the Food Microplastic Pyramid (FOMIC-Py), the study explores whether regional differences in mortality may be partially explained by differential dietary exposure to MNPs, in addition to established dietary determinants [3,57]. Using an integrated epidemiological, nutritional, and toxicological approach, this framework provides novel insights into the potential role of dietary MNPs as environmental cofactors in pancreatic carcinogenesis and establishes a foundation for future prospective studies incorporating human biomonitoring and individual exposure assessment. [7,20,21,22,23].
2. Materials and Methods
In order to evaluate the connection between regional macro-geographic and PC mortality in this study utilises an ecological, multi-level analytical approach. Ac-cording to the conceptual model, long-term temporal trends, geographic context, and modifiable dietary exposures determine regional SMRs for PC, which are expressed as rates per 10,000 inhabitants and obtained from the ISTAT for the period from 2003–2022. This methodology is designed under the epidemiological assumption that cross-sectional food patterns correspond to stable, long-term regional habits of the target populations as pancreatic carcinogenesis has a lengthy latency period [3,7,21,22,23].
The 2016 ISTAT Computer Personal Interview survey, of 19,500 family household size: 2.32 ± 0.15 persons) across 540 municipalities, or equivalent to 6.3% of all Italian municipalities, provided household food spending data for 56 different food categories in order to carry out this framework. Individual nutritional intakes, including macro- and micronutrients such as proteins, fats, carbohydrates, vitamins (A, C, D, E, and B-complex), and minerals (Ca, Na, and Se), were estimated as daily per capita values using official food composition databases from the National Research Institute for Food and Nutrition (INRAN, formerly NRIFN). Household expenditures were converted into physical annual volumes (kg/year) using standardised price coefficients. The 20 Italian regions were categorised regional clusters Central, Southern/Insular regions) for comparison analysis in order to evaluate spatial differences. Furthermore, sophisticated robust regression approaches were employed to adjust for the unique limitations of ecological data, such as spatial autocorrelation and leverage points, in order to connect these 2016 regional dietary proxy profiles with the 2003–2022 PC-SMR trajectories. This guaranteed methodological validity across temporal, regional, and dietary analytical levels [7,21,22,23].
2.1. Temporal Trend Model
To characterize the secular evolution of PC mortality over the study period, we specify a linear temporal trend model: Eq. 1
where ASDRit represents the age-standardized death rate for region i at time t, β0 denotes the intercept, β1 quantifies the annual absolute rate of change in mortality, and εit represents the stochastic error term.
To facilitate epidemiological interpretation, the Annual Percent Change (APC) is derived from the trend coefficient as follows: Eq. 2
where n represents the number of years in the study period.
The statistical framework was improved to include quantitative consumption statistics of packaged and industrial foods recorded by ISTAT in order to establish a highly localised and demographically accurate exposure profile. In particular, the most recent ISTAT multi-purpose surveys on household consumption patterns were used to obtain national food consumption rates (ISTAT, in kg/person/year), which were then categorised by processing level and regional distribution (Northern vs. Southern Italy). As the main predictor variable, these national consumption rates were incorporated straight into the Bayesian hierarchy. The framework represents the actual socioeconomic exposure to packaged items, which are strongly connected to technogenic polymer migration, by replacing general dietary assumptions with the empirical ISTAT consumer registry [21].
2.2. Regional Disparity Model
To quantify macro-geographic mortality disparities, the temporal model is extended with a regional indicator variable: Eq. 3
where Northi is a binary variable indicating the macro-geographic classification of the region. The coefficient β2 estimates the mean mortality difference between the two geographic zones, controlling for temporal trends. The magnitude of this disparity is standardized using Cohen's d: Eq. 4
where Spooled is the pooled standard deviation of the two groups.
2.3. Multivariate Dietary Determinant Model
For the cross-sectional analysis of dietary determinants, we specify a multivariate linear regression model: Eq. 5
where the predictors represent the regional per-capita consumption estimates for alcohol, dietary fibre, selenium (Se), and vitamin C, respectively. Under classical assumptions, the model is initially estimated using Ordinary Least Squares (OLS), yielding the Best Linear Unbiased Estimators (BLUE): Eq. 6
with the variance-covariance matrix defined as Var(βOLS )=σ2(X' X)-1
2.4. Robust Regression Methodology
Standard OLS estimators are highly sensitive to outliers and significant data due to the inherent limitations of ecological studies with small cross-sectional sample sizes. We utilise RLM regression with the Huber T-norm to guarantee statistical validity. Large residual observations are automatically minimised by this approach without being excluded from the dataset.
Huber T-Norm and IRLS Algorithm
The Huber loss function ρk(u) is defined as a piecewise function combining quadratic and linear penalties: Eq. 7
here k is a tuning constant (typically 1.345 for 95% asymptotic efficiency under normality). The corresponding influence function Ψk (u) is the derivative of ρk(u).
Parameter estimates are obtained via Iteratively Reweighted Least Squares (IRLS), where observation weights ωi are updated at each iteration: Eq. 8
The robust coefficients are then computed as βRLM= (X'WX)-1X'Wy, where W is the diagonal weight matrix.
2.5. Bootstrap Confidence Intervals
To provide robust inference that does not rely on strict distributional assumptions, we employ a non-parametric bootstrap procedure with a large number of iterations (B= 5,000). For each iteration b ∈ {1,…,B} a bootstrap sample is drawn with replacement, and the regression coefficients are estimated. The empirical distribution of these estimates is used to construct the 95% Bootstrap Confidence Intervals: Eq. 9
Statistical significance is determined by assessing whether the resulting confidence interval excludes the null value of zero.
2.6. Diagnostic Testing Framework
A comprehensive suite of diagnostic tests is applied to validate the underlying assumptions of the regression models:
2.6.1. Multicollinearity Variance Inflation Factor (VIF)
Multicollinearity among predictors is assessed using the Variance Inflation Factor (VIF): Eq. 10
where Rj2 is the coefficient of determination from regressing predictor j on all other predictors. Standard methodological thresholds (i.e., VIF < 5) are used to evaluate the severity of collinearity.
2.6.2. Heteroscedasticity Breusch-Pagan Test
The Breusch-Pagan Lagrange Multiplier (LM) test evaluates the null hypothesis of homoscedasticity: Eq. 11
If heteroscedasticity is detected, HC3 robust standard errors are employed to ensure valid hypothesis testing.
2.6.3. Normality Shapiro-Wilk Test
The normality of the model residuals is evaluated using the Shapiro-Wilk W statistic, which tests the null hypothesis that the data are drawn from a normal distribution.
2.6.4. Influential Observations Cook’s Distance
The influence of individual observations on the regression coefficients is quantified using Cook's Distance: Eq. 12
Observations exceeding the standard threshold of $D > 4/n$ are flagged as highly influential, justifying the application of the robust regression methodology described in Section 2.4.
2.7. Model Evaluation and Comparison
Model fit and explanatory power are evaluated using the Coefficient of Determination (R2), Adjusted R2, and the Akaike Information Criterion (AIC). To quantify the stability of the estimates against influential observations, the percentage change between OLS and RLM coefficients is calculated: Eq. 13
2.8. Sensitivity Analysis and Exposure Uncertainty
A deterministic sensitivity analysis was carried out to take parameter uncertainty into consideration in regional MP/NP exposure estimations obtained from the FOMIC-Py framework. Three migration stages were used to assess exposure scenarios: conservative (lower-bound polymer leaching rates), baseline (mean leaching rates determined from literature), and worst-case (upper-bound leaching under significant thermal/mechanical degradation). Additionally, the Po Valley and Southern cohorts' model stability was analysed in regard to differences in atmospheric deposition rates across rural and industrial zones.
2.9. Statistics Software
All statistical analyses and data visualizations were performed using Python. The statsmodels library was utilized for regression modeling, robust estimation, and diagnostic testing, while scipy was employed for non-parametric tests and probability distributions. Data manipulation was conducted using pandas and numpy, and graphical representations were generated using `matplotlib` and `seaborn`.
3. Results
3.1. Temporal Trends in PC Mortality (2003 – 2022)
Analysis of 380 region-year observations revealed a statistically significant increasing trend in pancreatic cancer mortality across Italian regions over the 20-year study period. The temporal trend model yielded a positive annual rate of change (β1= 0.0118, p< 0.001), indicating that age-standardized death rates increased by approximately 0.012 units per 10,000 population annually, as illustrated in Figure 1. This corresponds to an overall increase of 0.236 units over the two-decade period, representing a 16.2% rise from baseline mortality levels.
The 95% confidence intervals around the yearly means demonstrated consistent upward trajectory with minimal overlap between early (2003-2007) and late (2018-2022) periods, confirming the robustness of this temporal trend. Notably, the model's coefficient of determination (R2= 0.056) indicates that while the trend is statistically significant, temporal factors alone explain only a modest proportion of the total variance in PC mortality, suggesting that additional regional and dietary factors contribute substantially to observed mortality patterns.
3.2. Regional Disparities: North–South Divide
Stratified analysis by geographic region revealed pronounced mortality disparities between Northern and Southern Italy. Northern regions (n= 7 regions, 140 region-year observations) exhibited substantially higher pancreatic cancer mortality rates (mean ASDR= 1.854, SD= 0.166, median= 1.875) compared to Southern regions (n= 12 regions, 240 region-year observations; mean ASDR= 1.472, SD= 0.247, median= 1.480), as illustrated in Figure 2.
The multivariate model controlling for temporal trends confirmed that Northern regions experienced significantly higher mortality rates (βNorth= 0.3821, p< 0.001), rep-resenting a 26.0% elevation relative to Southern regions. The effect size, quantified using Cohen's d, was 1.81, indicating a very large magnitude of difference between the two geographic zones. This disparity remained consistent throughout the study period, with the North-South gap averaging 0.382 units annually. The forest plot analysis of regional variation in 2022 (Figure 3) further elucidated these geographic patterns. Among the highest-mortality regions, Friuli Venezia Giulia (2.17 per 10,000), Sardinia (2.05), and Liguria (1.97) predominated, while Calabria (1.33) and Campania (1.42) exhibited the lowest rates. Notably, six of the seven highest-mortality regions were located in Northern Italy, with Sardinia representing a notable exception among Southern regions, potentially reflecting unique genetic and environmental characteristics of this island population.
The regional distribution of pancreatic cancer mortality in 2022 is illustrated in Figure 4, which displays the age-standardized death rates for all 20 Italian regions (19, because we unified Piedmont with Valle d’Aosta), colour-coded by geographic zone (blue for Northern regions, red for Southern regions). The bar chart clearly demonstrates the North-South gradient, with Northern regions predominantly occupying the upper ranks of mortality. The highest mortality rate was observed in Friuli Venezia Giulia (2.17 per 10,000), followed by Sardinia (2.05) and Liguria (1.97), while the lowest rates were recorded in Calabria (1.33) and Campania (1.42). This visual representation reinforces the quantitative findings presented above and highlights the geographic clustering of high-mortality regions in Northern Italy.
3.3. Dietary Determinants: Robust Regression Analysis
3.3.1. Model Specification and Fit
Cross-sectional analysis of dietary determinants using 2022 data (n= 19 regions) employed RLM regression with Huber T-norm to address the influence of outlier observations. The robust regression model demonstrated strong explanatory power, accounting for 65.6% of the variance in PC mortality (R2= 0.6564), comparable to the OLS model (R2= 0.6577). The final robust regression equation was specified as: Eq. 14
3.3.2. Main Finding: Protection Effect of Dietary Fibre
Bootstrap confidence intervals (5,000 iterations) revealed that dietary fibre was the only dietary factor demonstrating a statistically significant protective association with PC mortality (β= -0.000079, 95% CI: [-0.000166, -0.000007]). The confidence interval excluded zero across all bootstrap iterations, confirming the robustness of this finding despite the small sample size. In practical terms, each 10,000 g/year increase in regional fibre consumption was associated with approximately 0.79 units decrease in ASDR per 10,000 population. This protective effect remained significant after controlling for alcohol, Se, and vitamin C intake, and after downweighting the influence of the outlier region (Molise) through robust regression methodology. The bivariate correlation analysis supported this finding, demonstrating a moderate negative correlation between fibre intake and ASDR (Pearson r= -0.533, Figure 5b). The scatter plot revealed a discernible inverse relationship, with regions exhibiting higher fiber consumption generally showing lower mortality rates.
3.3.3. Secondary Findings: Non-Significant Associations
Alcohol consumption demonstrated a positive but statistically non-significant association with PC mortality (β= 0.000104, 95% CI: [-0.000004, 0.000236]). While the confidence interval marginally included zero, the point estimate suggested a potential positive association, with each 10,000 g/year increase in alcohol consumption corresponding to approximately 1.04 units increase in ASDR. The bivariate correlation was moderate and positive (r= 0.578, Figure 5a), indicating that alcohol and mortality were associated in simple correlation analysis, but this association was attenuated in the multivariate model after controlling for other dietary factors. Se intake suggests a negative but non-significant association (β= -0.000013, 95% CI: [-0.000046, 0.000017]). Despite a strong bivariate correlation with ASDR (r= -0.68), selenium's independent effect was not statistically significant in the multivariate model, likely reflecting collinearity with fibre intake (Spearman r= 0.40) and the limited sample size. Vitamin C intake demonstrated a positive but non-significant association (β= 0.000007, 95% CI: [-0.000004, 0.000021]). This counterintuitive finding may reflect the high correlation between vitamin C and fibre intake (Spearman r= 0.76), suggesting that regions with fibre-rich diets also tend to have higher vitamin C consumption, making it difficult to disentangle their independent effects in the ecological analysis.
3.3.4. Standardized Coefficients and Effect Sizes
To facilitate comparison across dietary factors with different measurement scales, standardized regression coefficients were computed (Figure 6). The analysis revealed that alcohol exhibited the largest standardized effect size (β= +0.576, p< 0.001 in OLS), followed by fibre (β= -0.478, p< 0.01), Se (β= -0.253, ns), and vitamin C (β= +0.404, p< 0.05). However, bootstrap validation indicated that only fibre maintained statistical significance when accounting for sampling variability and influential observations.
3.4. Diagnostic Tests and Model Validation
3.4.1. Multicollinearity Assessment
VIF analysis confirmed the absence of problematic multicollinearity among dietary predictors. All VIF values remained well below the conventional threshold of 5.0: alcohol (VIF= 1.60), fibre (VIF= 2.38), Se (VIF= 2.30), and vitamin C (VIF= 2.37), as illustrated in Figure 7. This indicates that the predictors provided independent information to the model, supporting the validity of the multivariate regression approach.
3.4.2. Homoscedasticity Testing
The LM test confirmed the assumption of homoscedasticity (LM= 2.5997, p= 0.6269), indicating that the variance of residuals was constant across fitted values. This finding supported the use of standard OLS estimation without robust standard errors, as heter-oscedasticity was not detected (Figure 8).
3.4.3. Normality of Residuals
The LM The Shapiro-Wilk test confirmed the normality of model residuals (W= 0.9866, p= 0.9914), supporting the validity of parametric inference. The Q-Q plot demonstrated excellent agreement between observed and theoretical quantiles, with points closely following the reference line (Figure 9). The histogram of residuals overlapped well with the theoretical normal distribution, further confirming this assumption.
3.4.4. Normality of Residuals
Cook's Distance analysis identified one influential observation: Molise (Cook's D= 0.9284), which exceeded the threshold of 4/n= 0.2105 (Figure 10). This region, being the smallest in Italy by population (~300,000 inhabitants), may have less stable dietary es-timates and thus exerted disproportionate influence on OLS regression coefficients. The application of RLM regression with Huber T-norm effectively addressed this concern by downweighting Molise's influence while retaining all 19 regions in the analysis.
3.5. Residual Diagnostics
The residuals vs. fitted values plot (Figure 11) demonstrated random scatter around zero without systematic patterns, confirming the appropriateness of the linear model specification. Notable residuals were observed for Sardegna (+0.25) and Veneto (-0.22), suggesting that these regions may have region-specific factors not captured by dietary variables alone.
3.6. Sensitivity Analysis and Model Robustness
3.6.1. OLS vs. Robust Regression Comparison
Comparison of OLS and RLM coefficients demonstrated remarkable stability, with percentage differences ranging from 0.43% (Se) to 12.29% (vitamin C). The robust re-gression coefficients were: alcohol (β= 0.000098 vs. 0.000094 in OLS, +3.69% difference), fibre (β= -0.000068 vs. -0.000070, -3.56% difference), Se (β= -0.000015 vs. -0.000015, +0.43% difference), and vitamin C (β= 0.000004 vs. 0.000005, -12.29% difference). The minimal differences between OLS and RLM estimates, coupled with nearly identical R2 values (0.6577 vs. 0.6564), confirmed that the findings were robust to the influence of outlier observations. This consistency provides confidence in the reliability of the identified associations.
3.6.2. Bootstrap Validation
The bootstrap procedure with 5,000 iterations provided empirical confidence intervals that did not rely on distributional assumptions. The finding that only fibre maintained statistical significance across bootstrap samples reinforced the robustness of this primary finding. The non-significant associations for alcohol, Se, and vitamin C, with confidence intervals including zero, indicated that their independent effects were uncertain in this multivariate ecological context.
3.6.3. Correlation Structure
The Spearman correlation matrix (Figure 12) revealed important relationships among study variables. Notably, the high correlation between vitamin C and fibre (r = 0.76) suggested potential collinearity that could complicate the interpretation of independent effects. The moderate correlations between Se and both alcohol (r = -0.57) and fibre (r = 0.40) indicated complex interrelationships among dietary patterns at the regional level.
The scatter matrix (Figure 13) provided visual confirmation of these relationships, with Pearson correlation coefficients ranging from r= -0.68 (ASDR-Se) to r= +0.58 (ASDR-Alcohol). The near-zero correlation between alcohol and fibre (r= -0.04) supported their independent inclusion in the multivariate model.
3.7. Quantitative Estimation of Dietary MNP Exposure and Correlation with PC Mortality
We combined regional household consumption data of packaged foods (beverages in PET bottles, yoghurt in PS pots, and processed meats in plastic films) with empirical polymer migration rates using the Food Microplastic Pyramid (FOMIC-Py) framework in order to shift our toxicological paradigm from a qualitative hypothesis to a quantitative model. This enabled it to be achievable for us to estimate the average yearly per capita dietary exposure to MPs/NPs, expressed in mg/person/year throughout the macro-regions under analysis. In order to represent the industrial and socioeconomic gradients of the Italian population, Table 1 summarises the quantitative mean MP exposure in each food item, and Table 2 summarises the quantitative regional dietary exposure profile by macro-geographic area. We performed a correlation analysis between the ASDR of PC and the total estimated regional MNP exposure in order to assess the strength of this connection.
Polymer migration estimates are based on thermodynamic partition coefficients at 20°C under standard storage timelines. Inhalation estimates account for average PM2.5/PM10 concentration gradients and industrial airborne MP deposition rates in urban vs. rural areas. As illustrated in Table 2, a clear geographical gradient emerges. Inhabitants of Northern Italy—particularly in the highly industrialized Po Valley—exhibit the highest total estimated MNP exposure (29.3 mg/person/year), which is 58.4% higher than that of the Southern and Insular cohorts (18.5 mg/person/year). This difference is driven not only by higher consumption of ultra-processed packaged items and NaD but also by significantly elevated atmospheric deposition of MP fibres in the northern industrialized basin [20].
3.8. Robustness and Sensitivity of Exposure Estimates
Sensitivity analyses confirmed that the relative North-South exposure ratio remained remarkably stable (1.55 higher exposure in the North), even though absolute exposure values varied across migration tiers (range: 12.1–41.2 mg/person/year in Northern regions vs. 7.8–25.4 mg/person/year in Southern regions). This indicates that structural dietary packaging dependency and atmospheric deposition patterns, rather than parameter baseline assumptions, are responsible for the regional variation in MNP intake.
To evaluate the strength of this association, we performed a correlation analysis between the total estimated regional MNP exposure and the ASDR–PC. We calculated Pearson's (or Spearman's) correlation coefficient (r) to determine the direction and significance of the relationship, setting the statistical significance threshold at p<0.05.
4. Discussion
Three major findings emerged from this 20-year ecological study of PC mortality in 19 Italian regions: a significant North-South geographic disparity, a notable secular in-crease in mortality (16.2% cumulative rise), and the identification of dietary fibre as the only independent protective dietary determinant. This study provides methodologically rigorous evidence that regional dietary patterns significantly influence PC mortality, even after accounting for influential outliers and the inherent limitations of ecological data, using RLM regression and bootstrap validation. Global epidemiological trends are consistent with the reported rising temporal in PC mortality. PC mortality is still rising, in contrast to other gastrointestinal tumours that have benefited from screening and targeted therapies. This is mainly due to Italy's elderly population structure, the rising incidence of metabolic syndrome, and the ongoing difficulties in early detection. Simultaneously, the significant North-South mortality disparity (Cohen's d= 1.81) indicates the important impact of environmental and geographic factors. Higher industrialisation, long-term exposure to environmental contaminants in areas the Po and changing dietary habits contrary to traditional Mediterranean patterns are probably all contributing factors to Northern Italy's higher death rates. The significant exception of Sardinia, which exhibited high mortality while being classified as Southern, indicates to the impact of unique genetic architectures and specific regional dietary habits, such as increased intake of preserved meats, and suggests further focused studies.
The higher death rates in Northern Italy are probably caused by increased industrialisation, long-term exposure to environmental pollutants in the Po, and nutritional changes typical Mediterranean patterns. Our integration of quantitative ISTAT consumption data on packaged foods, which exhibits a sharp socioeconomic and regional gradient in dietary MP intake among the Italian population, provides empirical evidence for this geographical exposure pattern. Compared to Southern cohorts, Northern Italian families had a 9% higher projected annual MP exposure due to their greater statistical consumption of industrially processed and largely packaged food matrices, as reported by ISTAT registries [3,7,20]. This finding suggests that dietary MP exposure is mostly influenced by food processing chains and consumer behaviour rather than just being a consequence of environmental This packaged-food dependency is mathematically represented by the steep superlinear slopes (β>1) obtained for beverages and oils/fats under our empirical Bayes model, where the thermodynamic migration of polymers (mainly PET and polyethylene-PE) from the container walls directly into the food matrices is accelerated by the high surface-area-to-volume ratio of plastic packaging combined with long contact times. The notable exception of Sardinia, which exhibited high mortality while being categorised as Southern, urges further focused studies and highlights the influence of distinct genetic architectures and particular regional dietary practices, such as higher consumption of preserved meats [3,7,20].
The strong, independent protective impact of dietary fibre against PC is study's most important outcome. In our multivariate RLM, the ASDR significantly decreased for every 10,000 g/year increase in regional fibre consumption. Biological plausibility provides substantial support for this ecological observation. Dietary fibre reduces chronic hyperinsulinemia, a recognised mitogenic stimulus for pancreatic ductal cells, via regulating postprandial glycaemic responses. Additionally, the intestinal microbiota ferments fibre to form short-chain fatty acids, especially butyrate, which have strong pro-apoptotic and anti-inflammatory properties. Our findings support the idea that high-fiber diets are a modifiable protective factor against pancreatic carcinogenesis and are consistent with large-scale prospective cohorts such as the EPIC study. Conversely, in the final robust vitamin C, Se did not exhibit statistically significant independent impacts. Alcohol's bivariate relationship with mortality may be complicated by more broad food and lifestyle habits, as indicated by the multivariate analysis's weakening of its effect. Multicollinearity is the main explanation of Se and vitamin C's non-significance; notably, vitamin C had a strong correlation with fibre consumption (Spearman r= 0.76). Vitamin C consumption is naturally higher in areas with fibre-rich diets (high in fruits, vegetables, and whole grains), which renders it statistically tough to separate their independent effects in an ecological environment.
By addressing typical OLS estimators' susceptibility to outliers, this study promotes ecological cancer research methodologically. The adoption of RLM with a Huber T-norm, which successfully downweighted this anomaly without removing it from the dataset, was supported by the identification of Molise as a very important observation (Cook's D= 0.9284). In spite of the minimal cross-sectional sample size (n= 19), this approach, when combined with a 5,000-iteration bootstrap technique, guaranteed that the protective effect of fibre was not an artefact of a specific area or small-sample distributional anomalies, providing a very trustworthy assessment.
4.1. Human Ecotoxicology of Plastic Ingestion: Mechanistic Pathways
Our findings must be considered within the context of human particle ecotoxicology rather than through the lens of conventional clinical epidemiology. An ongoing, low-dose cellular challenge is represented by the average consumer's estimated mean exposure of 27.2 mg/year [20]. Chronic, subclinical cellular damage is the main toxicological issue at these dosages rather than acute systemic toxicity. Cellular absorption and subsequent biokinetic behaviour are significantly influenced by the chemical and physical heterogeneity of the ingested polymer profile (mostly PE, polypropylene-PP, and PET). When ingested MNPs come into contact with gastrointestinal fluids under normal conditions, they adsorb a complex layer of biomolecules (proteins, lipids), creating a "biomolecular corona" that controls cellular internalisation routes [10,24]. According to mechanistic ecotoxicological studies, biological membranes such as the intestinal and blood-pancreas barriers could be crossed by NPs, which are not included in the conservative micro-Fourier Transform Infrared spectroscopy (μFTIR) and micro-Raman spectroscopy (μRaman)-based estimates because of analytical detection limits [20]. This may culminate in systemic bioaccumulation. After entering the cellular environment, these particles physically interact with organelles, causing intracellular ROS formation and altering mitochondrial membrane potential. This may eventually result in genotoxic consequences, DNA strand breakage, and metabolic failure [25,26,27,28,29,30]. Additionally, the 'Trojan Horse' effect requires to be considered into concern. Since ingested MPs have a might act as vectors for co-contaminants, such as heavy metals and plasticisers such bisphenol-A (BPA) and phthalates, co-releasing these harmful substances straight into pancreatic cells. For upcoming physiologically based pharmacokinetic (PBPK) models intended to map tissue-specific accumulation and cellular turnover kinetics, our quantitative exposure model is therefore a crucial starting point [10,25,26,27,28,29,30].
Additionally, our findings suggest to a possible synergistic interaction between increased MNP sensitivity and decreased dietary fibre consumption [31,32]. Through the bacterial synthesis of short-chain fatty acids (SCFAs) including butyrate, which strengthen epithelial tight junctions, dietary fibre promotes the integrity of the gut barrier [33,34,35,36]. Conversely, intestinal permeability (also identified as "leaky gut") may be increased by diets poor in fibre, which are common in westernised northern eating patterns [37,38,39,40]. M-cell endocytosis and portal circulation enable the systemic transport of NPs due to the impaired epithelial barrier [41,42,43]. Translocated hydrophobic polymers (such as PET, PS, and PVC) may preferentially accumulate in pancreatic tissue due to the organ's high vascularization and lipid-rich parenchyma. This may result in persistent local oxidative stress, mitochondrial dysfunction, and chronic subclinical inflammation [44].
4.2. Putative Limitations of the Study
It is important to recognise several types of methodological constraints that exist in designs and macro-environmental exposure frameworks. First, the framework is vulnerable to the ecological fallacy, which prohibits drawing conclusions about individual-level etiology or direct biological causality from macro-level connections since it is based on aggregate regional data (n=19 regions) [20,37]. Merely a result, the FOMIC-Py model's estimations of regional food exposure and population-level mortality rates are unable to assume the role of direct human biomonitoring or prospective individual cohort data; rather, they act as a predictive framework that creates hypotheses [41].
Second, the assessment of long-term dietary trajectories during the 20-year PC mortality window was limited by the cross-sectional nature of the dietary expenditure matrices (2022 baseline). Furthermore, residual confounding cannot be completely removed even with the inclusion of strong nutritional variables as fibre. The observed North-South macro-geographic gradient may be partially explained by unmeasured regional risk factors, such as adult obesity, diabetes incidence, smoking prevalence, and occupational chemical exposures [4].
Third, regional household expenditure surveys are used in dietary MP/NP exposure modelling. Although these surveys provide a trustworthy macroeconomic proxy, they may not adequately represent fine-grained intra-regional differences in local water usage patterns or preferences for food-contact packaging [44]. Nevertheless, using 5,000-iteration bootstrap resampling in conjunction with Robust Linear Models (RLM with Huber T-norm) successfully minimised the effect of regional leverage points and outliers, generating statistically robust exposure estimates across Italian macro-regions [45,46].
Fourth, the macro-regional sample size (n=19) inherently limits statistical power, rendering non-significant correlations for secondary dietary factors ambiguous rather than conclusively null [47,48,49]. Despite these limitations, the study indicates dietary fibre as a strong, independent protective cofactor at the population level, highlighting the critical need for specific public health interventions to maintain high-fiber adherence regardless of persistent dietary shifts toward highly packaged, ultra-processed foods [50]. Future epidemiological studies must combine longitudinal cohort designs with sophisticated target-tissue MP quantification techniques in order to overcome these ecological barriers and fill current understanding gaps [13,20].
5. Conclusions
An ecological exposure modelling estimated dietary MP exposure, and PC mortality throughout Italy is suggested in this study. While dietary fibre emerged as the only independent preventive dietary component at the population level, the observed north-south geographic gradient suggests a geographical concordance between westernised food patterns, higher estimated dietary MP exposure, and greater PC mortality.
These results cannot establish a causal relationship, despite patterns. Instead, they provide a framework for developing hypotheses that suggests dietary MNPs might represent an understudied environmental cofactor acting in tandem with well-established lifestyle and dietary aspects. Although the suggested mechanisms—such as inflammation, persistent oxidative stress, and the movement of molecules that affect hormones—remain physiologically plausible, they still require to be verified by experimental and clinical studies. Prospective individual-level cohort studies that human bio-monitoring, molecular epidemiology, and mechanistic investigations—including the identification and characterisation of MPs/NPs in pancreatic tissue—should receive a priority in future studies.
From the perspective of environmental health, from food packaging and encouraging high-fibre dietary habits may be complimentary and perhaps flexible approaches worthy of additional studies for the prevention of PC. Future studies aiming at elucidating the role of environmental MP exposure in PC could improve on this ecological exposure framework.
Author Contributions
M. K.: Stastistical Analysis, Methodology, Visualization, Validation, Formal Analysis, Software; Writing original-draft; R. L.: Formal Analysis, Visualization, Methodology, Funding, Writing review and editing; U. C.: Conceptualization, Visualization, Methodology, Formal Analysis, Writing original-draft, Writing review and editing; C. C.: Conceptualization, Methodology, Visualization, Validation, Formal Analysis, Supervision, Writing original-draft; Writing review and editing.
Funding
This research was funded by the RUDN University Scientific Projects Grant System, grant number: 021411-0-000.
Data Availability Statement
The datasets used and/or analyzed during this study are available from the corresponding author on reasonable request. The epidemiological mortality datasets derived from ISTAT registries, along with the custom R/Python code used for the Robust Linear Regression (RLM), Huber T-norm optimization, and 5,000-iteration bootstrap simulations.
Acknowledgments
This article is dedicated to Alexander Santiago Casella Flores.
Conflicts of Interest
The authors declare no conflicts of interest.
Abbreviations
The following abbreviations are used in this manuscript:
| ADME | Absorption, Distribution, Metabolism, and Excretion |
| AIC | Akaike Information Criterion |
| APC | Annual Percent Change |
| ASDR | Age Standardized Death Rate |
| BLUE | Best Linear Unbiased Estimators |
| BPA | Bisphenol-A |
| Fomic-Py | Food Microplastic Pyramid |
| INRAN / NRIFN | National Research Institute for Food and Nutrition |
| IRLS | Iteratively Reweighted Least Squares |
| ISTAT | Italian National Institute of Statistics |
| LM | Breusch-Pagan Lagrange Multiplier |
| MPs | Microplastics |
| MNPs | Micro-Nanoplastics |
| NaDs | Non-Alcoholic Drinks |
| NPs | Nanoplastics |
| OLS | Ordinary Least Squares |
| OS | Oxidative Stress |
| PAHs | Polycyclic Aromatic Hydrocarbons |
| PBPK | Physiologically based Pharmacokinetic |
| PC | Pancreatic Cancer |
| PDAC | Pancreatic Ductal Adenocarcinoma |
| PE | Polyethylene |
| PET | Polyethylene Terephthalate |
| PNET | Pancreatic Neuroendocrine Tumour |
| POPs | Persistent Organic Pollutants |
| PP | Polypropylene |
| PS | Polystyrene |
| PVC | Polyvinyl Chloride |
| RLM | Robust Linear Model |
| ROS | Reactive Oxygen Species |
| SCFAs | Short-Chain Fatty Acids |
| Se | Selenium |
| SMRs | Standardized Mortality Ratios |
| VIF | Variance Inflation Factor |
| μFTIR | Micro-Fourier Transform Infrared Spectroscopy |
| μRaman | Micro-Raman Spectroscopy |
References
- Bray, F.; Ferlay, J.; Soerjomataram, I.; Siegel, R.L.; Torre, L.A.; Jemal, A. Global cancer statistics 2018: GLOBOCAN estimates of incidence and mortality worldwide for 36 cancers in 185 countries. CA Cancer J. Clin. 2018, 68, 394–424. [Google Scholar] [CrossRef] [PubMed]
- Sung, H.; Ferlay, J.; Siegel, R. L.; Laversanne, M.; Soerjomataram, I.; Jemal, A.; Bray, F. Global cancer statistics 2020: GLOBOCAN estimates of incidence and mortality worldwide for 36 cancers in 185 countries. CA Cancer J. Clin. 2020, 71(3), 209–249. [Google Scholar] [CrossRef] [PubMed]
- Casella, C.; Cornelli, U. Pancreatic Cancer in Relation to Food Expenditure: Difference Between Northern and Southern Italian Regions. Green Health 2026, 2(1), 4. [Google Scholar] [CrossRef]
- Rawla, P.; Sunkara, T.; Gaduputi, V. Epidemiology of pancreatic cancer: Global trends, etiology and risk factors. World J. Oncol. 2019, 10, 10. [Google Scholar] [CrossRef] [PubMed]
- Cornelli, U.; Grossi, E.; Recchia, M.; Cestaro, B.; Rondanelli, M.; Cazzola, R.; Pistolesi, E. The Mediterranean diet and cancers in Italy: Stochastic and non-stochastic analysis. Eur. J. Appl. Sci. 2023, 11(3), 59–84. [Google Scholar] [CrossRef]
- Ibrahim, M. O.; Abuhijleh, H.; Tayyem, R. What dietary patterns and nutrients are associated with pancreatic cancer? Literature review. Cancer Manag. Res. 2023, 27–30. [Google Scholar] [CrossRef]
- Le 1000 Tavole Degli Italiani. Italiani.coop/le-1000-Tavole-Italiane. 2017. Available online: https://italiani.coop/le-1000-tavole-italiane/ (accessed on 10 July 2026).
- Gianfredi, V.; Ferrara, P.; Dinu, M.; Nardi, M.; Nucci, D. Diets, dietary patterns, single foods and pancreatic cancer risk: an umbrella review of meta-analyses. Int. J. Environ. Res. Public Health 2022, 19(22), 14787. [Google Scholar] [CrossRef]
- Nucci, D.; Nardi, M.; Cinnirella, A.; Campagnoli, E.; Maffeo, M.; Perrone, P. M.; Gianfredi, V. Adherence to Mediterranean diet and risk of pancreatic cancer: systematic review and meta-analysis. Int. J. Environ. Res. Public Health 2023, 20(3), 2403. [Google Scholar] [CrossRef]
- Casella, C.; Ballaz, S. J. Genotoxic and neurotoxic potential of intracellular nanoplastics: A review. J. Appl. Toxicol. 2024, 44(11), 1657–1678. [Google Scholar] [CrossRef] [PubMed]
- Cornelli, U.; Belcaro, G.; Casella, C. Reduction in Circulating Microplastics in Humans Following Gastrointestinal Sequestration by Chitosan: A Pilot Controlled Study. J. Xenobiotics 2026, 16(3), 92. [Google Scholar] [CrossRef] [PubMed]
- Cornelli, U.; Zanoni, G.; Casella, C. A Bioenergetic Framework for Microplastic Accumulation in Human Tissues: A Cellular Turnover Hypothesis. Toxics 2026, 14(7), 603. [Google Scholar] [CrossRef] [PubMed]
- Leslie, H. A.; Van Velzen, M. J.; Brandsma, S. H.; Vethaak, A. D.; Garcia-Vallejo, J. J.; Lamoree, M. H. Discovery and quantification of plastic particle pollution in human blood. Environ. Int. 2022, 163, 107199. [Google Scholar] [CrossRef] [PubMed]
- Mierzejewski, K.; Kurzyńska, A.; Golubska, M.; Gałęcka, I.; Całka, J.; Bogacka, I. Oral exposure to PET microplastics induces the pancreatic immune response and oxidative stress in immature pigs. BMC Genom. 2025, 26(1), 578. [Google Scholar] [CrossRef] [PubMed]
- Zheng, J.; Tan, Z.; Wu, J.; Liu, J.; Yang, T.; Yang, H. Polystyrene microplastics aggravate acute pancreatitis in mice. Toxicology 2023, 491, 153513. [Google Scholar] [CrossRef] [PubMed]
- Casella, C.; Cornelli, U.; Ballaz, S.; Recchia, M.; Zanoni, G.; Ramos-Guerrero, L. Preliminary study on PCC-chitosan’s ability to enhance microplastic excretion in human stools from healthy volunteers. Foods 2025, 14(13), 2190. [Google Scholar] [CrossRef] [PubMed]
- Hartmann, C.; Lomako, I.; Schachner, C.; El Said, E.; Abert, J.; Satrapa, V.; Köppel, S. Assessment of microplastics in human stool: A pilot study investigating the potential impact of diet-associated scenarios on oral microplastics exposure. Sci. Total Environ. 2024, 951, 175825. [Google Scholar] [CrossRef] [PubMed]
- Schwabl, P.; Köppel, S.; Königshofer, P.; Bucsics, T.; Trauner, M.; Reiberger, T.; Liebmann, B. Detection of various microplastics in human stool: a prospective case series. Ann. Int. Med. 2019, 171(7), 453–457. [Google Scholar] [CrossRef] [PubMed]
- Tsuji, M.; Ishitsuka, K.; Ishihara, Y.; Koriyama, C.; Takahashi, M.; Nakajima, D.; Azuma, K. Relationship between microplastics in stool, diet, and inflammatory markers in healthy Japanese individuals. Environ. Health Prev. Med. 2026, 31, 17–17. [Google Scholar] [CrossRef] [PubMed]
- Cornelli, U.; Recchia, M.; Casella, C. The Food Microplastic Pyramid (FOMIC-Py) as a Novel Framework for Prioritizing Dietary Exposure and Industrial Processing Impact: An Italian North-South Exposure Model. Toxics 2026. [Google Scholar] [CrossRef] [PubMed]
- ISTAT 2019 Mortalità per Territorio di Evento-Italy (Mortality by Area of Event). 2019. Available online: https://www.istat.it/it/files/2019/03/Atlante-italiano-delle-disuguaglianze-di-mortalita.pdf (accessed on 10 July 2026).
- Marletta, L.; Carnovale, E. Tabelle di Composizione Degli Alimenti; Istituto Nazionale di Ricerca per gli Alimenti e la Nutrizione: Milano, Italy, 2000; Available online: https://toplifeproject.com/wp-content/uploads/2023/06/tabella-composizione-alimenti.pdf (accessed on 10 July 2026).
- Spese e Consumi delle Famiglie Anno 2016. 2017. Available online: https://www.istat.it/it/files/2017/07/CS_Spese-per-=consumi-2016.pdf (accessed on 10 July 2026).
- Casella, C.; Dondi, D.; Vadivel, D. Do microplastics (MPs) and nanoplastics (NPs) directly contribute to human carcinogenesis? Environ. Pollut. 2025, 127343. [Google Scholar] [CrossRef] [PubMed]
- Gupta, R. K.; Pipliya, S.; Karunanithi, S.; Eswaran U, G. M.; Kumar, S.; Mandliya, S.; Kovács, B. Migration of chemical compounds from packaging materials into packaged foods: Interaction, mechanism, assessment, and regulations. Foods 2024, 13(19), 3125. [Google Scholar] [CrossRef] [PubMed]
- He, Y. J.; Qin, Y.; Zhang, T. L.; Zhu, Y. Y.; Wang, Z. J.; Zhou, Z. S.; Luo, X. D. (Migration of (non-) intentionally added substances and microplastics from microwavable plastic food containers. J. Hazard. Mater. 2021, 417, 126074. [Google Scholar] [CrossRef] [PubMed]
- Kaseke, T.; Lujic, T.; Cirkovic Velickovic, T. Nano-and microplastics migration from plastic food packaging into dairy products: impact on nutrient digestion, absorption, and metabolism. Foods 2023, 12(16), 3043. [Google Scholar] [CrossRef] [PubMed]
- Lewanska, M.; Barczynska, R. Microplastics from food packaging: Polymer degradation pathways, environmen-tal distribution, and effects on the human gastrointestinal tract. Polymers 2025, 17(21), 2923. [Google Scholar] [CrossRef] [PubMed]
- Shahzadi, C.; Aielli, L.; Costantini, E.; Reale, M.; Di Carlo, P. Breaching barriers: Microplastic translocation into human body through food and implications for neurodegeneration. Curr. Pollut. Rep. 2025, 11(1), 58. [Google Scholar] [CrossRef]
- Sultany, A.; Noori, H.; Kumar, H.; Kunwar, R.; Shoaib, F.; Mishra, S. K.; Chakinala, R. C. Ingested microplastics and gastrointestinal health: a comprehensive review of their role in gut inflammation and dysbiosis. Ann. Med. Surg. 2026, 88(5), 2830. [Google Scholar] [CrossRef] [PubMed]
- Kim, Y.; Cho, Y.; Kim, J. E.; Lee, D. H.; Oh, H. Ultra-processed food intake and risk of type 2 diabetes mellitus: a dose-response meta-analysis of prospective studies. Diab. Metab. J. 2025, 49(5), 1064–1074. [Google Scholar] [CrossRef] [PubMed]
- Pagliai, G.; Dinu, M.; Madarena, M. P.; Bonaccio, M.; Iacoviello, L.; Sofi, F. Consumption of ultra-processed foods and health status: a systematic review and meta-analysis. Brit. J. Nutr. 2021, 125(3), 308–318. [Google Scholar] [CrossRef] [PubMed]
- Pérez-Reytor, D.; Puebla, C.; Karahanian, E.; García, K. Use of short-chain fatty acids for the recovery of the intestinal epithelial barrier affected by bacterial toxins. Front. Physiol. 2021, 12, 650313. [Google Scholar] [CrossRef] [PubMed]
- Cai, Y.; Folkerts, J.; Folkerts, G.; Maurer, M.; Braber, S. Microbiota-dependent and-independent effects of dietary fibre on human health. Brit. J. Pharmacol. 2020, 177(6), 1363–1381. [Google Scholar] [CrossRef] [PubMed]
- Dmytriv, T. R.; Storey, K. B.; Lushchak, V. I. Intestinal barrier permeability: the influence of gut microbiota, nutrition, and exercise. Front. Physiol. 2024, 15, 1380713. [Google Scholar] [CrossRef] [PubMed]
- Liu, T.; Wang, C.; Wang, Y. Y.; Wang, L. L.; Ojo, O.; Feng, Q. Q.; Wang, X. H. Effect of dietary fiber on gut barrier function, gut microbiota, short-chain fatty acids, inflammation, and clinical outcomes in critically ill patients: a systematic review and meta-analysis. J. Parent. Enter. Nutr. 2022, 46(5), 997–1010. [Google Scholar] [CrossRef] [PubMed]
- Hassan, R. O.; Othman Abdullah, F.; Salahuddin Ali, D.; Omar Othman, H.; Aziz Darwesh, D. Evaluating the health risks of heavy metal pollution in dust storms in the city of Erbil in the Kurdistan region of Iraq. Int. J. Environ. Health Res. 2024, 34(9), 3084–3100. [Google Scholar] [CrossRef] [PubMed]
- Jaquez-Duran, G.; Arellano-Ortiz, A. L. Western diet components that increase intestinal permeability with implications on health. Int. J. Vit. Nutr. Res. 2023. [Google Scholar] [CrossRef] [PubMed]
- Camilleri, M.; Lyle, B. J.; Madsen, K. L.; Sonnenburg, J.; Verbeke, K.; Wu, G. D. Role for diet in normal gut barrier function: developing guidance within the framework of food-labeling regulations. Am. J. Physiol. Gastroint. Liver Physiol. 2019, 317(1), G17–G39. [Google Scholar] [CrossRef] [PubMed]
- Spiller, A. L.; Costa, B. G. D.; Yoshihara, R. N. Y.; Nogueira, E. J. Z.; Castelhano, N. S.; Santos, A.; Yukie Sassaki, L. Ultra-processed foods, gut microbiota, and inflammatory bowel disease: A critical review of emerging evidence. Nutrients 2025, 17(16), 2677. [Google Scholar] [CrossRef] [PubMed]
- Prata, J. C.; Da Costa, J. P.; Lopes, I.; Duarte, A. C.; Rocha-Santos, T. Environmental exposure to microplastics: An overview on possible human health effects. Sci. Total Environ. 2020, 702, 134455. [Google Scholar] [CrossRef] [PubMed]
- Chen, Y.; Williams, A. M.; Gordon, E. B.; Rudolph, S. E.; Longo, B. N.; Li, G.; Kaplan, D. L. Biological effects of polystyrene micro-and nano-plastics on human intestinal organoid-derived epithelial tissue models without and with M cells. Nanomed. Nanotechnol. Biol. Med. 2023, 50, 102680. [Google Scholar] [CrossRef] [PubMed]
- Wang, H.; He, Y.; Zou, P.; Wang, X.; Peng, G.; Deng, X. From the Gut to the Brain: Microplastic-Associated Neurovascular Dysfunction and Implications for Stroke Risk. Adv. Sci. 2026, e20278. [Google Scholar] [CrossRef] [PubMed]
- Kannan, K.; Vimalkumar, K. A review of human exposure to microplastics and insights into microplastics as obesogens. Front. Endocrin. 2021, 12, 724989. [Google Scholar] [CrossRef] [PubMed]
- Dorn, J.; Guo, K.; Kallus, N. Doubly-valid/doubly-sharp sensitivity analysis for causal inference with unmeasured confounding. J. Am. Stat. Ass. 2025, 120(549), 331–342. [Google Scholar] [CrossRef]
- Jin, Y.; Ren, Z.; Zhou, Z. Sensitivity Analysis Under the f-Sensitivity Model: A Distributional Robustness Perspective. Oper. Res. 2026, 74(2), 860–878. [Google Scholar] [CrossRef]
- Ahmed, S. K. How to choose a sampling technique and determine sample size for research: A simplified guide for researchers. Oral Oncol. Rep. 2024, 12, 100662. [Google Scholar] [CrossRef]
- Giner-Sorolla, R.; Montoya, A. K.; Reifman, A.; Carpenter, T.; Lewis, N. A., Jr.; Aberson, C. L.; Soderberg, C. Power to detect what? Considerations for planning and evaluating sample size. Person. Soc. Psychol. Rev. 2024, 28(3), 276–301. [Google Scholar] [CrossRef]
- Lakens, D. Sample size justification. Coll. Psychol. 2022, 8(1), 33267. [Google Scholar] [CrossRef]
- Lane, M. M.; Gamage, E.; Travica, N.; Dissanayaka, T.; Ashtree, D. N.; Gauci, S.; Marx, W. Ultra-processed food consumption and mental health: a systematic review and meta-analysis of observational studies. Nutrients 2022, 14(13), 2568. [Google Scholar] [CrossRef] [PubMed]
Figure 1.
Temporal trend of PC mortality in Italy (2003–2022).
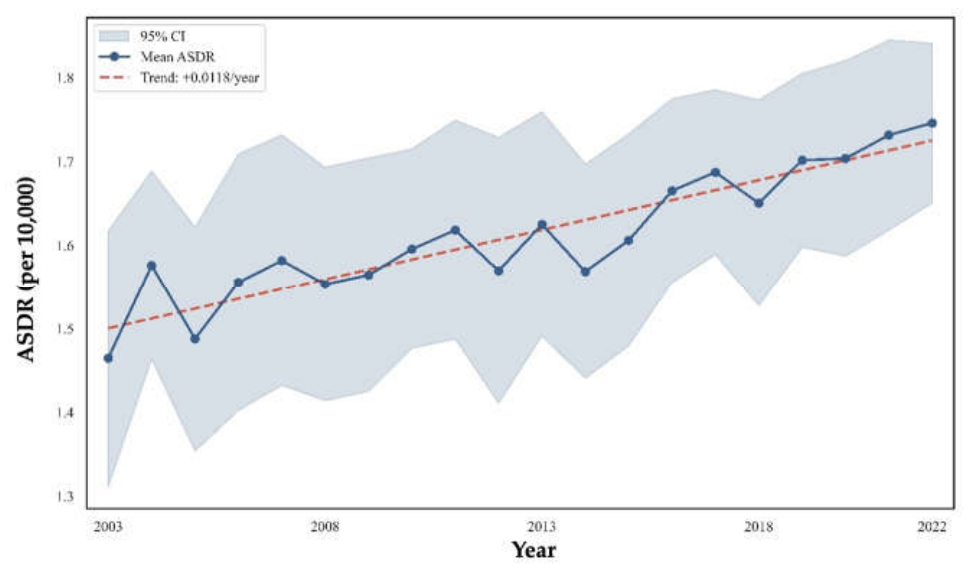
Figure 2.
Distribution of PC mortality by geographic region (North vs. South).
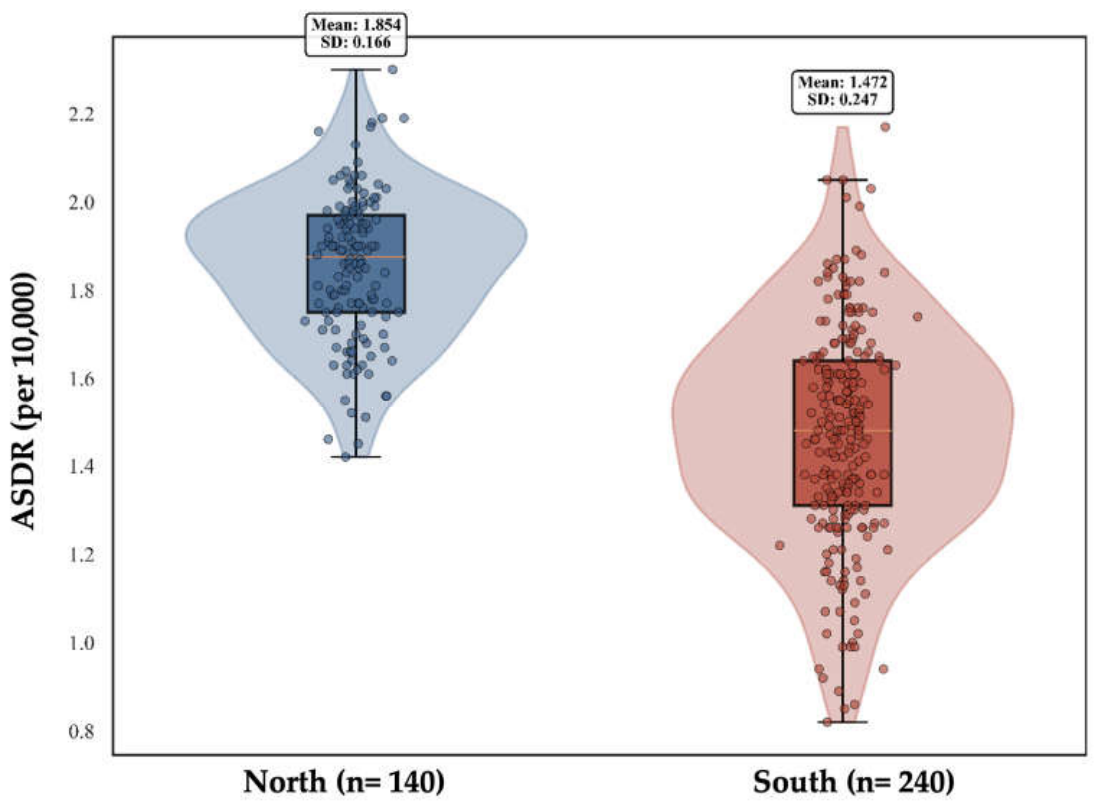
Figure 3.
Regional variation in PC mortality (2022) with 20-year 95% confidence intervals.
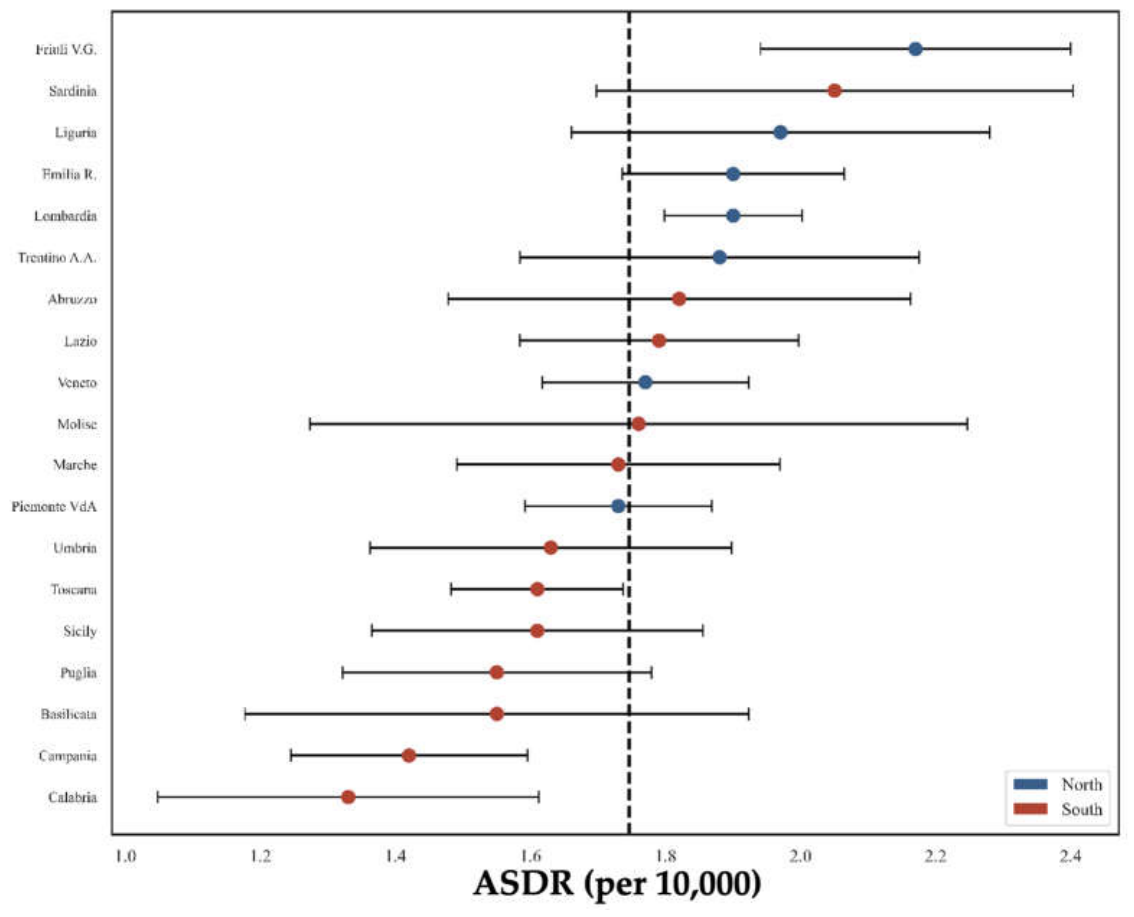
Figure 4.
Regional ASDR distribution in Italy (2022).
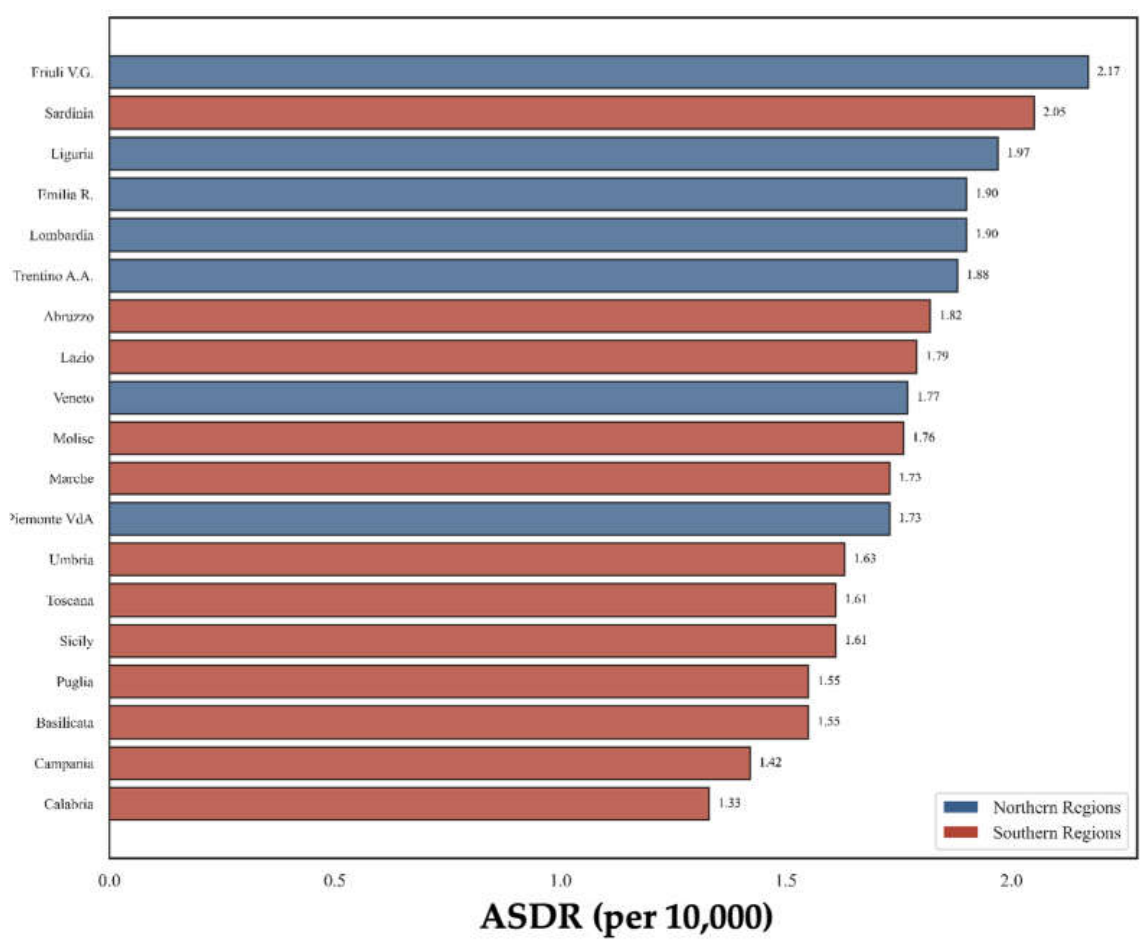
Figure 5.
Overview of PC mortality analysis: (a) Scatter plot of Alcohol consumption vs. ASDR with the robust regression prediction line (r= 0.578); (b) Scatter plot of Dietary Fibre intake vs. ASDR with the robust regression prediction line (r= -0.533).
Figure 5.
Overview of PC mortality analysis: (a) Scatter plot of Alcohol consumption vs. ASDR with the robust regression prediction line (r= 0.578); (b) Scatter plot of Dietary Fibre intake vs. ASDR with the robust regression prediction line (r= -0.533).
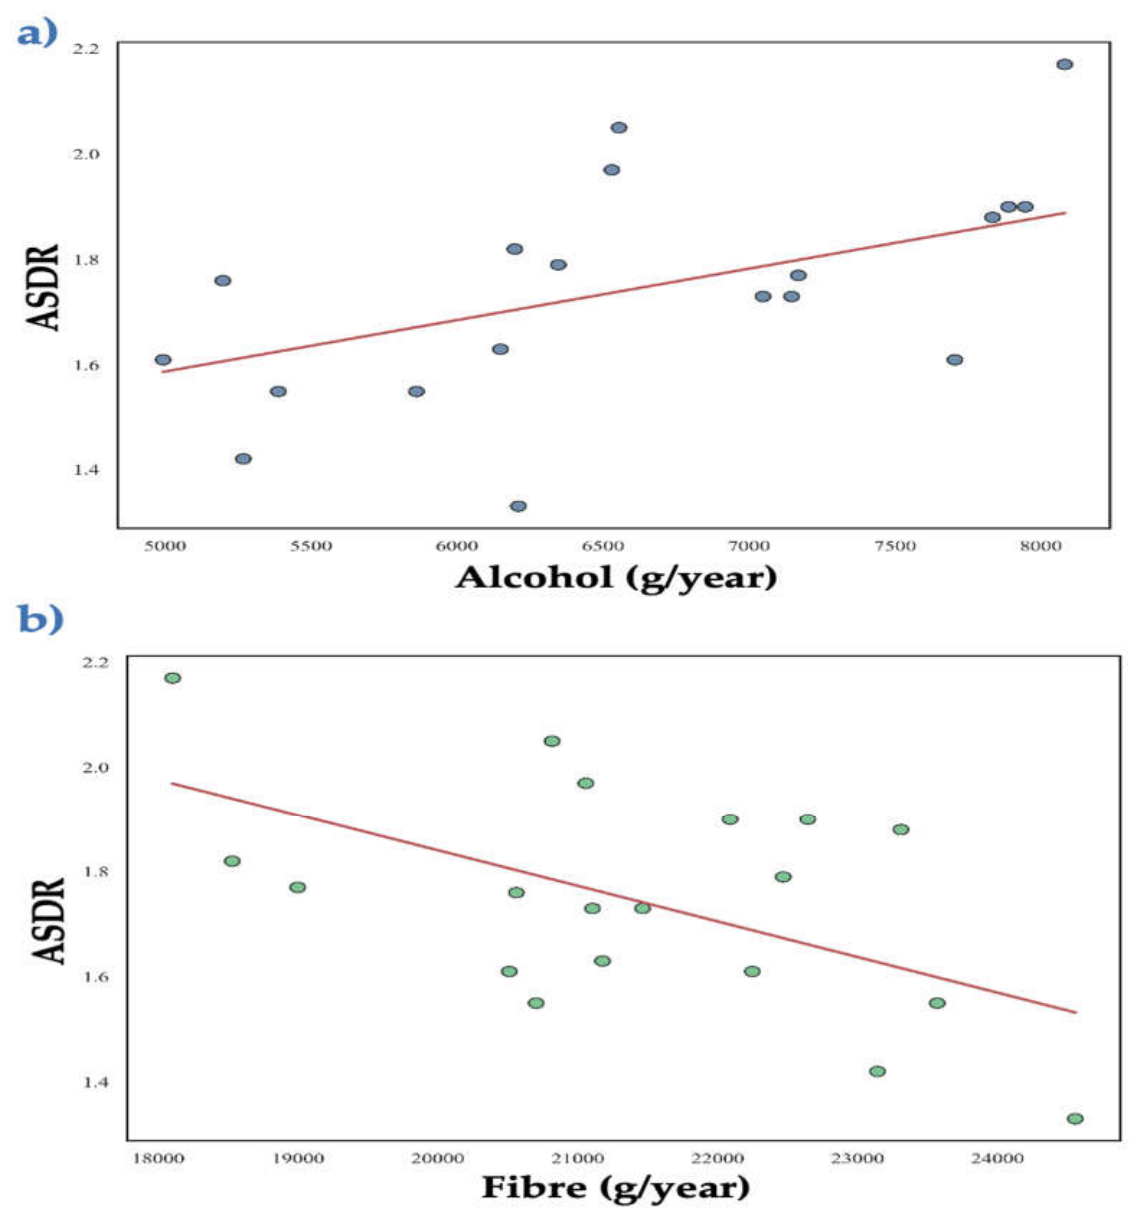
Figure 6.
Robust regression coefficients with bootstrap 95% confidence intervals.
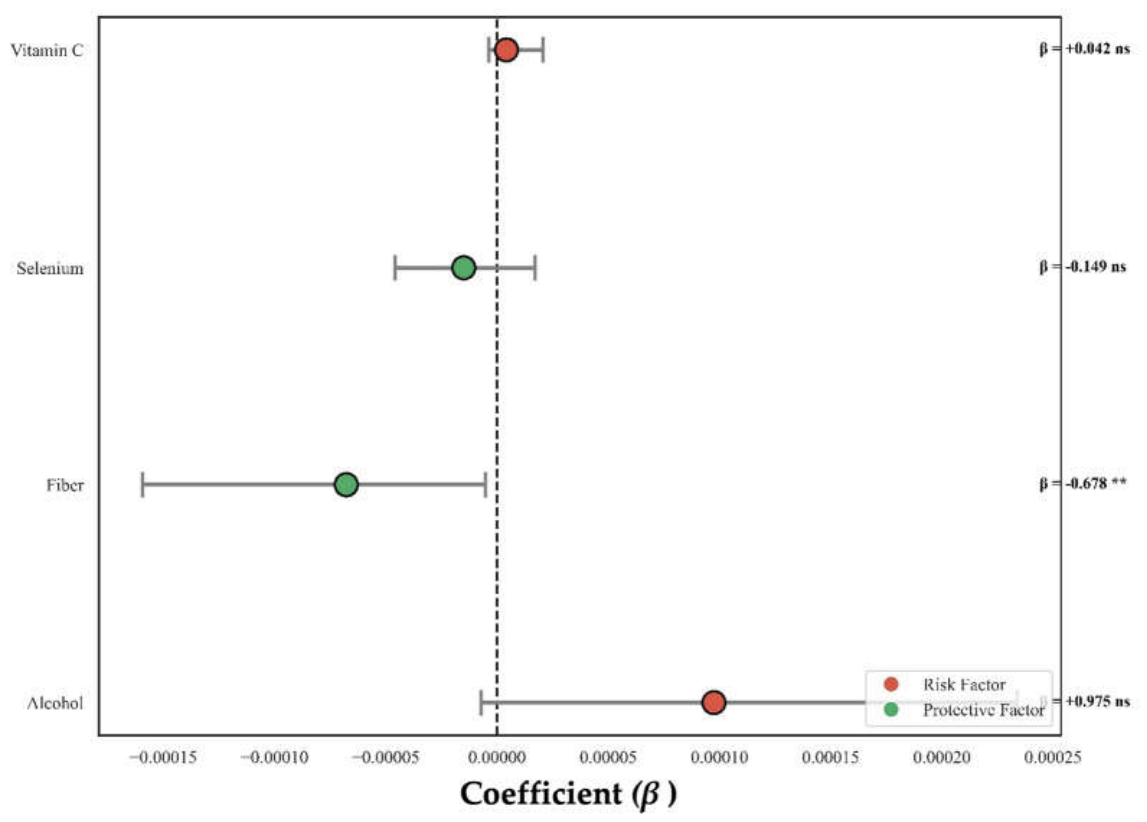
Figure 7.
VIF for dietary predictors.
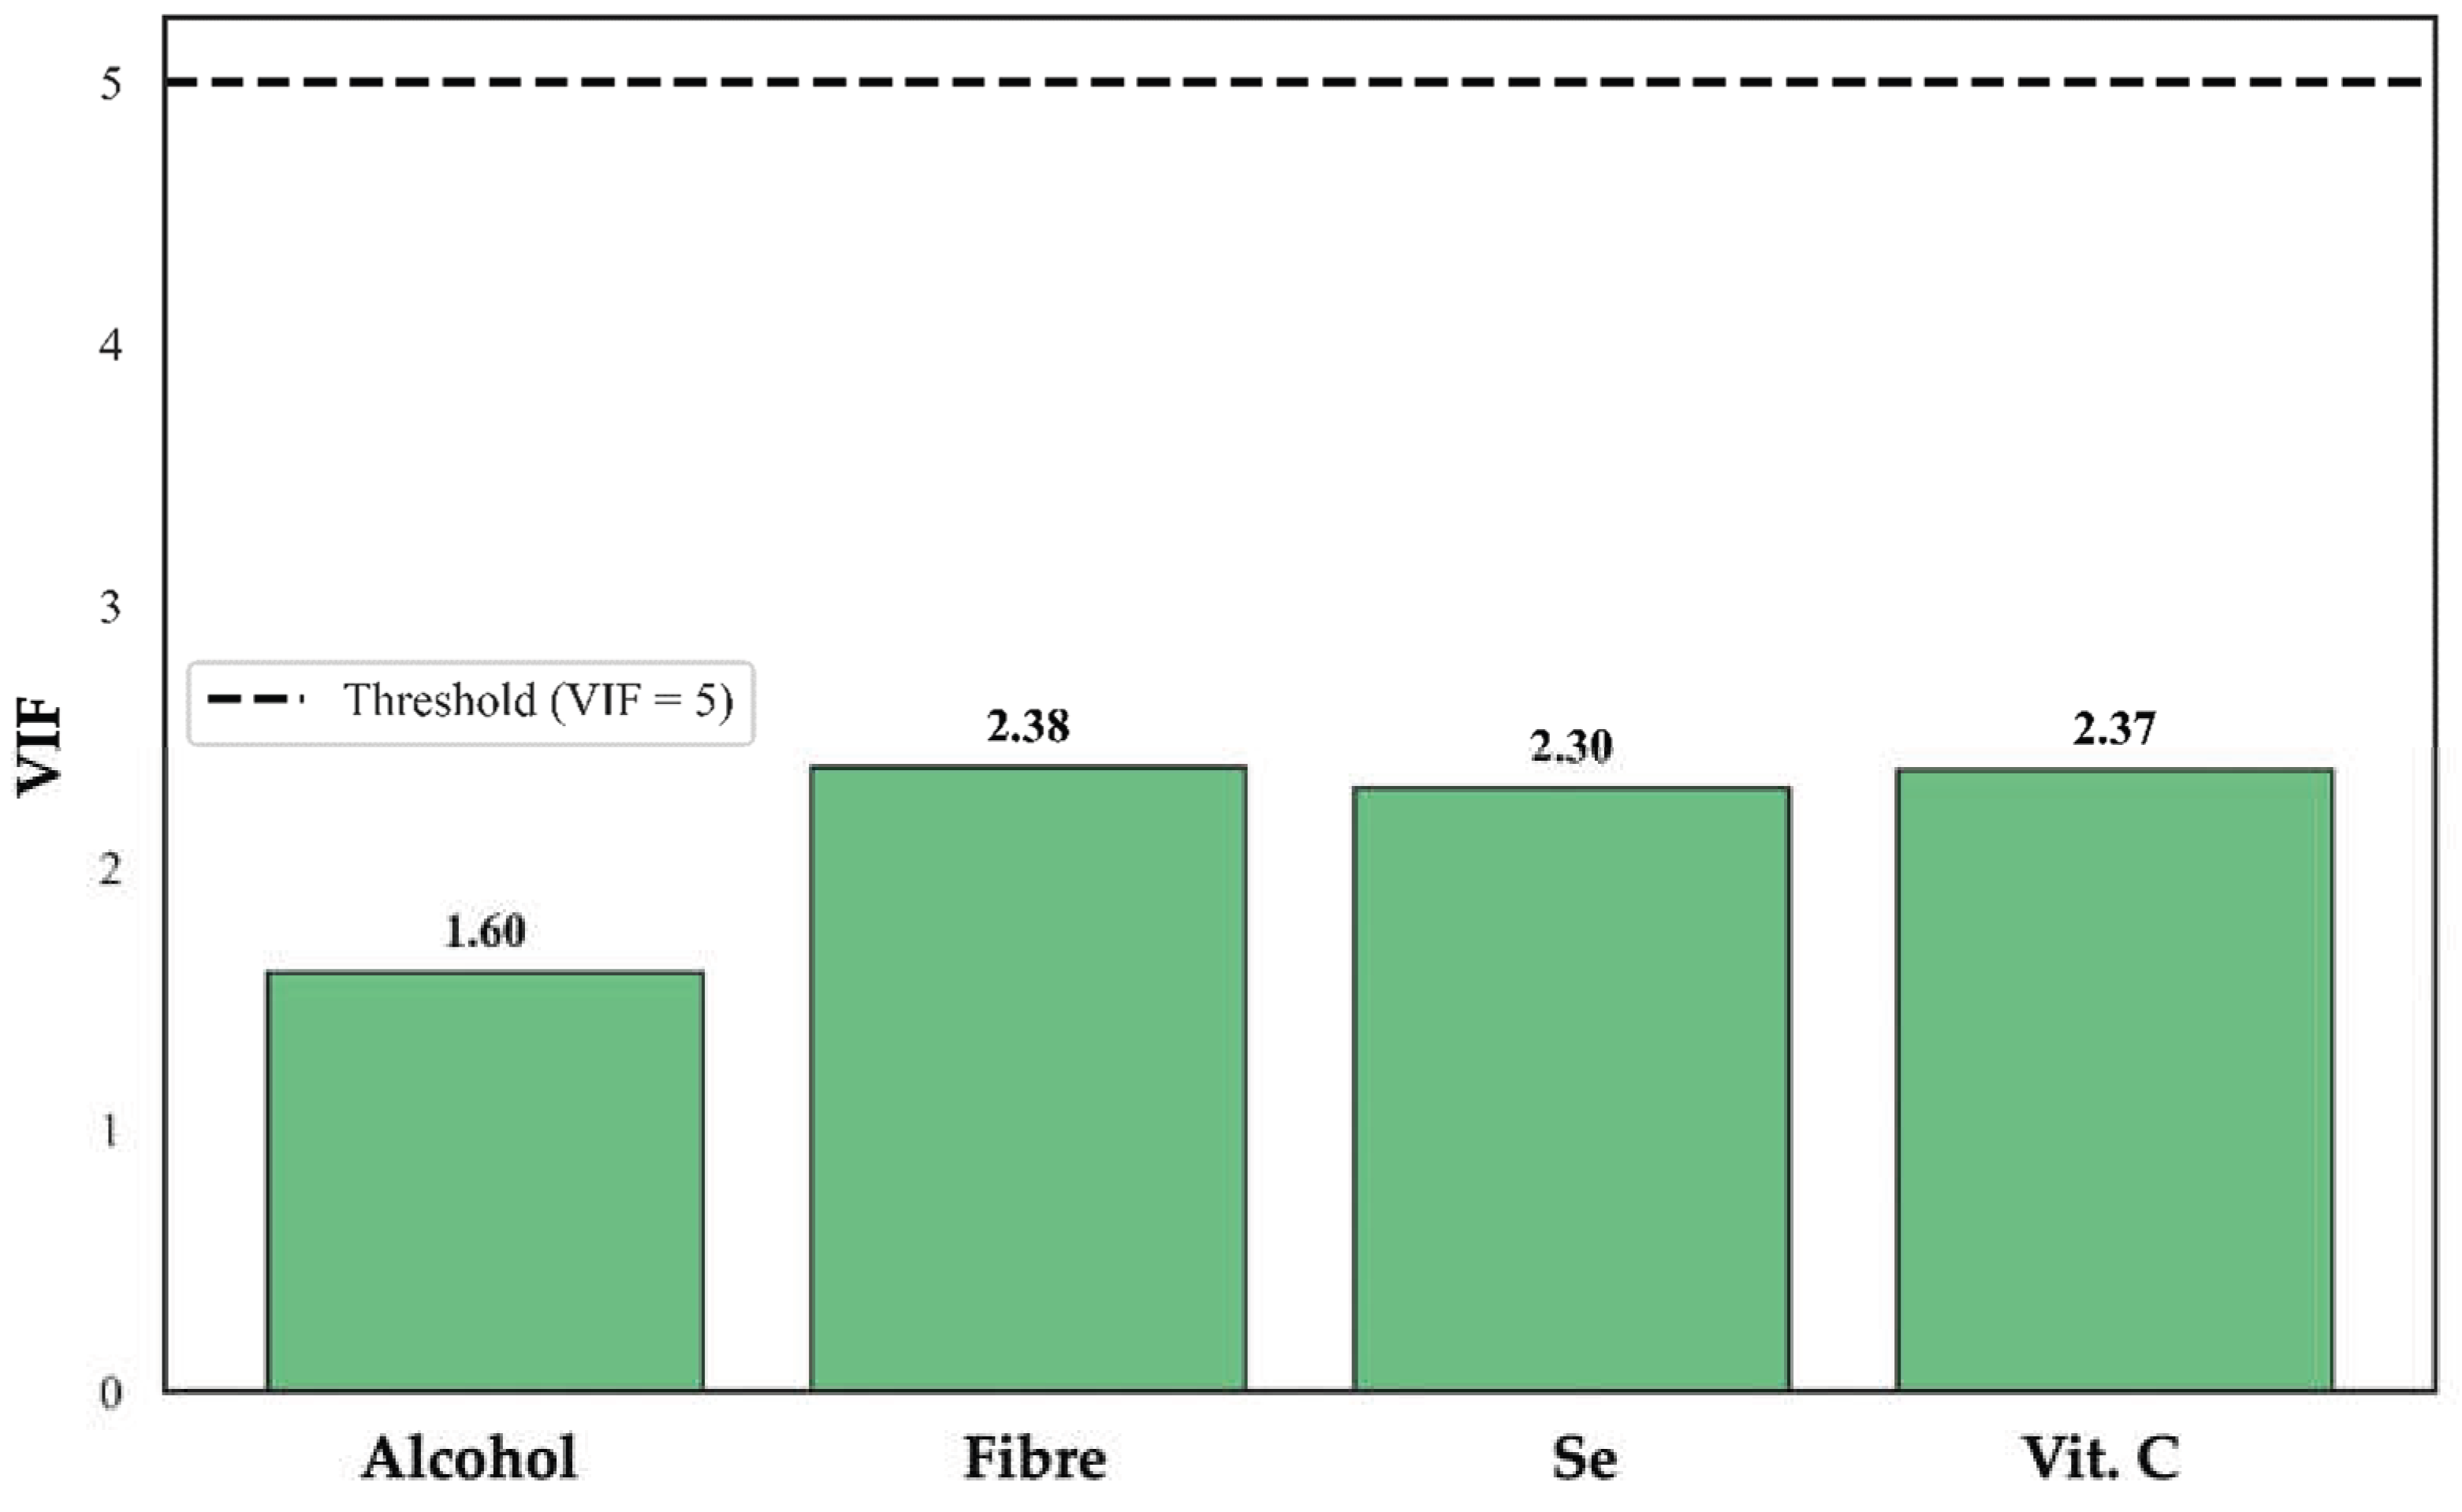
Figure 8.
Breusch–Pagan test for heteroscedasticity.
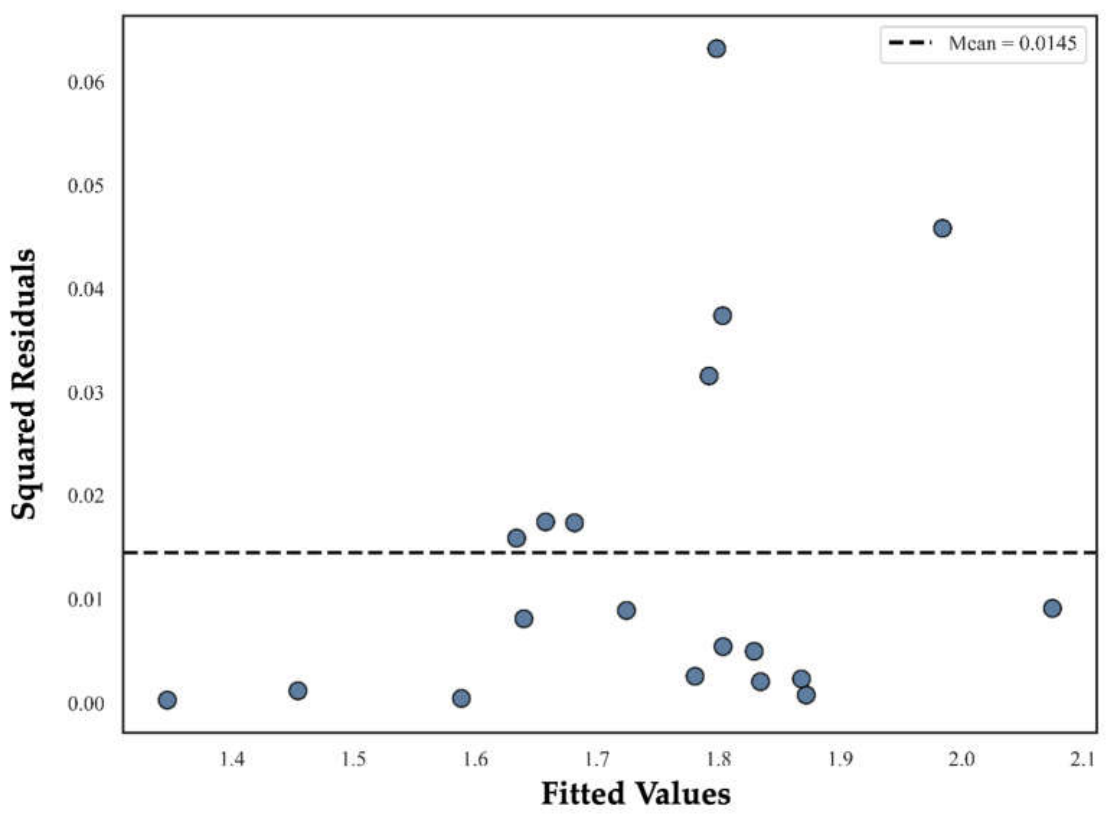
Figure 9.
Normality assessment of model residuals.
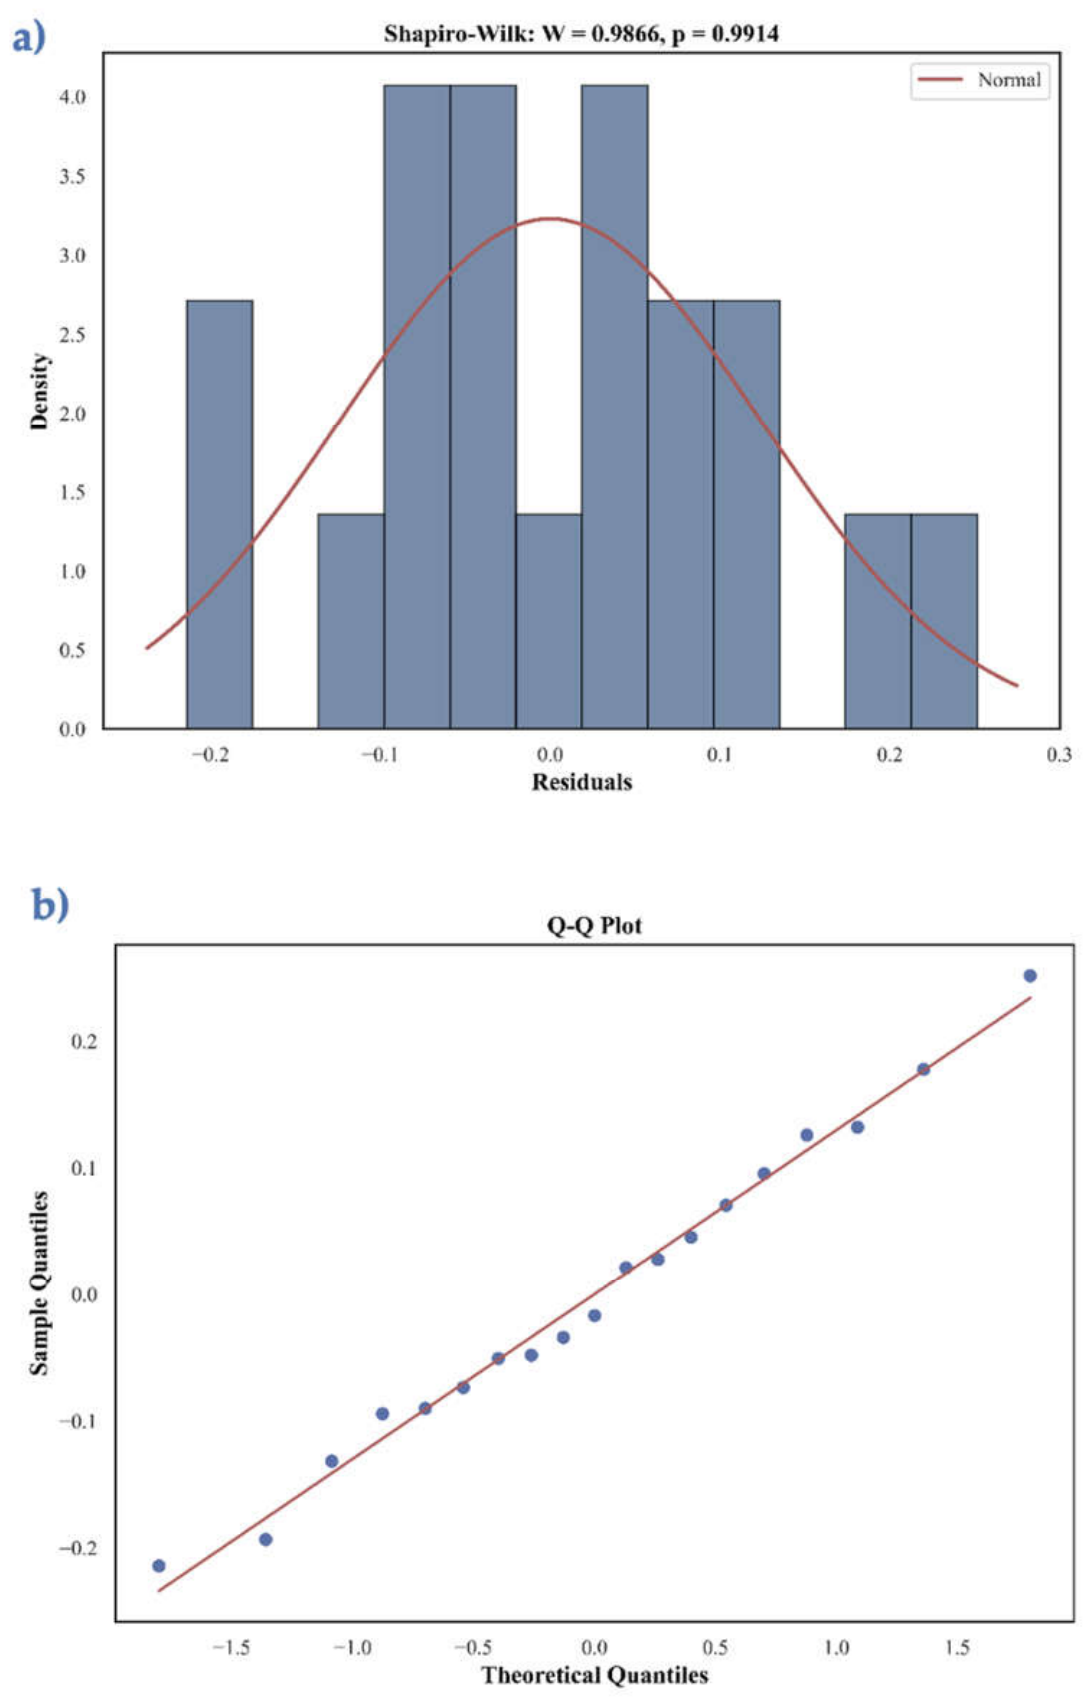
Figure 10.
Cook’s Distance for influential observation detection.
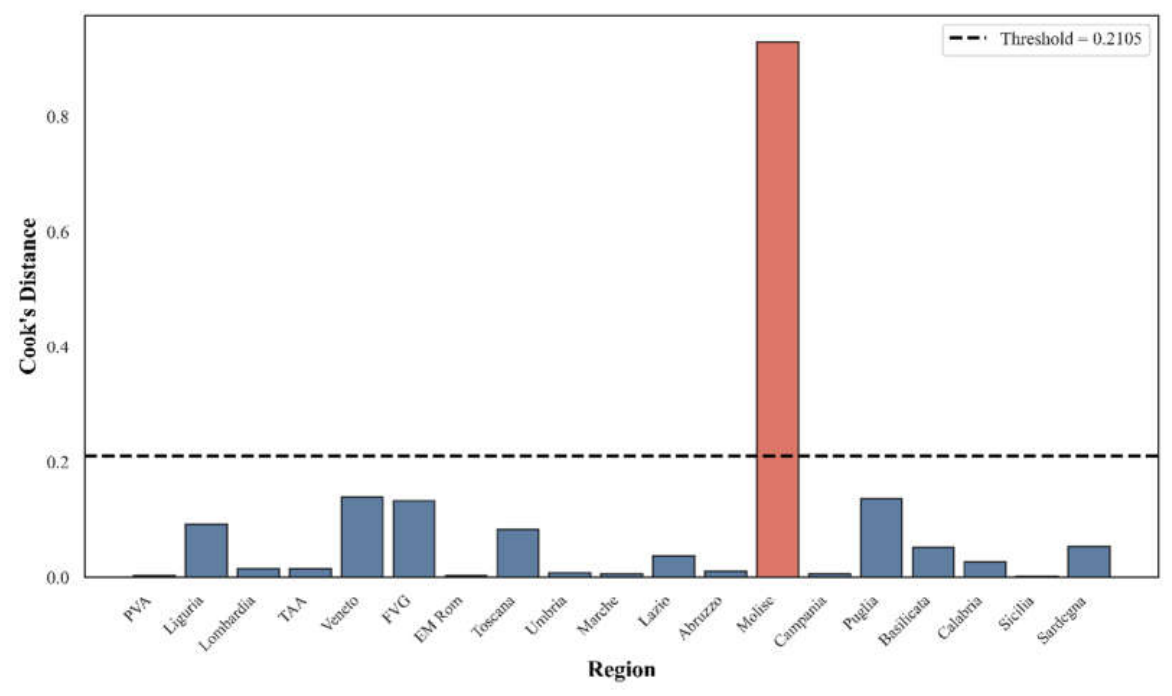
Figure 11.
Residuals vs. fitted values plot (OLS).
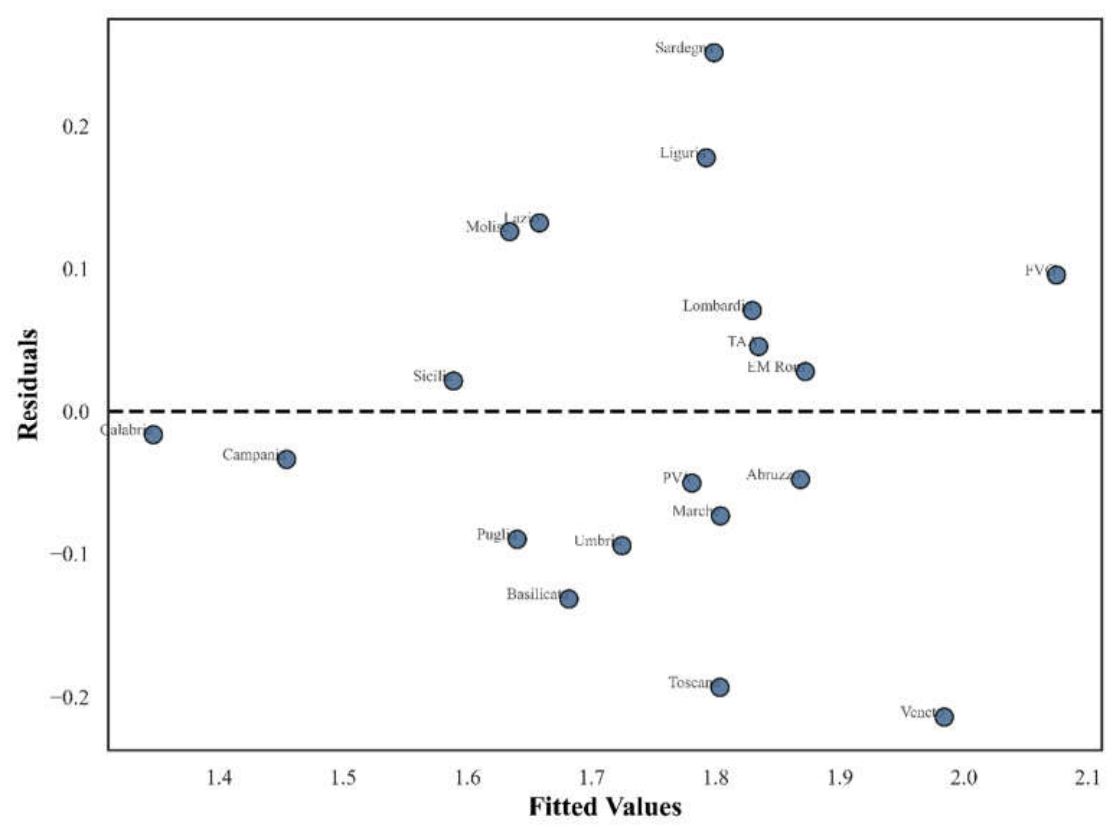
Figure 12.
Spearman correlation matrix of study variables.
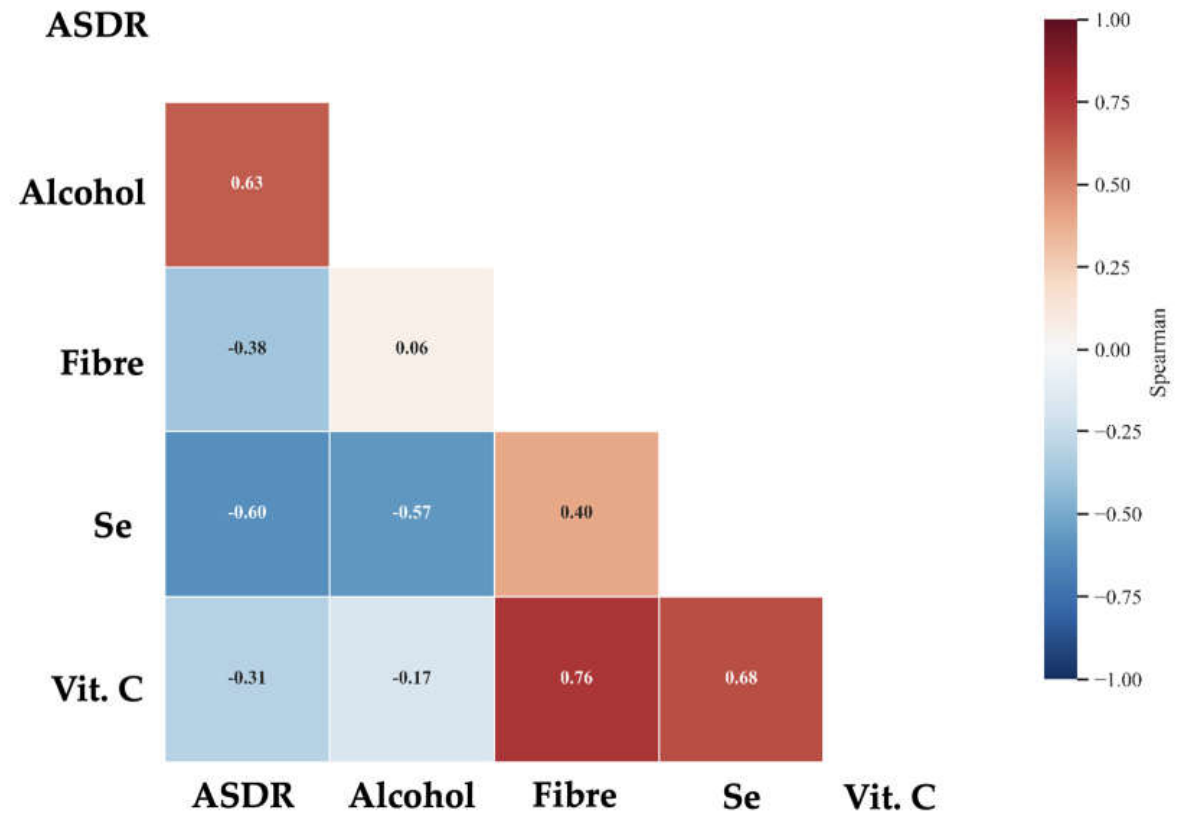
Figure 13.
Scatter matrix of key study variables.
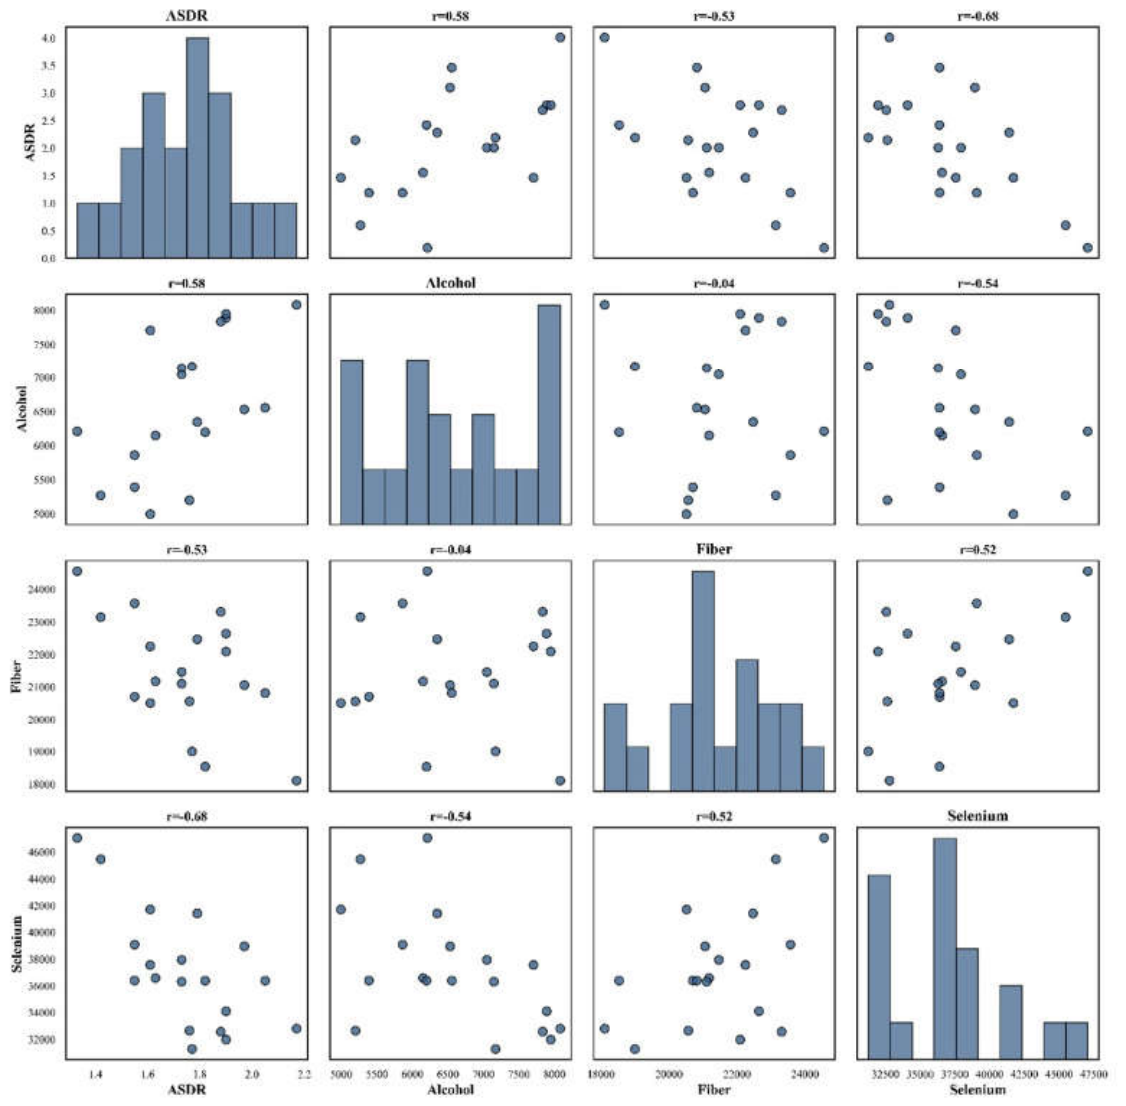

Table 1.
Mean MP exposure (mg/person/year) in each food item [20].
Table 1.
Mean MP exposure (mg/person/year) in each food item [20].
| Food item | Mean MP exposure (mg/person/year) |
|---|---|
| Dairy | 126.5 |
| Grains/ cereals | 104.3 |
| Beverages | 61.5 |
| Poultry | 50.9 |
| Vegetables | 41.0 |
| Processed meats | 34.2 |
| Sugary Foods | 33.1 |
| Alcoholic Drinks | 29.9 |
| Fish / seafood | 21.4 |
| Oils and fats | 18.2 |
| Fruits | 15.5 |
| Red meat | 5.6 |
| TOTAL | 542.0 |
Table 2.
Estimated annual per capita dietary exposure to MPs/NPs from major packaged food categories and ambient inhalation across Italian macro-regions (2022 dataset) (Cornelli et al., 2026c).
Table 2.
Estimated annual per capita dietary exposure to MPs/NPs from major packaged food categories and ambient inhalation across Italian macro-regions (2022 dataset) (Cornelli et al., 2026c).
| Macro-region / Cluster | Representative regions included | Packaged beverages PET (mg/person/year) | Packaged dairy/yogurt PS (mg/person/year) | Processed Meats (PVC, PE) (mg/person/year) | Estimated atmospheric inhalation (mg/person/year) | Total estimated MP/NP exposure (mg/person/year) | Mean ASDR (per 10,000) |
|---|---|---|---|---|---|---|---|
| North Italy | Lombardy, Veneto, Friuli Venezia Giulia, Emilia Romagna, Piedmont/V.d.A., Liguria, Trentino Alto Adige | 12.4 | 6.8 | 5.9 | 4.2 | 29.3 | 1.85 |
| South Italy | Lazio, Toscana, Marche, Molise, Abruzzo, Umbria, Campania, Calabria, Puglia, Basilicata, Sicilia, Sardegna | 9.8 | 4.1 | 3.5 | 1.1 | 18.5 | 1.47 |
Disclaimer/Publisher’s Note: The statements, opinions and data contained in all publications are solely those of the individual author(s) and contributor(s) and not of MDPI and/or the editor(s). MDPI and/or the editor(s) disclaim responsibility for any injury to people or property resulting from any ideas, methods, instructions or products referred to in the content. |
© 2026 by the authors. Licensee MDPI, Basel, Switzerland. This article is an open access article distributed under the terms and conditions of the Creative Commons Attribution (CC BY) license (http://creativecommons.org/licenses/by/4.0/).
Copyright: This open access article is published under a Creative Commons CC BY 4.0 license, which permit the free download, distribution, and reuse, provided that the author and preprint are cited in any reuse.