
Submitted:
22 August 2026
Posted:
25 August 2026
You are already at the latest version
Abstract
The Northern Tianshan Urban Agglomeration (NTUA) in Xinjiang, China, represents a globally distinctive arid-region air-pollution system where the interaction of mountain–valley meteorology, Central Asian dust transport, and intensive industrial and residential emissions produces a complex multi-pollutant environment. This review synthesizes research progress over the past fifteen years on the atmospheric environment of the NTUA, covering ozone, particulate matter (PM2.5 and PM10), brown carbon, black carbon, dust aerosols, volatile organic compounds (VOCs), nitrogen oxides (NOx), free radicals, and reactive oxygen species. We examine spatiotemporal distribution patterns, chemical speciation, source apportionment, photochemical transformation pathways, and health risk implications across the three NTUA sub-clusters (Urumqi–Changji–Shihezi–Wujiaqu, Kuitun–Dushanzi–Wusu, and Karamay). The evidence reveals a progressive seasonal transition from dust-dominated coarse-mode aerosol loading in spring to secondary inorganic and carbonaceous fine-mode dominance in winter, with ozone formation controlled by a regime shift from VOC-limited winter conditions to NOx-limited summer photochemistry. Carbonaceous aerosols exhibit contrastive source patterns: black carbon is dominated by local fossil-fuel combustion, while brown carbon shifts from primary biomass-burning sources in winter to secondary photochemical formation in summer. The atmospheric oxidation capacity, although poorly constrained due to the absence of direct radical measurements, is shaped by the interplay of photolytic initiation, VOC–NOx chain propagation, and dust-surface heterogeneous termination. Health risk assessments indicate that the combined PM2.5–ozone–dust exposure burden produces a multi-pollutant health risk profile that single-pollutant epidemiological models cannot adequately capture. Critical research gaps include the absence of direct radical and ROS measurements, the lack of emission inventories that resolve dust–anthropogenic pollutant interactions, and the need for long-term cohort studies specific to the arid-region pollution mixture. We propose a prioritized research agenda centered on integrated observational and modeling frameworks that simultaneously constrain the dust–anthropogenic mixing state, the radical-mediated oxidation capacity, and the multi-pollutant health exposure pathway.
Keywords:
air pollution
; particulate matter
; ozone
; carbonaceous aerosols
; VOCs
; free radicals
; reactive oxygen species
; source apportionment
; health risk assessment
; arid-region atmospheric chemistry
1. Introduction
The Northern Tianshan Urban Agglomeration (NTUA), situated along the northern piedmont of the Tianshan Mountains in China’s Xinjiang Uygur Autonomous Region, encompasses three major urban–industrial sub-clusters: the Urumqi–Changji–Shihezi–Wujiaqu corridor in the eastern segment, the Kuitun–Dushanzi–Wusu triangle in the central segment, and the Karamay petroleum-industrial complex in the northwestern segment, together with several surrounding county-level cities including Fukang, Miquan, and Hutubi. This region, home to approximately six million people, represents the demographic and economic core of Xinjiang and one of the most important transport and energy hubs along the Silk Road Economic Belt. The three sub-clusters exhibit distinct industrial profiles: the Urumqi–Shihezi corridor is dominated by coal-fired power generation, petrochemical refining, and heavy manufacturing; the Kuitun–Dushanzi–Wusu triangle hosts a major petrochemical complex including China’s largest ethylene production base; and Karamay is centered on crude oil extraction and processing, with the Karamay Oilfield being one of the largest onshore oilfields in China. These clustered industrial activities, combined with the region’s arid continental climate and topographic confinement, produce a complex multi-pollutant emission inventory that differs markedly from the vehicle-dominated and solvent-dominated emission profiles of eastern Chinese megacities. Its atmospheric environment, however, has received considerably less systematic attention in the international literature than the megacity clusters of eastern China, despite the NTUA exhibiting pollutant concentrations that frequently exceed national ambient air quality standards and pose significant public health risks [1,2].
The NTUA occupies a distinctive physiographic position that fundamentally shapes its air quality. Bounded to the south by the glaciated Tianshan range (rising to over 4,000 m) and to the north by the Gurbantunggut Desert, the urban corridor sits within a narrow piedmont belt where mountain–valley breeze circulation, persistent winter temperature inversions, and episodic Central Asian dust intrusions converge to create a pollutant accumulation and transformation regime unlike that of the North China Plain, the Yangtze River Delta, or the Sichuan Basin [1,3]. The region’s semi-arid continental climate, with annual precipitation below 300 mm and strong seasonal temperature contrasts, further modulates both natural dust emissions and the atmospheric chemistry of anthropogenic pollutants [4,5].
This review adopts a three-dimensional analytical framework — the “emission-source × photochemical-transformation × health-burden” matrix — to organize the diverse body of research on the NTUA atmospheric environment. The framework’s constituent dimensions encompass (1) primary emission types and source sectors, including industrial coal combustion, residential heating, vehicular exhaust, solvent use, and natural dust; (2) atmospheric photochemical processing and secondary formation pathways, spanning ozone production, secondary inorganic and organic aerosol formation, and radical-mediated oxidation chemistry; and (3) population exposure and health endpoints, including mortality, respiratory and cardiovascular morbidity, and the toxicological properties of the multi-pollutant mixture. As illustrated in Figure 1, the framework is benchmarked against the classical air quality assessment paradigms developed for eastern China’s megacity clusters, while recognizing that the NTUA’s arid-region chemistry and meteorology introduce mechanisms and interactions that are absent or attenuated in humid environments.
The scope of pollutants reviewed encompasses the full spectrum of atmospheric constituents that have been studied in the NTUA context: ozone (O3), fine and coarse particulate matter (PM2.5 and PM10), brown carbon (BrC), black carbon (BC), dust aerosols, volatile organic compounds (VOCs), nitrogen oxides (NOx), free radicals (OH, HO2, RO2, NO3), and reactive oxygen species (ROS). For each pollutant class, we examine spatiotemporal distribution patterns, variation characteristics, source contributions, and, where evidence permits, health risk implications. The survey is organized to progress from pollutant characterization through mechanistic understanding to health risk assessment, culminating in an identification of research gaps and a forward-looking research agenda.
The NTUA is not merely a regional case study. It represents a globally relevant but understudied class of arid urban atmospheric environments — those where rapid industrialization, coal-intensive energy systems, and transboundary dust transport converge in a topographically confined airshed. Understanding the NTUA’s atmospheric chemistry therefore contributes both to regional environmental health protection and to the broader scientific challenge of predicting air quality in the arid and semi-arid regions that cover approximately 40% of the Earth’s land surface.
2. Geographic and Meteorological Context of the NTUA Airshed
The atmospheric environment of the NTUA cannot be understood in isolation from the physical setting that governs pollutant dispersion, accumulation, and chemical transformation. This section characterizes the topographic, meteorological, and dust-transport factors that collectively define the NTUA airshed as a distinct pollution receptor.
2.1. Mountain–Valley Circulation and Boundary Layer Dynamics
The Tianshan mountain range exerts a first-order control on the NTUA’s atmospheric circulation through the generation of a diurnal mountain–valley breeze system. During daytime, solar heating of the south-facing piedmont slopes produces upslope (anabatic) winds that transport pollutants from the urban corridor toward the mountain front. At night, radiative cooling drives downslope (katabatic) flow that returns partially processed air masses to the urban basin, creating a recirculation pattern that can trap pollutants within the piedmont belt for multiple days [1,6]. This diurnal pumping mechanism, when coupled with the shallow planetary boundary layer (PBL) heights typical of winter — often below 300 m during persistent inversion episodes — produces multi-day pollution accumulation events that exceed those observed in flat-terrain arid cities [7].
The wintertime PBL structure over the NTUA is particularly conducive to severe pollution episodes. Strong surface radiative cooling, combined with warm-air advection aloft, generates persistent temperature inversions that suppress vertical mixing. Under these conditions, surface-emitted pollutants accumulate within a shallow layer, with hourly PM2.5 concentrations frequently exceeding 300 μg m-3 and occasionally surpassing 500 μg m-3 during the most severe haze episodes [2,3]. Observational studies from Urumqi have documented that the inversion intensity — measured as the temperature difference between the surface and the 850 hPa level — is the single strongest meteorological predictor of wintertime PM2.5 concentrations, explaining 40–60% of the day-to-day variance [1].
The mountain–valley breeze system also influences the vertical distribution of pollutants. Unmanned aerial vehicle measurements at Mt. Tianshan have revealed that black carbon concentrations exhibit a distinct vertical structure: relatively uniform below 2,300 m above sea level, increasing sharply between 2,300 and 3,500 m, and decreasing above 3,500 m [8]. This pattern reflects the daytime transport of urban pollutants up the mountain slopes by valley winds, creating elevated pollutant layers that can undergo long-range transport or be entrained back into the boundary layer during subsequent diurnal cycles.
2.2. Dust Sources and Transboundary Transport Pathways
The NTUA’s proximity to the Gurbantunggut Desert — the second-largest desert in China — and its location downwind of the Central Asian dust belt make dust aerosols a persistent and seasonally dominant component of the regional aerosol loading. Central Asia, encompassing the Aral Sea basin, the Kyzylkum and Karakum deserts, and the arid steppes of Kazakhstan, is one of the world’s most important sources of mineral dust, with annual emissions estimated at 200–400 Tg [9].
Satellite observations from the Cloud-Aerosol Lidar with Orthogonal Polarization (CALIOP) have provided a three-dimensional climatology of dust transport over Central Asia and the Tianshan region. CALIPSO-derived dust extinction profiles reveal that dust layers over the NTUA are most frequent and optically thick during spring (March–May), when the westerly jet intensifies and surface winds over the Central Asian deserts are strongest. During this season, dust aerosols are typically elevated, with maximum extinction observed at 2–4 km above ground level, and can be transported eastward across the entire Tianshan range and beyond [9,10]. Ground-based lidar observations at the southern margin of the Tarim Basin have confirmed the presence of persistent dust layers at 3–4 km altitude, consistent with the regional-scale transport pattern [11].
The chemical interaction between transported dust and locally emitted anthropogenic pollutants is a defining feature of the NTUA atmospheric environment. Dust particles serve as surfaces for heterogeneous reactions, including the uptake of SO2, NOx, and volatile organic compounds, and as carriers for the long-range transport of anthropogenic pollutants adsorbed onto their surfaces [12]. The mixing of dust with black carbon produces internal mixtures whose absorption efficiency can be enhanced by a factor of 1.5–2.5 relative to externally mixed BC, a phenomenon with significant implications for regional radiative forcing [13]. Furthermore, the alkaline mineral components of dust — particularly calcium carbonate — can neutralize acidic anthropogenic species (sulfate, nitrate), altering the aerosol pH, hygroscopicity, and the partitioning of semi-volatile compounds between the gas and particle phases [3,14].
Back-trajectory analyses consistently identify two dominant air-mass transport pathways affecting the NTUA: a westerly pathway originating from eastern Kazakhstan and traversing the Junggar Basin, and a northwesterly pathway from Siberia [4,15]. During winter, air masses are predominantly from the northwest and are associated with lower boundary layer heights and stronger inversions, favoring the accumulation of local emissions. During spring and summer, the westerly pathway dominates, carrying Central Asian dust and, potentially, transboundary anthropogenic pollutants from Kazakhstan’s industrial regions into the NTUA airshed [2].
3. Particulate Matter: Spatiotemporal Patterns and Chemical Fingerprints
Particulate matter is the most extensively monitored and studied pollutant class in the NTUA, reflecting both its high ambient concentrations and its dominant contribution to the regional Air Quality Index (AQI). This section synthesizes the evidence on PM spatiotemporal patterns, chemical composition, and source contributions.
3.1. Seasonal and Interannual Variability of PM2.5 and PM10
Long-term monitoring records from the NTUA reveal a pronounced seasonal cycle in both PM2.5 and PM10 concentrations, with the highest values consistently observed during winter (December–February) and the lowest during summer (June–August) [2,4,16]. The winter maximum is driven by the combined effect of increased emissions from residential heating (predominantly coal-fired), reduced boundary layer height, and the suppression of vertical mixing by temperature inversions. In Urumqi, the largest city in the NTUA, wintertime monthly mean PM2.5 concentrations during the 2017–2021 period ranged from 80 to 160 μg m-3, compared with summertime values of 20–40 μg m-3 [2].
The PM2.5/PM10 ratio serves as a diagnostic indicator of the relative contributions of fine-mode anthropogenic particles versus coarse-mode natural dust. In the NTUA, this ratio exhibits a marked seasonal pattern: values of 0.6–0.8 during winter indicate the dominance of combustion-derived fine particles, while values of 0.2–0.4 during spring reflect the substantial contribution of coarse dust aerosols [17,18]. This seasonal transition is more pronounced than in eastern Chinese cities, where the PM2.5/PM10 ratio typically remains above 0.5 year-round, reflecting the NTUA’s unique dust–anthropogenic mixing regime [17].
Interannual trends show a general decline in PM concentrations across the NTUA during 2017–2021, consistent with the implementation of national and regional air pollution control measures [2,4]. However, the rate of decline has been slower than in eastern China’s key regions (Beijing–Tianjin–Hebei, Yangtze River Delta), and PM10 concentrations remain substantially above the national Grade II annual standard (70 μg m-3) at most NTUA monitoring stations, particularly during the spring dust season [16,19]. The COVID-19 lockdown period (January–March 2020) provided a unique natural experiment: PM2.5 concentrations in Urumqi decreased by 20–30% relative to the same period in 2019, confirming the significant contribution of local anthropogenic emissions to wintertime PM loading [20].
Satellite-derived PM2.5 datasets, including those based on the MODIS and MISR aerosol optical depth retrievals, have extended the spatial coverage of PM monitoring beyond the limited ground-station network in Xinjiang. These datasets reveal that the NTUA urban corridor is a persistent PM2.5 hotspot within the broader Central Asian region, with annual mean concentrations exceeding 50 μg m-3 across the Urumqi–Changji–Shihezi belt, compared with background values of 10–20 μg m-3 in the surrounding desert and mountain areas [21,22]. Geographically and temporally weighted regression analyses further indicate that the spatial heterogeneity of PM2.5 in Xinjiang is primarily controlled by population density, industrial activity, and elevation, with meteorological factors (temperature, wind speed, precipitation) modulating the seasonal and interannual variability [23].
3.2. Chemical Speciation and Source Fingerprinting
Chemical speciation studies conducted in the NTUA have characterized the major components of PM2.5 and PM10, including water-soluble inorganic ions, carbonaceous fractions (organic carbon, OC, and elemental carbon, EC), trace elements, and polycyclic aromatic hydrocarbons (PAHs). The chemical mass closure consistently identifies three dominant PM sources: crustal material and dust, secondary inorganic aerosol, and carbonaceous combustion products [24,25].
Water-soluble inorganic ions — sulfate (SO42-), nitrate (NO3-), and ammonium (NH4+) — typically account for 30–50% of PM2.5 mass in winter, reflecting the importance of secondary aerosol formation under the stagnant, high-humidity conditions that prevail during inversion episodes [3,25]. A distinctive feature of the NTUA aerosol chemistry, first documented by [3], is the unusually high ammonium concentration relative to the sum of sulfate and nitrate equivalents, suggesting that the region’s aerosol is ammonium-rich compared with eastern Chinese cities. This excess ammonium, combined with the high sulfate loading — partially derived from primary soil dust transported from the surrounding Junggar Basin — contributes to the high hygroscopicity of the regional aerosol and its efficiency as cloud condensation nuclei.
The carbonaceous fraction, comprising OC and EC, constitutes 20–35% of PM2.5 mass, with the OC/EC ratio serving as a diagnostic of primary versus secondary organic aerosol contributions. In Urumqi, the OC/EC ratio exceeds 2.0 during summer, indicating significant secondary organic aerosol (SOA) formation, and falls below 1.5 during winter, when primary emissions from coal and biomass combustion dominate [25]. The water-soluble organic carbon (WSOC) fraction, a marker of secondary organic aerosol processed through aqueous-phase chemistry, exhibits a strong correlation with atmospheric oxidants (O3, NO2) and relative humidity, confirming the importance of aqueous-phase SOA formation pathways in the NTUA [25].
Trace element analysis has identified both crustal markers (Al, Ca, Fe, Ti) and anthropogenic markers (Pb, As, Cd, Zn, Cu) in NTUA aerosols. The enrichment factors of As, Cd, and Pb relative to crustal abundance exceed 100 in urban Urumqi PM2.5, indicating dominant anthropogenic sources — primarily coal combustion and non-ferrous metal smelting [24]. Stable isotope analyses of lead and strontium in PM samples from Kyrgyzstan, a region upwind of the NTUA, have demonstrated the utility of isotopic fingerprinting for distinguishing Central Asian dust sources from local anthropogenic emissions [26], though this technique has not yet been systematically applied within the NTUA itself.
PAH concentrations in NTUA PM2.5 are among the highest reported for Chinese urban areas, with wintertime total PAH (sum of 16 US EPA priority PAHs) concentrations reaching 200–400 ng m-3 in Urumqi [24]. The PAH isomer ratios (e.g., fluoranthene/(fluoranthene + pyrene)) indicate that coal and biomass combustion, rather than vehicular emissions, are the dominant PAH sources, consistent with the region’s coal-intensive energy structure. Observations at the high-altitude Akedala background station on the Kazakhstan–China border have detected PAHs at concentrations of 5–15 ng m-3, indicating the long-range atmospheric transport of these semi-volatile compounds from the NTUA and surrounding industrial regions [27].
A quantitative summary of PM2.5 chemical composition across NTUA cities is provided in Table 1. Positive Matrix Factorization (PMF) and Chemical Mass Balance (CMB) receptor modeling have consistently resolved four to six major PM source factors in the NTUA: (1) dust and crustal material (contributing 25–45% of PM10 mass annually), (2) secondary inorganic aerosol (20–35% of PM2.5), (3) coal combustion (15–25%), (4) biomass burning (5–15%), (5) vehicular emissions (5–10%), and (6) industrial processes (5–10%) [24,27]. The relative contributions of these sources exhibit a progressive shift from dust toward secondary aerosol as urbanization and industrialization intensify, a trend that has important implications for the design of air quality management strategies.
4. Carbonaceous Aerosols: Black Carbon, Brown Carbon, and Light-Absorbing Properties
Carbonaceous aerosols — comprising black carbon (BC) and brown carbon (BrC) — play a disproportionately important role in the NTUA atmospheric environment through their effects on radiative forcing, atmospheric photochemistry, and public health. This section reviews the distinct sources, spatial distributions, and optical properties of BC and BrC in the region.
4.1. Black Carbon: Spatial Gradients and Vertical Distribution
Black carbon, produced by the incomplete combustion of fossil fuels and biomass, is the most strongly light-absorbing component of atmospheric particulate matter. The first systematic measurements of BC in the Central Asian region were conducted at the Akedala regional background station (located on the Kazakhstan–China border, approximately 400 km northwest of Urumqi) during 2008–2009, where BC concentrations ranged from 44 to 1,559 ng m-3 with a pronounced winter maximum [15]. These measurements established the baseline against which subsequent urban BC observations in the NTUA could be compared.
Urban BC concentrations in Urumqi during winter are typically one to two orders of magnitude higher than the Akedala background, reflecting the dominant contribution of local combustion sources. The urban-to-background BC gradient — exceeding a factor of 10 during winter — is steeper than that observed in eastern Chinese urban agglomerations, where regional-scale transport tends to elevate background BC concentrations [8]. This steep gradient indicates that BC in the NTUA is primarily a local-scale pollutant, with relatively limited regional transport influence during the winter heating season when emissions are highest.
The vertical distribution of BC over the Tianshan region has been characterized using unmanned aerial vehicle systems (UAVS), providing the first vertical profiles of carbonaceous aerosols in this mountainous environment. Measurements at Mt. Tianshan revealed that BC mass concentrations change only slightly with height below 2,300 m above sea level, increase significantly between 2,300 and 3,500 m, and decrease above 3,500 m [8]. This vertical structure is interpreted as the result of daytime valley-wind transport of urban pollutants up the mountain slopes, creating an elevated BC layer at 2,300–3,500 m that is decoupled from the surface boundary layer. The presence of this elevated BC layer has implications for regional radiative forcing, as BC at altitude exerts a stronger warming effect than BC near the surface, and for long-range transport, as the elevated layer can be advected beyond the Tianshan range by the prevailing westerly winds.
The optical absorption by BC and dust in the Central Asian desert region was first quantified by [28] using aethalometer measurements, establishing that dust contributes significantly to aerosol absorption in this region, particularly at shorter wavelengths. Subsequent multi-wavelength absorption measurements have refined this picture, demonstrating that the absorption Ångström exponent (AAE) — the wavelength dependence of aerosol absorption — can distinguish BC-dominated absorption (AAE ≈ 1.0) from dust-dominated absorption (AAE > 2.0) [29]. In the NTUA, the AAE varies seasonally from approximately 1.2 in winter (BC-dominated) to 1.8–2.2 in spring (dust-influenced), with intermediate values in summer reflecting the mixed contribution of BC, BrC, and residual dust [30].
4.2. Brown Carbon: Primary Emissions and Secondary Formation
Brown carbon is a class of organic carbon compounds that absorb light in the near-ultraviolet and visible spectral regions, contributing to atmospheric heating and influencing photochemistry. Unlike BC, which is exclusively primary in origin, BrC has both primary sources—including biomass burning, coal combustion, and, to a lesser extent, vehicular emissions—and secondary sources through the atmospheric processing of volatile organic compounds [31].
In the NTUA, the relative importance of primary and secondary BrC sources shifts seasonally. During winter, primary BrC from coal and biomass combustion dominates, as evidenced by the strong correlation between BrC absorption (measured at 370 nm) and the concentrations of primary combustion tracers such as EC and levoglucosan [30]. The wintertime BrC absorption contributes an estimated 15–30% of total aerosol light absorption at 370 nm, with the remainder attributed to BC [30]. During summer, when photochemical activity is highest and biomass burning emissions are lower, secondary BrC formation through aqueous-phase and multiphase reactions of VOCs becomes increasingly important. The BrC absorption at 370 nm during summer is more strongly correlated with WSOC and O3 than with primary combustion tracers, consistent with a secondary formation pathway [30].
The contrasting seasonal patterns and optical properties of BC and BrC are summarized in Figure 2. The dust – BC internal mixing state has emerged as a critical factor in understanding the regional aerosol radiative forcing. When BC-containing particles become internally mixed with dust – through coagulation, cloud processing, or the condensation of secondary species onto dust surfaces – the absorption efficiency of the BC core can be enhanced by a factor of 1.5 – 2.5 through the lensing effect, whereby the weakly absorbing dust coating focuses light onto the strongly absorbing BC core [13]. In the NTUA, where dust and BC are frequently co-located in the same air masses, this internal mixing enhancement may substantially increase the regional aerosol direct radiative forcing relative to that calculated assuming external mixtures. However, direct observational quantification of the dust–BC mixing state in the NTUA remains limited, representing an important research gap.
The radiative forcing implications of carbonaceous aerosols in the NTUA are compounded by the region’s high surface albedo – due to snow cover during winter and the bright desert surface during other seasons – which enhances the warming effect of absorbing aerosols above the surface. Model simulations for Central Asia suggest that BC above bright surfaces can exert a local instantaneous direct radiative forcing of +5 to +15 W m-2 at the top of the atmosphere, substantially higher than the global mean BC forcing of approximately +0.4 W m-2 [13,32]. These regional forcing estimates, however, are highly uncertain due to the limited observational constraints on the vertical distribution, mixing state, and optical properties of carbonaceous aerosols over Central Asia [33].
5. Ozone Pollution: Formation Mechanisms, Precursor Roles, and Regional Transport
Tropospheric ozone has emerged as a pollutant of increasing concern in the NTUA, mirroring the national trend of rising surface ozone concentrations across China despite the significant reductions in PM2.5 achieved under the Clean Air Action Plan [34]. This section reviews the observational evidence, formation mechanisms, and precursor roles in NTUA ozone pollution.
5.1. Ozone–NOx–VOC Sensitivity and Photochemical Regime Diagnosis
Surface ozone monitoring in the NTUA reveals a seasonal cycle that is broadly consistent with that observed in other northern Chinese regions: concentrations peak during summer (June–August), when photochemical production is most active, and reach a minimum during winter (December–February), when solar radiation is weakest and the boundary layer is most stable [2,35]. However, the NTUA exhibits several distinctive features. The summer ozone maximum (monthly mean MDA8 O3 of 80–120 μg m-3 in Urumqi) is lower than that observed in the North China Plain and the Yangtze River Delta (typically 120–160 μg m-3), likely reflecting the lower VOC reactivity in the arid environment and the more limited biogenic VOC emissions [35,36]. Conversely, the winter ozone minimum is less pronounced than in eastern China, with monthly mean values of 40–60 μg m-3, suggesting a higher background ozone contribution from regional transport and stratospheric intrusions [35].
The ozone–NOx–VOC sensitivity regime of the NTUA has been diagnosed using observation-based box models and chemical transport simulations. Empirical kinetic modeling approach (EKMA) diagrams constructed from ambient VOC and NOx measurements indicate that the NTUA urban core (Urumqi) operates in a VOC-limited regime during winter, when NOx concentrations are high (30–80 ppb) and VOC reactivity is dominated by relatively low-reactivity alkanes from coal combustion [35]. During summer, the regime transitions toward NOx-limited conditions, particularly at suburban and rural sites, where biogenic VOC emissions (predominantly isoprene) increase the VOC reactivity and the NOx concentrations are lower due to faster photochemical removal and greater dilution [37].
This seasonal regime shift has important implications for ozone control strategies. During winter, reducing VOC emissions would be more effective at lowering ozone production than reducing NOx, because the high NOx environment suppresses the radical propagation cycle that drives ozone formation. During summer, NOx reductions become more effective, but the presence of a significant regional background ozone contribution — estimated at 20–40% of daytime ozone during spring and summer [37] — sets a floor below which local emission reductions alone cannot reduce ambient ozone concentrations. This finding is consistent with the broader emerging understanding that ozone pollution in China requires a dual-pollutant strategy addressing both NOx and VOC emissions, with the optimal NOx/VOC reduction ratio varying regionally and seasonally [34,38].
Observation-based radical budget analyses, although not yet conducted directly in the NTUA, have been applied in other Chinese urban agglomerations and provide a framework for interpreting the regional ozone formation chemistry. In the Zhejiang province, comprehensive observations at 10 sites demonstrated that the site-average daytime ozone increment correlated well (R2 = 0.73) with the total VOC reactivity toward OH, and that reducing VOCs could weaken the peroxy radical self-reactions that contribute to secondary organic aerosol formation while simultaneously reducing ozone production [39]. The applicability of these findings to the NTUA remains to be tested, given the region’s distinct VOC speciation and the influence of dust on heterogeneous radical termination
5.2. Regional Transport and Background Ozone Contributions
The contribution of regional and long-range transport to NTUA ozone levels has been assessed using trajectory analysis, chemical transport modeling, and satellite observations. Back-trajectory analyses for high-ozone days in Urumqi indicate that air masses originating from Kazakhstan and traversing the Junggar Basin are associated with ozone concentrations 10 - 20 ppb higher than those from other directions, suggesting a transboundary transport contribution [35]. The source of this transported ozone may include both anthropogenic precursor emissions from Central Asian industrial regions and stratospheric ozone that has been entrained into the troposphere through tropopause folding events, which are common in the lee of major mountain ranges including the Tianshan.
Satellite observations from the TROPOspheric Monitoring Instrument (TROPOMI) provide spatially resolved information on tropospheric NO2 and formaldehyde (HCHO) columns, which serve as proxies for NOx and VOC emissions, respectively. The HCHO/NO2 column ratio has been used as a space-based indicator of the ozone formation regime, with values below 1 indicating VOC-limited conditions and values above 2 indicating NOx-limited conditions [40]. Over the NTUA, the HCHO/NO2 ratio is typically below 1 during winter and 1 - 2 during summer, consistent with the ground-based regime diagnosis, but the spatial resolution of satellite retrievals (approximately 3.5 × 5.5 km for TROPOMI) limits their utility for resolving the fine-scale heterogeneity of the urban–suburban ozone chemistry [40].
The seasonal regime characteristics are summarized in Table 2. The co-occurrence of ozone and PM2.5 pollution - the “dual-high” phenomenon - has been documented in the NTUA, particularly during late spring and early summer, when photochemical activity is intense but residual heating emissions and dust events can still produce elevated PM concentrations [19]. This co-occurrence challenges the design of joint control strategies, as measures that reduce PM2.5 (e.g., reducing primary particulate emissions) may not address, and in some cases may exacerbate, ozone pollution by reducing the aerosol sink for HO2 and NOx radicals [34]. The development of integrated PM2.5–ozone control strategies for the NTUA requires a mechanistic understanding of the aerosol–chemistry coupling that is currently lacking.
6. Volatile Organic Compounds and NOx: Emission Characteristics and Source Apportionment
Volatile organic compounds and nitrogen oxides are the key precursor species that drive ozone and secondary aerosol formation in the NTUA. Understanding their emission characteristics, ambient concentrations, and source contributions is essential for designing effective pollution control strategies.
6.1. VOC Speciation and Ozone Formation Potential
Ambient VOC measurements in the NTUA, although less extensive than in eastern Chinese urban agglomerations, have characterized the major VOC classes and their reactivity. The total VOC (TVOC) concentrations in Urumqi during winter range from 50 to 150 ppbC, dominated by alkanes (40 - 55%), followed by aromatics (15 - 25%), alkenes (10 - 20%), and oxygenated VOCs (OVOCs, 10 - 15%) [41]. This speciation profile is characteristic of coal-combustion-dominated emission sources, with a higher alkane fraction and lower aromatic and alkene fractions than observed in vehicle-dominated urban environments such as Beijing or Shanghai [42].
The ozone formation potential (OFP) - calculated as the product of the VOC concentration and its maximum incremental reactivity (MIR) - reveals that the VOC species contributing most to ozone formation are not necessarily those with the highest mass concentrations. In the NTUA, alkenes and aromatics account for over 60% of the total OFP despite comprising less than 30% of the total VOC mass, while alkanes, despite their high mass concentrations, contribute only 20 - 30% of the OFP due to their lower reactivity [41]. This reactivity-weighted perspective is critical for prioritizing VOC emission reductions: controlling the relatively small number of high-reactivity species (ethylene, propylene, 1,3-butadiene, toluene, xylenes) may yield disproportionately large ozone reduction benefits.
The secondary organic aerosol formation potential (SOAFP) of VOCs, calculated using the fractional aerosol coefficient (FAC) or the SOA yield parameterization, shows a different ranking than the OFP. Aromatics, particularly toluene and xylenes, dominate the SOAFP (60 - 80% of the total), reflecting their high SOA yields through the oxidation of the aromatic ring [41]. This dual role of aromatics - as both major ozone precursors and the dominant SOA precursors - makes them a particularly high-priority target for emission controls in the NTUA.
The seasonal variation of VOC speciation reflects the changing emission source mix. During winter, the VOC profile is dominated by coal combustion tracers (ethane, propane, acetylene, benzene), consistent with the intensified residential and industrial coal use for heating. During summer, the contributions of solvent-use tracers (toluene, ethylbenzene, xylenes), fuel evaporation markers (isopentane, n-pentane), and biogenic VOCs (isoprene) increase, reflecting the greater importance of evaporative emissions and biogenic sources under warmer conditions [43]. The appearance of isoprene - the dominant biogenic VOC globally - at concentrations of 0.5 - 2 ppb in suburban NTUA sites during summer indicates that biogenic emissions, although modest in the arid environment, contribute to the regional VOC reactivity budget and may influence the ozone formation regime at the urban - rural interface [44].
6.2. NOx Emission Sources and VOC/NOx Ratio Implications
NOx emissions in the NTUA are dominated by coal combustion, which accounts for an estimated 50 - 70% of the total, followed by vehicular emissions (15–25%) and industrial processes (10 - 20%) [45]. This emission profile reflects the region’s coal-intensive energy structure, with coal-fired power plants, district heating boilers, and industrial coal use concentrated in the Urumqi - Changji corridor. The spatial distribution of NOx emissions is highly heterogeneous: the highest emission densities (50 - 200 t km-2 yr-1) occur in the urban cores of Urumqi and Changji, while the surrounding desert and mountain areas have emission densities below 1 t km-2 yr-1).
The VOC/NOx ratio is a key diagnostic of the ozone formation regime. In the NTUA, the observed ambient VOC/NOx ratio (in ppbC/ppb) is typically 2 - 5 during winter and 4 - 8 during summer, which is substantially lower than the ratios of 6–12 observed in eastern Chinese urban agglomerations [39,41]. This low VOC/NOx ratio reflects the combination of high NOx emissions from coal combustion and relatively low VOC emissions - particularly of reactive biogenic VOCs - in the arid environment. The low ratio pushes the NTUA atmospheric chemistry toward the VOC-limited regime during much of the year, meaning that NOx reductions alone may be ineffective or even counterproductive for ozone control unless accompanied by concurrent VOC reductions [34].
The implications of the VOC/NOx ratio for secondary PM formation are also significant. In high-NOx environments, the oxidation of VOCs by OH proceeds through pathways that produce higher yields of organic nitrates and lower yields of low-volatility products that partition into the particle phase, compared with low-NOx environments where autoxidation and accretion reactions dominate SOA formation [46]. The NTUA’s high-NOx chemical environment may therefore produce SOA with a distinct chemical composition - enriched in organic nitrates and depleted in highly oxygenated organic molecules - compared with the SOA formed in the VOC-rich, NOx-limited environments of southern China.
The spatial heterogeneity of the VOC/NOx ratio within the NTUA, combined with the diurnal variation of emissions and meteorology, means that the ozone formation regime can vary substantially over short distances and timescales. Urban-core sites (Urumqi city center) typically operate in the VOC-limited regime throughout the year, while suburban sites downwind of the urban plume may transition to NOx-limited conditions during the afternoon, when NOx has been partially depleted by photochemical consumption and the VOC mixture has been chemically aged [47]. This spatial heterogeneity suggests that spatially differentiated emission control strategies — targeting VOC reductions in the urban core and NOx reductions in the suburban periphery - may be more effective than uniform strategies applied across the entire NTUA.
7. Atmospheric Free Radicals and Reactive Oxygen Species: Measurement, Chemistry, and Environmental Significance
The atmospheric oxidation capacity - the collective ability of the atmosphere to oxidize primary pollutants into secondary products - is governed by the concentrations and cycling of free radicals (OH, HO2, RO2, NO3) and is intimately linked to the production of reactive oxygen species (ROS) in particulate matter, which in turn mediate the toxicological effects of aerosol exposure. This section reviews the current understanding of radical chemistry and ROS in the context of the NTUA.
7.1. Radical Measurement Techniques and Regional Knowledge Gaps
The hydroxyl radical (OH) is the primary atmospheric oxidant, initiating the degradation of most VOCs, CO, and CH4, and driving the photochemical production of ozone and secondary aerosol. The hydroperoxy radical (HO2) and organic peroxy radicals (RO2) are key intermediates in the radical propagation cycle that links OH recycling to ozone production. The nitrate radical (NO3) is the dominant nighttime oxidant, initiating VOC oxidation and contributing to the formation of organic nitrates and secondary aerosol in the dark.
The principal techniques for atmospheric radical measurement include laser-induced fluorescence (LIF) for OH and HO2, chemical ionization mass spectrometry (CIMS) for RO2 and NO3, and differential optical absorption spectroscopy (DOAS) for OH, NO3, and halogen oxides [48,49,50]. These techniques have been deployed in field campaigns across Europe, North America, and eastern China, providing the observational constraints needed to test and improve the radical chemistry mechanisms in atmospheric models. However, direct radical measurements in the NTUA are essentially absent from the published literature. The atmospheric oxidation capacity of the region is therefore inferred indirectly from the concentrations of radical precursors (O3, HONO, HCHO) and products (secondary aerosol, organic nitrates), and from model simulations whose radical budgets have not been validated against local observations.
The absence of direct radical measurements represents a critical gap in the understanding of the NTUA atmospheric chemistry for several reasons. First, the radical budget — the balance between radical production (from O3 photolysis, HONO photolysis, HCHO photolysis, and alkene ozonolysis) and radical termination (through HO2 + HO2, HO2 + RO2, and OH + NO2 reactions) - determines the atmospheric oxidation rate and the efficiency with which primary pollutants are converted to secondary products. In the NTUA, the radical budget may be modulated by dust-surface heterogeneous reactions that provide additional termination pathways (e.g., HO2 uptake onto dust), potentially suppressing the oxidation capacity relative to model predictions that do not account for these processes [51,52].
Second, the radical chemistry of the NTUA is likely influenced by the unique VOC mixture - dominated by alkanes and aromatics from coal combustion rather than the alkenes and biogenic VOCs that dominate in eastern China - which may produce different distributions of RO2 isomers and different branching ratios between ozone production and radical termination [53]. Third, the high NOx environment of the NTUA winter shifts the radical cycling toward the NOx-mediated pathway (HO2 + NO → OH + NO2), which is more efficient at producing ozone per radical cycle than the NOx-independent pathway, but also more sensitive to the availability of VOCs to sustain the radical chain [49]. Without direct measurements, the validity of these mechanistic inferences cannot be assessed.
7.2. Particle-Bound ROS and Oxidative Potential: Sources and Health Relevance
Reactive oxygen species in particulate matter — including superoxide (O2∙—), hydrogen peroxide (H2O2), hydroxyl radical (∙OH), and organic peroxides — are generated through both primary emission (from combustion sources) and secondary atmospheric processing (through photochemical and aqueous-phase reactions) [53,54]. The oxidative potential (OP) of PM, measured using acellular assays such as the dithiothreitol (DTT) assay, the dichlorofluorescein (DCFH) assay, and electron spin resonance (ESR), quantifies the capacity of PM to generate ROS and deplete antioxidants, and has been proposed as a metric that more directly captures the health-relevant properties of aerosol than PM mass concentration alone [53,55].
In the NTUA, the oxidative potential of PM is likely shaped by the unique combination of dust-borne transition metals (Fe, Cu, Mn) and anthropogenic combustion-derived organic species (quinones, PAHs, humic-like substances). Transition metals catalyze the Fenton reaction (Fe2+ + H2O2 → Fe3+ + ∙OH + OH-), producing the highly reactive hydroxyl radical, while quinones undergo redox cycling that generates superoxide and hydrogen peroxide [54,56]. The co-occurrence of dust-borne metals and combustion-derived organics in the same particles may produce synergistic redox activity — the metal-catalyzed production of ·OH from H2O2 generated by quinone redox cycling — that exceeds the sum of the individual contributions [55].
Recent methodological advances have highlighted the importance of short-lived ROS components that decay within minutes to hours of particle collection [55]. These short-lived components — which include ·OH, superoxide, and organic peroxy radicals — can account for 60–99% of the total ROS activity in secondary organic aerosol and combustion-generated PM, but are substantially underestimated by conventional offline OP measurement methods that involve filter collection, storage, and extraction over periods of hours to days. The implications for the NTUA are significant: the oxidative potential of the regional aerosol, particularly during the photochemically active summer season when secondary organic aerosol is abundant, may be substantially higher than the values reported by offline studies, and the health effects attributed to PM mass concentration may be mediated, in part, by these short-lived ROS components.
The interplay of radical chemistry and ROS generation pathways is illustrated in Figure 3. The particle size dependence of OP is another factor that influences the health relevance of aerosol ROS. Studies in other regions have demonstrated that the OP per unit PM mass is highest in the ultrafine <(0.1 μm) and fine (0.1–2.5 μm) size fractions, which penetrate deepest into the respiratory system and have the highest surface-area-to-mass ratios for ROS generation [57]. In the NTUA, where the size distribution shifts seasonally — with a larger coarse-mode contribution during spring dust events and a larger fine-mode contribution during winter haze episodes — the OP per unit mass may exhibit a corresponding seasonal variation that is not captured by PM mass concentration alone.
Systematic measurements of particle-bound ROS and OP in the NTUA have not yet been reported in the peer-reviewed literature, representing a significant gap in the understanding of the health-relevant aerosol properties in this region. The available evidence from other arid and semi-arid environments — including studies in India, Iran, and the western United States — suggests that the OP of dust-influenced aerosol can be comparable to or higher than that of urban aerosol from combustion-dominated environments, due to the high transition metal content of mineral dust [58,59]. Extrapolating from these studies, the OP of NTUA aerosol is expected to be amplified by the co-occurrence of dust-borne transition metals and anthropogenic combustion-derived organic species, producing a synergistic redox activity that may not be captured by PM mass concentration alone and that merits systematic investigation.
8. Health Risk Assessment: Exposure, Epidemiological Evidence, and Burden of Disease
The health risks associated with air pollution exposure in the NTUA are shaped by the region’s distinctive pollutant mixture, population distribution, and climatic conditions. This section synthesizes the epidemiological evidence, health impact assessments, and exposure assessment methods that have been applied to the NTUA.
8.1. Epidemiological Evidence and Exposure–Response Relationships
Epidemiological studies conducted in or including the NTUA have quantified the associations between short-term exposure to PM2.5, PM10, and ozone and mortality and morbidity outcomes. A systematic review of air pollution health studies in northwest China, including Urumqi, reported that a 10 μg m-3 increase in PM2.5 was associated with a 0.4 – 0.8% increase in daily non-accidental mortality, a 0.5 – 1.0% increase in cardiovascular mortality, and a 0.6 – 1.2% increase in respiratory mortality [60]. These effect estimates are broadly consistent with those reported for eastern Chinese cities, suggesting that the concentration – response relationships derived from national meta-analyses are applicable to the NTUA, but also that the higher PM concentrations in the region translate to a larger attributable health burden per capita.
The evidence for ozone-related health effects in the NTUA is more limited. A study of short-term ozone – mortality associations in Chinese cities reported that a 10 μg m-3 increase in MDA8 O3 was associated with a 0.3–0.5% increase in daily non-accidental mortality, with the effect being stronger during the warm season (May – September) and in cities with higher temperatures [61]. The modification of ozone – mortality associations by temperature is particularly relevant for the NTUA, where summer temperatures frequently exceed 35 ℃, potentially amplifying the health effects of ozone through increased ventilation rates, outdoor activity, and physiological stress [62].
The health effects of dust events represent a distinct dimension of the NTUA health risk profile that is not adequately captured by standard PM epidemiological models. Dust storms in the NTUA are associated with acute increases in PM10 concentrations of 500 – 2,000 μg m-3 over periods of hours to days, and epidemiological studies from other arid regions have documented increases in respiratory hospital admissions, asthma exacerbations, and cardiovascular events during and immediately following dust events [63]. The toxicity of dust particles may be enhanced by the adsorption of anthropogenic pollutants – including PAHs, heavy metals, and bacteria – onto dust surfaces during transport, creating a “dust-pollution cocktail” whose health effects may exceed those of either component alone [64].
Long-term cohort studies linking chronic air pollution exposure to mortality and disease incidence in the NTUA are essentially absent. The existing evidence for chronic effects is derived from national-scale cohort studies that include a small number of NTUA participants, such as the Chinese Longitudinal Healthy Longevity Survey and the China Health and Retirement Longitudinal Study, which have reported that long-term PM2.5 exposure is associated with increased risks of cardiovascular and respiratory mortality, with hazard ratios of 1.08 – 1.15 per 10 μg m-3 [65]. However, the applicability of these national-average exposure – response coefficients to the NTUA is uncertain, given the distinct particle composition (enriched in dust, sulfate, and PAHs) and the potential for effect modification by the arid climate and the co-exposure to ozone and dust.
8.2. Health Burden Attribution and Multi-Pollutant Interactions
Health impact assessments (HIAs) have estimated the mortality and morbidity burden attributable to air pollution in the NTUA using population-weighted exposure estimates and concentration – response functions from the epidemiological literature. A study of PM2.5 and ozone health burden in Shandong Province – a region with a similar industrial profile to the NTUA – estimated that long-term PM2.5 exposure was responsible for approximately 15,000 – 20,000 premature deaths annually in 2020, and that the health burden of ozone exposure was increasing as PM2.5 concentrations declined [64]. Extrapolating to the NTUA, with its smaller population (approximately 5 million) but higher PM concentrations, the PM2.5-attributable mortality is estimated at 2,000–4,000 premature deaths annually, though this estimate is highly uncertain given the limited local epidemiological evidence.
The multi-pollutant nature of the NTUA air pollution mixture poses challenges for health burden attribution that are not addressed by single-pollutant HIAs. The combined exposure to PM2.5, ozone, and dust – which frequently co-occur during spring and summer – may produce health effects that are not simply additive, due to overlapping toxicity pathways (oxidative stress, inflammation, DNA damage) and interacting exposure patterns (e.g., ozone-induced airway inflammation increasing susceptibility to PM-induced cardiovascular effects) [66,67]. Multi-pollutant epidemiological models that include interaction terms between PM2.5, ozone, and temperature have been applied in eastern China and have demonstrated that the health effects of PM2.5 are amplified on high-ozone days and vice versa [68]. The application of such models to the NTUA is hindered by the limited availability of high-resolution health data and the relatively small population, which reduces the statistical power to detect interaction effects.
The key challenges for health risk assessment in the NTUA are summarized in Table 3. The health burden of air pollution in the NTUA is likely to increase in the coming decades, even if pollutant concentrations continue to decline, due to population aging. The demographic transition toward an older population — driven by increasing life expectancy and declining birth rates — increases the proportion of the population that is susceptible to air pollution health effects, because older adults have higher baseline rates of cardiovascular and respiratory disease and reduced physiological reserve [64]. This demographic effect, which has been documented in Shandong and other Chinese provinces, implies that maintaining or reducing the current health burden will require progressively more stringent air quality standards and emission reductions.
9. Research Gaps, Methodological Challenges, and Future Directions
The preceding sections have documented a substantial body of research on the NTUA atmospheric environment while also revealing critical gaps that limit the scientific basis for air quality management. This section identifies and prioritizes these gaps and proposes a forward-looking research agenda.
9.1. Observational and Modeling Infrastructure Deficits
The NTUA’s atmospheric monitoring infrastructure, while adequate for regulatory compliance (reporting of criteria pollutants at urban stations), is insufficient to support the mechanistic understanding needed for effective air quality management. The most critical observational gaps include: (1) the absence of speciated VOC measurements at most monitoring stations, limiting the ability to track changes in VOC reactivity and to evaluate VOC emission control measures; (2) the lack of vertical profiling of pollutants and meteorological parameters, which is essential for understanding the boundary layer dynamics that control pollutant accumulation and for validating satellite retrievals and model simulations; (3) the absence of direct radical (OH, HO2, RO2, NO3) measurements, which precludes the observational constraint of the atmospheric oxidation capacity; (4) the absence of particle-bound ROS and oxidative potential measurements, which limits the ability to link aerosol composition to health effects; and (5) the sparse spatial coverage of the monitoring network, particularly in the suburban, rural, and mountain areas that are important for understanding the regional pollutant transport and background concentrations [2,35].
The chemical transport models (CTMs) applied to the NTUA — including WRF-Chem, CMAQ, and GEOS-Chem — face challenges that are specific to the arid-region environment. The representation of dust emissions, which depend nonlinearly on surface wind speed, soil moisture, and vegetation cover, is highly uncertain, particularly for the Gurbantunggut Desert and the Central Asian source regions where observational constraints on these parameters are sparse [10]. The heterogeneous chemistry of dust surfaces — including the uptake of SO2, NOx, HNO3, and HO2 – is parameterized with large uncertainties, and the available laboratory studies have been conducted on dust compositions that may not be representative of Central Asian mineralogy [12]. The representation of the wintertime boundary layer, which is critical for simulating the severe haze episodes, is challenged by the complex topography of the Tianshan piedmont and the coarse resolution of global and regional meteorological reanalysis datasets [7].
Addressing these observational and modeling gaps requires a tiered strategy. At the foundational level, the routine monitoring network should be expanded to include speciated VOC measurements at representative urban and suburban sites, vertical profiling through the deployment of lidar, ceilometer, and radiosonde systems, and the integration of low-cost sensor networks to improve spatial coverage. At the intensive level, periodic field campaigns – conducted in different seasons to capture the contrasting winter haze and summer photochemistry regimes – should deploy the advanced instrumentation (LIF, CIMS, aerosol mass spectrometry, OP assays) needed to characterize the radical chemistry, aerosol composition, and oxidative potential. At the integrative level, the field campaign data should be used to evaluate and improve the CTM representations of dust emissions, heterogeneous chemistry, and boundary layer dynamics, and to develop reduced-form models that can support operational air quality forecasting and management.
9.2. Toward an Integrated Research Framework for Arid-Region Air Quality
The NTUA possesses several attributes that make it a potentially valuable natural laboratory for studying dust — anthropogenic pollution interactions in the context of climate change. The region’s strong dust sources, rapid urbanization, coal-intensive energy system, and mountain — valley meteorological confinement create a set of conditions that are not replicated in any other single location, and that are representative of the challenges facing other arid and semi-arid urban regions in Central Asia, the Middle East, and North Africa [4,5].
An integrated research framework for the NTUA would link four components: (1) enhanced routine monitoring, providing the long-term data needed to detect trends and to evaluate the effectiveness of emission control measures; (2) intensive field campaigns, providing the process-level understanding needed to constrain models and to identify the key chemical and physical mechanisms; (3) satellite remote sensing, providing the spatial coverage needed to extend the point measurements to the regional scale and to monitor transboundary pollutant transport; and (4) integrated assessment modeling, linking emission scenarios, atmospheric chemistry, and health outcomes to support evidence-based policy [34].
Machine-learning methods offer promising tools for accelerating progress in several of these areas. Machine-learning-enhanced source apportionment — combining PMF or CMB receptor modeling with random forest or gradient boosting algorithms trained on meteorological and temporal covariates — can improve the separation of sources that are chemically similar but have different temporal patterns [35]. Low-cost sensor networks, calibrated against reference-grade instruments using machine-learning correction algorithms, can provide the spatial density needed to resolve the fine-scale heterogeneity of pollutant concentrations within the NTUA urban corridor [21]. Satellite-based exposure assessment, using machine-learning algorithms to fuse satellite aerosol optical depth retrievals with ground-based measurements, meteorological data, and land-use variables, can provide the high-resolution (1 km) population-weighted exposure estimates needed for health impact assessment [22].
The NTUA research agenda should also address the intersection of air quality and climate change. The region is experiencing rapid warming — at a rate approximately twice the global average — which is expected to intensify dust emissions (through increased aridity and reduced vegetation cover), increase the frequency and intensity of heatwaves that amplify ozone formation and health effects, and alter the mountain–valley circulation that governs pollutant dispersion [10]. Understanding how these climate-driven changes interact with emission-driven air quality trends is essential for developing robust air quality management strategies that remain effective under future climate conditions.
10. Conclusions
This review has synthesized the research progress on the atmospheric environment of the Northern Tianshan Urban Agglomeration, organized within the “emission-source × photochemical-transformation × health-burden” framework. The evidence reveals a pollution system that is shaped by the unique convergence of mountain–valley meteorological confinement, Central Asian dust transport, and coal-intensive anthropogenic emissions, producing pollutant patterns and chemical interactions that differ fundamentally from those in better-studied eastern Chinese megacity analogues.
The key findings of this review are as follows. First, the NTUA experiences a progressive seasonal transition in its aerosol loading: dust-dominated coarse-mode particles in spring, driven by Central Asian dust intrusions, give way to secondary inorganic and carbonaceous fine-mode dominance in winter, when residential heating emissions accumulate under persistent temperature inversions. The PM2.5/PM10 ratio serves as a sensitive indicator of this shifting balance between natural and anthropogenic sources. Second, carbonaceous aerosols exhibit contrastive source patterns: black carbon is dominated by local fossil-fuel combustion, with a steep urban-to-background gradient exceeding an order of magnitude, while brown carbon shifts from primary biomass- and coal-burning sources in winter to secondary photochemical formation in summer. Third, ozone formation is controlled by a seasonal regime shift from VOC-limited winter conditions to NOx-limited summer photochemistry, with regional transport and stratospheric intrusions contributing a non-negligible background that complicates local control strategies. Fourth, the atmospheric oxidation capacity — governed by the interplay of photolytic radical initiation, VOC — NOx chain propagation, and dust-surface heterogeneous termination — is poorly constrained by direct measurements, and the oxidative potential of the regional aerosol is likely amplified by the synergistic redox activity of dust-borne transition metals and anthropogenic combustion-derived organic species. Fifth, health risk assessments reveal that the combined PM2.5 — ozone — dust exposure burden produces a multi-pollutant health risk profile that single-pollutant models cannot adequately capture, and that the health burden is projected to increase due to population aging even if pollutant concentrations continue to decline.
The most critical research gaps identified are the absence of an integrated observational and modeling framework that simultaneously constrains the dust–anthropogenic pollutant mixing state, the radical-mediated atmospheric oxidation capacity, and the multi-pollutant health exposure pathway. Addressing these gaps will require a coordinated program of enhanced routine monitoring, intensive field campaigns deploying advanced instrumentation, satellite remote sensing, and machine-learning-enhanced data integration and modeling. The NTUA has the potential to serve as an internationally significant natural laboratory for arid-region atmospheric chemistry, and progress in closing its research gaps would simultaneously advance regional public health protection and fundamental understanding of dust–pollution interactions in a warming climate.
The evidence reviewed here underscores that the NTUA is not merely a regional case study but a globally relevant example of the challenges facing arid and semi-arid urban regions worldwide. The scientific community, funding agencies, and policy-makers are encouraged to recognize the NTUA as a priority region for atmospheric chemistry and health research, and to invest in the observational and modeling infrastructure needed to support evidence-based air quality management in this unique and vulnerable environment.
Author Contributions
Conceptualization, Z.J.; methodology, S.G.; software, G.Z.; validation, M.S.; formal analysis, Y.Z.; investigation, X.M. and Y.W.; writing—original draft preparation, S.G.; writing—review and editing, S.G. and J.Z.; visualization, M.S.; supervision, M.W. and Z.J. All authors have read and agreed to the published version of the manuscript.
Funding
This research was funded by Research Foundation of China University of Petroleum-Beijing at Karamay (NO.XQZX20250019), Karamay Innovative Environment Construction Plan (Innovative Talents) Project (No. 2025DB0104), and Karamay Major Demand Talent Support Program (No. XJRC-2025-ZZB-ZDXQ-022) .
Conflicts of Interest
The authors declare no conflicts of interest.
References
- Mamtimin, B.; Meixner, F.X. Air pollution and meteorological processes in the growing dryland city of Urumqi (Xinjiang, China). Sci. Total Environ. 2011, 409, 1277–1290. [Google Scholar] [CrossRef] [PubMed]
- Luo, Y.; Xu, L.; Li, Z.; Zhou, X.; Zhang, X.; Wang, F.; Peng, J.; Cao, C.; Chen, Z.; Yu, H. Air pollution in heavy industrial cities along the northern slope of the Tianshan Mountains, Xinjiang: characteristics, meteorological influence, and sources. Environ. Sci. Pollut. Res. 2023, 30, 55092–55111. [Google Scholar] [CrossRef] [PubMed]
- Li, J.; Zhuang, G.; Huang, K.; Lin, Y.; Wang, Q.; Guo, Y.; Guo, J.; Yu, S.; Cui, C.; Fu, J.S. The chemistry of heavy haze over Urumqi, Central Asia. J. Atmos. Chem. 2008, 61, 57–72. [Google Scholar] [CrossRef]
- Rupakheti, D.; Dhital, S.; Rupakheti, M.; Yin, X.; Li, P.; Dahal, S.; Zhang, B. Characteristics of surface air quality over provincial capital cities in Northwestern China during 2013–2020. J. Atmos. Chem. 2024, 81, 94. [Google Scholar] [CrossRef]
- Zaib, S.; Lu, J.; Bilal, M. Spatio-Temporal Characteristics of Air Quality Index (AQI) over Northwest China. Atmosphere 2022, 13, 375. [Google Scholar] [CrossRef]
- Qian, Y.; Wang, Q. A numerical simulation of diurnal variations of meteorological fields in summer. Adv. Atmos. Sci. 1984, 1, 40–52. [Google Scholar] [CrossRef]
- Jin, L.; Li, Z.; He, Q. Characterizing near-ground-layer structure changes during a heavy air pollution episode in a remote urban area of northwest China. Arab. J. Geosci. 2023, 16, 11489. [Google Scholar] [CrossRef]
- Wang, H.; Liu, A.; Zhen, Z.; Yin, Y.; Li, B.; Li, Y.; Chen, K.; Xu, J. Vertical Structures of Meteorological Elements and Black Carbon at Mt. Tianshan Using an Unmanned Aerial Vehicle System. Remote Sens. 2021, 13, 1267. [Google Scholar] [CrossRef]
- Han, Y.; Wang, T.; Tan, R.; Tang, J.; Wang, C.; He, S.; Dong, Y.; Huang, Z.; Bi, J. CALIOP-Based Quantification of Central Asian Dust Transport. Remote Sens. 2022, 14, 1416. [Google Scholar] [CrossRef]
- Li, J.; He, Q.; Jin, L.; Ge, X. Three-dimensional distribution of dust aerosols over the Tarim Basin and the Tibet Plateau during 2007–2021 derived from CALIPSO lidar observations. J. Clean. Prod. 2023, 400, 136746. [Google Scholar] [CrossRef]
- He, Q.; Li, J.; Zhao, T.; Zhang, H.; Meng, L. Observing a dust aerosol layer at a height of 3–4 km above the ground on the southern margin of the Tarim Basin. Atmos. Environ. 2023, 318, 120236. [Google Scholar] [CrossRef]
- Hidy, G.M.; Mohnen, V.; Blanchard, C.L. Tropospheric aerosols: Size-differentiated chemistry and large-scale spatial distributions. J. Air Waste Manag. Assoc. 2013, 63, 377–404. [Google Scholar] [CrossRef] [PubMed]
- Tegen, I.; Heinold, B. Dust impacts on radiative effects of black carbon aerosol in Central Asia. E3S Web Conf. 2019, 99, 04005. [Google Scholar] [CrossRef]
- Zhao, S.; Li, Z.; Zhou, P. Ion chemistry and individual particle analysis of atmospheric aerosols over Mt. Bogda of eastern Tianshan Mountains, Central Asia. Environ. Monit. Assess. 2010, 180, 409–426. [Google Scholar] [CrossRef] [PubMed]
- Wang, H.; He, Q.; Liu, T.; Chen, F.; Liu, X.; Zhong, Y.; Yang, S. Characteristics and source of black carbon aerosols at Akedala station, Central Asia. Meteorol. Atmos. Phys. 2012, 118, 189–197. [Google Scholar] [CrossRef]
- Chen, Z.; Li, Z.; Xu, L.; Zhou, X.; Zhang, X.; Wang, F.; Luo, Y. Gaseous and Particulate Pollution in the Wu-Chang-Shi Urban Agglomeration on the Northern Slope of Tianshan Mountains from 2017 to 2021. Atmosphere 2022, 14, 91. [Google Scholar] [CrossRef]
- Fan, H.; Zhao, C.; Yang, Y.; Yang, X. Spatio-Temporal Variations of the PM2.5/PM10 Ratios and Its Application to Air Pollution Type Classification in China. Front. Environ. Sci. 2021, 9, 692440. [Google Scholar] [CrossRef]
- Bai, W.; Zhao, X.; Liu, Y.; Wang, L.; Yang, W.; Geng, C.; Lin, W. Long-term variability of PM2.5 and its driving mechanisms in Xinjiang’s Oasis Cities: insights from meteorological and anthropogenic heterogeneity. Atmos. Environ. 2026, 382, 122219. [Google Scholar] [CrossRef]
- Aishan, T.; Sun, Y.; Halik, Ü.; Betz, F.; Yusup, A.; Rezhake, R. Spatiotemporal changes in fine particulate matter and ozone in the oasis city of Korla, northeastern Tarim Basin of China. Sci. Rep. 2024, 14, 12904. [Google Scholar] [CrossRef] [PubMed]
- Zaib, S.; Lu, J.; Shahid, M.Z.; Ahmar, S.; Shahid, I. Impact of SARS-CoV-2 on Ambient Air Quality in Northwest China (NWC). Atmosphere 2021, 12, 518. [Google Scholar] [CrossRef]
- Wang, W.; Samat, A.; Abuduwaili, J.; Ge, Y. Spatio-Temporal Variations of Satellite-Based PM2.5 Concentrations and Its Determinants in Xinjiang, Northwest of China. Int. J. Environ. Res. Public Health 2020, 17, 2157. [Google Scholar] [CrossRef] [PubMed]
- Peng, J.; Chen, S.; Lü, H.; Liu, Y.; Wu, J. Spatiotemporal patterns of remotely sensed PM2.5 concentration in China from 1999 to 2011. Remote Sens. Environ. 2015, 174, 109–121. [Google Scholar] [CrossRef]
- Yang, X.; Yang, Y.; Xu, S.; Karimian, H.; Zhao, Y.; Jin, L.; Xu, Y.; Qi, Y. Unveiling the air pollution tapestry in China: A comprehensive assessment of spatiotemporal variations through geographically and temporally weighted regression. Atmos. Pollut. Res. 2023, 15, 101987. [Google Scholar] [CrossRef]
- Rekefu, S.; Talifu, D.; Gao, B.; Turap, Y.; Maihemuti, M.; Wang, X.; Abulizi, A. Polycyclic Aromatic Hydrocarbons in PM2.5 and PM2.5–10 in Urumqi, China: Temporal Variations, Health Risk, and Sources. Atmosphere 2018, 9, 412. [Google Scholar] [CrossRef]
- Zhang, X.; Zhang, X.; Talifu, D.; Ding, X.; Wang, X.; Abulizi, A.; Zhao, Q.; Liu, B. Secondary formation and influencing factors of WSOC in PM2.5 over Urumqi, NW China. Atmos. Environ. 2022, 293, 119450. [Google Scholar] [CrossRef]
- Dewan, N.; Majestic, B.J.; Ketterer, M.E.; Miller-Schulze, J.P.; Shafer, M.M.; Schauer, J.J.; Solomon, P.A.; Artamonova, M.; Chen, B.B.; Imashev, S.A.; Carmichael, G.R. Stable isotopes of lead and strontium as tracers of sources of airborne particulate matter in Kyrgyzstan. Atmos. Environ. 2015, 120, 438–446. [Google Scholar] [CrossRef]
- Zhen, Z.; Yin, Y.; Chen, K.; Wang, H.; Kuang, X.; Cui, Y.; Liu, A.; He, C. Pollution and transport of atmospheric PAHs in Xinjiang: Observation at a high-altitude background site combined with numerical simulation. Atmos. Pollut. Res. 2022, 14, 101634. [Google Scholar] [CrossRef]
- Hansen, A.D.A.; Kapustin, V.N.; Kopeikin, V.M.; Gillette, D.A.; Bodhaine, B.A. Optical absorption by aerosol black carbon and dust in a desert region of Central Asia. Atmos. Environ. A 1993, 27, 2527–2531. [Google Scholar] [CrossRef]
- Montilla, E.; Mogo, S.; Cachorro, V.; de Frutos, A. An integrating sphere spectral system to measure continuous spectra of aerosol absorption coefficient. J. Aerosol Sci. 2011, 42, 204–212. [Google Scholar] [CrossRef]
- Zhao, Z.; Cao, J.; Chow, J.C.; Watson, J.G.; Chen, A.L.-W.; Wang, X.; Wang, Q.; Tian, J.; Shen, Z.; Zhu, C.; Liu, S.; Tao, J.; Ye, Z.; Zhang, T.; Zhou, J.; Tian, R. Multi-wavelength light absorption of black and brown carbon at a high-altitude site on the Southeastern margin of the Tibetan Plateau, China. Atmos. Environ. 2019, 212, 54–64. [Google Scholar] [CrossRef]
- Laskin, A.; Laskin, J.; Nizkorodov, S. A. Chemistry of Atmospheric Brown Carbon. Chem. Rev.. 2015, 115, 4335–4382. [Google Scholar] [CrossRef] [PubMed]
- Ramachandran, S.; Rupakheti, M. Year-round aerosol characteristics and radiative effects in the South Asian pollution outflow over a background site in the Maldives. Atmos. Environ. 2020, 240, 117813. [Google Scholar] [CrossRef]
- Islam, N.; Saikia, B.K. An overview on atmospheric carbonaceous particulate matter into carbon nanomaterials: A new approach for air pollution mitigation. Chemosphere 2022, 303, 135027. [Google Scholar] [CrossRef] [PubMed]
- Li, K.; Jacob, D.J.; Liao, H.; Zhu, J.; Shah, V.; Shen, L.; Bates, K.H.; Zhang, Q.; Zhai, S. A two-pollutant strategy for improving ozone and particulate air quality in China. Nat. Geosci. 2019, 12, 906–910. [Google Scholar] [CrossRef]
- Zhao, Q.; Jiang, K.; Talifu, D.; Gao, B.; Wang, X.; Abulizi, A.; Zhang, X.; Liu, B. Simulation of the Ozone Concentration in Three Regions of Xinjiang, China, Using a Genetic Algorithm-Optimized BP Neural Network Model. Atmosphere 2023, 14, 160. [Google Scholar] [CrossRef]
- Hailing, L.; Zhang, M.; Xiao, H.; Liu, H.; Han, X. A review of surface ozone source apportionment in China. Atmos. Ocean. Sci. Lett. 2020, 13, 470–484. [Google Scholar] [CrossRef]
- Kang, M.; Zhang, H.; Ying, Q. Enhanced summertime background ozone by anthropogenic emissions – Implications on ozone control policy and health risk assessment. Atmos. Environ. 2023, 314, 120116. [Google Scholar] [CrossRef]
- Chen, G.; Shi, Q.; Xu, L.; Yu, S.; Lin, Z.; Ji, X.; Fan, X.; Hong, Y.; Li, M.; Zhang, F.; Chen, J.; Chen, J. Photochemistry in the urban agglomeration along the coastline of southeastern China: Pollution mechanism and control implication. Sci. Total Environ. 2023, 901, 166318. [Google Scholar] [CrossRef] [PubMed]
- Lyu, X.; Guo, H.; Zou, Q.; Li, K.; Xiong, E.; Zhou, B.; Guo, P.; Jiang, F.; Tian, X. Evidence for Reducing Volatile Organic Compounds to Improve Air Quality from Concurrent Observations and In Situ Simulations at 10 Stations in Eastern China. Environ. Sci. Technol. 2022, 56, 15356–15364. [Google Scholar] [CrossRef] [PubMed]
- Xue, R.; Wang, S.; Zhang, S.; Zhan, J.; Zhu, J.; Gu, C.; Zhou, B. Ozone Pollution of Megacity Shanghai during City-Wide Lockdown Assessed Using TROPOMI Observations of NO2 and HCHO. Remote Sens. 2022, 14, 6344. [Google Scholar] [CrossRef]
- Zheng, H.; Kong, S.; Chen, N.; Niu, Z.; Zhang, Y.; Jiang, S.; Yan, Y.; Qi, S. Source apportionment of volatile organic compounds: Implications to reactivity, ozone formation, and secondary organic aerosol potential. Atmos. Res. 2020, 249, 105344. [Google Scholar] [CrossRef]
- Li, J.; Zhai, C.; Yu, J.; Liu, R.; Li, Y.; Zeng, L.; Xie, S. Spatiotemporal variations of ambient volatile organic compounds and their sources in Chongqing, a mountainous megacity in China. Sci. Total Environ. 2018, 627, 1442–1452. [Google Scholar] [CrossRef] [PubMed]
- Xie, S.; Gong, Y.; Chen, Y.; Li, K.; Liu, J. Characterization and Source Analysis of Pollution Caused by Atmospheric Volatile Organic Compounds in the Spring, Kunming, China. Atmosphere 2023, 14, 1767. [Google Scholar] [CrossRef]
- Wang, Y.; Jiang, S.; Huang, L.; Lu, G.; Kasemsan, M.; Yaluk, E.A.; Liu, H.; Liao, J.; Bian, J.; Zhang, K.; Chen, H.; Li, L. Differences between VOCs and NOx transport contributions, their impacts on O3, and implications for O3 pollution mitigation based on CMAQ simulation over the Yangtze River Delta, China. Sci. Total Environ. 2023, 872, 162118. [Google Scholar] [CrossRef] [PubMed]
- Wu, R.; Bo, Y.; Li, J.; Li, L.; Li, Y.; Xie, S. Method to establish the emission inventory of anthropogenic volatile organic compounds in China and its application in the period 2008–2012. Atmos. Environ. 2015, 127, 244–254. [Google Scholar] [CrossRef]
- Li, Y.; Wu, Z.; Ji, Y.; Chen, T.; Li, H.; Gao, R.; Xue, L.; Wang, Y.; Zhao, Y.; Yang, X. Comparison of the ozone formation mechanisms and VOCs apportionment in different ozone pollution episodes in urban Beijing in 2019 and 2020: Insights for ozone pollution control strategies. Sci. Total Environ. 2023, 908, 168332. [Google Scholar] [CrossRef] [PubMed]
- Li, Z.; Liu, T.; Zhang, H.; Wang, X.; Zhang, J.; Qin, Z.; Zhu, C. Sensitivity analysis of ozone formation and source apportionment of VOCs in a typical industrial city in the Yangtze River Delta region during summer. Atmos. Pollut. Res. 2025, 16, 102424. [Google Scholar] [CrossRef]
- Fuchs, H.; Holland, F.; Hofzumahaus, A. Measurement of tropospheric RO2 and HO2 radicals by a laser-induced fluorescence instrument. Rev. Sci. Instrum. 2008, 79, 084104. [Google Scholar] [CrossRef] [PubMed]
- Griffith, S.M.; Hansen, R.F.; Dusanter, S.; Michoud, V.; Gilman, J.B.; Kuster, W.C.; Veres, P.R.; Graus, M.; de Gouw, J.A.; Roberts, J.; Young, C.; Washenfelder, R.; Brown, S.S.; Thalman, R.; Waxman, E.; Volkamer, R.; Tsai, C.; Stutz, J.; Flynn, J.H.; Grossberg, N.; Lefer, B.; Alvarez, S.L.; Rappenglueck, B.; Mielke, L.H.; Osthoff, H.D.; Stevens, P.S. Measurements of hydroxyl and hydroperoxy radicals during CalNex-LA: Model comparisons and radical budgets. J. Geophys. Res. Atmos. 2016, 121, 4211–4232. [Google Scholar] [CrossRef]
- Li, W.; Chen, J.; Ji, Y.; Zheng, J.; An, T. Recent progress in chemical ionization mass spectrometry and its application in atmospheric environment. Atmos. Environ. 2024, 325, 120426. [Google Scholar] [CrossRef]
- Griffin, R.J. Modeling the Oxidative Capacity of the Atmosphere of the South Coast Air Basin of California. 2. HOx Radical Production. Environ. Sci. Technol. 2003, 38, 753–757. [Google Scholar] [CrossRef] [PubMed]
- Jung, D.; Soler, R.; de la Paz, D.; Notario, A.; Muñoz, A.; Ródenas, M.; Vera, T.; Borrás, E.; Borge, R. Oxidation capacity changes in the atmosphere of large urban areas in Europe: Modelling and experimental campaigns in atmospheric simulation chambers. Chemosphere 2023, 341, 139919. [Google Scholar] [CrossRef] [PubMed]
- Liu, Q.; Schauer, J.J. The oxidative potential of atmospheric particulate matter as an indicator of health risk of air pollution: a review. Environ. Chem. Lett. 2025, 24, 229–250. [Google Scholar] [CrossRef]
- Guascito, M.R.; Pietrogrande, M.C.; Decesari, S.; Contini, D. Oxidative Potential of Atmospheric Aerosols. Atmosphere 2021, 12, 531. [Google Scholar] [CrossRef]
- Campbell, S.J.; Utinger, B.; Barth, A.; Leni, Z.; Zhang, Z.-H.; Resch, J.; Li, K.; Steimer, S.S.; Banach, C.; Gfeller, B.; Wragg, F.P.H.; Westwood, J.; Wolfer, K.; Bukowiecki, N.; Ihalainen, M.; Yli-Pirilä, P.; Somero, M.; Kortelainen, M.; Louhisalmi, J.; Sklorz, M.; Czech, H.; di Bucchianico, S.; Streibel, T.; Delaval, M.N.; Ruger, C.; Baumlin, N.; Salathe, M.; Fang, Z.; Pardo, M.; D’Aronco, S.; Giorio, C.; Shi, Z.; Harrison, R.M.; Green, D.C.; Kelly, F.J.; Rudich, Y.; Paulson, S.E.; Sippula, O.; Zimmermann, R.; Geiser, M.; Kalberer, M. Short-lived reactive components substantially contribute to particulate matter oxidative potential. Sci. Adv. 2025, 11, eadp8100. [Google Scholar] [CrossRef] [PubMed]
- Secrest, M.H.; Schauer, J.J.; Carter, E.M.; Lai, A.M.; Wang, Y.; Shan, M.; Yang, X.; Zhang, Y.; Baumgartner, J. The oxidative potential of PM2.5 exposures from indoor and outdoor sources in rural China. Sci. Total Environ. 2016, 571, 1477–1489. [Google Scholar] [CrossRef] [PubMed]
- Khoshnamvand, N.; Azizi, N.; Naddafi, K.; Hassanvand, M.S. The effect of size distribution of ambient air particulate matter on oxidative potential by acellular method Dithiothreitol; a systematic review. J. Environ. Health Sci. Eng. 2022, 20, 579–588. [Google Scholar] [CrossRef] [PubMed]
- Patel, A.; Rastogi, N. Seasonal variability in chemical composition and oxidative potential of ambient aerosol over a high altitude site in western India. Sci. Total Environ. 2018, 644, 1268–1276. [Google Scholar] [CrossRef] [PubMed]
- Pietrogrande, M.C.; Demaria, G.; Colombi, C.; Cuccia, E.; Santo, U.D. Seasonal and Spatial Variations of PM10 and PM2.5 Oxidative Potential in Five Urban and Rural Sites across Lombardia Region, Italy. Int. J. Environ. Res. Public Health 2022, 19, 7778. [Google Scholar] [CrossRef] [PubMed]
- Luo, H.; Guan, Q.; Lin, J.; Wang, Q.; Yang, L.; Tan, Z.; Wang, N. Air pollution characteristics and human health risks in key cities of northwest China. J. Environ. Manag. 2020, 269, 110791. [Google Scholar] [CrossRef] [PubMed]
- Zhang, Y.; Yin, Z.; Li, S.; Zhang, J.; Sun, H.Z.; Liu, K.; Shirai, K.; Hu, K.; Qiu, C.; Liu, X.; Li, Y.; Zeng, Y.; Yao, Y. Ambient PM2.5, ozone and mortality in Chinese older adults: A nationwide cohort analysis (2005–2018). J. Hazard. Mater. 2023, 454, 131539. [Google Scholar] [CrossRef] [PubMed]
- Zhang, Y.; Tian, Q.; Feng, X.; Hu, W.; Ma, P.; Xin, J.; Wang, S.; Zheng, C. Modification effects of ambient temperature on ozone-mortality relationships in Chengdu, China. Environ. Sci. Pollut. Res. 2022, 29, 73011–73019. [Google Scholar] [CrossRef] [PubMed]
- Borsi, S.H.; Goudarzi, G.; Sarizadeh, G.; Dastoorpoor, M.; Geravandi, S.; Shahriyari, H.A.; Mohammadi, Z.A.; Mohammadi, M.J. Health Endpoint of Exposure to Criteria Air Pollutants in Ambient Air of on a Populated in Ahvaz City, Iran. Front. Public Health 2022, 10, 869656. [Google Scholar] [CrossRef] [PubMed]
- Zhu, C.; Zhu, C.; Qiu, M.; Gai, Y.; Li, R.; Li, L.; Wang, C.; Yang, N.; Wang, B.; Sun, L.; Yan, G.; Xu, C. Health Burden and Driving Force Changes Due to Exposure to PM2.5 and O3 from 2014 to 2060 in a Typical Industrial Province, China. Atmosphere 2023, 14, 1672. [Google Scholar] [CrossRef]
- Han, C.; Xu, R.; Ye, T.; Xie, Y.; Zhao, Y.; Liu, H.; Yu, W.; Zhang, Y.; Li, S.; Zhang, Z.; Ding, Y.; Han, K.; Fang, C.; Ji, B.; Zhai, W.; Guo, Y. Mortality burden due to long-term exposure to ambient PM2.5 above the new WHO air quality guideline based on 296 cities in China. Environ. Int. 2022, 166, 107331. [Google Scholar] [CrossRef] [PubMed]
- Fan, H.; Zhao, C.; Yang, Y.; Yang, X. Rapid reduction of air pollution and short-term exposure risks in China. J. Environ. Sci. 2023, 149, 126–138. [Google Scholar] [CrossRef] [PubMed]
- Wang, J.; Ju, T.; Lei, S.; Li, B.; Niu, X. Study on Characteristics, Influencing Factors and Health Benefits of Atmospheric Multi-Pollutants in Southern Xinjiang. Atmosphere 2023, 14, 1681. [Google Scholar] [CrossRef]
- Wang, J.; Gao, A.; Li, S.; Liu, Y.; Zhao, W.; Wang, P.; Zhang, H. Regional joint PM2.5-O3 control policy benefits further air quality improvement and human health protection in Beijing-Tianjin-Hebei and its surrounding areas. J. Environ. Sci. 2022, 130, 75–84. [Google Scholar] [CrossRef] [PubMed]
Figure 1.
Analytical framework of the NTUA atmospheric environment review.
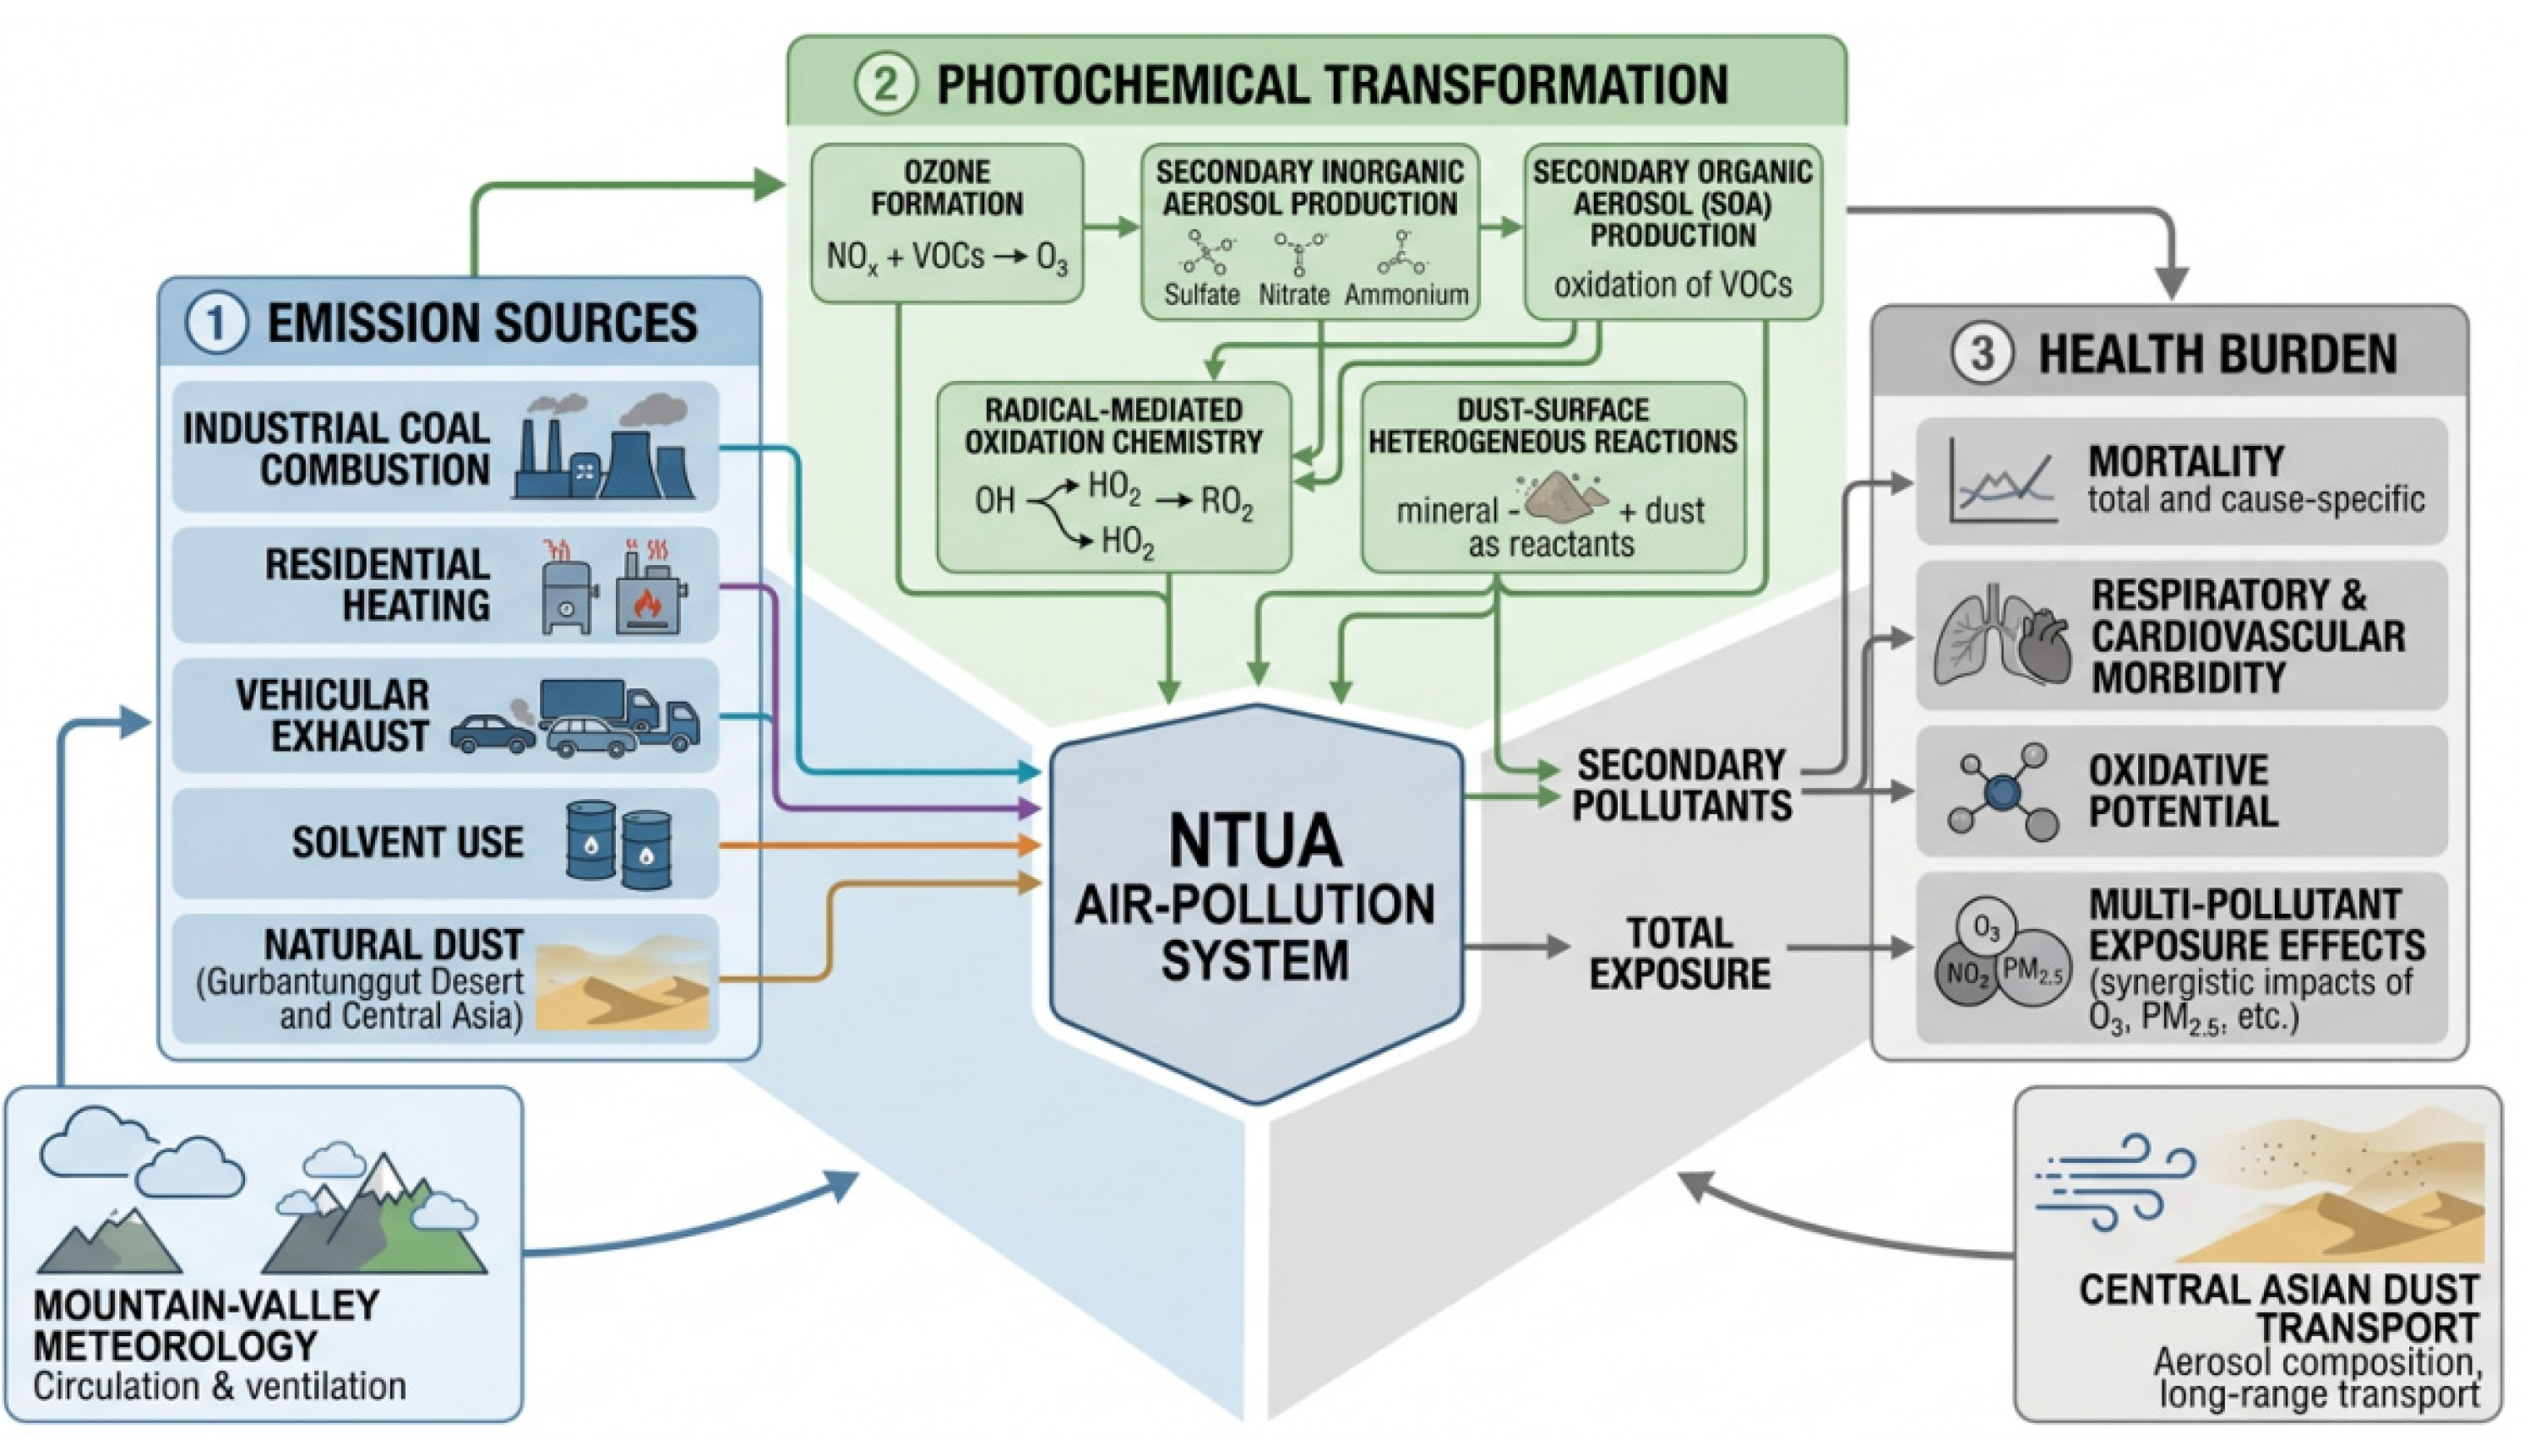
Figure 2.
Schematic comparison of black carbon and brown carbon sources, seasonal patterns, and optical properties in the NTUA.
Figure 2.
Schematic comparison of black carbon and brown carbon sources, seasonal patterns, and optical properties in the NTUA.
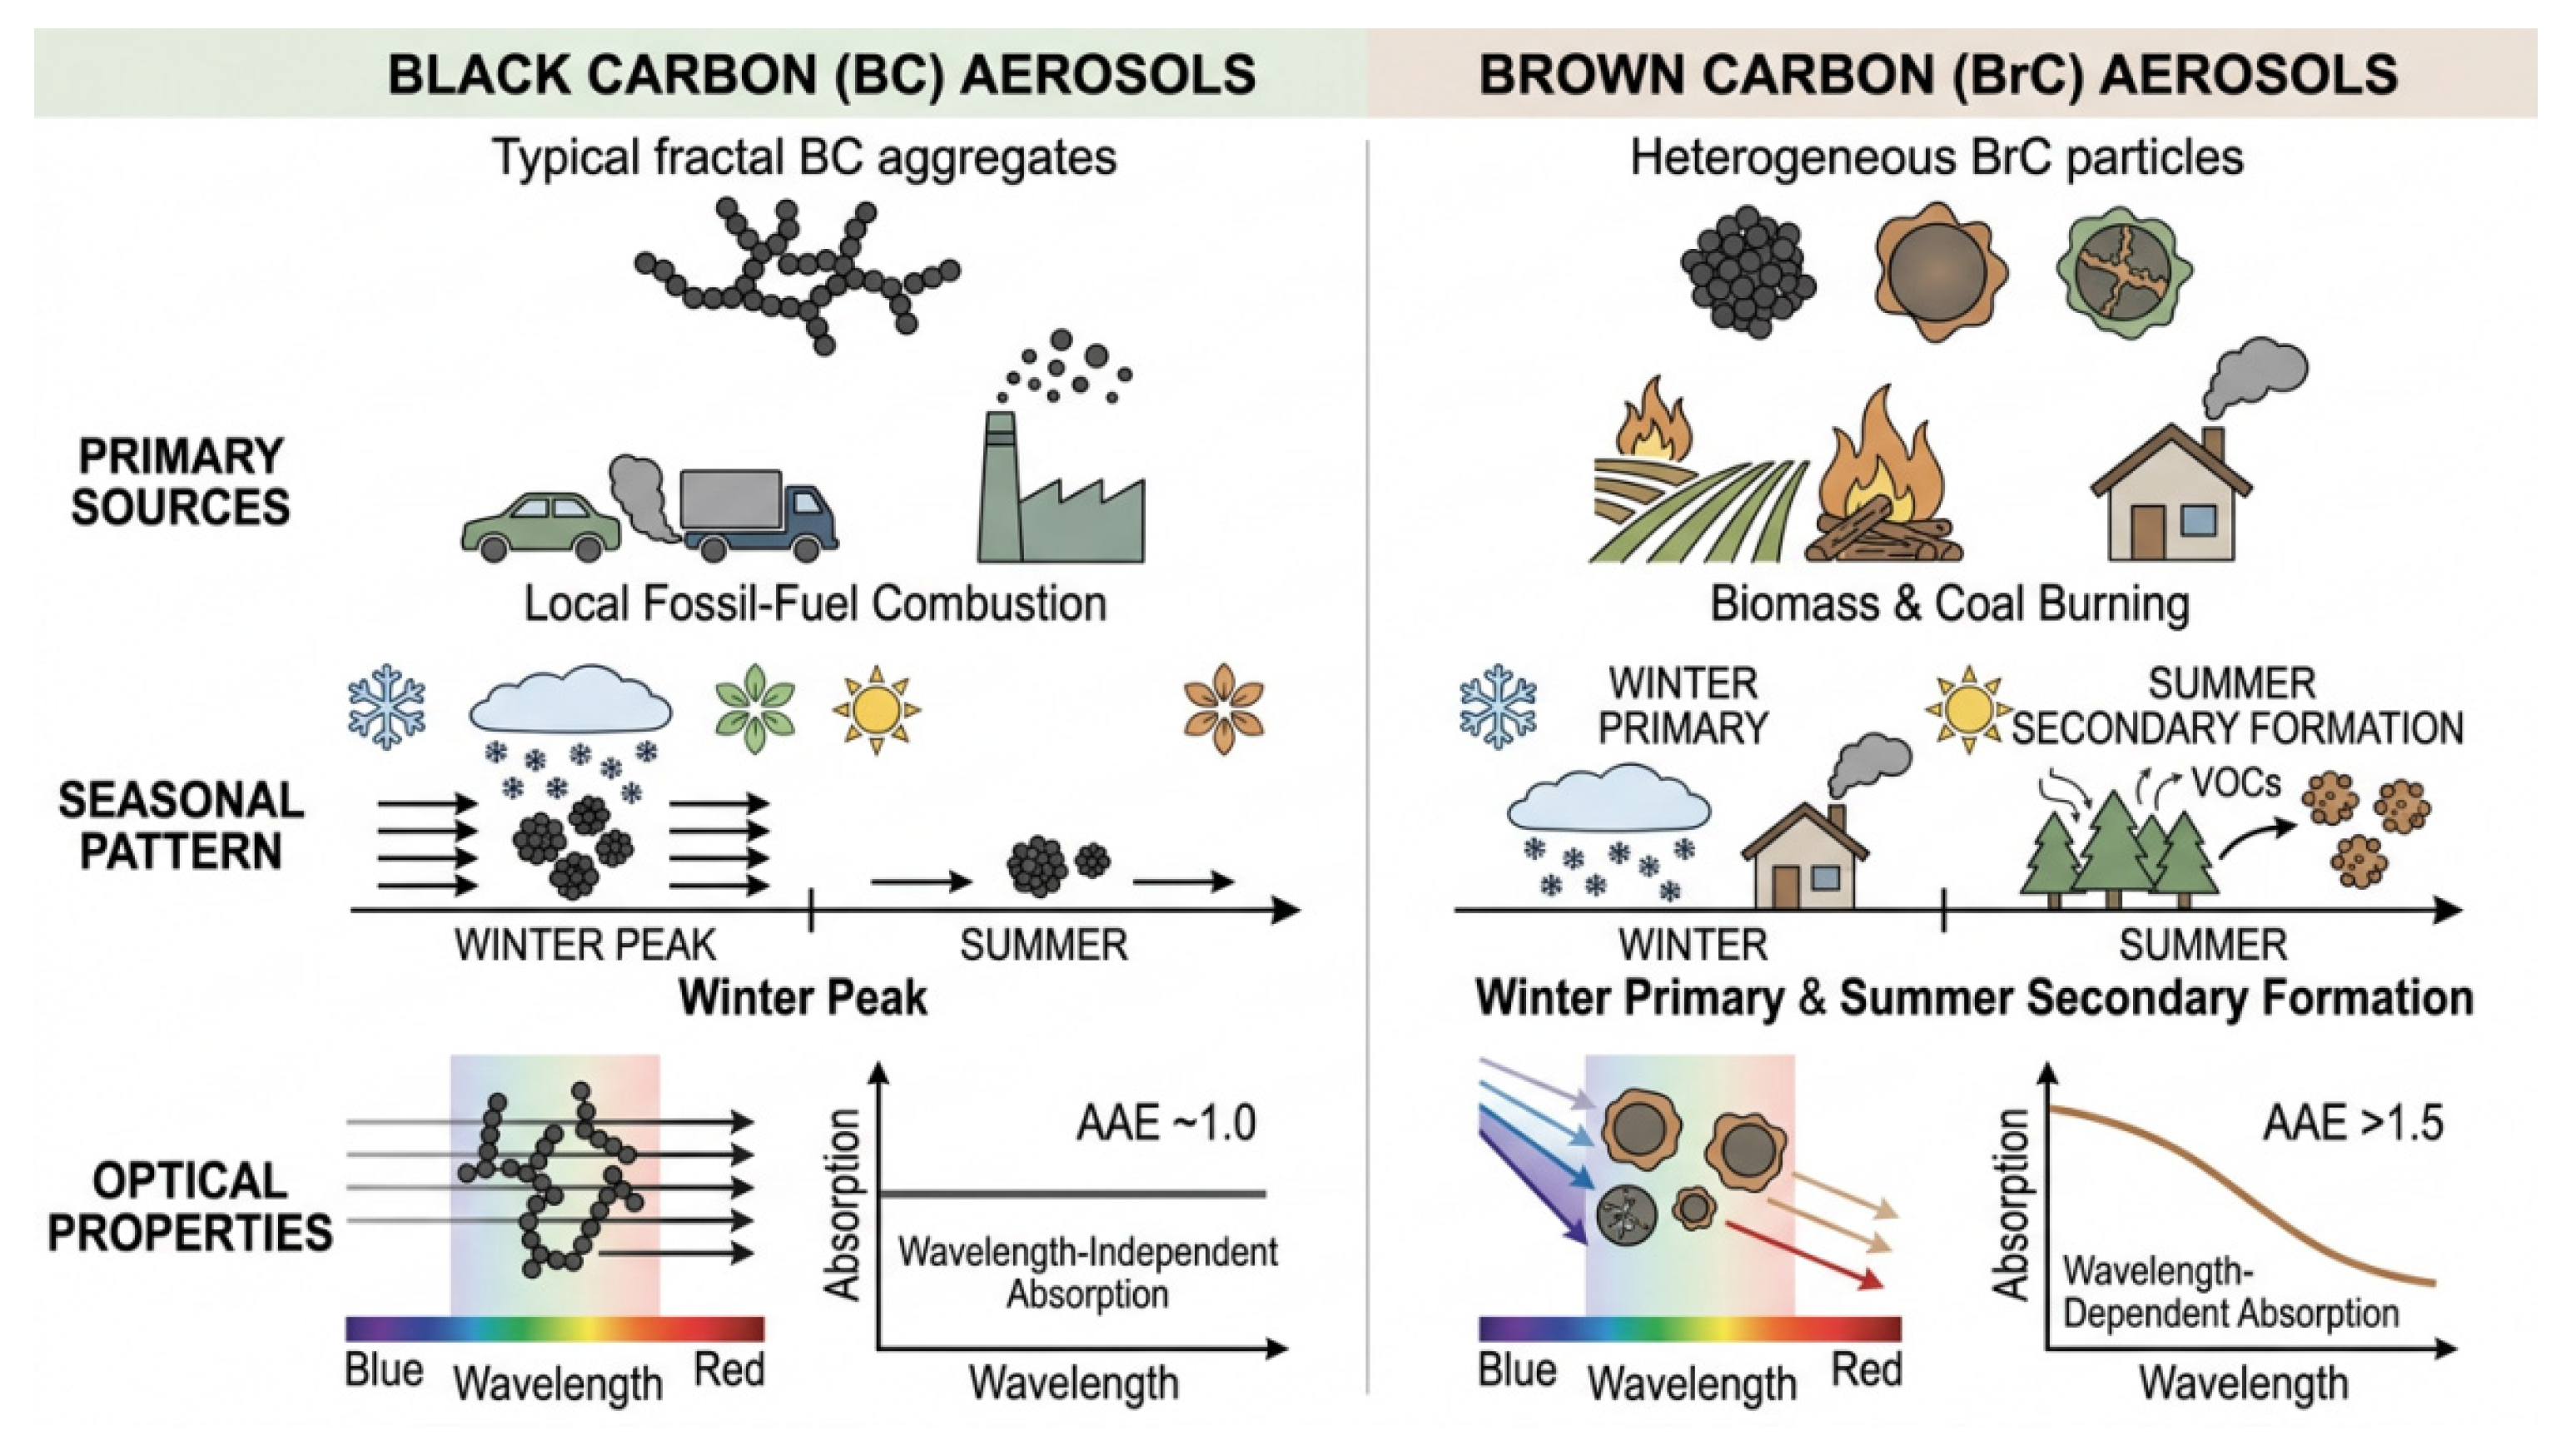
Figure 3.
Atmospheric radical chemistry and ROS generation pathways in the NTUA.
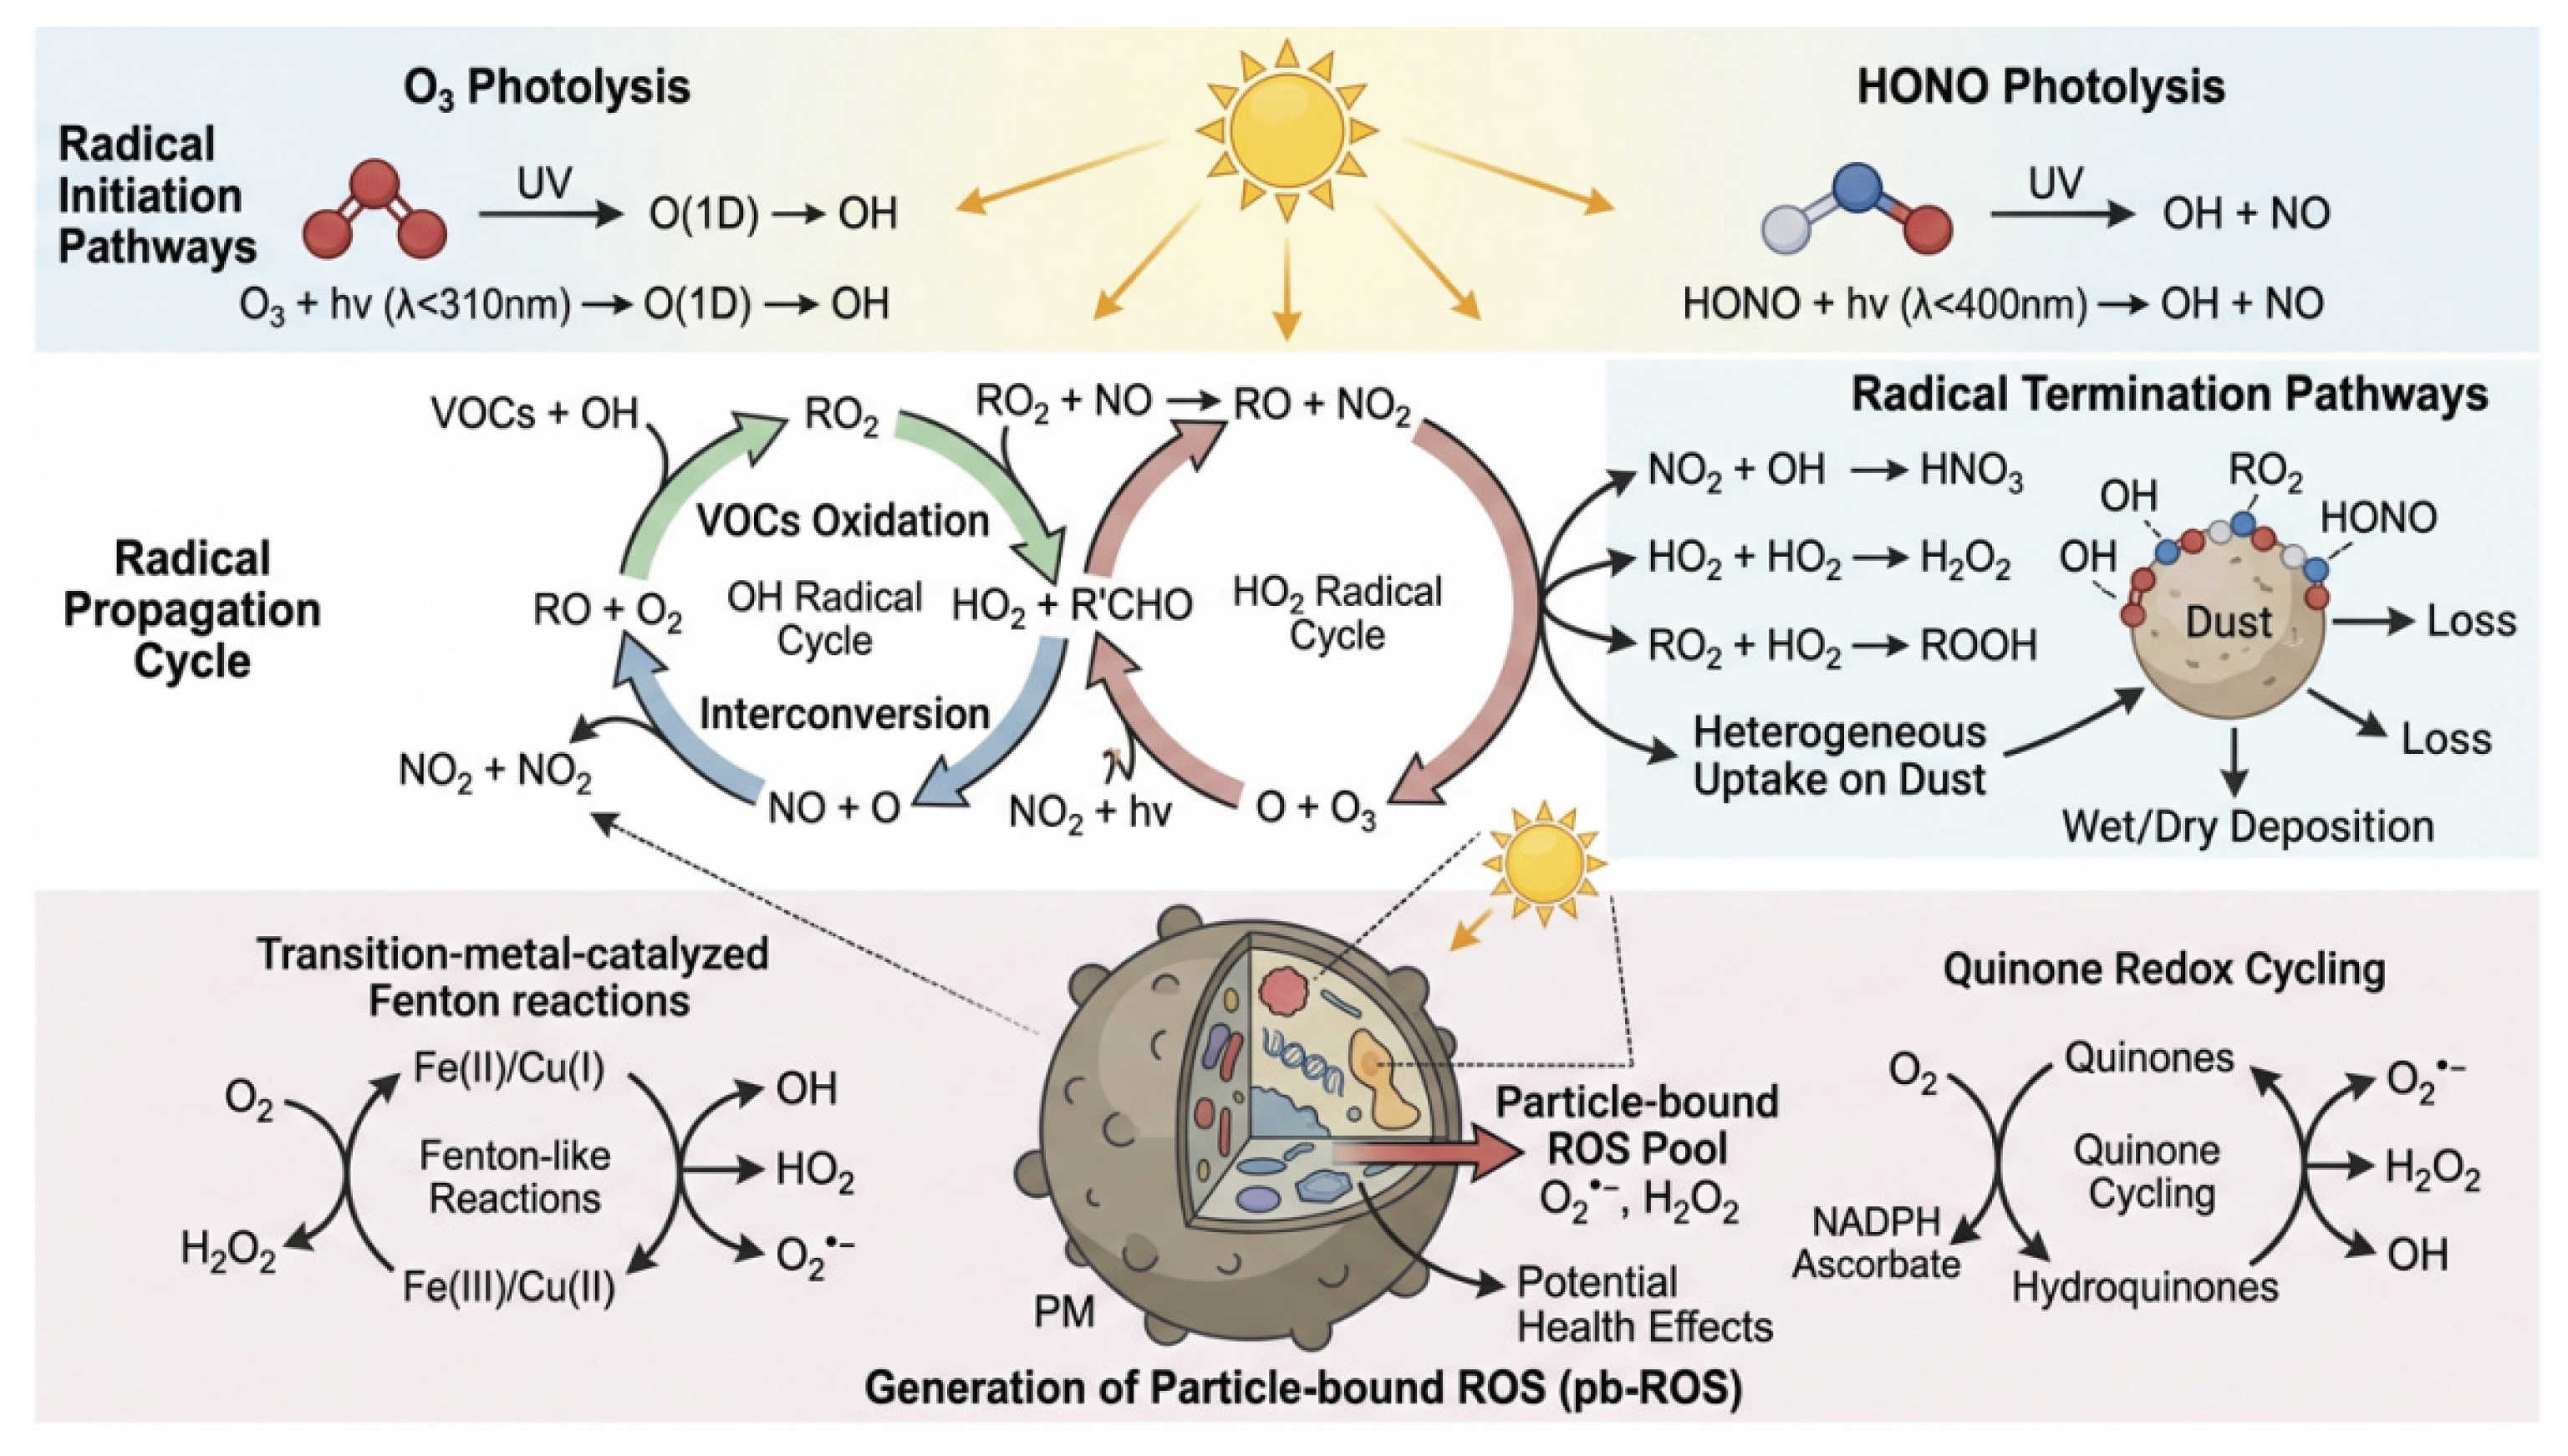

Table 1.
Summary of PM2.5 chemical composition and source contributions across NTUA cities.
| City | SO42- (%) | OC + EC (%) | Dust (%) | PM2.5/PM10 | Reference |
|---|---|---|---|---|---|
| Urumqi | 25–35 | 25–35 | 10–20 | 0.55–0.75 | [3] |
| Shihezi | 20–30 | 20–30 | 15–25 | 0.50–0.70 | [16] |
| Changji | 20–30 | 20–30 | 15–25 | 0.50–0.70 | [16] |
| Wujiaqu | 15–25 | 20–30 | 20–30 | 0.45–0.65 | [2] |
| Korla | 10–20 | 15–25 | 30–45 | 0.30–0.50 | [19] |
Table 2.
Ozone formation regime characteristics across seasons in the NTUA.
| Season | Regime | Dominant VOCs | NOx (ppb) | O3 sensitivity |
| Winter | VOC-limited | Alkanes from coal combustion | 30–80 | VOC reduction effective |
| Spring | Transitional | Mixed anthropogenic | 15–40 | Both reductions needed |
| Summer | NOx-limited | Alkenes, OVOCs, isoprene | 5–20 | NOx reduction effective |
| Autumn | Transitional | Mixed anthropogenic | 15–40 | Both reductions needed |
Table 3.
Key challenges and strategies for health risk assessment of air pollution in the NTUA.
| Challenge | Manifestation | Current strategies | Future directions |
| Sparse epidemiological data | Few local time-series studies; no cohort studies | Apply national ERFs [60] | Establish NTUA-specific cohort |
| Multi-pollutant interactions | PM2.5–O3–dust co-exposure | Single-pollutant models [64] | Multi-pollutant interaction models |
| Dust toxicity characterization | Unknown dust–pollutant synergism | Extrapolate from other arid regions | Toxicity assays on local samples |
| Exposure misclassification | Sparse monitoring network | Satellite-derived exposure [21] | Low-cost sensor networks + LUR |
| Aging population | Increasing susceptible fraction | Demographic adjustment [65] | Age-stratified risk communication |
Disclaimer/Publisher’s Note: The statements, opinions and data contained in all publications are solely those of the individual author(s) and contributor(s) and not of MDPI and/or the editor(s). MDPI and/or the editor(s) disclaim responsibility for any injury to people or property resulting from any ideas, methods, instructions or products referred to in the content. |
© 2026 by the authors. Licensee MDPI, Basel, Switzerland. This article is an open access article distributed under the terms and conditions of the Creative Commons Attribution (CC BY) license (http://creativecommons.org/licenses/by/4.0/).
Copyright: This open access article is published under a Creative Commons CC BY 4.0 license, which permit the free download, distribution, and reuse, provided that the author and preprint are cited in any reuse.