
Submitted:
21 August 2026
Posted:
25 August 2026
You are already at the latest version
Abstract
Background/Objectives: College students in the United States experience increased food insecurity burden compared to the general population. There is a consensus that students of Color, Pell grant recipients, first generation students, LGBTQ+ students, and students who identified as being food insecure during childhood have a higher risk for food in-security. The objectives of this study were (1) to determine the prevalence of food inse-curity among a sample of undergraduate students at a rural, regional university in Appalachia and (2) investigate the relationship between race, gender, Supplemental Nutrition Assistance Program use, and meal plan subscription status and food insecurity status. Methods: Researchers dispersed a survey with the United States Department of Agriculture (USDA) 6-item Food Security Survey Module and demographic character-istics to all undergraduate students at a mid-size, regional university in Appalachia. Results: Nearly 50% of this study sample (N = 1269) met criteria for food insecurity in which 17% of the sample was very food insecure. Students who identified as non-binary gender (p < 0.05), Black or two or more races (p < 0.001), or a previous user of Supplemental Nutrition Assistance Program (p < 0.01) had higher rates of food insecurity compared to their counterparts. There was not a significant difference in food security status between students on a meal plan and not on a meal plan. However, some groups demonstrated higher rates of food insecurity while on a meal plan subscription. Conclusions: This study highlights elevated rates of food insecurity at a university in which the primary service region is rural, Appalachian counties and can indicate need for resources and funding to address concerns of food insecurity.
Keywords:
food insecurity
; food security
; college students
; university students
; Appalachia
; race
; gender
; supplemental nutrition assistance program
; meal plans
1. Introduction
Food insecurity is a condition of limited or inconsistent access to adequate food for an active, healthy lifestyle (Core indicators of nutritional state, 1990). Approximately 10.5% of families in the United States meet criteria are food insecure (Colemen-Jensen et al., 2021). Most studies report that approximately 32% of college students experience food insecurity (Abbey et al., 2022). Students of Color, Pell grant recipients, first generation students, LGBTQ+ students, and students who identified as being food insecure during childhood tend to have a higher risk for food insecurity (U.S. Government Accountability Office, 2018).
The study university is located in a rural area in Appalachia. Historically, around 40% of this university’s student population received Pell Grants, were first-generation students, or both. Unpublished research at this institution suggested high rates of food insecurity and generational poverty. Researchers hypothesized there would be high levels of food insecurity among this student population. The objectives of this study were (1) to determine the prevalence of food insecurity among a sample of undergraduate students at a rural, regional university in Appalachia and (2) investigate the relationship between race, gender, SNAP use, and meal plan subscription status and food insecurity status.
2. Materials and Methods
2.1. Sample
This cross-sectional study included a convenience sample of undergraduate students at a mid-size, regional university in rural Appalachia. Students had to be currently enrolled at the institution and above age 18. Participants gave consent prior to the start of the online survey and were offered an incentive for completion. Data were collected online from March 1, 2024, to April 1, 2024. The study was approved by Eastern Kentucky University Institutional Review Board. Data analysis, interpretation, and manuscript preparation were completed in the fall of 2025 and spring of 2026.
2.2. Participants and Procedures
Students received an invitation to participate in an online survey to their university email account. The invitation was dispersed through a university-approved communication software, known as Slate (Slate, New Haven, CT, USA). A link to the survey was included in the invitation The survey was conducted using Qualtrics (Qualtrics, Provo, UT, USA). Once clicking the link, students were asked to review a consent letter. Students that did not agree or did not meet enrollment or age criteria were thanked for their time, and the survey was concluded. Students that agreed to participate continued to the main portion of the survey. At the conclusion of the survey, students were directed to another link in which they could elect to be entered into a raffle for a $25 gift card as an incentive for participation by providing their email for communication. The data provided in the survey and the raffle entry could not be connected. Students received a reminder two weeks after the initial invitation. The survey was closed after one month.
2.3. Survey Design
The survey included the USDA Six-item Food Security Survey Module (FSSM) and demographic questions. 6-item FSSM is standard for this population (Nikolaus et al., 2020). Questions were modified to inquire about characteristics of food security in the last month. Participants were asked to report their race, ethnicity, age, gender identity, primary campus location, and Supplemental Nutrition Assistance Program (SNAP) use. Participants reported if they had a meal plan subscription which provided more than 50% of their meals each week. This categorization was used as it is a common SNAP disqualifier for college students in the state where the study took place.
2.4. Data Analysis
Responses to FSSM were aggregated per the instructions from USDA (USDA FSSM, 2020). Aggregated scores determined food security status, including food secure (0-1) and low food insecurity (2-4), and very low food security (5-6). For analyses, students were grouped into two categories based on score: food secure (0-1) and food insecure (2-6).
Descriptive statistics were computed for demographic variables. Counts and percentages were found for food security aggregated scores. Pearson chi-square tests were performed to determine associations between food security status and race, age, gender identity, primary campus location, SNAP use, and meal plan status. Some variable categories were combined to meet expected cell count requirements for the analysis. A chi-square analysis on the relationship between food security status and meal plan status was also performed using data from Richmond campus students only. Stepwise binary logistic regression was used to predict food security status using race, ethnicity, age, gender identity, primary campus location, SNAP use, and meal plan status. Race and SNAP use were found to be the most useful predictors and were included in the final model. Results of the Hosmer-Lemeshow goodness-of-fit test (χ2(7) = 7.09, p = 0.419) suggest that the model is adequate.
Non-binary/third gender, prefer not to say, and write-in were combined for analysis of gender. Unknown and missing responses were removed for analysis of race. “I do not know” and missing responses were removed for analysis of past SNAP utilization. Reponses that listed “unsure” in response to the question regarding whether their meal plan provided more than half of their weekly meals were removed from the analysis comparing meal plan and food security status.
3. Results
The survey was completed by 1,437 undergraduate students. Of those responses, 168 were removed for incomplete responses or for not meeting inclusion criteria. 1,269 survey responses were included in the data analyses. Modal demographic categories were white (73.3%), female (58.7%), ages 18-24 (71.7%), and attended most classes on main campus (72.0%). 30.5% of participants were previous SNAP users. 40.6% of the sample indicated they subscribe to a meal plan that provides more than half of their meals each week. Table 1 lists sample characteristics and food security status frequencies.
630 students met criteria for food insecurity (49.7%). Table 2 lists numbers of students within each aggregated score category and percentages of students within that category. When these percentages were graphed by aggregate score as seen in Figure 1, a bimodal distribution was observed in which 0 (food secure) and 6 (very low food security) were the most common responses. 639 students were categorized as food secure (44.5%), 301 as low food security (20.9%), and 329 as very low food security (22.9%).
The majority of students identifying as Black (64.3%, N = 36), two or more races (73.0%, N = 46), female (50.6%, N = 447), third gender/non-binary (63.6% N = 42), ages 25-29 (54.9%, N = 34), ages 30-39 (53.3%), online students (51.4%, N = 107), and previous SNAP users (54.7%, N = 240) were food insecure. Third gender/non-binary students had significantly higher rates of food insecurity compared to other gender groups (p = 0.015). Students identifying as Black or Two or more races were significantly more likely to be food insecure compared to other race groups (p < 0.001). Previous users of SNAP had significantly higher rates of food insecurity compared to non-users (p = 0.002).
There was not a discernible difference in food security status among students with a meal plan and without a meal plan which covered more than 50% of their meals each week. See Table 3.
When online students and regional campus students were removed from the analysis, the percentages of students changed slightly in the “no meal plan” category, as anticipated. However, the difference in food security status among students with a meal plan subscription and without a meal plan subscription that covered more than 50% of meals each week remained small. See Table 4.
Moreover, the regression analyses revealed that there is not a significant difference in food security status among students with a meal plan subscription that covers more than 50% of meals each week and those without one. In fact, a higher percentage of Black, Other Race, and Two or More Races students with a meal plan subscription met criteria for food insecurity compared to their counterparts without a meal plan subscription. See Table 5.
4. Discussion
The findings for this study add further evidence to a growing body of literature in which students experience high levels of food insecurity. 49.7% of students met criteria for food insecurity. Students who identified as Black or two or more races, third gender/non-binary, and previous SNAP users were significantly more likely to meet criteria for food insecurity than their counterparts. Last, there was not a discernible difference in food security status among students with a meal plan and without a meal plan that covered more than 50% of their weekly meals. Students that identified as Black, Other Race, or Two or More Races were more likely to meet criteria for food insecurity if they had a meal plan that provided more than 50% of weekly meals than their counterparts without a meal plan.
It is well established in the literature that underserved and underrepresented students are at heightened risk for food insecurity, specifically students with any of the following characteristics: low socioeconomic status, first-generation students, disabled, parents, non-binary or transgender students, racial or ethnic minority students, and SNAP recipients (Baker-Smith et al., 2020). For example, specific studies have found that African American students had higher food insecurity than Caucasian students (Reeder et al. 2020); that Black, low-income, and low-income women students were more likely to experience food insecurity (Wilcox et al. 2022); that Black and Native American students experienced the highest rates of food insecurity and basic needs insecurity (Olaniyan et al. 2023); that racial and sexual minorities had higher prevalences of food insecurity (Willis 2019); and that African American, other race/ethnicity, and students experiencing housing insecurity or many forms of financial aid were more likely to be food insecure (Payne-Sturges, et al. 2018).
Moreover, federal data has also confirmed these findings. In 2020, a NCES report found that Black or African American students report the highest levels of food insecurity (34.6%) compared with white students (18%), that women (24.3%) and genderqueer, gender nonconforming, or another non-binary gender (35%) report higher levels of food insecurity than men (19.7%) amongst undergraduates, and that parents (28.7%), single parents (37.3%), Pell Grant recipients (31.1%), and students with disabilities (36%) experienced higher rates of food insecurity (McKibben, Wu, and Abelson, 2023; Cameron et al., 2023). In 2024, the U.S. Government Accountability Office also found that half of students reporting food insecurity were from low-income households, that approximately 31% of 2022 Pell Grant recipients reported being food insecure, and that 80% of food-insecure students are “nontraditional” meaning they are financially independent from their parents, care for a dependent, or did not go directly to college after high school (GAO, 2024). According to the report, 40% of these food insecure students may have been SNAP eligible, and roughly 59% of those who were eligible for SNAP benefits were not receiving them (GAO, 2024).
Universities across the country have made many broad efforts to address the food insecurity crisis in higher education. The next step is to “narrow the equity gap” (Porter, Grimm, and Budowle, 2023) by building interventions that target student groups who are low-income, first generation, nontraditional, gender, racial, and ethnic minorities (Savoie-Roskos et al. 2022). Most importantly, universities need to build awareness about SNAP eligibility and conduct outreach with those student groups who are most likely to be food insecure to discern if they are eligible and help them move through the application process.
However, the prevalence and severity of food insecurity among this population is an interesting finding. This study was conducted to provide data to administration on the pervasiveness of food insecurity; however, researchers were surprised at the severity of the problem as the data indicates there is an impact on the quality and quantity of diet. The service region is in Appalachia and includes 22 counties in southeastern Kentucky of which an average of 24.4% of families live in poverty, 28% of children live in poverty, and in general, the region experiences a higher food insecurity rate than the national average (USDA Economic Research Service 2025; Feeding America 2025). In addition, approximately 50% of students are first generation, 42% are Pell Grant recipients, and 45% are classified as low-income (internal website), all indicators of increased risk for food insecurity. Anecdotal data from students at this university suggested various mechanisms to combat hunger, including collecting water on campus to bring to family on the weekends, holding multiple jobs, combining financial resources to cook shared meals in the dorm kitchens, and rationing food to make it last longer. Therefore, this data confirmed that many students need more support. Previous research has found high rates of food insecurity over the past 12 months at another Appalachian university in North Carolina (21.9% low and 24.3% very low food insecurity), with 66% of food-insecure students being female and 75% not having purchased a meal plan (McArthur et al. 2018).
That there was no discernible difference in food insecurity status between students on a meal plan that covered >50% of meals each week and <50% of meals each week was interesting. Mei et al. (2021) found that 14% of students on a meal plan met criteria for food insecurity. This study also reported food insecure students consumed lower intake of fruits, vegetables, and fiber while consuming more dairy, calcium, sugar-sweetened beverages, and added sugar (Mei et al., 2021). Another study found that students on a limited meal plan were more likely to experience food insecurity compared to students on an unlimited plan (van Woerdon et al., 2019). However, 26% of students in the sample on the unlimited meal plan still experienced food insecurity. Winn et al. (2023) found meal plans to be a protective factor for food security status among a sample of 459 university students.
The findings from this study indicated that 49.8% of students on a meal plan that covered more than 50% of meals each week met criteria for food insecurity. These findings are in opposition to the expectation that meal plans are adequate in meeting student needs. However, there are various factors that impact how food can be accessed for meal plan users, such as dining hall hours and availability of meals during weekends and holidays. Meal plans may not meet food preferences needs, including religious, ethical, or medical requirements. More research is needed to understand this relationship (Gaiser et al., 2025).
4.1. Limitations
The student population at the institution is, in general, predominately white and female. As noted, the campus service area includes a region that is often deemed one of the poorest in the United States. Therefore, generalizability may be limited to campuses with differing populations. This is a non-probability sample and is based on a cross-sectional survey assessed at a single timepoint around the middle of the spring semester. Participants were asked to select the responses that were most true for the last 30 days. Last, the survey was sent electronically to student emails using a university communication system. There is the chance these emails were not delivered, received, or read to each recipient due to a variety of reasons, including financial limitations of access to technology.
5. Conclusions
Nearly 50% of students from a regional school in Appalachia met criteria for food insecurity. The findings of this study confirmed students of racial, or gender minorities and previous SNAP users were more likely to meet criteria. Last, this study added new information to the literature concerning meal plan subscriptions and food insecurity status. This relationship should be investigated further to better understand how to best serve students at risk of food insecurity.
Author Contributions
The authors contributed to the study process and manuscript in the following ways: conceptualization, A.P. and A.G.; methodology, AP; formal analysis, L.K.; investigation, A.P. and A.G.; resources, A.P..; data curation, L.K.; writing—original draft preparation, A.P. and A.G.; writing—review and editing, A.P. and A.G.; visualization, A.P. and L.K.; project administration, A.P.; funding acquisition, A.P. and A.G.
Funding
This research received no external funding. Internal funding from Eastern Kentucky University was utilized for participant incentives. Any publication fees will be paid for by University of Kentucky Department of Dietetics and Human Nutrition.
Institutional Review Board Statement
The study was conducted in accordance with the Declaration of Helsinki and approved by the Institutional Review Board of Eastern Kentucky University (protocol code 5676 and 12/15/2023).
Informed Consent Statement
Informed consent was obtained from all subjects involved in the study.
Conflicts of Interest
The authors declare no conflicts of interest.
Abbreviations
The following abbreviations are used in this manuscript:
| LGBTQ+ | Lesbian, Gay, Bisexual, Transgender, Queer+ |
| SNAP | Supplemental Nutrition Assistance Program |
| USDA | United States Department of Agriculture |
| FSSM | Food Security Survey Module |
References
- Baker-Smith, C., Coca, V., Goldrick-Rab, S., Looker, E., Richardson, B., & Williams, T (2020, February). #Realcollege 2020: Five years of evidence on campus basic needs insecurity. The Lumina Foundation. https://luminafoundation.org/wp-content/uploads/2020/03/4-years-of-evidence.pdf.
- Cameron, M., Johnson, R., Lacy, T.A., Wu, J., Siegel, P., Holley, J., and Wine, J. (2023, July 26). 2019–20 National Postsecondary Student Aid Study (NPSAS:20): First Look at Student Financial Aid Estimates for 2019–20 (NCES 2023466). U.S. Department of Education. Washington, DC: National Center for Education Statistics. https://nces.ed.gov/pubsearch/pubsinfo.asp?pubid=2023466.
- Map the Meal Gap. (2026, July). Food Insecurity among the Overall Population in Kentucky. Feeding America. https://map.feedingamerica.org/county/2023/overall/kentucky.
- Gaiser J, Barbosa A., Waring M., Egbert A, Nunes S., Hodges S., Duffy V. (2025). Addressing Food Insecurity in University Students: Barriers and Tailored Solutions for On- and Off-Campus Meal Access. Journal of Nutrition Education and Behavior, 57(8), S71. [CrossRef]
- Education, Workforce, and Income Security. (2024). Supplemental Nutrition Assistance Program: Estimated Eligibility and Receipt among Food Insecure College Students. (GAO-24-107074). Government Accountability Office. https://www.gao.gov/products/gao-24-107074.
- McArthur, L. H., Ball, L. Danek, A. C., Holbert, D. (2018). High Prevalence of Food Insecurity Among University Students in Appalachia Reflects a Need for Educational Interventions and Policy Advocacy. Journal of Nutrition Education and Behavior, 50(6), 564-572. [CrossRef]
- McCoy, M., Martinelli, S., Reddy, S., Don, R., Thompson, A., Speer, M., Bravo, R., Yudell, M., & Darira, S. (2022, January 22). Food insecurity on college campuses: The invisible epidemic. Health Affairs Forefront. [CrossRef]
- McKibben, B.,Wu, J., Abelson, S. (2023, August 3). New Federal Data Confirm that College Students Face Significant—and Unacceptable—Basic Needs Insecurity. The Hope Center for Student Basic Needs. https://hope.temple.edu/npsas.
- Mei, J., Fulay, A. P., Wolfson, J. A., & Leung, C. W. (2021). Food Insecurity and Dietary Intake among College Students with Unlimited Meal Plans at a Large, Midwestern University. Journal of the Academy of Nutrition and Dietetics, 121(11), 2267–2274. [CrossRef]
- Nikolaus, C. J., An, R., Ellison, B., & Nickols-Richardson, S. M. (2020). Food Insecurity among College Students in the United States: A Scoping Review. Advances in Nutrition, 11(2), 327–348. [CrossRef]
- Olaniyan, M., Magnelia, S., Coca, V., Abeyta, M., Vasquez, M., Harris III, F., & Gadwah-Meaden, C. (2023, October 3). Two pandemics: Racial disparities in basic needs insecurity among college students during the COVID-19 pandemic. The Hope Center for Student Basic Needs. https://hope.temple.edu/racial-disparities-basic-needs-insecurity-college-students-covid-19-pandemic.
- Payne-Sturges, D. C., Tjaden, A., Caldeira, K. M., Vincent, K. B., & Arria, A. M. (2018). Student Hunger on Campus: Food Insecurity Among College Students and Implications for Academic Institutions. American journal of health promotion: AJHP, 32(2), 349–354. [CrossRef]
- Porter, C. M., Grimm, K., & Budowle, R. (2023). Narrowing the equity gap in student food security: A student-led approach at the University of Wyoming. Journal of Agriculture, Food Systems, and Community Development, 12(2), 37–45. [CrossRef]
- Reeder, N., Tapanee, P., Persell, A., & Tolar-Peterson, T. (2020). Food Insecurity, Depression, and Race: Correlations Observed Among College Students at a University in the Southeastern United States. International journal of environmental research and public health, 17(21), 8268. [CrossRef]
- Savoie-Roskos, M. R., Hood, L. B., Hagedorn-Hatfield, R. L., Landry, M. J., Patton-López, M. M., Richards, R., Vogelzang, J. L., Qamar, Z., OoNorasak, K., & Mann, G. 2023. Creating a culture that supports food security and health equity at higher education institutions. Public Health Nutrition, 26(3), 503–509. [CrossRef]
- Economic Research Service. (2025, January 31). County-level Data Sets—Poverty. United States Department of Agriculture. https://data.ers.usda.gov/reports.aspx?ID=4040.
- van Woerden, I., Hruschka, D., Vega-Lόpez, S., Schaefer, D. R., Adams, M., & Bruening, M. (2019). Food Insecure College Students and Objective Measurements of Their Unused Meal Plans. Nutrients, 11(4), 904. [CrossRef]
- Wilcox, M., Baker, C., Burish, E., Arnold, R., Cherry, M., & Moss, T. (2022). Inequitable hunger: Scope, effects, and perceptions of college student food insecurity. Journal of Student Affairs Research and Practice, 59(4), 385–400. [CrossRef]
- Willis, D. E. (2019). Feeding the student body: Unequal food insecurity among college students. American Journal of Health Education, 50(3), 167–175. [CrossRef]
- Winn, C., Neptune, L., Parsons, K., Sullivan, A., Watras E., Barr, M., McNamara, J. (2023). University meal plans act as a protective factor for food security and mental health status in college students. Journal of the Academy of Nutrition and Dietetics, 123(9), A77. [CrossRef]
Figure 1.
Food Security Score Distribution.
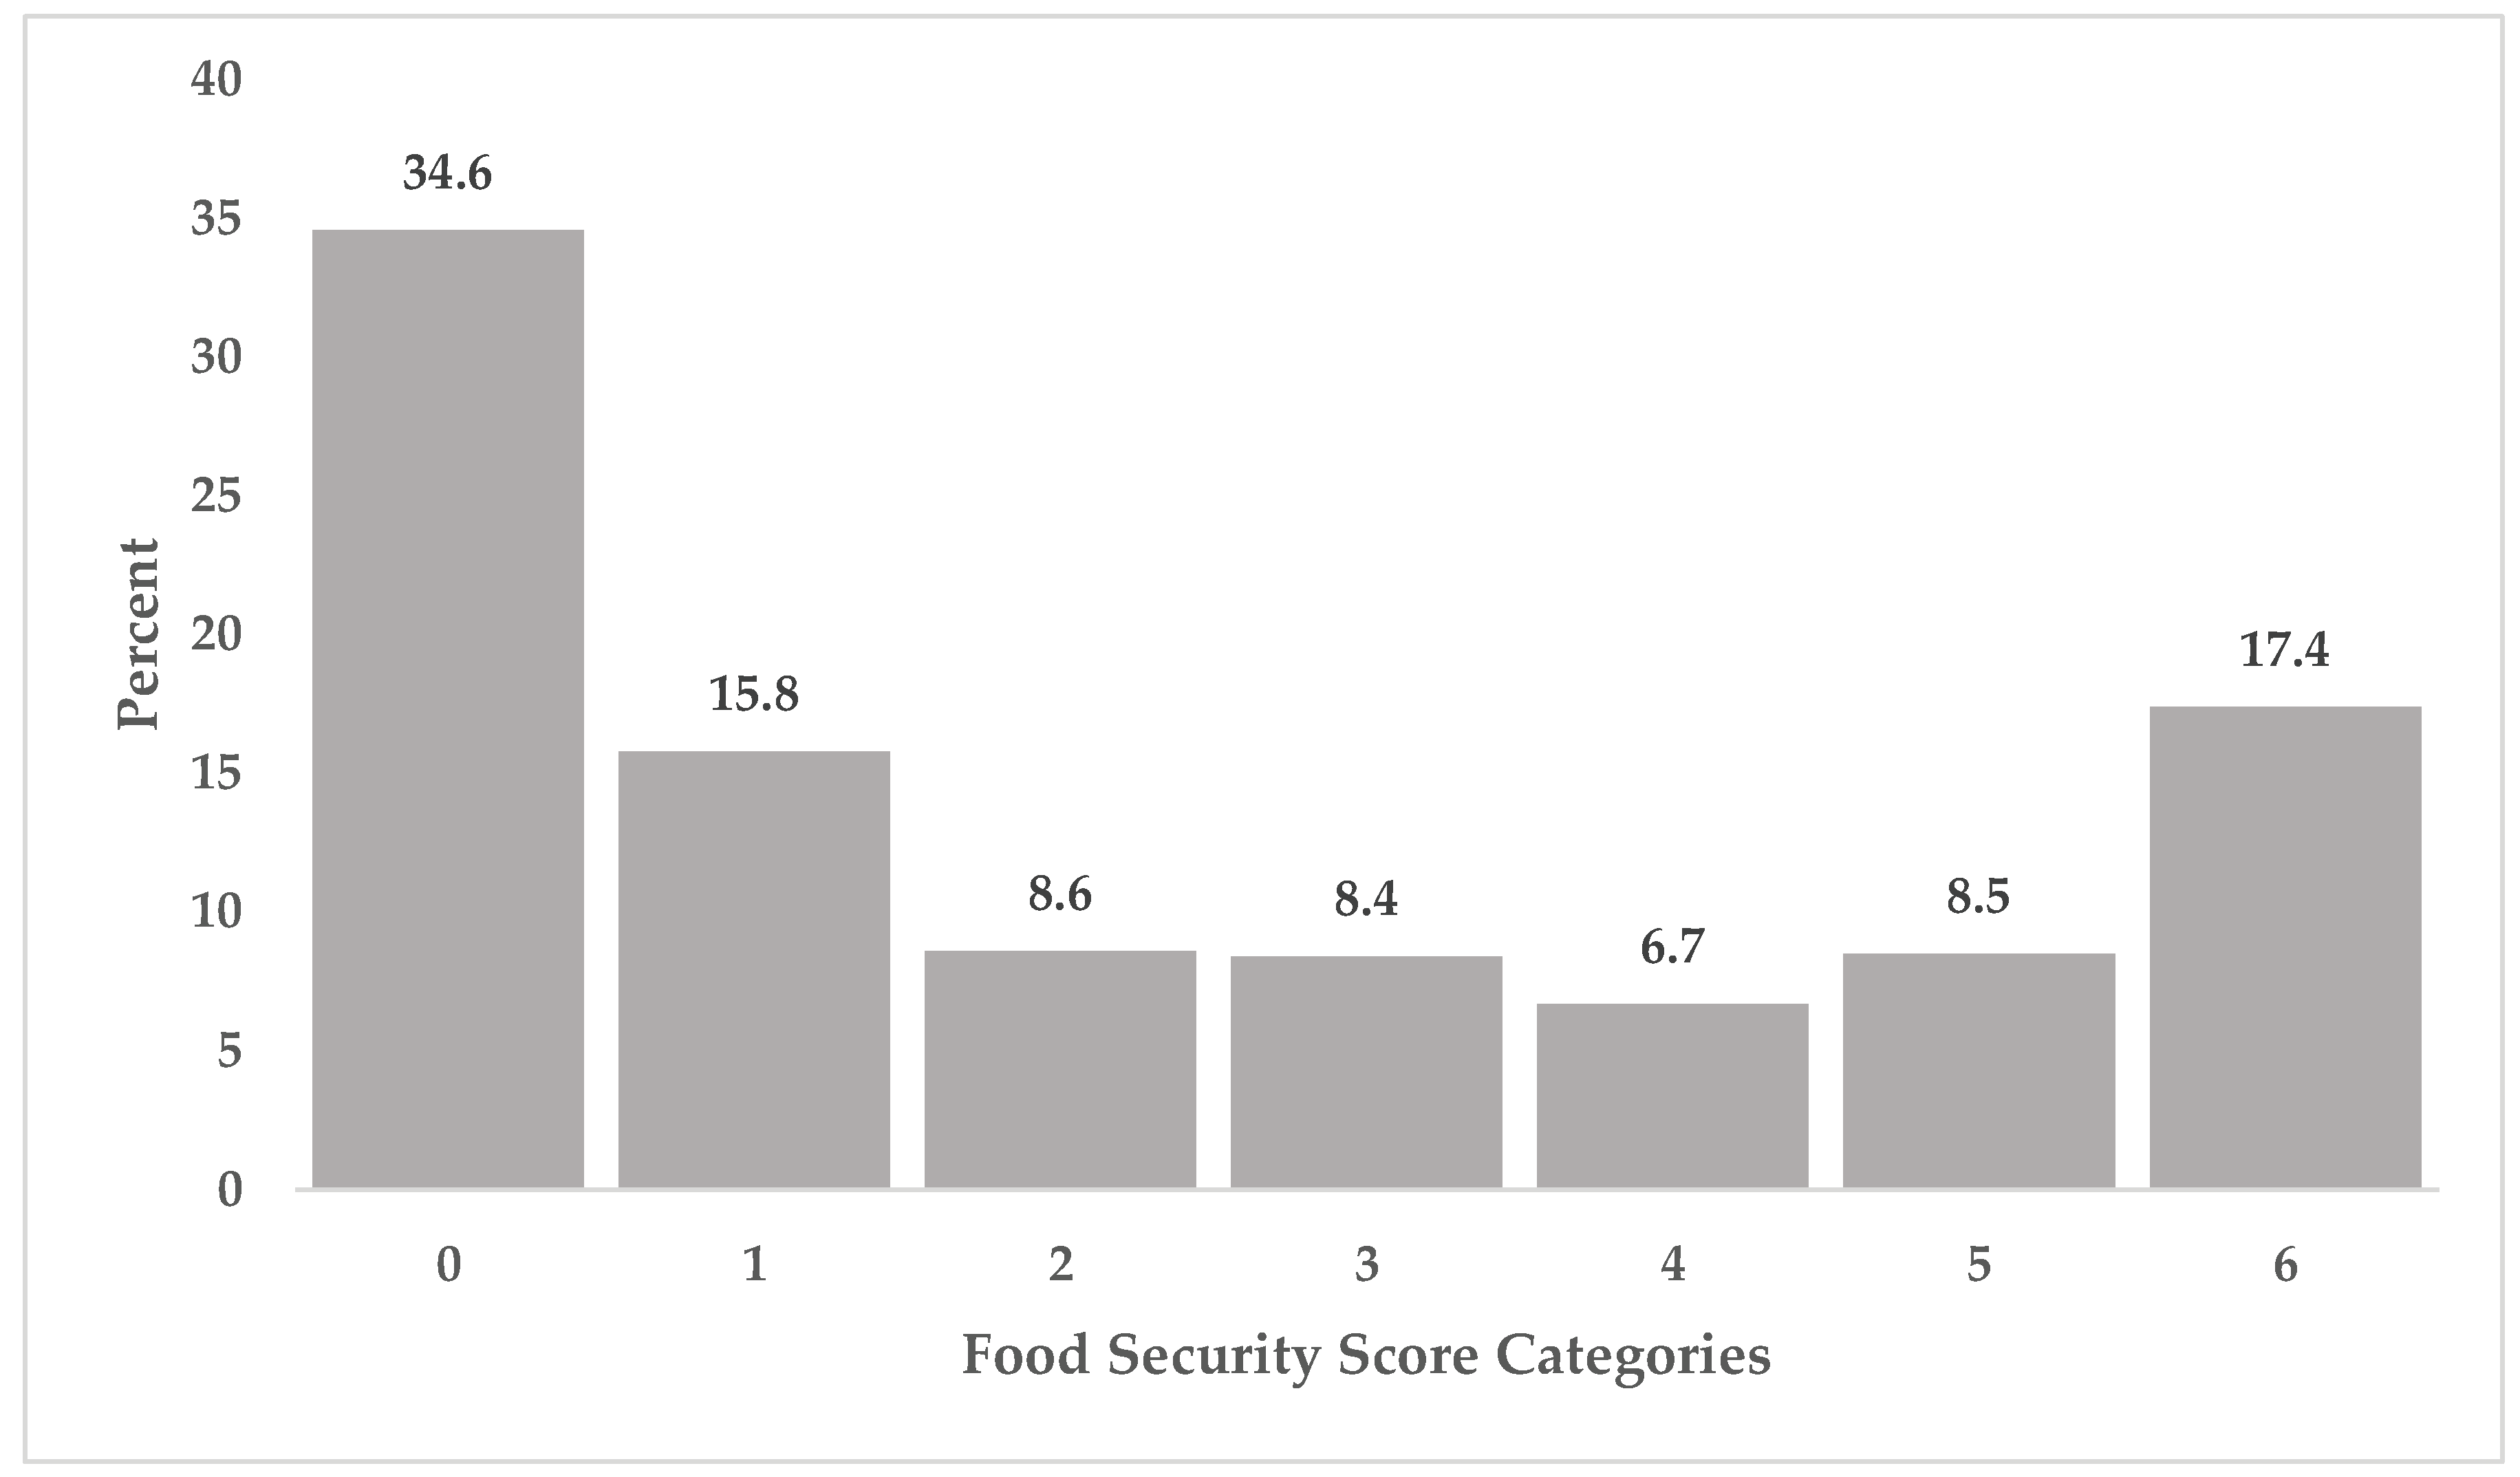

Table 1.
Sample Characteristics and Food Security Status.
| Demographic Category | Food Secure N (%) | Food Insecure N (%) | All N (%) | p-value |
| Gender | 0.015 | |||
| Female | 437 (49.4%) | 447 (50.6%) | 884 (100%) | |
| Male | 170 (55.2%) | 138 (44.8%) | 308 (100%) | |
| Non-binary/third gender | 24 (32.4%) | 42 (67.6%) | 66 (100%) | |
| Race | 0.000 | |||
| Black | 20 (35.7%) | 36 (64.3%) | 56 (100%) | |
| Hispanic or Latino | 21 (55.3%) | 17 (44.7%) | 38 (100%) | |
| Other | 17 (40.5%) | 25 (59.5%) | 42 (100%) | |
| Two or more races | 17 (27.0%) | 46 (73.0%) | 63 (100%) | |
| White | 553 (52.5%) | 500 (47.5%) | 1053 (100%) | |
| Age | 0.709 | |||
| 18-24 | 519 (50.4%) | 511 (49.6%) | 1030 (100%) | |
| 25-29 | 28 (45.2%) | 34 (54.8%) | 62 (100%) | |
| 30-39 | 42 (46.7%) | 48 (53.3%) | 90 (100%) | |
| 40-49 | 29 (50.9%) | 28 (49.1%) | 57 (100%) | |
| 50+ | 14 (66.7%) | 7 (33.3%) | 21 (100%) | |
| Primary campus | 0.879 | |||
| Main campus | 522 (50.5%) | 512 (49.5%) | 1034 (100%) | |
| Regional campuses | 9 (50.0%) | 9 (50.0%) | 18 (100%) | |
| Online | 101 (48.6%) | 107 (51.4%) | 208 (100%) | |
| Previous SNAP use | 0.002* | |||
| Yes | 199 (45.3%) | 240 (54.7%) | 439 (100%) | |
| No | 401 (54.8%) | 331 (45.2%) | 732 (110%) | |
| Meal Plan Subscription (>50% per week) | Food secure | Food insecure | All | 0.655 |
| No | 316 (51.5%) | 298 (48.5%) | 614 (100%) | |
| Yes | 292 (50.2%) | 290 (49.8%) | 582 (100%) |
Table 2.
Tally for Food Security Aggregated Scores.
| Aggregated Score1 |
N | Percent |
|---|---|---|
| 0 | 439 | 34.6 |
| 1 | 200 | 15.8 |
| 2 | 109 | 8.6 |
| 3 | 107 | 8.4 |
| 4 | 85 | 6.7 |
| 5 | 108 | 8.5 |
| 6 | 221 | 17.4 |
| Total | 1269 | |
| 1 key: food secure (0-1), low food insecurity (2-4), and very low food security (5-6) | ||
Table 3.
Meal Plan status categorized by food security status for entire sample.
| Meal plan that provided more than 50% of weekly meals | Food Secure | Food Insecure |
|---|---|---|
| No | 316 (51.5%) | 298 (48.5%) |
| Yes | 292 (50.2%) | 290 (49.8%) |
| Total | 608 (50.8%) | 588 (49.2%) |
Table 4.
Meal Plan Status Categorized by Food Security Status for Main Campus Students Only.
| Meal plan that provided more than 50% of weekly meals | Food Secure | Food Insecure |
| No | 211 (52.4%) | 192 (47.6%) |
| Yes | 290 (50.1%) | 289 (49.9%) |
| Total | 501 (51.0%) | 481(49.0%) |
Table 5.
Students categorized by race, meal plan subscription, and food security status.
| Meal Plan Subscription | Food Secure N (%) | Food Insecure N (%) | All | |
| White | No | 189 (53.85%) | 162 (46.15%) | 351 |
| Yes | 249 (52.75%) | 223 (47.25%) | 472 | |
| All | 438 (53.2%) | 385 (46.8%) | 823 | |
| Black | No | 5 (45.5%) | 6 (54.5%) | 11 |
| Yes | 9 (31%) | 20 (69%) | 29 | |
| All | 14 (35%) | 26 (65%) | 40 | |
| Hispanic or Latinx | No | 5 (41.7%) | 7 (58.3%) | 12 |
| Yes | 13 (68.4%) | 6 (31.6%) | 19 | |
| All | 18 (58.1%) | 13 (41.9%) | 31 | |
| Other Race | No | 5 (41.7%) | 7 (58.3%) | 12 |
| Yes | 8 (42.1%) | 11 (57.9%) | 19 | |
| All | 13 (41.9%) | 18 (58.1%) | 31 | |
| Two or More Races | No | 6 (37.5%) | 10 (62.5%) | 16 |
| Yes | 10 (27%) | 27 (73%) | 37 | |
| All | 16 (30.2%) | 37 (69.8%) | 53 |
Disclaimer/Publisher’s Note: The statements, opinions and data contained in all publications are solely those of the individual author(s) and contributor(s) and not of MDPI and/or the editor(s). MDPI and/or the editor(s) disclaim responsibility for any injury to people or property resulting from any ideas, methods, instructions or products referred to in the content. |
© 2026 by the authors. Licensee MDPI, Basel, Switzerland. This article is an open access article distributed under the terms and conditions of the Creative Commons Attribution (CC BY) license (http://creativecommons.org/licenses/by/4.0/).
Copyright: This open access article is published under a Creative Commons CC BY 4.0 license, which permit the free download, distribution, and reuse, provided that the author and preprint are cited in any reuse.