

Submitted:
21 August 2026
Posted:
25 August 2026
You are already at the latest version
Abstract
Afforestation is widely used to restore degraded Mediterranean landscapes, yet restoration success is often evaluated using vegetation establishment or soil carbon accumulation, with less attention to belowground ecosystem functioning. We assessed whether Cedrus libani afforestation promotes soil functional recovery in degraded Mediterranean karst and whether structural and microbial indicators provide robust measures of restoration progress under edaphic heterogeneity. Topsoil (0–10 cm) was sampled from degraded non-afforested reference land and 10-, 15-, and 25-year-old plantations in southern Türkiye. Soil organic carbon (SOC), total nitrogen (TN), aggregate stability, microbial biomass carbon (MBC), basal respiration, microbial quotient (qMic), and metabolic quotient (qCO₂) were determined. Afforested soils had higher SOC (1.55% vs. 2.37–3.35%), TN (0.053% vs. 0.087–0.190%), aggregate stability (61.3% vs. 77.8–84.9%), and MBC (180 vs. 288–536 µg g⁻¹), whereas basal respiration declined from 0.96 to 0.30–0.36 µg CO₂–C g⁻¹ h⁻¹ and qCO₂ from 5.41 to 0.54–1.39. qMic did not differ significantly among chronosequence classes. MBC was strongly associated with SOC (ρ = 0.917, P < 0.001) but not with basal respiration (ρ = −0.075, P = 0.57). Sensitivity analyses accounting for carbonate content and pH showed that aggregate stability, basal respiration, and qCO₂ were comparatively robust, whereas SOC, TN, and MBC responses were partly substrate-dependent. Multivariate analyses revealed coordinated but non-monotonic shifts across the chronosequence. These findings indicate that restoration outcomes in Mediterranean karst cannot be assessed from carbon accumulation alone and that integrating microbial metabolic and structural indicators with edaphic information provides a more informative framework for monitoring afforestation success.
Keywords:
ecological restoration
; soil organic carbon
; microbial biomass carbon
; metabolic quotient
; soil health
; restoration monitoring
1. Introduction
Afforestation is increasingly used as a nature-based intervention to rehabilitate degraded landscapes, enhance soil carbon sequestration, reduce erosion, and improve ecosystem resilience. However, successful restoration cannot be inferred from tree establishment alone because recovery of belowground functions may lag behind vegetation development. Soil structure, nutrient cycling, carbon stabilization, and microbial functioning collectively determine whether restored vegetation translates into persistent improvements in ecosystem condition. Consequently, identifying indicators that reliably track belowground recovery is an important challenge for evaluating and managing afforestation programs. Restoring belowground ecosystem functioning is fundamental to the long-term success of ecological restoration because soil processes regulate carbon sequestration, nutrient cycling, structural stability, water retention, and ecosystem resilience. Yet land degradation, vegetation loss, soil erosion, and climate change can disrupt these interconnected functions, often leaving soils on a slower recovery trajectory than aboveground vegetation [1,2,3]. This mismatch is particularly important in environmentally constrained landscapes, where vegetation establishment alone may not indicate successful ecosystem recovery. Assessing restoration therefore requires determining whether physical, biogeochemical, and microbial soil processes recover together rather than relying on changes in individual soil properties.
Mediterranean karst landscapes represent an exceptionally complex setting for functional recovery. Karst terrain covers approximately 12% of the global land surface and is defined by thin, spatially discontinuous soils overlaying carbonate bedrock [4,5]. Soil primarily accumulates within dissolution pockets, bedrock fissures, and residual mantles; however, shallow profiles, high skeleton content, low organic matter, and limited water-holding capacity severely restrict soil development and vegetation establishment [6,7,8]. Given that carbonate weathering produces minimal insoluble residue, mineral soil formation progresses extremely slowly, thereby amplifying the critical role of organic matter in maintaining soil structure, nutrient retention, and water storage [9,10]. Consequently, vegetation removal and the subsequent loss of organic matter and aggregate stability can drive these fragile ecosystems into severe, irreversible degradation. These severe edaphic constraints underscore the imperative for site-specific indicators capable of decoupling true functional recovery from ambient soil variability during ecological restoration.
Afforestation is widely used to rehabilitate degraded Mediterranean uplands and can initiate belowground recovery through several interconnected pathways. Developing tree canopies modify soil temperature and moisture regimes, while litter inputs, root turnover, and rhizosphere activity increase organic matter inputs and nutrient cycling [11,12,13,14]. Increasing organic inputs can promote aggregate formation and stabilization, which in turn physically protect newly incorporated organic matter from rapid mineralization [15,16,17]. Improved soil structure may further enhance water retention and nutrient conservation, creating positive feedbacks between vegetation development, carbon accumulation, and soil biological activity. Consequently, afforestation-induced recovery should be viewed as a coordinated reorganization of soil structural, biogeochemical, and biological processes rather than simply an increase in soil organic carbon (SOC).
The microbial compartment provides a particularly sensitive link between organic matter inputs and their stabilization. Soil microorganisms simultaneously decompose plant-derived substrates, immobilize nutrients, and contribute microbial residues to persistent SOC [18,19,20]. Among potential monitoring indicators, MBC and basal respiration provide complementary measures of microbial pool size and carbon mineralization; whereas qCO2 expresses respiration relative to microbial biomass and can indicate changes in microbial maintenance demand [21,22,23,24]. Together with aggregate stability and SOC, these variables can therefore distinguish increases in carbon pools from changes in the functioning of the soil system [12,25].
This distinction is particularly relevant in degraded karst soils, where high surface temperatures, episodic moisture availability, and limited substrate supply may impose substantial metabolic costs on microbial communities. Following tree establishment, increased organic inputs and improved microclimatic conditions could increase microbial biomass while simultaneously reducing respiration per unit biomass. Under such a trajectory, restoration would not necessarily be reflected by a greater proportion of SOC held in microbial biomass, but rather by a decline in microbial respiratory carbon loss relative to the size of the microbial pool. Integrating SOC, nutrient status, soil structure, microbial biomass, basal respiration, qMic, and qCO2 can therefore provide a more process-oriented assessment of soil recovery than any of these indicators considered independently.
Chronosequence approaches offer a practical framework for examining such long-term trajectories where continuous monitoring is unavailable. By substituting space for time, stands of different ages can reveal decadal changes in soil carbon, nutrient cycling, structure, and microbial functioning following afforestation [14,26,27]. However, this approach is particularly challenging in karst landscapes because pronounced pedodiversity can occur over short distances. Soil pockets may differ in depth, residual mineral material, carbonate content, and pH even under similar climate and topography [9]. Consequently, apparent stand-age effects may partly reflect pre-existing edaphic differences rather than ecosystem development alone. Explicitly accounting for this heterogeneity is therefore necessary before temporal changes observed along a karst chronosequence can be attributed to afforestation.
Cedrus libani A. Rich. (Taurus cedar) is a native conifer of the eastern Mediterranean and one of the principal species used for afforestation of degraded high-elevation karst landscapes in southern Türkiye because of its drought tolerance, deep rooting system, and ability to establish on shallow, rocky, calcareous substrates [28,29]. Babur et al. [30] showed that cedar afforestation increased SOC, nitrogen, and microbial biomass in degraded soils and documented progressive carbon and nitrogen accumulation along the same chronosequence. However, carbon accumulation alone does not establish whether belowground ecosystem functioning is recovering. It remains unclear whether changes in soil carbon are accompanied by coordinated improvements in soil structure and microbial metabolism, whether microbial ecophysiological indicators respond differently from bulk soil properties, and to what extent these patterns can be distinguished from underlying variation in carbonate-rich parent material.
Despite widespread use of afforestation in degraded Mediterranean landscapes, restoration monitoring still relies heavily on vegetation establishment and changes in individual soil properties. Less is known about whether structural, biogeochemical, and microbial indicators provide consistent evidence of functional recovery when restoration sites differ in underlying edaphic conditions. This distinction is particularly important in karst terrain, where strong small-scale variation in carbonate content, soil depth, and parent material can obscure or amplify apparent restoration responses.
Accordingly, this study evaluated the effectiveness of C. libani afforestation in restoring surface-soil functioning across a 25-year chronosequence established on degraded Mediterranean karst in southern Türkiye. We integrated structural, biogeochemical, and microbial indicators and explicitly evaluated whether observed responses remained robust to variation in carbonate content and soil pH. We hypothesized that (i) afforestation would improve soil structural condition and increase carbon, nitrogen, and microbial biomass relative to degraded non-afforested land; (ii) microbial metabolic indicators would reveal declining respiratory carbon loss per unit microbial biomass during restoration; and (iii) structural and microbial functional responses would be less sensitive to edaphic heterogeneity than the magnitude of soil carbon accumulation. By testing these hypotheses, we aimed to identify soil indicators that can improve monitoring of afforestation success and inform site-specific restoration management in environmentally heterogeneous karst landscapes.
2. Materials and Methods
2.1. Study Area
The study was conducted in C. libani A. Rich. afforestation sites in the Sorgun–Toros highlands of Erdemli district, Mersin Province, southern Türkiye (36°50′–36°54′ N, 34°06′–34°08′ E; Figure 1). The sites are located on the southern flank of the Central Taurus Mountains at elevations of 1662–1679 m a.s.l. The chronosequence comprised 10-, 15-, and 25-year-old C. libani plantations established in 2015, 2010, and 2000, respectively, together with adjacent non-afforested degraded land used as the control. The 10-year, 15-year, and control sites occur within approximately 1.5 km of one another, whereas the 25-year plantation is located approximately 7 km farther south. Geographic coordinates and stand characteristics are presented in Table 1.
Because the nearest long-term meteorological station at Erdemli is located approximately 35 km south-southeast of the study area and about 1660 m lower in elevation, its records were considered unrepresentative of the high-elevation study sites. Climatic conditions were therefore characterized using WorldClim 2.1 climate surfaces at 30-arc-second spatial resolution, extracted for each site. Mean annual temperature ranges from 8.5 to 9.0 °C and annual precipitation from 556 to 574 mm across the study area. The sites experience pronounced Mediterranean seasonality, with cold winters and a marked summer drought from June to September; June–August precipitation totals only approximately 39–41 mm. Climatic variation among the four sites is minor relative to the strong seasonal water limitation characteristic of the upper Mediterranean karst landscape.
The soils are predominantly Terra rossa developed on limestone-derived karstic parent materials [31]. Geologically, the area lies within the Taurus orogenic belt, where Oligocene–Pliocene sedimentary formations unconformably overlie Palaeozoic–Mesozoic basement rocks [32]. Limestone outcrops, dissolution cavities, and shallow discontinuous soil pockets are widespread, producing pronounced small-scale edaphic heterogeneity typical of Mediterranean karst terrain [33]. These soils generally have limited effective depth and water-holding capacity, conditions that strongly constrain vegetation establishment and soil development.
C. libani is the dominant native conifer at these elevations and has been extensively used for restoration of degraded karst lands in the region. All plantations were established by the General Directorate of Forestry using comparable operational afforestation practices, including similar site preparation and planting procedures. No fertilization, grazing, or soil amendments were applied after plantation establishment. Although the oldest plantation is spatially separated from the younger stands, all sites occur within the same high-elevation Mediterranean karst landscape and experience closely comparable climatic conditions and broadly similar soil-forming environments. Residual differences in soil carbonate content and pH among sites were therefore treated explicitly in the statistical analyses rather than assuming complete edaphic equivalence across the chronosequence.
2.2. Experimental Design
A space-for-time (chronosequence) design was used to evaluate changes in soil properties and belowground functioning following C. libani afforestation. Three plantations established in 2015, 2010, and 2000 were selected to represent successive stages of stand development and are hereafter referred to as C10, C15, and C25, respectively. Adjacent non-afforested degraded land (C0) was used as a reference representing pre-afforestation conditions.
The sites were selected to be comparable in elevation, climatic setting, topography, broad soil-forming environment, and previous land-use history. All sites occur within the same high-elevation Mediterranean karst landscape and are associated with limestone-derived Terra rossa soils. Although the oldest plantation was located in a different forest enterprise, the sites were selected to minimize environmental variation unrelated to stand development. Nevertheless, complete site equivalence cannot be assumed in a space-for-time design, particularly in heterogeneous karst terrain. Residual edaphic variation was therefore explicitly considered in the statistical analyses, with soil CaCO3 content and pH evaluated as covariates.
The experimental design comprised four chronosequence classes (C0, C10, C15, and C25). Fifteen spatially distributed sampling locations were established within each class, yielding 60 sampling locations in total. Sampling locations were distributed to maximize spatial coverage within the available plantation and control areas and to reduce local spatial dependence. Stand age was therefore interpreted as a chronosequence factor rather than as a direct temporal treatment, and observed age-related patterns were evaluated together with potential site-related edaphic variation.
Forest structural characteristics were determined in three 10 × 10 m plots within each plantation. Diameter at breast height (DBH) and total tree height were measured for all stems within each plot, resulting in inventories of 60, 61, and 48 trees in C10, C15, and C25, respectively. Stand basal area was calculated from individual stem diameters, and stem density was estimated from tree counts within the measured plots.
2.3. Soil Sampling
Soil sampling was conducted in October 2024 at the 60 sampling locations distributed across the four chronosequence classes. Before sampling, the surface litter layer was carefully removed to expose the mineral soil. At each location, five soil cores were collected from the 0–10 cm mineral layer, one from the center and four from the cardinal directions, and combined to form a single composite sample. The 0–10 cm layer was selected because it represents the biologically active surface soil most responsive to changes in organic matter inputs, root activity, and microbial processes following afforestation.
Separate samples were collected for physicochemical and microbial analyses. In addition, an undisturbed soil core was obtained at each sampling location using a 100 cm3 steel cylinder for determination of bulk density. The geographic coordinates of all sampling locations were recorded. Soil sampling followed the International Co-operative Programme on Assessment and Monitoring of Air Pollution Effects on Forests (ICP Forests) guidelines for soil horizon and sampling depth, while the Area-Frame Randomised Soil Sampling approach was used to guide the spatial distribution of sampling locations [34,35,36].
Samples intended for physicochemical analyses were air-dried, visible roots and plant residues were removed, and the soil was passed through a 2-mm sieve before analysis. Results were expressed on an oven-dry, <2-mm fine-earth basis unless otherwise stated. Samples intended for microbial analyses were maintained at field moisture, placed in sealed polyethylene bags, transported to the laboratory under cooled conditions, stored at 4 °C immediately after collection, and analyzed within 48 h to minimize changes in microbial activity during storage.
2.4. Laboratory Analyses
All laboratory analyses were conducted at the Soil Science Laboratory of Kahramanmaraş Sütçü İmam University using internationally accepted standard methods. Soil physicochemical and microbial properties were determined according to the analytical procedures described below.
2.4.1. Physicochemical Analyses
Hygroscopic moisture content was determined gravimetrically by oven-drying field-moist soil samples at 105 °C until constant weight and soil particle-size distribution (sand, silt, and clay) by the hydrometer method [37]. Soil texture classes were assigned according to the USDA Soil Texture Classification System. Soil pH and electrical conductivity (EC) were measured potentiometrically in a 1:2.5 (w/v) soil-to-distilled water suspension with electrode and conductivity meter. EC was expressed as dS m−1 at 25 °C.
SOC was determined using the Walkley–Black wet oxidation method [38], whereas total nitrogen (TN) was measured using the Kjeldahl digestion method [39]. The carbon-to-nitrogen (C/N) ratio was calculated from measured SOC and TN concentrations. Total calcium carbonate (CaCO3) content was determined volumetrically using a Scheibler calcimeter [39].
Bulk density (BD) was determined following Blake and Hartge [40]: undisturbed cores taken with 100 cm3 steel cylinders were oven-dried at 105 °C for 24 h, weighed, and bulk density calculated as the oven-dry mass divided by the cylinder volume. Aggregate stability (AS) was determined using the wet-sieving method and expressed as the percentage of water-stable aggregates described by Kemper and Rosenau [41], with minor modifications as applied to eroded and restored soils of the region by Babur et al. [42]. For this, air-dried soil samples (1.0–2.0 mm size fraction, m soil = 4.0 g) were placed on a 0.25 mm sieve. Samples were pre-wetted by capillary action by placing the sieves on moist filter paper for 10–15 minutes to minimize slaking from sudden air entrapment. The wetted samples were then submerged in deionized water and stroke-oscillated (vertical stroke length of 1.3 cm at 30 cycles min−1) using a wet-sieving apparatus for 5 minutes. After oscillation, the soil remaining on the sieve was rinsed into an evaporating dish and dried at 105 °C for 24 h to determine the weight of water-stable aggregates (Mwsa). To correct for coarse sand grains (>0.25 mm), the retained aggregates were dispersed in a 0.5% sodium hexametaphosphate (NaPO3)6 solution, washed through the same 0.25-mm sieve, and the weight of the remaining sand fraction (Msand) was subtracted. Aggregate stability (AS, expressed as %) was calculated using the following formula:
Where: Mwsa = dry mass of soil retained on the 0.25-mm sieve after wet sieving g), Msand = dry mass of sand grains retained on the 0.25-mm sieve after dispersion (g), Msoil = initial dry mass of the soil sample (g)
2.4.2. Microbial Biomass Carbon, Basal Respiration, and Microbial Quotients
Microbial biomass carbon (MBC) was determined using the chloroform fumigation–extraction (CFE) method following the standardized protocol of Horwath and Paul [43], based on the original procedures of Brookes et al. [44] and Vance et al. [45]. For each sample, two fresh subsamples (30 g) were prepared. One subsample was fumigated with ethanol-free chloroform in a vacuum desiccator at 25 °C for 24 h, whereas the second subsample remained unfumigated as the control. Both fumigated and unfumigated soils were extracted with 0.5 M K2SO4 at a 1:4 (w/v) soil-to-extractant ratio by shaking at 200 rpm for 30 min. After filtration through Whatman No. 42 filter paper, extractable organic carbon was determined using the Walkley–Black procedure described above. MBC was expressed as mg C kg−1 oven-dry soil. MBC was calculated as Cmic = 2.64 × EC, where EC is the difference in extractable organic carbon between fumigated and unfumigated samples [45].
Basal respiration (BR) was determined using the alkali absorption method [46]. Moist soil equivalent to 50 g oven-dry soil was incubated in airtight 500 mL glass jars containing 10 mL of 0.1 M NaOH at 25 °C in the dark for seven days. Carbon dioxide released during incubation was quantified by back-titration of the residual NaOH with 0.05 M HCl, using blank jars without soil as controls. Basal respiration was expressed as µg CO2–C g−1 h−1.
The microbial quotient (qMic) was calculated as MBC/SOC × 100 and expressed as a percentage. The metabolic quotient (qCO2) was calculated as BR/MBC and expressed as mg CO2–C g−1 MBC day−1, providing an index of respiratory carbon loss per unit microbial biomass and microbial maintenance demand [47].
2.5. Statistical Analysis
The chronosequence comprised four stand-age classes (C0, C10, C15, and C25), with 15 spatially distributed sampling plots per class (n = 60). Each sampling plot was treated as the observational unit. Soil organic matter was excluded from inferential analyses because it was derived directly from SOC. Where TN was measured separately in the 0–5 and 5–10 cm layers, values were averaged to represent the 0–10 cm soil depth, and the C/N ratio was subsequently calculated.
Positively skewed concentration and ratio variables were log10-transformed when necessary. Soil pH, particle-size fractions, aggregate stability, and bulk density were analyzed on their original scales. Model residuals were assessed using the Shapiro–Wilk test, and variance homogeneity was evaluated using the Brown–Forsythe test. Variables satisfying parametric assumptions were analyzed using one-way ANOVA followed by Tukey’s HSD test. When variance homogeneity was violated, Welch’s ANOVA and Games–Howell comparisons were used. Variables that did not satisfy parametric assumptions were analyzed using the Kruskal–Wallis test followed by Dunn’s test with Holm adjustment. Effect sizes were reported as omega squared (ω2) for parametric analyses and epsilon squared (ε2) for non-parametric analyses. Benjamini–Hochberg false discovery rate correction was applied across omnibus tests and correlation analyses.
Multivariate differences among stand-age classes were evaluated using PERMANOVA with 9,999 permutations based on Euclidean distances. Before analysis, continuous variables were centered and scaled to unit variance. Homogeneity of multivariate dispersion was assessed using PERMDISP. Because sand, silt, and clay constitute compositional data, they were transformed into two isometric log-ratio coordinates before inclusion in multivariate analyses. Principal component analysis was then used to visualize changes in the integrated soil dataset across the chronosequence.
Associations among soil physicochemical and microbial properties were assessed using Spearman’s rank correlations, with P-values adjusted using the Benjamini–Hochberg procedure. Partial correlation analyses controlling for stand-age class were additionally used to distinguish within-class relationships from correlations primarily driven by chronosequence development. Tree diameter at breast height and total height were analyzed separately for the three afforested stands because these variables did not apply to the non-afforested control. Univariate analyses were performed in IBM SPSS Statistics 26.0. Multivariate and compositional analyses were conducted in R using the vegan and compositions packages. Statistical significance was accepted at P < 0.05.
3. Results
Afforestation along the C. libani chronosequence was associated with pronounced changes in soil physicochemical and microbial properties. Following Benjamini–Hochberg false discovery rate (FDR) correction, significant differences remained for nearly all measured variables, indicating that consistent differences were observed among chronosequence classes. Only the microbial quotient (qMic) did not retain statistical significance after FDR adjustment (FDR-adjusted P = 0.0801).
The magnitude of these responses varied among soil attributes, with effect sizes ranging from moderate to exceptionally large. The strongest responses were observed for the qCO2 (ω2 = 0.865), CaCO3 (ω2 = 0.640), soil pH (ε2 = 0.620), BR (ω2 = 0.487), TN (ε2 = 0.544), EC (ε2 = 0.532), and aggregate stability (ε2 = 0.510). Collectively, these findings demonstrate that afforestation substantially modified both soil physicochemical conditions and microbial functioning. Detailed responses of soil physicochemical properties, microbial indicators, multivariate patterns, and relationships among variables are presented in the following sections.
3.1. Recovery of Soil Physicochemical Properties
Afforestation induced substantial changes in the physicochemical properties of surface soils across the C. libani chronosequence (Table 2; Figure 2 and Figure 3). Following Benjamini–Hochberg false discovery rate (FDR) correction, all physicochemical variables remained significantly different among stand-age classes, demonstrating a consistent influence of stand development on soil properties. Effect sizes ranged from moderate to very large, with the strongest responses observed for calcium carbonate (ω2 = 0.640), soil pH (ε2 = 0.620), TN (ε2 = 0.544), EC (ε2 = 0.532), and AS (ε2 = 0.510).
Soil Physical Properties
Particle-size distribution differed significantly among chronosequence classes, primarily because the C25 site had a distinct texture (Figure 2). Sand content differed significantly among stand-age classes (ANOVA, P < 0.001, ω2 = 0.409), with the highest values observed in the 25-year-old plantations. Conversely, both silt (ANOVA, P < 0.001, ω2 = 0.243) and clay contents (ANOVA, P < 0.001, ε2 = 0.307) were significantly lower in the oldest stands. Pairwise comparisons indicated that the control, 10-year, and 15-year plantations did not differ significantly in any particle-size fraction, whereas the 25-year-old plantations formed a distinct group characterized by higher sand and lower silt and clay contents.
Afforestation also improved soil physical quality (Figure 2). Bulk density differed significantly among stand-age classes (ANOVA, P = 0.028, ω2 = 0.102), although the effect size was comparatively small. The non-afforested control exhibited significantly greater bulk density than all afforested stands, whereas no significant differences were detected among the 10-, 15-, and 25-year-old plantations. In contrast, aggregate stability showed one of the strongest responses among all measured physical properties (Kruskal–Wallis, P < 0.001, ε2 = 0.510). Aggregate stability increased markedly following afforestation, reaching its highest values in the 15-year-old plantations and remaining consistently high in the 25-year-old stands. Overall, these findings demonstrate that afforestation substantially improved soil physical quality, with aggregate stability exhibiting a considerably stronger response than bulk density.
Soil Chemical Properties
Afforestation significantly influenced the chemical properties of surface soils across the C. libani chronosequence (Figure 3). Soil pH differed significantly among stand-age classes (Kruskal–Wallis, P < 0.001, ε2 = 0.620), exhibiting one of the largest effect sizes among all measured variables. The 10-year-old plantations showed the highest pH values, whereas the 25-year-old plantations exhibited significantly lower pH than all other stand-age classes.
Electrical conductivity (EC) also differed significantly among stand-age classes (Kruskal–Wallis, P < 0.001, ε2 = 0.532). Mean EC decreased progressively from the control to the oldest plantations, with the lowest values recorded in the 25-year-old stands.
SOC increased significantly following afforestation (Kruskal–Wallis, P < 0.001, ε2 = 0.313), with the highest values observed in the 25-year-old plantations. Total nitrogen (TN) exhibited a similar pattern (Kruskal–Wallis, P < 0.001, ε2 = 0.544), increasing markedly during stand development and reaching maximum concentrations in the oldest plantations. The C/N ratio also differed significantly among stand-age classes (ANOVA, P < 0.001, ω2 = 0.391), with the highest values occurring in the 15-year-old plantations and the lowest values in the 10- and 25-year-old stands. Calcium carbonate (CaCO3) exhibited the greatest response among the measured chemical properties (ANOVA, P < 0.001, ω2 = 0.640). Although CaCO3 contents varied among the younger plantations, the 25-year-old stands contained substantially lower carbonate concentrations than all other stand-age classes.
Overall, the chemical properties demonstrated pronounced changes throughout the afforestation chronosequence, with particularly strong responses observed for soil pH, CaCO3, TN, and EC.
3.2. Recovery of Soil Microbial Functioning
Afforestation significantly affected soil microbial properties across the C. libani chronosequence (Table 3; Figure 4). After Benjamini–Hochberg false discovery rate (FDR) correction, three of the four microbial indicators remained significantly different among stand-age classes. Effect sizes ranged from negligible to exceptionally large, with the strongest response observed for the qCO2 (ω2 = 0.865), followed by BR (ω2 = 0.487) and MBC (ω2 = 0.470). In contrast, the qMic did not remain significant after FDR correction (P = 0.0801).
Microbial biomass carbon differed significantly among stand-age classes (ANOVA, P < 0.001, ω2 = 0.470), reaching its highest values in the 25-year-old plantations (Figure 4a). The 10-year-old plantations also exhibited significantly greater MBC than the control, whereas the 15-year-old plantations showed intermediate values and did not differ significantly from either the 10- or 25-year-old stands. Basal respiration also differed significantly among stand-age classes (ANOVA, P < 0.001, ω2 = 0.487). The non-afforested control exhibited substantially higher basal respiration rates than all afforested stands, while no significant differences were detected among the 10-, 15-, and 25-year-old plantations (Table 3; Figure 4b).
Microbial Efficiency Indicators
The metabolic quotient (qCO2) exhibited the strongest response among all measured soil variables (ANOVA, P < 0.001, ω2 = 0.865). Values declined markedly following afforestation, with the lowest qCO2 recorded in the 25-year-old plantations (Figure 4d). By contrast, the microbial quotient (qMic) showed comparatively little variation among stand-age classes and remained non-significant after FDR correction (raw P = 0.421), with all plantations sharing the same statistical group.
Overall, afforestation produced pronounced changes in microbial functioning, characterized by higher microbial biomass, lower basal respiration, and substantially lower qCO2, whereas the microbial quotient remained relatively unchanged throughout the chronosequence.
3.3. Integrated Multivariate Responses
Multivariate analyses demonstrated that afforestation induced a coordinated reorganization of soil physicochemical and microbial properties across the C. libani chronosequence (Table 4; Figure 5). Soil multivariate composition differed significantly among chronosequence classes (Pseudo-F = 17.38, R2 = 0.482, P = 0.0001), with chronosequence class accounting for 48.2% of the total multivariate variation in soil properties. PERMDISP detected no significant differences in multivariate dispersion among stand-age classes (F = 1.95, P = 0.2198), confirming that the observed separation reflected genuine differences in soil properties rather than unequal within-group variability. Pairwise PERMANOVA comparisons showed that all stand-age classes differed significantly after Holm correction. The greatest multivariate divergence occurred between the non-afforested control and the 25-year-old plantations (R2 = 0.519, adjusted P = 0.0012), whereas the smallest separation was observed between the 10- and 15-year-old plantations (R2 = 0.110, adjusted P = 0.0134). These results indicate an increasing multivariate differentiation across the chronosequence.
Principal component analysis (PCA) further supported the PERMANOVA results by revealing a clear directional trajectory of soil development along the afforestation chronosequence (Figure 6). The first principal component (PC1) explained 41.9% of the total variance, while the second principal component (PC2) explained an additional 19.4%, together accounting for 61.3% of the overall variation. Sampling plots were arranged sequentially along the chronosequence, with the non-afforested control and the 25-year-old plantations occupying opposite regions of the ordination space, whereas the 10- and 15-year-old plantations formed intermediate transitional groups. The centroid trajectory illustrated a directional chronosequence-associated shift in soil properties with increasing stand age, consistent with a directional, rather than discrete, reorganization of soil properties across the chronosequence. Variables associated with soil organic matter accumulation and structural development, including SOC, TN, AS, and MBC, were oriented toward the mature plantations, whereas soil pH, calcium carbonate, EC, and BR were more closely associated with the non-afforested control.
3.4. Relationships Among Soil Physicochemical and Microbial Properties
Correlation analyses revealed strong associations among soil physicochemical and microbial properties across the C. libani chronosequence (Figure 6). Pairwise Spearman correlations showed that SOC and TN were strongly and positively correlated with one another (ρ = 0.94, P < 0.001) and were also positively associated with MBC (SOC–MBC: ρ = 0.92; TN–MBC: ρ = 0.87; P < 0.001). Aggregate stability was positively correlated with SOC, TN, and MBC, whereas bulk density exhibited negative associations with these variables. Conversely, soil pH and CaCO3 were positively correlated (ρ = 0.68, P < 0.001) but negatively associated with SOC, TN, and MBC. The qCO2 showed strong negative correlations with SOC, TN, MBC, and aggregate stability, whereas positive associations were observed with pH, CaCO3, and basal respiration. To distinguish intrinsic relationships among soil properties from those primarily attributable to stand development, partial Spearman correlations were calculated with stand-age class included as a covariate (Figure 6b). Most of the strongest associations remained significant after adjustment.
In particular, the strong positive relationships among SOC, TN, and MBC persisted (partial ρ = 0.93, 0.88, and 0.80, respectively), as did the positive correlation between pH and CaCO3 (partial ρ = 0.54). Likewise, aggregate stability remained positively associated with SOC, TN, and MBC, whereas qCO2 retained negative relationships with SOC, TN, and microbial biomass after controlling for stand age.
Overall, the persistence of these major correlations after accounting for stand-age effects indicates that the observed relationships represent coordinated associations among soil physicochemical and microbial properties rather than simple temporal co-variation along the afforestation chronosequence.
3.5. Stand Age Versus Substrate
The 25-year site occupies a distinct region of carbonate–pH space (Figure 7a), and carbonate content predicts microbial biomass across the whole dataset (r = −0.494, P < 0.001; Figure 7b). Because sand and clay contents also differ between sites, and particle size cannot be altered by 25 years of afforestation, these contrasts are attributed to parent material rather than to stand development, and CaCO3 and pH were therefore treated as covariates rather than as mediators.
Analysis of covariance showed that stand age remained a significant predictor of all responses after adjustment (all P < 0.03), but the effect size varied across variables (Table 5, Figure 8). Effect sizes for basal respiration, metabolic quotient and aggregate stability were unchanged, and neither covariate contributed significantly to them. Effect sizes for microbial biomass carbon, carbon stock, nitrogen stock, total nitrogen and organic carbon fell by 12–30%, and carbonate was a significant covariate for microbial biomass (P = 0.010) and organic carbon (P = 0.043). Adjusted microbial biomass carbon at the 25-year site fell from 536 to 413 µg g−1, remaining the highest of the four stands.
Homogeneity of regression slopes was satisfied for organic carbon, total nitrogen, nitrogen stock and aggregate stability but not for microbial biomass carbon, respiration, metabolic quotient or carbon stock (P = 0.000–0.033), so the covariance analysis for those four variables is reported as a sensitivity test rather than as the primary model. Restricting the comparison to the three sites sharing a calcareous substrate (C0, C10, and C15) removed this major edaphic confounding. It confirmed the direction of every result without adjustment: metabolic quotient F = 141.8, respiration F = 43.8, aggregate stability F = 38.0, total nitrogen F = 13.0, nitrogen stock F = 9.7, organic carbon F = 7.3 and microbial biomass carbon F = 5.9 (all P < 0.01). Both plantations differed from the control on every variable; the 10- and 15-year stands differed only in total nitrogen, nitrogen stock, and aggregate stability.
3.6. Tree Growth
Trees in the 25-year stand averaged 16.94 cm in diameter and 7.00 m in height, roughly double the diameter of the two younger stands (Table 6). Growth was not monotonic with age: the 15-year stand had both the smallest diameters (8.48 cm) and the shortest trees (4.08 m), below those of the younger 10-year stand, consistent with the higher carbonate content and lower organic carbon at that site.
4. Discussion
4.1. Soil Structural Recovery Following Afforestation
The most obvious physical response to C. libani afforestation was the significant increase in aggregate stability, accompanied by a modest reduction in bulk density. Aggregate stability increased from 61.3% in the degraded control soils to 77.8–84.9% in the afforested soils, while bulk density declined from 1.35 g cm−3 to approximately 1.09–1.16 g cm−3. Notably, aggregate stability remained one of the most consistent responses even when accounting for variation in CaCO3 and pH. This suggests that the improvement in soil structure was strongly associated with afforestation and was not readily explained by variation in carbonate content or pH alone. This response is particularly relevant in Mediterranean karst landscapes, where shallow soils, discontinuous fine-earth cover and seasonal water limitation mean that resistance to slaking and erosion are critical components of ecosystem recovery.
The increase in aggregate stability is consistent with the development of biologically mediated soil structure following forest establishment. Increased litter inputs, root proliferation, rhizodeposition, fungal hyphae and microbial extracellular products can promote the formation and persistence of stable aggregates [42], and reduced surface disturbance under forest cover can further protect newly formed structures [48]. These stable aggregates can then improve pore continuity, infiltration and erosion resistance, while also providing physical protection for organic matter [49]. Evidence from forest development chronosequences also suggests that aggregate formation and stabilization increase during stand development, accompanied by greater aggregate-associated SOC and nitrogen. Both biological and mineral binding agents contribute to aggregate formation [50]. Recent restoration studies indicate that microbial accumulation and aggregate formation represent complementary pathways through which vegetation recovery promotes SOC stabilization [51,52]. From a restoration-management perspective, the comparatively consistent response of aggregate stability suggests that structural recovery may provide a useful complement to SOC measurements when evaluating afforestation outcomes in heterogeneous karst soils.
In contrast, differences in particle-size distribution should not be interpreted as an afforestation-induced change in soil texture. The C25 site contained substantially more sand and less silt and clay than the other sites, and these differences cannot plausibly be attributed to 25 years of forest development. They instead provide direct evidence of pre-existing edaphic heterogeneity within the karst landscape. This distinction is important because it separates a genuinely responsive physical property—aggregate stability—from relatively invariant soil-forming attributes such as particle-size composition. Thus, the structural signal of restoration is best represented by enhanced aggregate stability and reduced bulk density rather than by apparent changes in texture [53].
Overall, the results suggest that soil structural recovery starts relatively soon after C. libani is established and continues throughout the chronosequence. In Mediterranean karst environments, where erosion and limited water storage pose significant challenges, the enhancement of structural stability through afforestation emerges as a highly significant ecological benefit.
4.2. Carbon and Nitrogen Accumulation Under Edaphic Heterogeneity
Afforestation was associated with a significant increase in the surface soil’s carbon and nitrogen content. SOC increased from 1.55% in the degraded control area to between 2.37% and 3.35% in the plantations, while TN increased from 0.053% to between 0.087% and 0.190%. These results are consistent with the expected outcomes of tree establishment: increased litter fall, root turnover and rhizodeposition lead to greater organic input, while reduced disturbance and improved aggregation enhance the retention and physical protection of newly incorporated organic matter [54]. A recent global synthesis of over 7,000 observations from 210 afforestation studies reported an average positive response in SOC, showing that the magnitude of carbon accumulation strongly depends on initial soil conditions, stand age and aridity [55]. This context is particularly relevant for Mediterranean karst soils, where low initial organic matter content and climatic water limitation can simultaneously increase the potential benefits of afforestation while also constraining the rate of soil development.
However, the present results also demonstrate why carbon accumulation along a chronosequence should not be automatically interpreted as a stand-age effect. The oldest site was significantly less calcareous and sandier than the younger sites and the control site. When CaCO3 and pH were included as covariates, the apparent chronosequence effect on SOC, TN, carbon stocks, and MBC decreased, with reductions in effect size of approximately 12–30%. This suggests that vegetation development and the edaphic context together shaped the observed carbon trajectory. A sensitivity analysis restricted to C0, C10, and C15—sites that share a strongly calcareous substrate—nevertheless preserved the direction of the main SOC and TN responses. This supports an afforestation signal but also demonstrates that the magnitude observed at C25 should be interpreted with caution.
The close relationship between SOC and TN indicates that the accumulation of organic matter and nitrogen is coordinated rather than occurring independently in the two pools. This coupling is to be expected, given that much of the nitrogen (N) in developing forest soils is incorporated into organic matter and microbial biomass. At the same time, however, the non-monotonic performance of the C15 stand illustrates the importance of local edaphic controls. Despite being older than the C10 stand, the C15 stand did not consistently exhibit higher carbon or microbial values, and it occurred on the most carbonate-rich substrate. Therefore, soil recovery in karst terrain appears to be directional, but not strictly monotonic. Stand development creates the biological conditions for the accumulation of carbon and nitrogen, but the rate and extent of this accumulation are constrained by local soil-forming conditions.
These results caution against interpreting SOC accumulation as a direct proxy for restoration success. In heterogeneous karst terrain, the magnitude of SOC recovery reflects both vegetation development and the underlying edaphic template.
4.3. Microbial Biomass and Biomass-Specific Respiration
The microbial response is one of the strongest pieces of evidence for belowground recovery [56]. Following afforestation, MBC increased markedly, reaching its highest mean value in C25, whereas basal respiration declined substantially relative to the degraded control. Most notably, qCO2 exhibited the greatest effect size of all the measured soil variables, decreasing from 5.41 in the control to 0.54–1.39 in the afforested soils. In contrast, qMic remained statistically unchanged. Together, these results are ecologically informative because they indicate that the microbial biomass expanded alongside the SOC pool, while respiratory carbon loss relative to microbial biomass declined.
The strong positive correlation between SOC and MBC is consistent with increased substrate availability under developing forest cover. Increased litter inputs, rhizodeposition, and root turnover can expand the microbial biomass pool, while improved aggregation and moisture conditions create more favorable habitats for microbes [57,58]. A 2024 meta-analysis of global afforestation similarly found that afforestation generally increases microbial biomass and SOC while reducing the metabolic quotient. This demonstrates that the observed direction is consistent with a broader cross-biome response [55].
Nevertheless, the decline in qCO2 should be interpreted carefully, as qCO2 does not directly measure microbial carbon-use efficiency. Rather, it expresses respiration relative to microbial biomass. Therefore, lower values indicate reduced biomass-specific respiratory carbon loss and potentially lower maintenance costs under improved soil conditions. In degraded controls, high qCO2 likely reflects greater microbial maintenance costs under limited substrate availability and environmental stress, particularly in the form of episodic soil moisture deficits [21,59]. Following afforestation, increased organic inputs and improved structural conditions may alleviate these constraints, enabling a larger microbial biomass to persist with lower respiration per unit of biomass.
The unchanged qMic provides an important complementary result. As MBC increased while MBC/SOC remained relatively constant, microbial biomass did not increase disproportionately to the expanding SOC pool. Instead, it appears that microbial C and total SOC have accumulated in parallel. This pattern suggests that restoration should not be interpreted simply as an increase in microbial abundance. A stronger shift occurred in microbial metabolic behavior: a similar proportion of soil C was represented by living microbial biomass, but considerably less CO2-C was lost per unit of microbial biomass.
This metabolic signal was also less sensitive to substrate variation than MBC or SOC themselves. Adjustment for CaCO3 and pH had little effect on the qCO2 and BR responses, and the same trend was observed when the analysis was restricted to the shared calcareous substrate. Therefore, biomass-specific respiration appears to be a particularly robust indicator of restoration in these karst soils and is potentially more informative than microbial biomass alone.
The key microbial response was therefore not simply an increase in microbial biomass but a marked reduction in respiratory carbon loss relative to the size of the microbial pool. For restoration monitoring, this distinction is important because microbial biomass alone cannot indicate whether additional carbon entering the microbial pool is accompanied by proportionally greater respiratory loss.
4.4. Integrated Soil Trajectories Across the Chronosequence
The combined results suggest that afforestation altered multiple components of belowground functioning simultaneously, rather than producing isolated changes in individual soil properties. PCA analysis revealed a distinct separation between the degraded control and the afforested sites. SOC, TN, aggregate stability, and MBC were associated with the forested end of the ordination, while CaCO3, pH, EC, and basal respiration were more closely linked to degraded or younger site conditions. This multivariate configuration is consistent with a transition from compact, carbon-poor, and metabolically stressed surface soils towards soils characterized by stronger aggregation, larger organic pools, greater microbial biomass, and lower biomass-specific respiration.
However, the trajectory should not be interpreted as a perfectly linear developmental sequence. C10 and C15 occupied intermediate and partially overlapping positions, and the values of several individual variables did not increase monotonically with nominal stand age. This is ecologically plausible in karst landscapes, where soil pockets can differ substantially in terms of their effective depth, carbonate content, texture and water availability over short distances. Therefore, the integrated pattern reflects the reorganization associated with chronosequences, which is superimposed on edaphic heterogeneity, rather than deterministic, age-driven succession.
The observed coupling among aggregate stability, SOC, TN, and microbial biomass also supports a process-based interpretation of restoration. Recent studies reinforce the idea that organic matter introduced following afforestation can stimulate microbial growth, contributing microbial residues and binding agents to aggregates. Improved aggregation can then enhance the physical protection of organic matter and carbon accumulation. Meanwhile, aggregate-scale microbial community complexity can contribute to multifunctional soil responses during forest development [60]. These interactions provide a plausible mechanism through which the establishment of vegetation gradually reorganizes the physical and biological environment of degraded karst soils.
Importantly, the results do not necessitate a parallel response from every indicator. In fact, the contrast between the relatively substrate-sensitive carbon pools and the more robust responses in aggregate stability and qCO2 indicates that the various components of soil recovery respond differently to site conditions. Bulk SOC reflects the cumulative balance of inputs, decomposition, mineral protection, and parent-material controls, whereas microbial respiration and aggregation can respond more rapidly to altered habitat and resource conditions. Therefore, a restoration assessment based solely on SOC could underestimate functional improvement at some sites or over attribute carbon differences to stand development at others.
Overall, the multivariate response therefore reinforces the value of integrated soil assessment: no single indicator fully captured restoration status, whereas the combined structural, biogeochemical, and microbial dataset clearly distinguished degraded from afforested soils.
4.5. Implications for Restoration Monitoring and Management
The study classes represent different sites rather than repeated measurements of the same stand over time, meaning that stand age is partly confounded with site identity. The distinctive particle-size distribution, CaCO3 content and pH of C25 demonstrate that complete edaphic equivalence was not achieved. Consequently, the present study cannot attribute all differences between C0, C10, C15 and C25 exclusively to stand age.
Nevertheless, several results increase confidence in the main ecological interpretation. Firstly, aggregate stability, basal respiration and qCO2 exhibited substantial responses even after accounting for CaCO3 and pH. Secondly, the analysis restricted to the three sites with the strongest calcareous content reproduced the direction of the main responses. Thirdly, the C15 site shows that soil recovery does not simply correspond to chronological age; despite being older, it had a higher carbonate content and weaker performance than C10 for several variables. Together, these observations suggest that the establishment of C. libani produces a robust signal of functional recovery, while the development of carbon pools is regulated by edaphic conditions.
This distinction has practical implications for the restoration of Mediterranean karst. Monitoring programs should not evaluate success based solely on tree survival or SOC concentration [61]. Aggregate stability and microbial metabolic indicators, particularly qCO2 and biomass-specific respiration, may provide sensitive measures of functional soil recovery. However, their responses can be modulated by local edaphic conditions [55,62]. At the same time, when comparing SOC stocks across restoration sites, it is important to explicitly consider carbonate status, texture, coarse fragments and soil depth before interpreting differences as age-dependent sequestration.
The results support the use of C. libani afforestation as a restoration tool for degraded, high-elevation karst landscapes. However, they do not suggest that all karst sites will follow the same trajectory. Site quality should therefore remain central to plantation planning. It may be as important to match restoration strategies to local soil depth, carbonate status, moisture availability and parent-material conditions as it is to consider stand age when determining the magnitude of soil carbon recovery [51,63].
Therefore, future work should move towards replicated chronosequences across contrasting karst landscapes and permanent-plot monitoring over time. Seasonal sampling, deeper soil horizons, corrections for coarse fragments, and measurements of root and litter inputs, extracellular enzyme activity and microbial community composition would allow the structural and metabolic mechanisms identified here to be tested more directly. These approaches would help to distinguish the portion of soil recovery that is attributable to vegetation development from that which is controlled by the strong geopedological heterogeneity that is characteristic of Mediterranean karst landscapes.
Overall, the results have two practical implications for afforestation management. First, restoration success should not be evaluated from tree establishment or SOC accumulation alone. Combining aggregate stability with microbial metabolic indicators can provide complementary evidence of whether belowground functioning is recovering. Second, site quality should remain central to plantation planning and interpretation of restoration outcomes. Variation in carbonate status, soil depth, parent material, and moisture availability can influence the magnitude of carbon accumulation independently of stand development. Monitoring protocols should therefore combine functional soil indicators with baseline edaphic characterization to distinguish restoration responses from inherent site variability.
4.6. Study Limitations and Future Perspectives
Several limitations should be considered when interpreting the observed chronosequence patterns. Firstly, the study employed a space-for-time design, whereby each chronosequence class was represented by a single plantation or reference site. The 15 sampling locations distributed across each class therefore characterize within-site variability, but do not constitute independent stand-level replication. Consequently, differences among the C0, C10, C15 and C25 classes should be interpreted as chronosequence-associated patterns rather than as the unequivocal temporal effects of stand age. This limitation is particularly relevant for the C25 site, which differed markedly in terms of its CaCO3 content, pH and particle-size distribution. We explicitly addressed this potential confounding factor through covariate analyses and a complementary sensitivity analysis restricted to the three sites with strongly calcareous substrates. The main responses of aggregate stability, basal respiration and qCO2 persisted under these tests, supporting their robustness. However, the magnitude of the responses of SOC, TN and MBC should be interpreted more cautiously as they were partly substrate-dependent. For several responses, the violation of the homogeneity-of-regression-slopes assumption indicates that the ANCOVA results should be regarded as a sensitivity analysis rather than a complete statistical separation of stand age from site effects.
Secondly, soil sampling was restricted to the top 10 cm of the mineral layer, and was only carried out once in October. Therefore, the results characterize surface-soil recovery only and cannot be extrapolated to whole-profile carbon storage or seasonal microbial dynamics. Additionally, carbon and nitrogen stocks were calculated without correcting for coarse-fragment volume, which could lead to an overestimation of area-based stocks in these stony karst soils. The microbial assessment was based on biomass and respiration indices, providing information on microbial functioning rather than community composition, functional genes or specific decomposition pathways. Future studies should replicate chronosequences across independent landscapes, include repeated seasonal sampling and deeper soil horizons, and quantify coarse-fragment volume. Integrating microbial community composition, extracellular enzyme activities, root and litter inputs, and long-term, permanent-plot monitoring would further clarify the mechanisms and rates of belowground recovery following C. libani afforestation. Future monitoring designs should therefore combine replicated plantations across comparable edaphic settings with repeated temporal sampling to separate stand development from site effects more rigorously.
5. Conclusions
Cedrus libani afforestation was associated with substantial changes in the structural, biogeochemical, and microbial properties of surface soils in degraded Mediterranean karst. Afforested soils generally contained higher levels of SOC, TN, AS and MBC than the degraded reference soils. Meanwhile, basal respiration and qCO2 declined markedly. However, these responses were not strictly monotonic with stand age, and the magnitude of carbon and nitrogen accumulation depended partly on local edaphic conditions. In contrast, AS and microbial metabolic responses were comparatively robust in the face of variation in carbonate content and pH. Therefore, the clearest functional signal of restoration was not carbon accumulation alone, but rather the pronounced decline in respiratory carbon loss per unit of microbial biomass. These findings demonstrate the value of integrating structural and microbial metabolic indicators with conventional carbon measurements when evaluating afforestation outcomes. Monitoring restoration and planning plantations in heterogeneous karst landscapes should therefore combine functional soil indicators with site-specific edaphic information, rather than relying on stand age or SOC accumulation alone.
Funding
This study was supported by the Kahramanmaraş Sütçü İmam University Scientific Research Projects Unit (Project No. 2026/5-26 M).
Declaration of competing interest
The authors declare no conflict of interest.
Data availability
Data will be made available on request.
Acknowledgments
The authors thank the staff of the Erdemli Forest Management Directorate, MSc student Nisanur Belge, and Res. Asst. Ferhat Kepek for their assistance during field and laboratory work.
References
- Wall, D.H.; Nielsen, U.N.; Six, J. Soil biodiversity and human health. Nature 2015, 528, 69–76. [Google Scholar] [CrossRef] [PubMed]
- FAO; UNEP. Global Assessment of Soil Pollution: Report; FAO: Rome, Italy, 2021. [Google Scholar] [CrossRef]
- Babur, E.; Dindaroğlu, T.; Uslu, O.S.; Gozukara, G.; Ozlu, E. Long-term effects of land use conversion on soil microbial biomass and stoichiometric indices in Eastern Mediterranean karst ecosystems (1981–2018). Land Degrad. Dev. 2025, 36, 5666–5680. [Google Scholar] [CrossRef]
- Ford, D.C.; Williams, P. Karst Hydrogeology and Geomorphology; John Wiley & Sons: Chichester, UK, 2007. [Google Scholar]
- Febles-González, J.M.; Vega-Carreño, M.B.; Tolón-Becerra, A.; Lastra-Bravo, X. Assessment of soil erosion in karst regions of Havana, Cuba. Land Degrad. Dev. 2012, 23, 465–474. [Google Scholar] [CrossRef]
- Lahmar, R.; Ruellan, A. Soil degradation in the Mediterranean region and cooperative strategies. Cah. Agric. 2007, 16, 318–323. [Google Scholar]
- Aguilera, E.; Lassaletta, L.; Sanz-Cobena, A.; Garnier, J.; Vallejo, A. The potential of organic fertilisers and water management to reduce N2O emissions in Mediterranean climate cropping systems. A review. Agric. Ecosyst. Environ. 2013, 164, 32–52. [Google Scholar] [CrossRef]
- Lagacherie, P.; Álvaro-Fuentes, J.; Annabi, M.; Bernoux, M.; Bouarfa, S.; Douaoui, A.; Grünberger, O.; Hammani, A.; Montanarella, L.; Mrabet, R.; Sabir, M.; Raclot, D. Managing Mediterranean soil resources under global change: Expected trends and mitigation strategies. Reg. Environ. Change 2018, 18, 663–675. [Google Scholar] [CrossRef]
- Dindaroğlu, T.; Babur, E.; Battaglia, M.; Seleiman, M.; Uslu, Ö.S.; Roy, R. Impact of depression areas and land-use change on soil organic carbon and total nitrogen contents in a semi-arid karst ecosystem. Cerne 2021, 27, e-102980. [Google Scholar] [CrossRef]
- Fang, Q.; Lu, A.; Hong, H.; Kuzyakov, Y.; Algeo, T.J.; Zhao, L.; Olshansky, Y.; Moravec, B.; Barrientes, D.M.; Chorover, J. Mineral weathering is linked to microbial priming in the critical zone. Nat. Commun. 2023, 14, 345. [Google Scholar] [CrossRef] [PubMed]
- Lima, A.M.N.; Silva, I.R.; Neves, J.C.L.; Novais, R.F.; Barros, N.F.; Mendonça, E.S.; Smyth, T.J.; Moreira, M.S.; Leite, F.P. Soil organic carbon dynamics following afforestation of degraded pastures with eucalyptus in southeastern Brazil. For. Ecol. Manag. 2006, 235, 219–231. [Google Scholar] [CrossRef]
- Kara, O.; Babur, E.; Altun, L.; Seyis, M. Effects of afforestation on microbial biomass C and respiration in eroded soils of Turkey. J. Sustain. For. 2016, 35, 385–396. [Google Scholar] [CrossRef]
- Lal, R. Soil organic matter and water retention. Agron. J. 2020, 112, 3265–3277. [Google Scholar] [CrossRef]
- Yu, P.; Tang, H.; Sun, X.; Shi, W.; Pan, J.; Liu, S.; Jia, H.; Ding, Z.; Tang, X.; Chen, M. Afforestation alters soil microbial community composition and reduces microbial network complexity in a karst region of Southwest China. Land Degrad. Dev. 2024, 35, 2926–2939. [Google Scholar] [CrossRef]
- Six, J.; Bossuyt, H.; Degryze, S.; Denef, K. A history of research on the link between (micro)aggregates, soil biota, and soil organic matter dynamics. Soil Tillage Res. 2004, 79, 7–31. [Google Scholar] [CrossRef]
- Cotrufo, M.F.; Ranalli, M.G.; Haddix, M.L.; Six, J.; Lugato, E. Soil carbon storage informed by particulate and mineral-associated organic matter. Nat. Geosci. 2019, 12, 989–994. [Google Scholar] [CrossRef]
- Lehmann, J.; Bossio, D.A.; Kögel-Knabner, I.; Rillig, M.C. The concept and future prospects of soil health. Nat. Rev. Earth Environ. 2020, 1, 544–553. [Google Scholar] [CrossRef] [PubMed]
- Schimel, J.P.; Schaeffer, S.M. Microbial control over carbon cycling in soil. Front. Microbiol. 2012, 3, 348. [Google Scholar] [CrossRef] [PubMed]
- Liang, C.; Amelung, W.; Lehmann, J.; Kästner, M. Quantitative assessment of microbial necromass contribution to soil organic matter. Glob. Chang. Biol. 2019, 25, 3578–3590. [Google Scholar] [CrossRef] [PubMed]
- Padalia, K.; Tripathi, M.; Juyal, P. Soil microbial biomass: A promising bioindicator for assessing soil fertility in the Indian Himalayan mountainous ecosystem. Curr. Opin. Environ. Sustain. 2026, 83, 101690. [Google Scholar] [CrossRef]
- Anderson, T.H.; Domsch, K.H. Application of eco-physiological quotients (qCO2 and qD) on microbial biomasses from soils of different cropping histories. Soil Biol. Biochem. 1990, 22, 251–255. [Google Scholar] [CrossRef]
- Anderson, T.H.; Domsch, K.H. The metabolic quotient for CO2 (qCO2) as a specific activity parameter to assess the effects of environmental conditions, such as pH, on the microbial biomass of forest soils. Soil Biol. Biochem. 1993, 25, 393–395. [Google Scholar] [CrossRef]
- Babur, E.; Dindaroğlu, T.; Solaiman, Z.M.; Battaglia, M.L. Microbial respiration, microbial biomass and activity are highly sensitive to forest tree species and seasonal patterns in the Eastern Mediterranean karst ecosystems. Sci. Total Environ. 2021, 775, 145868. [Google Scholar] [CrossRef]
- Akbaş, M.; Babur, E.; Tüfekçioğlu, A. Soil physicochemical and biochemical differentiation under dominant broadleaf forest species in the Eastern Black Sea region. Forests 2026, 17, 458. [Google Scholar] [CrossRef]
- Babur, E.; Ozlu, E.; Uslu, O.S. Soil respiration, microbial biomass, and stoichiometry within riparian buffers and adjacent land use. Sci. Rep. 2025, 15, 40445. [Google Scholar] [CrossRef] [PubMed]
- Walker, L.R.; Wardle, D.A.; Bardgett, R.D.; Clarkson, B.D. The use of chronosequences in studies of ecological succession and soil development. J. Ecol. 2010, 98, 725–736. [Google Scholar] [CrossRef]
- Poeplau, C.; Don, A.; Vesterdal, L.; Leifeld, J.; Van Wesemael, B.; Schumacher, J.; Gensior, A. Temporal dynamics of soil organic carbon after land-use change in the temperate zone—carbon response functions as a model approach. Glob. Chang. Biol. 2011, 17, 2415–2427. [Google Scholar] [CrossRef]
- Boydak, M. Regeneration of Lebanon cedar (Cedrus libani A. Rich.) on karstic lands in Turkey. For. Ecol. Manag. 2003, 178, 231–243. [Google Scholar] [CrossRef]
- Boydak, M. Reforestation of Lebanon cedar (Cedrus libani A. Rich.) in bare karstic lands by broadcast seeding in Turkey. In MEDPINE 3 Proceedings; Leone, V., Lovreglio, R., Eds.; CIHEAM: Bari, Italy, 2007; pp. 33–42. [Google Scholar]
- Babur, E.; Yalçıntaş, B.; Ünsal, Y.T. Impact of Cedrus libani afforestation on soil carbon and nitrogen stocks in the upper Mediterranean basin. Turk. J. For. Sci. 2025, 9, 75–88. [Google Scholar] [CrossRef]
- Atalay, İ.; Siler, M. The effects of karstic areas on agriculture and forestry in the Western Mediterranean region of Türkiye. Turk. J. For. Sci. 2026, 10, 1840111. [Google Scholar] [CrossRef]
- MTA. Geological Map of the Adana Region; General Directorate of Mineral Research and Exploration: Ankara, Türkiye, 2020. [Google Scholar]
- Bulut, B. Karaisalı Kireçtaşı’nın Mermer Olarak Kullanılabilme Olanaklarının Araştırılması. MSc Thesis, Çukurova University, Adana, Türkiye, 1998. [Google Scholar]
- UNECE. Manual on Methods and Criteria for Harmonized Sampling, Assessment, Monitoring and Analysis of the Effects of Air Pollution on Forests, Part IIIa; United Nations Economic Commission for Europe: Geneva, Switzerland, 2003. [Google Scholar]
- Stolbovoy, V.; Montanarella, L.; Filippi, N.; Selvaradjou, S.-K.; Panagos, P.; Pinilla, F.J.G. Soil Sampling Protocol to Certify the Changes of Organic Carbon Stock in Mineral Soil of the European Union; Office for Official Publications of the European Communities: Luxembourg, 2007. [Google Scholar]
- European Commission. LUCAS 2009 Technical Reference Document C1; Eurostat: Luxembourg, 2009. [Google Scholar]
- Bouyoucos, G.J. Hydrometer method improved for making particle size analyses of soils. Agron. J. 1962, 54, 464–465. [Google Scholar] [CrossRef]
- Walkley, A.; Black, I.A. An examination of the Degtjareff method for determining soil organic matter, and a proposed modification of the chromic acid titration method. Soil Sci. 1934, 37, 29–38. [Google Scholar] [CrossRef]
- Rowell, D.L. Soil Science: Methods and Applications; Longman Scientific and Technical: Harlow, UK, 1994. [Google Scholar]
- Blake, G.R.; Hartge, K.H. Bulk density. In Methods of Soil Analysis, Part 1, 2nd ed.; Klute, A., Ed.; ASA and SSSA: Madison, WI, USA, 1986; pp. 363–375. [Google Scholar] [CrossRef]
- Kemper, W.D.; Rosenau, R.C. Aggregate stability and size distribution. In Methods of Soil Analysis, Part 1, 2nd ed.; Klute, A., Ed.; ASA and SSSA: Madison, WI, USA, 1986; pp. 425–442. [Google Scholar] [CrossRef]
- Babur, E.; Kara, O.; Fathi, R.A.; Susam, Y.E.; Riaz, M.; Arif, M.; Akhtar, K. Wattle fencing improved soil aggregate stability, organic carbon stocks and biochemical quality by restoring highly eroded mountain region soil. J. Environ. Manag. 2021, 288, 112489. [Google Scholar] [CrossRef] [PubMed]
- Horwath, W.R.; Paul, E.A. Microbial biomass. In Methods of Soil Analysis, Part 2; SSSA: Madison, WI, USA, 1994; pp. 753–773. [Google Scholar]
- Brookes, P.C.; Landman, A.; Pruden, G.; Jenkinson, D.S. Chloroform fumigation and the release of soil nitrogen: A rapid direct extraction method to measure microbial biomass nitrogen in soil. Soil Biol. Biochem. 1985, 17, 837–842. [Google Scholar] [CrossRef]
- Vance, E.D.; Brookes, P.C.; Jenkinson, D.S. An extraction method for measuring soil microbial biomass C. Soil Biol. Biochem. 1987, 19, 703–707. [Google Scholar] [CrossRef]
- Alef, K. Soil respiration. In Methods in Applied Soil Microbiology and Biochemistry; Alef, K., Nannipieri, P., Eds.; Academic Press: London, UK, 1995; pp. 214–219. [Google Scholar]
- Dilly, O.; Munch, J.C. Ratios between estimates of microbial biomass content and microbial activity in soils. Biol. Fertil. Soils 1998, 27, 374–379. [Google Scholar] [CrossRef]
- Mitchell, J.C.; Kashian, D.M.; Chen, X.; Cousins, S.; Flaspohler, D.; Gruner, D.S.; Johnson, J.S.; Surasinghe, T.D.; Zambrano, J.; Buma, B. Forest ecosystem properties emerge from interactions of structure and disturbance. Front. Ecol. Environ. 2023, 21, 14–23. [Google Scholar] [CrossRef]
- Hamza, A.; Karčauskienė, D.; Mockevičienė, I.; Repšienė, R.; Tahir, M.A.; Manzoor, M.Z.; Kousar, S.; Lodhi, S.S.; Rasool, N.; Ullah, I. Soil aggregate dynamics and stability: Natural and anthropogenic drivers. Agriculture 2025, 15, 2500. [Google Scholar] [CrossRef]
- Li, Y.; Zhang, X.; Wang, B.; Wu, X.; Wang, Z.; Liu, L.; Yang, H. Revegetation promotes soil mineral-associated organic carbon sequestration and soil carbon stability in the Tengger Desert, northern China. Soil Biol. Biochem. 2023, 185, 109155. [Google Scholar] [CrossRef]
- Zhou, H.; Qu, Q.; Xu, H.; Wang, M.; Xue, S. Effects of vegetation restoration on soil microbial necromass carbon and organic carbon in grazed and degraded sandy land. J. Environ. Manag. 2025, 382, 125380. [Google Scholar] [CrossRef] [PubMed]
- Liu, L.; Yang, Y.; Zhang, X.; Chen, K.; Yang, H.; Zhu, Q.; Xu, Q.; Meng, L.; Zhu, T.; Cao, J.; Elrys, A.S. Mixed-species afforestation stimulates the flow and turnover of carbon and nitrogen within soil aggregates in a degraded karst ecosystem. J. Environ. Manag. 2026, 411, 130169. [Google Scholar] [CrossRef] [PubMed]
- Ghonimy, M.; Aggag, A.M.; Alzoheiry, A.; Alharbi, A. Sustainable environmental analysis of soil, water, and machine interactions: A review. Sustainability 2026, 18, 2900. [Google Scholar] [CrossRef]
- Li, X.; Guo, Q.; Jia, R.; Gao, Y. Revegetation drives the accrual and stabilization of organic carbon in biocrusts and subsoils in the Tengger Desert, north China. Geoderma 2025, 460, 117437. [Google Scholar] [CrossRef]
- Zheng, Y.; Ye, J.; Pei, J.; Fang, C.; Li, D.; Ke, W.; Song, X.; Sardans, J.; Peñuelas, J. Initial soil condition, stand age, and aridity alter the pathways for modifying the soil carbon under afforestation. Sci. Total Environ. 2024, 946, 174448. [Google Scholar] [CrossRef] [PubMed]
- Davis, K.A.; McKinney, M.M.S.; Gittman, R.K.; Peralta, A.L. Evaluating plant–microbe associations in response to environmental stressors to enhance salt marsh restoration. Estuaries Coasts 2026, 49, 116. [Google Scholar] [CrossRef]
- Shao, P.; Liang, C.; Lynch, L.; Xie, H.; Bao, X. Reforestation accelerates soil organic carbon accumulation: Evidence from microbial biomarkers. Soil Biol. Biochem. 2019, 131, 182–190. [Google Scholar] [CrossRef]
- Zhao, G.X.; Tariq, A.; Zhang, Z.H.; Nazim, M.; Graciano, C.; Sardans, J.; Dong, X.P.; Gao, Y.J.; Peñuelas, J.; Zeng, F.J. Afforestation with xerophytic shrubs promoted soil organic carbon stability in a hyper-arid environment of desert. Land Degrad. Dev. 2025, 36, 655–667. [Google Scholar] [CrossRef]
- Canarini, A.; Kiær, L.P.; Dijkstra, F.A. Soil carbon loss regulated by drought intensity and available substrate: A meta-analysis. Soil Biol. Biochem. 2017, 112, 90–99. [Google Scholar] [CrossRef]
- Shi, K.; Liao, J.; Zou, X.; Chen, H.Y.H.; Delgado-Baquerizo, M.; Wanek, W.; Ni, J.; Ren, T.; Zhang, C.; Yan, Z.; Ruan, H. Forest development induces soil aggregate formation and stabilization: Implications for sequestration of soil carbon and nitrogen. Catena 2024, 246, 108363. [Google Scholar] [CrossRef]
- Gatica-Saavedra, P.; Echeverría, C.; Nelson, C.R. Soil health indicators for monitoring forest ecological restoration: A critical review. Restor. Ecol. 2023, 31, e13836. [Google Scholar] [CrossRef]
- Liu, S.; Lin, Z.; Duan, X.; Deng, Y. Effects of soil microorganisms on aggregate stability during vegetation recovery in degraded granitic red soil areas. Appl. Soil Ecol. 2024, 204, 105734. [Google Scholar] [CrossRef]
- Sarginci, M.; Seçilmiş, A. Effects of afforestation on soil organic carbon and nitrogen stocks in the long term in semi-arid regions of Türkiye. Forests 2025, 16, 1524. [Google Scholar] [CrossRef]
Figure 1.
Location of the study sites. (a) Position of Mersin province within Türkiye, with the study area boxed. (b) The four sampling areas in the upland part of Erdemli district: unafforested control (C0) and Cedrus libani plantations established in 2015 (C10), 2010 (C15) and 2000 (C25). Symbols mark the recorded cylinder sampling points; the C25 site lies approximately 7 km south of the other three. Coordinates were recorded in UTM zone 36N and converted to geographic coordinates.
Figure 1.
Location of the study sites. (a) Position of Mersin province within Türkiye, with the study area boxed. (b) The four sampling areas in the upland part of Erdemli district: unafforested control (C0) and Cedrus libani plantations established in 2015 (C10), 2010 (C15) and 2000 (C25). Symbols mark the recorded cylinder sampling points; the C25 site lies approximately 7 km south of the other three. Coordinates were recorded in UTM zone 36N and converted to geographic coordinates.
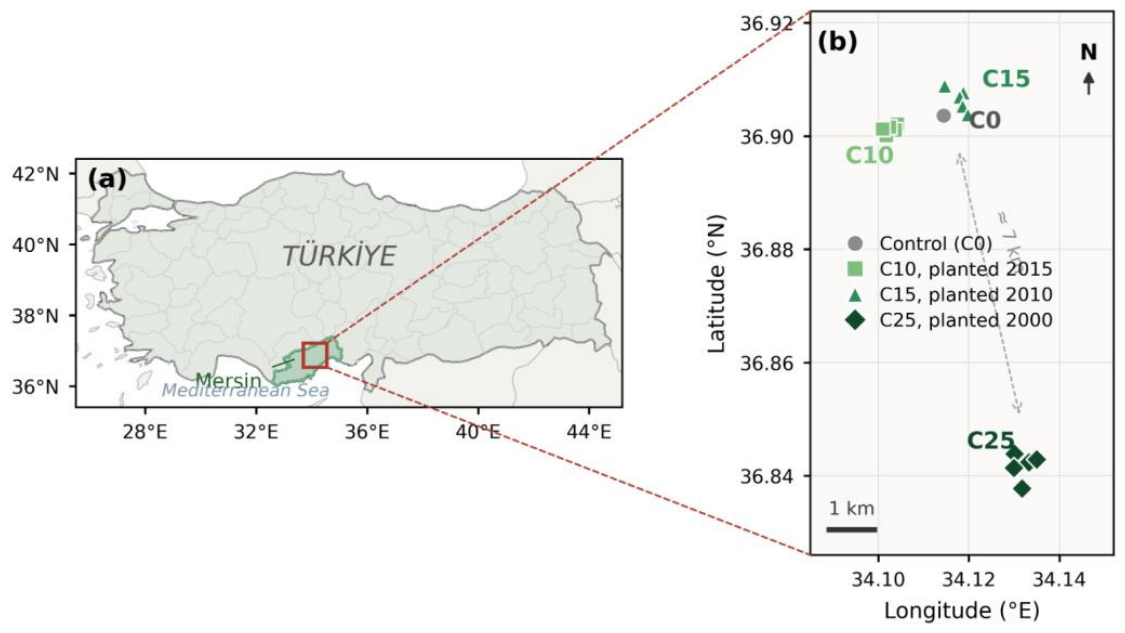
Figure 2.
Changes in soil particle-size distribution and physical properties along the C. libani afforestation chronosequence.
Figure 2.
Changes in soil particle-size distribution and physical properties along the C. libani afforestation chronosequence.
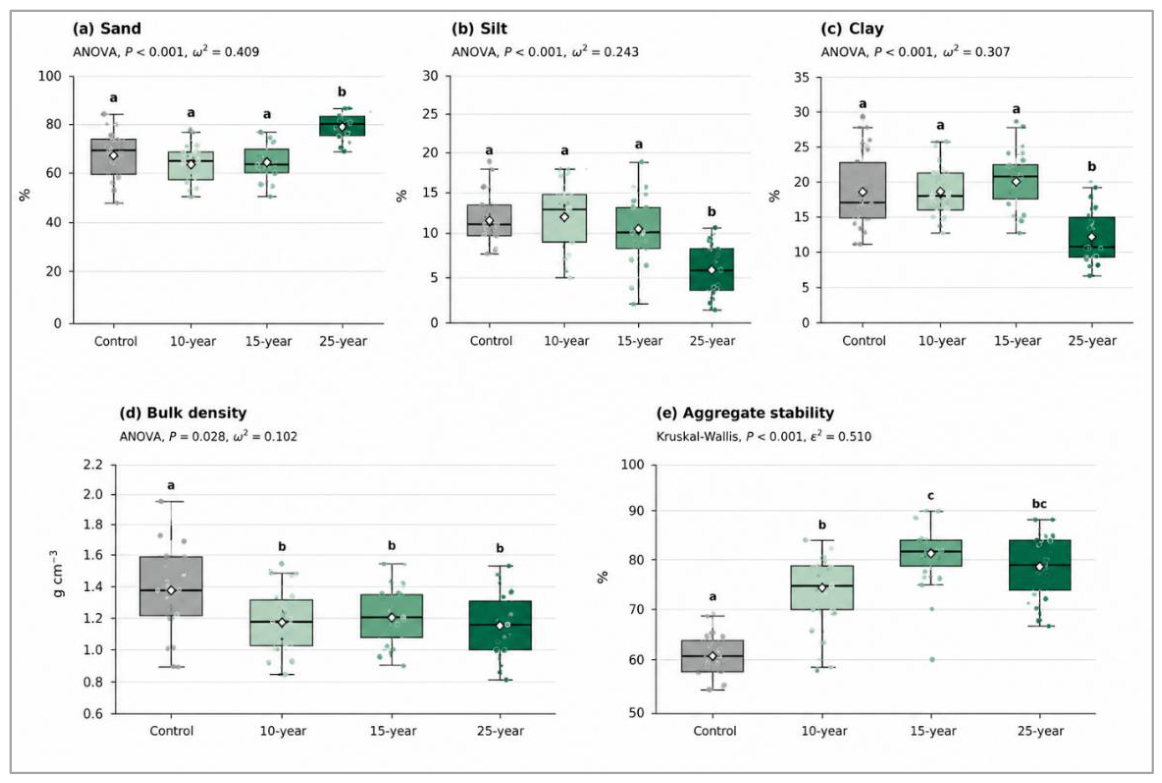
Figure 3.
Soil chemical properties across C. libani afforestation chronosequence classes: (a) soil pH, (b) electrical conductivity, (c) soil organic carbon, (d) total nitrogen, (e) C/N ratio, and (f) calcium carbonate. Boxes represent the interquartile range, center lines the median, whiskers 1.5 times the interquartile range, white diamonds the mean, and points individual observations (n = 15 per stand-age class). Different lowercase letters indicate significant pairwise differences among stand-age classes (P < 0.05) according to Tukey’s HSD for parametric variables or Dunn–Holm multiple-comparison tests for non-parametric variables.
Figure 3.
Soil chemical properties across C. libani afforestation chronosequence classes: (a) soil pH, (b) electrical conductivity, (c) soil organic carbon, (d) total nitrogen, (e) C/N ratio, and (f) calcium carbonate. Boxes represent the interquartile range, center lines the median, whiskers 1.5 times the interquartile range, white diamonds the mean, and points individual observations (n = 15 per stand-age class). Different lowercase letters indicate significant pairwise differences among stand-age classes (P < 0.05) according to Tukey’s HSD for parametric variables or Dunn–Holm multiple-comparison tests for non-parametric variables.
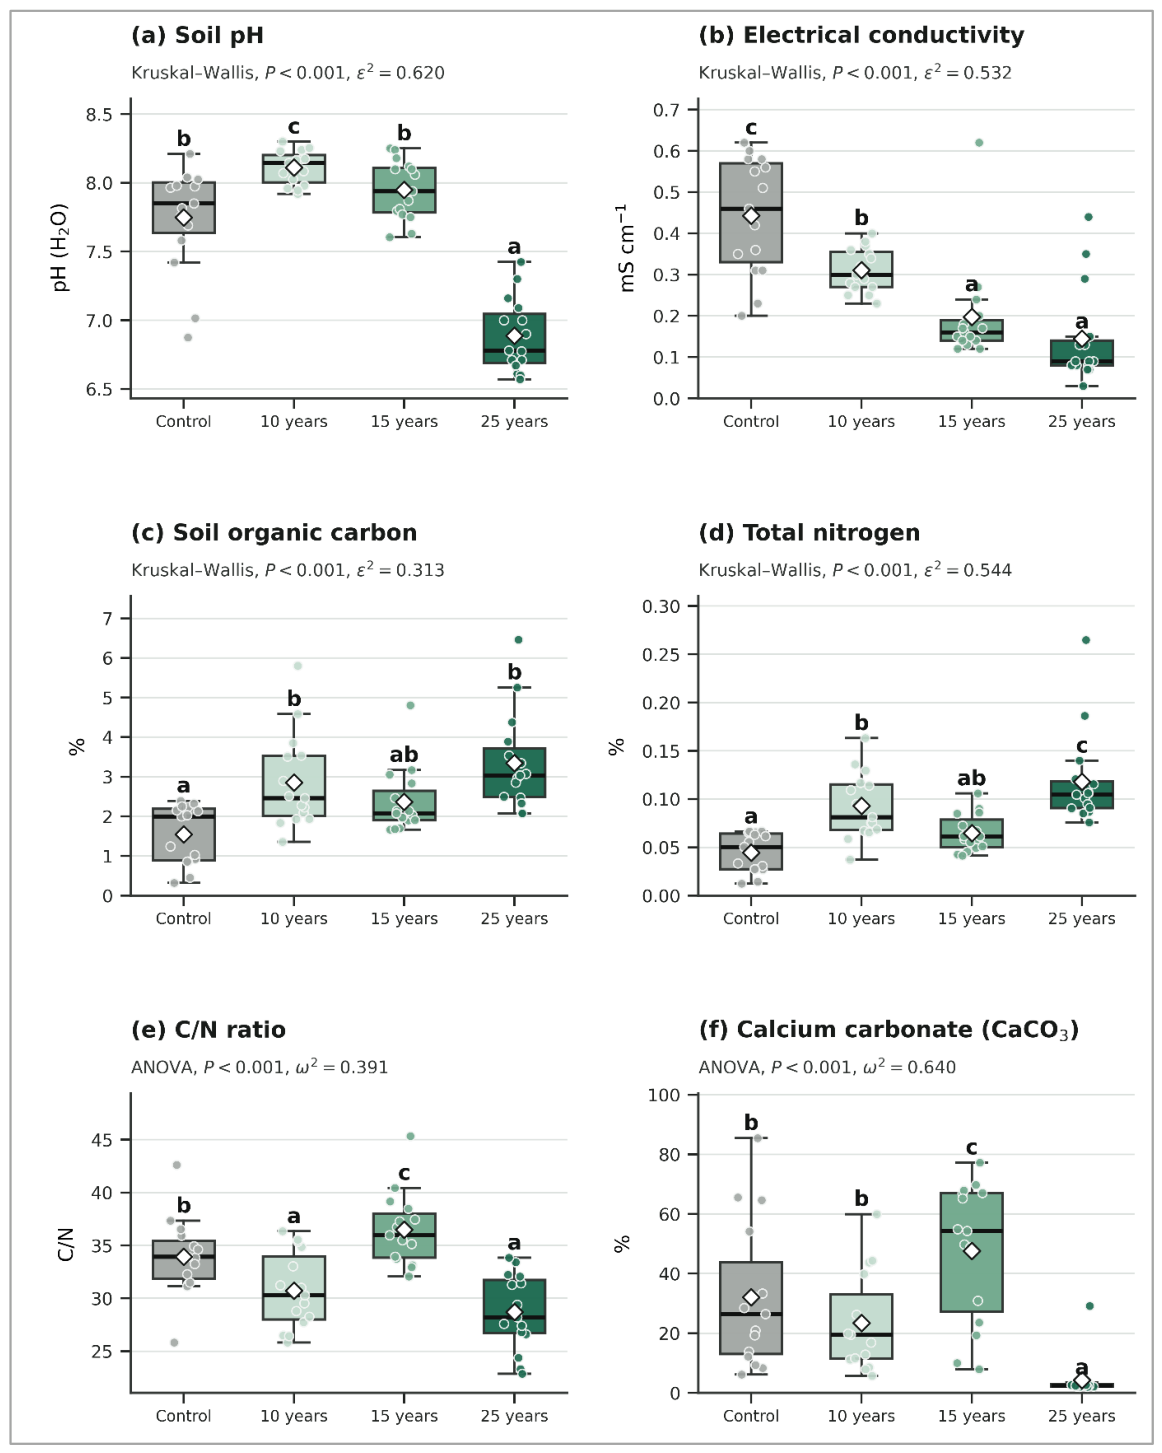
Figure 4.
Changes in soil microbial functioning across the C. libani afforestation chronosequence. Panels show (a) microbial biomass carbon (MBC), (b) basal respiration, (c) microbial quotient (qMic), and (d) metabolic quotient (qCO2). Boxplots show medians and interquartile ranges, whiskers extend to 1.5 times the interquartile range, points represent individual soil samples, and white diamonds indicate arithmetic means (n = 15 per stand-age class). Different lowercase letters indicate significant Tukey HSD pairwise differences (P < 0.05); identical letters for qMic reflect its non-significant overall ANOVA result. Panel annotations report the omnibus ANOVA P values and omega-squared effect sizes shown in Table 3. The y-axes display the original measurement scales.
Figure 4.
Changes in soil microbial functioning across the C. libani afforestation chronosequence. Panels show (a) microbial biomass carbon (MBC), (b) basal respiration, (c) microbial quotient (qMic), and (d) metabolic quotient (qCO2). Boxplots show medians and interquartile ranges, whiskers extend to 1.5 times the interquartile range, points represent individual soil samples, and white diamonds indicate arithmetic means (n = 15 per stand-age class). Different lowercase letters indicate significant Tukey HSD pairwise differences (P < 0.05); identical letters for qMic reflect its non-significant overall ANOVA result. Panel annotations report the omnibus ANOVA P values and omega-squared effect sizes shown in Table 3. The y-axes display the original measurement scales.
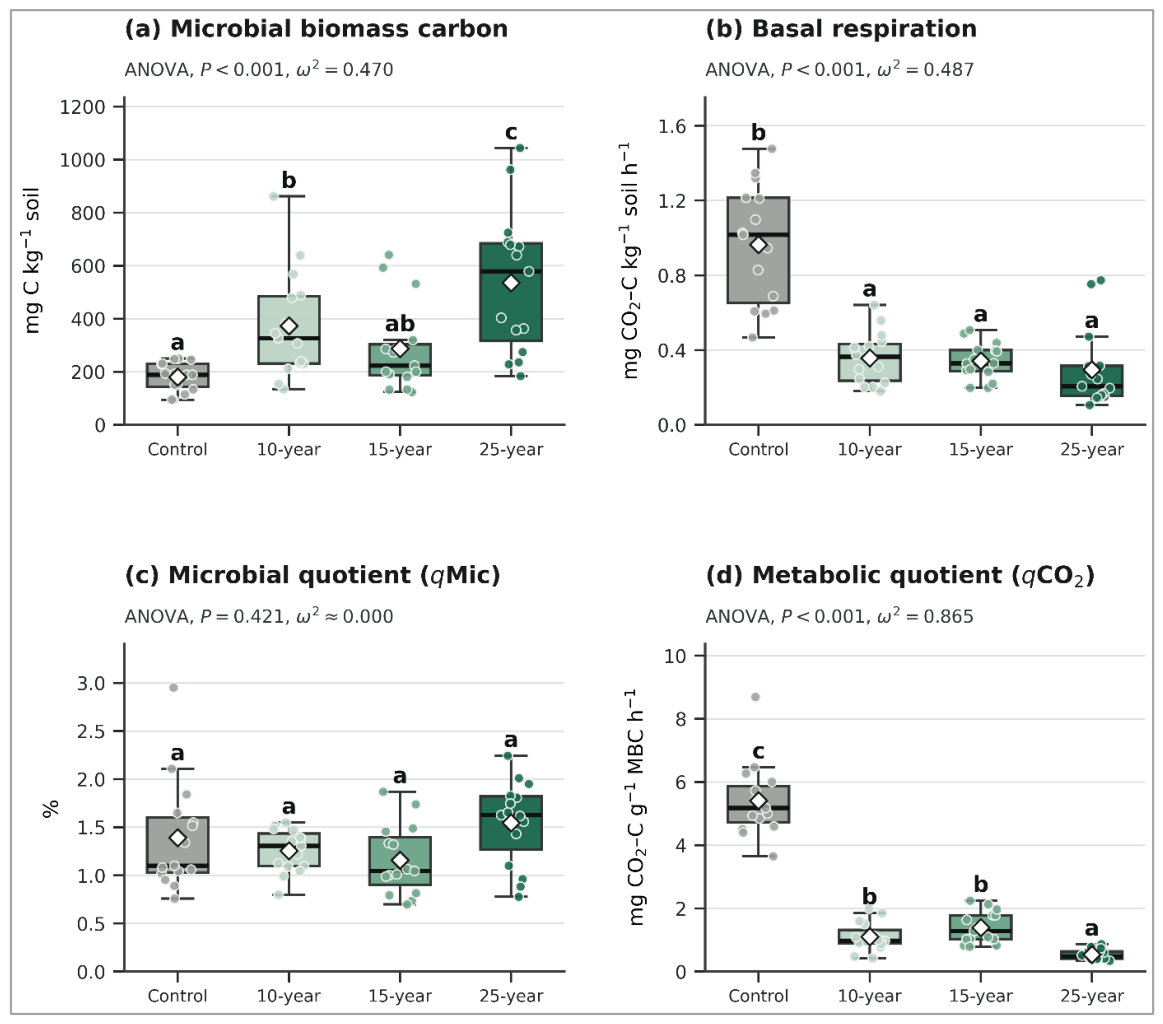
Figure 5.
Principal component analysis (PCA) biplot of standardized soil physicochemical and microbial properties across the C. libani afforestation chronosequence. Points represent individual soil samples (n = 15 per stand-age class), shaded ellipses represent 95% confidence regions for group centroids, larger outlined symbols indicate group centroids, and dashed arrows connect centroids in chronological order (Control → 10-year → 15-year → 25-year). Loading vectors show the direction and strength of variables contributing to the ordination. PC1 and PC2 explained 41.9% and 19.4% of the total variance, respectively (61.3% cumulatively). Texture ILR1 and ILR2 are isometric log-ratio coordinates derived from sand, silt, and clay. The PCA used the same 11-variable standardized matrix as the final PERMANOVA reported in Table 4.
Figure 5.
Principal component analysis (PCA) biplot of standardized soil physicochemical and microbial properties across the C. libani afforestation chronosequence. Points represent individual soil samples (n = 15 per stand-age class), shaded ellipses represent 95% confidence regions for group centroids, larger outlined symbols indicate group centroids, and dashed arrows connect centroids in chronological order (Control → 10-year → 15-year → 25-year). Loading vectors show the direction and strength of variables contributing to the ordination. PC1 and PC2 explained 41.9% and 19.4% of the total variance, respectively (61.3% cumulatively). Texture ILR1 and ILR2 are isometric log-ratio coordinates derived from sand, silt, and clay. The PCA used the same 11-variable standardized matrix as the final PERMANOVA reported in Table 4.
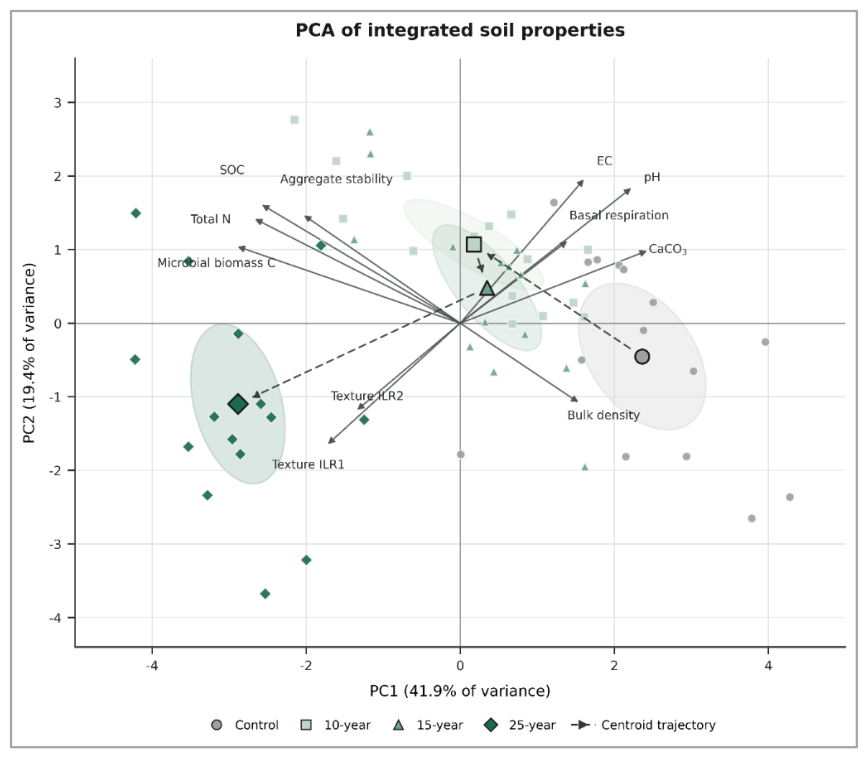
Figure 6.
(a) Pairwise Spearman rank correlations among soil particle-size fractions, physicochemical properties, and microbial indicators across the C. libani afforestation chronosequence. Cells show correlation coefficients (ρ; n = 60); asterisks indicate significance after Benjamini–Hochberg false discovery rate correction across 105 pairwise tests (*P < 0.05, **P < 0.01, ***P < 0.001). Sand, silt, and clay are particle-size fractions; BD: bulk density; AS: aggregate stability; EC: electrical conductivity; CaCO3: calcium carbonate; SOC: soil organic carbon; TN: total nitrogen; MBC: microbial biomass carbon; BR; basal respiration; qMic; microbial quotient; and qCO2; metabolic quotient. (b) Partial Spearman correlations among soil particle-size fractions, physicochemical properties, and microbial indicators across the C. libani afforestation chronosequence, adjusted for stand-age class using three indicator covariates. Cells show correlation coefficients (ρ; n = 60); asterisks indicate significance after Benjamini–Hochberg false discovery rate correction across 105 pairwise tests (*P < 0.05, **P < 0.01, ***P < 0.001). Sand, silt, and clay are particle-size fractions; BD, bulk density; AS, aggregate stability; EC, electrical conductivity; CaCO3, calcium carbonate; SOC, soil organic carbon; TN, total nitrogen; MBC, microbial biomass carbon; BR, basal respiration; qMic, microbial quotient; and qCO2, metabolic quotient.
Figure 6.
(a) Pairwise Spearman rank correlations among soil particle-size fractions, physicochemical properties, and microbial indicators across the C. libani afforestation chronosequence. Cells show correlation coefficients (ρ; n = 60); asterisks indicate significance after Benjamini–Hochberg false discovery rate correction across 105 pairwise tests (*P < 0.05, **P < 0.01, ***P < 0.001). Sand, silt, and clay are particle-size fractions; BD: bulk density; AS: aggregate stability; EC: electrical conductivity; CaCO3: calcium carbonate; SOC: soil organic carbon; TN: total nitrogen; MBC: microbial biomass carbon; BR; basal respiration; qMic; microbial quotient; and qCO2; metabolic quotient. (b) Partial Spearman correlations among soil particle-size fractions, physicochemical properties, and microbial indicators across the C. libani afforestation chronosequence, adjusted for stand-age class using three indicator covariates. Cells show correlation coefficients (ρ; n = 60); asterisks indicate significance after Benjamini–Hochberg false discovery rate correction across 105 pairwise tests (*P < 0.05, **P < 0.01, ***P < 0.001). Sand, silt, and clay are particle-size fractions; BD, bulk density; AS, aggregate stability; EC, electrical conductivity; CaCO3, calcium carbonate; SOC, soil organic carbon; TN, total nitrogen; MBC, microbial biomass carbon; BR, basal respiration; qMic, microbial quotient; and qCO2, metabolic quotient.
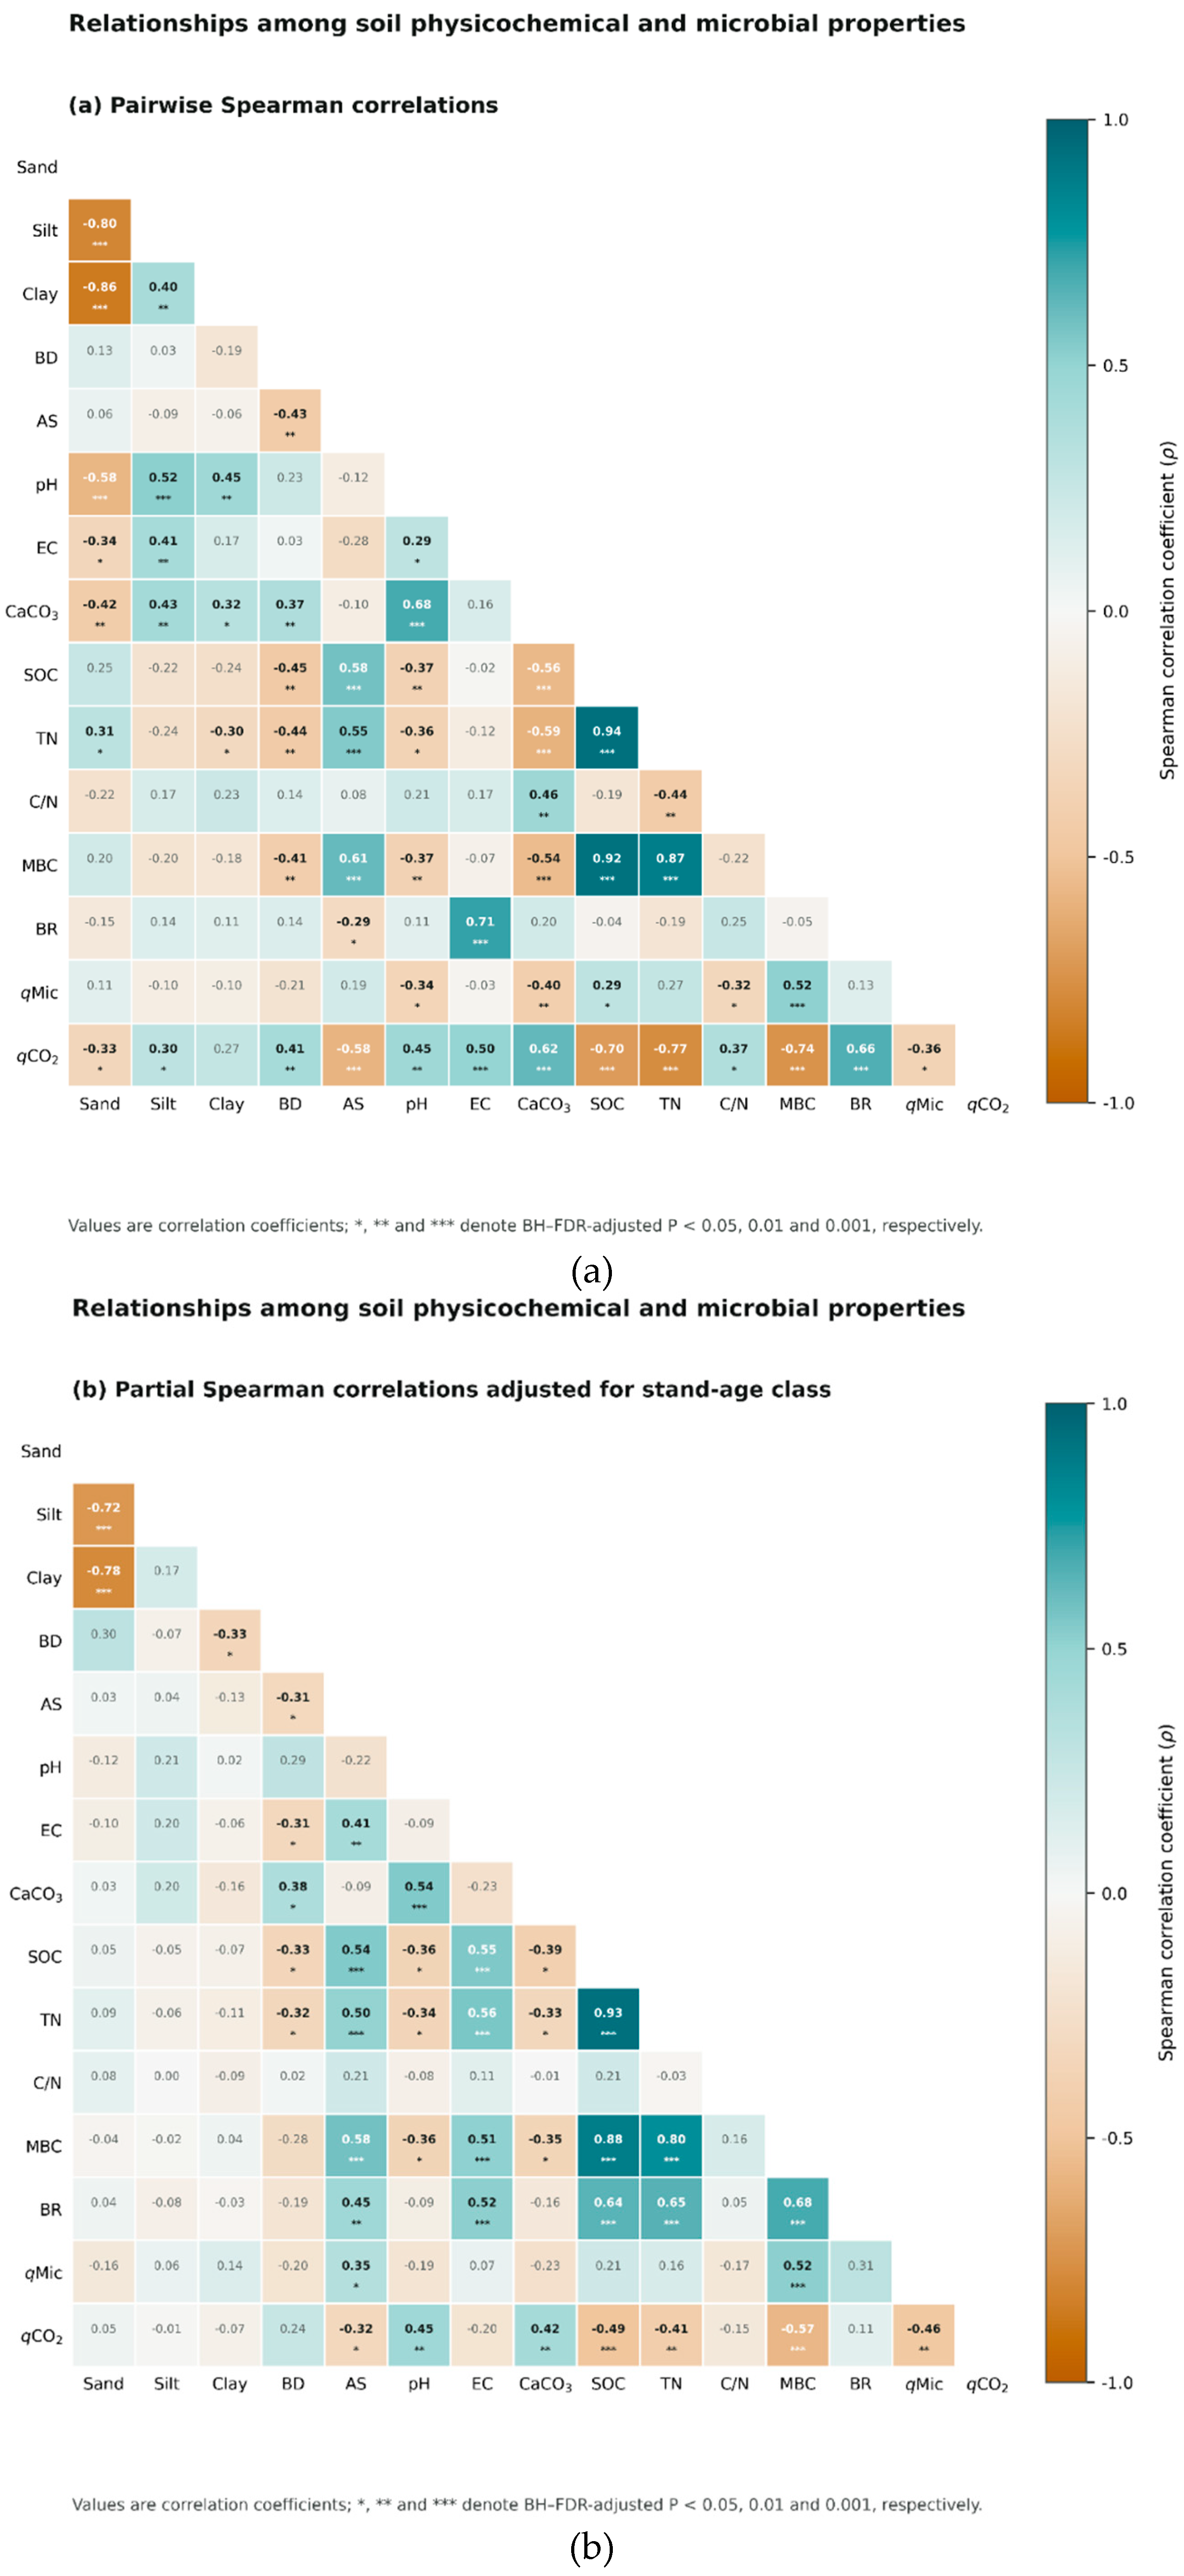
Figure 7.
(a) Soil pH against carbonate content by stand age; (b) microbial biomass carbon against carbonate content with fitted linear regression (r = −0.494, P < 0.001, slope = −4.59 µg g−1 per % CaCO3; n = 60).
Figure 7.
(a) Soil pH against carbonate content by stand age; (b) microbial biomass carbon against carbonate content with fitted linear regression (r = −0.494, P < 0.001, slope = −4.59 µg g−1 per % CaCO3; n = 60).
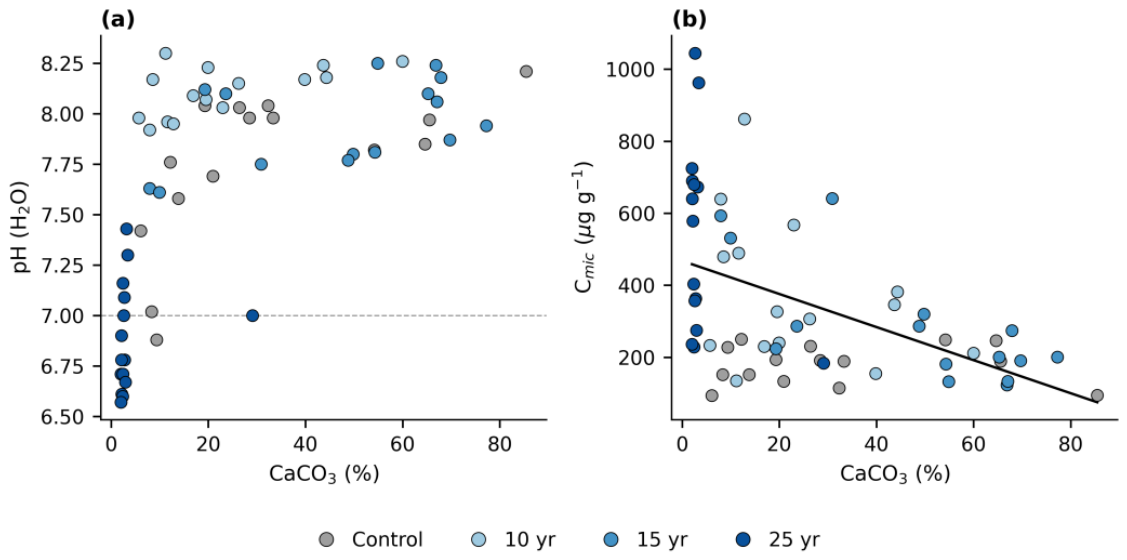
Figure 8.
(a) Partial η2 of stand age before and after adjustment for carbonate and pH; (b) unadjusted and adjusted microbial biomass carbon by stand age.
Figure 8.
(a) Partial η2 of stand age before and after adjustment for carbonate and pH; (b) unadjusted and adjusted microbial biomass carbon by stand age.
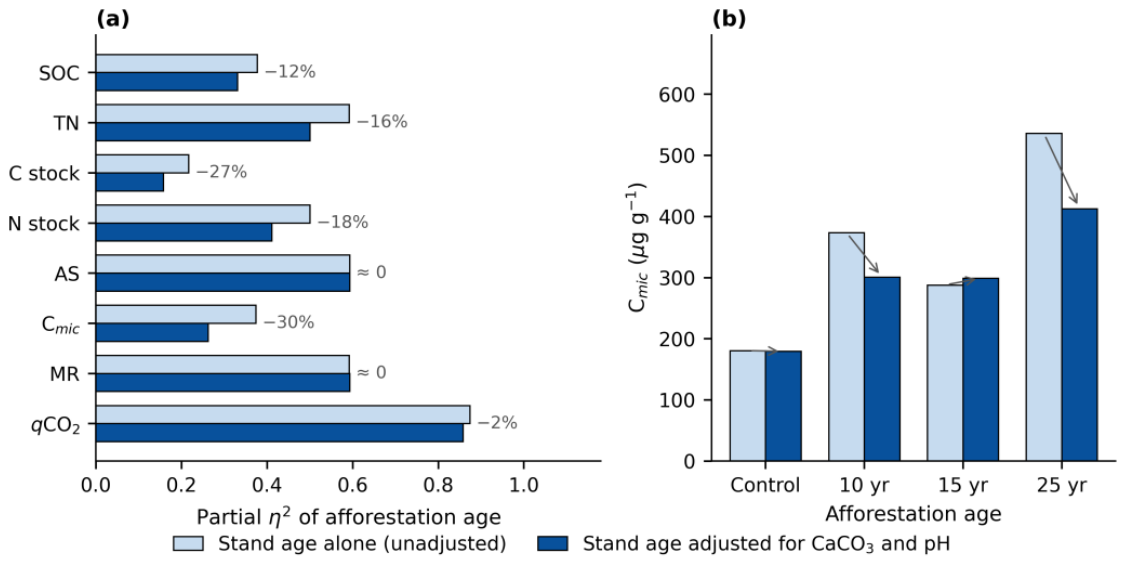

Table 1.
Location, elevation and climate of the four study sites. Climate values are WorldClim 2.1 (1970–2000) extracted at each plot centroid.
Table 1.
Location, elevation and climate of the four study sites. Climate values are WorldClim 2.1 (1970–2000) extracted at each plot centroid.
| Characteristic | Control (C0) | C10 | C15 | C25 |
| Field trial area | – | Area 3 | Area 2 | Area 1 |
| Latitude (N) | 36°54’13″ | 36°54’08″ | 36°54’28″ | 36°50’38″ |
| Longitude (E) | 34°06’52″ | 34°06’15″ | 34°07’08″ | 34°07’48″ |
| Altitude (m a.s.l.) | 1670 | 1675 | 1690 | 1650 |
| Mean slope (%) | 30 | 40 | 10 | 40 |
| Planting year | – | 2015 | 2010 | 2000 |
| Nominal stand-age class (yr) | – | 10 | 15 | 25 |
| Mean annual T (°C) | 8.7 | 8.5 | 8.7 | 9.0 |
| Annual precipitation (mm) | 559 | 559 | 556 | 574 |
| Coldest/warmest month (°C) | −2.4 / 19.4 | −2.6 / 19.2 | −2.4 / 19.4 | −1.6 / 19.6 |
| De Martonne index | 30.0 | 30.2 | 29.7 | 30.2 |
| Köppen class | Dsb | Dsb | Dsb | Dsb |
| Parent material | Limestone | Limestone | Limestone | Limestone |
| Soil group | Terra rossa | Terra rossa | Terra rossa | Terra rossa |
| Texture class | Sandy clay loam | Sandy clay loam | Sandy clay loam | Sandy loam |
| pH class | Slightly alkaline | Moderately alkaline | Moderately alkaline | Neutral |
| Stem density (trees ha−1) | – | 2000 | 2033 | 1600 |
| Basal area (m2 ha−1) | – | 15.6 | 14.6 | 37.7 |
| Soil samples (n) | 15 | 15 | 15 | 15 |
Coordinates recomputed from the UTM zone 36N field records. The four sites differ by only 0.5 °C in mean annual temperature, 18 mm in annual precipitation, and 17 m in elevation — differences smaller than the climate model’s uncertainty. These small differences suggest that broad-scale climatic variation is unlikely to be the primary source of contrasts among chronosequence classes.
Table 2.
Soil particle-size distribution, physical and chemical properties (0–10 cm) across the Cedrus libani afforestation chronosequence.
Table 2.
Soil particle-size distribution, physical and chemical properties (0–10 cm) across the Cedrus libani afforestation chronosequence.
| Variable | Control | 10 years | 15 years | 25 years | P value | Effect size |
| Soil particle-size distribution | ||||||
| Sand (%) | 69.94 ± 9.73ᵃ | 65.96 ± 5.97ᵃ | 67.37 ± 7.31ᵃ | 82.04 ± 5.75ᵇ | <0.001 | ω2 = 0.409 |
| Silt (%) | 11.26 ± 3.98ᵃ | 13.78 ± 5.10ᵃ | 11.58 ± 5.64ᵃ | 6.11 ± 3.42ᵇ | <0.001 | ω2 = 0.243 |
| Clay (%) | 18.80 ± 6.67ᵃ | 20.26 ± 3.77ᵃ | 21.06 ± 4.41ᵃ | 11.86 ± 5.10ᵇ | <0.001 | ε2 = 0.307 |
| Soil physical properties | ||||||
| Bulk density (g cm−3) | 1.35 ± 0.32ᵃ | 1.14 ± 0.22ᵇ | 1.16 ± 0.19ᵇ | 1.09 ± 0.23ᵇ | 0.028 | ω2 = 0.102 |
| Aggregate stability (%) | 61.32 ± 4.68ᵃ | 77.77 ± 8.70ᵇ | 84.94 ± 8.73ᶜ | 81.17 ± 8.05ᵇᶜ | <0.001 | ε2 = 0.510 |
| Soil chemical properties | ||||||
| pH (H2O) | 7.75 ± 0.38ᵇ | 8.11 ± 0.12ᶜ | 7.95 ± 0.22ᵇ | 6.89 ± 0.27ᵃ | <0.001 | ε2 = 0.620 |
| Electrical conductivity (mS cm−1) | 0.44 ± 0.14ᶜ | 0.31 ± 0.05ᵇ | 0.20 ± 0.12ᵃ | 0.14 ± 0.12ᵃ | <0.001 | ε2 = 0.532 |
| Soil organic carbon (%) | 1.55 ± 0.75ᵃ | 2.85 ± 1.20ᵇ | 2.37 ± 0.83ᵃᵇ | 3.35 ± 1.23ᵇ | <0.001 | ε2 = 0.313 |
| Total nitrogen (%) | 0.053 ± 0.0ᵃ | 0.12 ± 0.01ᵇ | 0.087 ± 0.02ᵃᵇ | 0.19 ± 0.05ᶜ | <0.001 | ε2 = 0.544 |
| C/N ratio | 33.94 ± 3.67ᵇ | 30.72 ± 3.58ᵃ | 36.49 ± 3.46ᶜ | 28.72 ± 3.58ᵃ | <0.001 | ω2 = 0.391 |
| Calcium carbonate (CaCO3, %) | 32.02 ± 24.40ᵇ | 23.40 ± 16.28ᵇ | 47.56 ± 23.29ᶜ | 4.29 ± 6.88ᵃ | <0.001 | ω2 = 0.640 |
Table notes: Values are presented as mean ± standard deviation (n = 15 per stand-age class). Different superscript lowercase letters within each row indicate significant pairwise differences among stand-age classes according to Tukey’s HSD (parametric variables) or Dunn–Holm multiple-comparison tests (non-parametric variables) at P < 0.05. Effect sizes are reported as omega squared (ω2) for parametric analyses and epsilon squared (ε2) for non-parametric analyses. Sand, silt and clay contents are presented as measured percentages for descriptive purposes, whereas multivariate analyses were performed using isometric log-ratio (ilr) transformed particle-size data to account for the compositional nature of soil texture.
Table 3.
Soil microbial properties (0–10 cm) across the Cedrus libani afforestation chronosequence.
| Variable | Control | 10 years | 15 years | 25 years | P value | Effect size |
| Microbial biomass and activity | ||||||
| MBC (mg kg−1) | 180.46 ± 54.74ᵃ | 373.5 ± 201ᵇ | 287.9 ± 168ᵃᵇ | 535.9 ± 268ᶜ | <0.001 | ω2 = 0.470 |
| BR (µg CO2–C g−1 h−1) | 0.964 ± 0.32ᵇ | 0.358 ± 0.14ᵃ | 0.34 ± 0.097ᵃ | 0.295 ± 0.21ᵃ | <0.001 | ω2 = 0.487 |
| Microbial efficiency indicators | ||||||
| qMic (%) | 1.391 ± 0.577ᵃ | 1.257 ± 0.223ᵃ | 1.16 ± 0.36ᵃ | 1.548 ± 0.44ᵃ | 0.421(ns) | ω2 ≈ 0.000 |
| qCO2 (mg CO2–C g−1 MBC day−1) | 5.413 ± 1.178ᶜ | 1.104 ± 0.454ᵇ | 1.39 ± 0.50ᵇ | 0.541 ± 0.16ᵃ | <0.001 | ω2 = 0.865 |
Table notes: Values are presented as mean ± standard deviation (n = 15 per stand-age class). Different superscript lowercase letters within each row indicate significant pairwise differences among stand-age classes according to Tukey’s honestly significant difference (HSD) test (P < 0.05). Variables sharing at least one common superscript letter are not significantly different. The microbial quotient (qMic) did not differ significantly among stand-age classes after Benjamini–Hochberg false discovery rate (FDR) correction (P = 0.0801). Effect sizes are expressed as omega squared (ω2). Microbial biomass carbon (MBC) was determined using the chloroform fumigation–extraction method, whereas the microbial quotient (qMic = MBC/SOC) and metabolic quotient (qCO2 = BR/MBC) were calculated from measured microbial biomass, basal respiration, and SOC.
Table 4.
Multivariate differences in standardized soil physicochemical and microbial properties among stand-age classes based on PERMANOVA.
Table 4.
Multivariate differences in standardized soil physicochemical and microbial properties among stand-age classes based on PERMANOVA.
| Analysis | Source | df | Pseudo-F / F | R2 | P value | |
| PERMANOVA | Stand age | 3 | 17.38 | 0.482 | 0.0001 | |
| Residual | 56 | 0.518 | ||||
| PERMDISP | Dispersion among groups | 3 | 1.95 | 0.2198 | ||
| Pairwise PERMANOVA | ||||||
| Comparison | df1 | df2 | Pseudo-F | R2 | Raw P | Holm-adjusted P |
| Control vs 10-year | 1 | 28 | 13.49 | 0.325 | 0.0002 | 0.0012 |
| Control vs 15-year | 1 | 28 | 13.89 | 0.332 | 0.0002 | 0.0012 |
| Control vs 25-year | 1 | 28 | 30.26 | 0.519 | 0.0002 | 0.0012 |
| 10-year vs 15-year | 1 | 28 | 3.46 | 0.110 | 0.0134 | 0.0134 |
| 10-year vs 25-year | 1 | 28 | 18.71 | 0.401 | 0.0002 | 0.0012 |
| 15-year vs 25-year | 1 | 28 | 18.76 | 0.401 | 0.0002 | 0.0012S |
Table notes: PERMANOVA was based on Euclidean distances calculated from z-standardized soil physicochemical and microbial variables (n = 15 per stand-age class). EC, SOC, total N, CaCO3, microbial biomass C, and basal respiration were log10-transformed; particle-size composition was represented by two isometric log-ratio coordinates. Derived ratios (C/N, qMic, and qCO2) were excluded to avoid redundancy. Overall PERMANOVA used 9,999 permutations; PERMDISP and pairwise PERMANOVA used 4,999 permutations. Pairwise P values were adjusted using the Holm method. PERMDISP was no significant (P = 0.2198), providing no evidence of unequal within-group multivariate dispersion.
Table 5.
Partial η2 of stand age before and after adjustment for CaCO3 and pH, with covariate significance. Variables marked (log) were log-transformed.
Table 5.
Partial η2 of stand age before and after adjustment for CaCO3 and pH, with covariate significance. Variables marked (log) were log-transformed.
| Response | η2 age alone | η2 age-adjusted | Change | P adjusted | CaCO3 P |
| qCO2 (log) | 0.874 | 0.858 | −2% | < 0.001 | 0.15 |
| BR (log) | 0.592 | 0.593 | ≈ 0 | < 0.001 | 0.06 |
| AS | 0.593 | 0.593 | ≈ 0 | < 0.001 | 0.60 |
| TN (log) | 0.592 | 0.500 | −16% | < 0.001 | 0.08 |
| N stock (log) | 0.500 | 0.411 | −18% | < 0.001 | 0.58 |
| SOC (log) | 0.377 | 0.331 | −12% | < 0.001 | 0.043 |
| Cmic (log) | 0.374 | 0.262 | −30% | < 0.001 | 0.010 |
| C stock | 0.217 | 0.158 | −27% | 0.025 | 0.24 |
Table 6.
Diameter at breast height and total height by stand age, from the full inventory of 169 trees in nine 10 × 10 m subplots. Means sharing a letter do not differ by Tukey HSD test at P < 0.05.
Table 6.
Diameter at breast height and total height by stand age, from the full inventory of 169 trees in nine 10 × 10 m subplots. Means sharing a letter do not differ by Tukey HSD test at P < 0.05.
| Parameter | Stand age | n | Min. | Max. | Mean ± SE | F |
| DBH (cm) | 10 years | 60 | 3.0 | 21.0 | 9.25 ± 0.48 a | 70.88*** |
| 15 years | 61 | 2.0 | 20.0 | 8.48 ± 0.57 a | ||
| 25 years | 48 | 6.0 | 24.0 | 16.94 ± 0.53 b | ||
| TH (m) | 10 years | 60 | 1.0 | 9.0 | 5.88 ± 0.24 b | 31.03*** |
| 15 years | 61 | 0.5 | 8.0 | 4.08 ± 0.26 a | ||
| 25 years | 48 | 4.5 | 9.0 | 7.00 ± 0.19 c |
Disclaimer/Publisher’s Note: The statements, opinions and data contained in all publications are solely those of the individual author(s) and contributor(s) and not of MDPI and/or the editor(s). MDPI and/or the editor(s) disclaim responsibility for any injury to people or property resulting from any ideas, methods, instructions or products referred to in the content. |
© 2026 by the authors. Licensee MDPI, Basel, Switzerland. This article is an open access article distributed under the terms and conditions of the Creative Commons Attribution (CC BY) license.
Copyright: This open access article is published under a Creative Commons CC BY 4.0 license, which permit the free download, distribution, and reuse, provided that the author and preprint are cited in any reuse.