
Submitted:
22 August 2026
Posted:
25 August 2026
You are already at the latest version
Abstract
Coarse cereals are indispensable to both national food security and the implementation of the Healthy China Initiative, underscoring the urgent need to promote their green and lowcarbon production. Using panel data from Shanxi Province spanning 2010–2020, this study first employed water footprint (WF) and carbon footprint (CF) accounting methods, together with a coupling coordination degree (CCD) model, to characterize the spatiotemporal dynamics of WF, CF, and their CCD for six major coarse cereal crops across the province. On this basis, the entropyweighted TOPSIS model was applied to assess the spatiotemporal patterns of comprehensive production potential (CPP), while exploratory spatial data analysis (ESDA) was used to detect spatial autocorrelation. Subsequently, path analysis was conducted to identify the key determinants of CPP.
The results indicated that: (1) both total WF and CF per unit yield exhibited declining trends with pronounced spatial heterogeneity, generally higher in northern Shanxi, relatively balanced in the central region, and lower in the south. (2) the CCD between WF and CF showed a sustained upward trajectory over the study period.(3) the CPP of all selected coarse cereal crops increased significantly. and (4) effective irrigated area exerted the strongest positive effect on CPP, whereas the net application rate of agricultural chemical fertilizers and the proportion of leguminous coarse cereals imposed notable negative effects. Accordingly, we propose the following targeted strategies: expanding watersaving effective irrigated areas steadily, strictly curbing fertilizer overuse, tailoring dominant coarse cereal varieties to local agroecological conditions, and optimizing the regionspecific development of characteristic coarse cereals.
Keywords:
coarse cereals
; water-Carbon footprint
; coupling coordination
; production potential
; spatial heterogeneity
1. Introduction
Optimizing agricultural production structures and regional layouts, rationally exploiting, conserving and utilizing agricultural resources, embedding the concept of green development throughout the entire agricultural production process, and developing resource-saving and environment-friendly agriculture represent an inevitable pathway for China's agricultural transformation. In this context, evaluating the comprehensive production potential of grain crops is of great significance for advancing green and sustainable agricultural development. Shanxi Province, a traditional and dominant production base for coarse cereals in China, has in recent years issued a series of policy documents, including the Implementation Opinions on the Whole-Industrial-Chain Development of Coarse Cereals and the Regulations of Shanxi Province on the Protection and Promotion of Coarse Cereals, which provide solid policy support for the sustainable development of the coarse cereal industry.
To cope with climate change and enhance agricultural production resilience, numerous studies have investigated the water and carbon footprints of diverse crops across various regions [1,2,3,4,5,6,7]. Ababaei and Etedali [1] analyzed the components and total water footprints of wheat, barley and maize in Iran. Nayak et al. [2] quantified the water and carbon footprints of rice, wheat and maize in India. Zhang et al. [3] estimated the carbon and water footprints of rice, wheat and maize across China for 2011. Wang et al. [4] explored the water-carbon footprints of wheat, maize and rice in Northwest China and proposed multi-objective optimization strategies. Yan et al. [5] calculated the spatiotemporal evolution of blue, green and grey water footprints for ten staple crops under irrigated and rain-fed conditions at the prefecture-level city scale in Shaanxi Province, and further projected the engineering-based and real water-saving potentials. For agricultural production in Shanxi Province, Lu et al. [8], Deng et al. [9], Feng et al. [10], and Xue et al. [11] have estimated the water and carbon footprints of multiple grain crops at different spatial scales and time periods. However, most existing research has predominantly focused on staple grain crops, with limited attention paid to the water-carbon footprints and their coupling coordination for coarse cereal production.
In China, coarse cereals are generally defined as all grain crops excluding staple cereals, and potato is categorized as a coarse cereal in Shanxi Province [12]. Taking prefecture-level cities in Shanxi Province as research units, this study quantified the water footprints, carbon footprints and coupling coordination degrees of six coarse cereal crops—foxtail millet, sorghum, potato, oat, buckwheat and mung bean—during 2010–2020, characterized their spatiotemporal dynamics, calculated their comprehensive production potential, and explored its influencing factors. This work aims to provide scientific references for optimizing coarse cereal production structures and regional arrangements, advancing precision agriculture, and achieving green and sustainable development in Shanxi Province and other arid and semi-arid regions.
2. Materials and Methods
2.1. Study Area
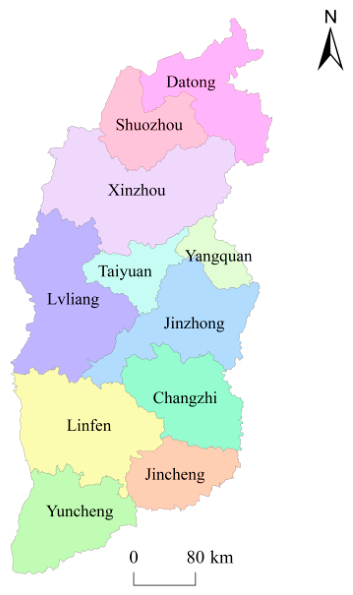
Shanxi Province is located in the middle reaches of the Yellow River Basin, covering a total land area of 15.67 × 10⁴ km² and comprising 11 prefecture-level cities, including Taiyuan and Datong. The terrain is high in the north and east, and low in the south and west, with mountains and hills accounting for 80.1% of the total land area. The region experiences a temperate semi-arid monsoon climate, characterized by four distinct seasons, synchronized rainfall and thermal conditions, and abundant solar radiation. Annual sunshine duration ranges from 2200 to 3000 h, with solar radiation of approximately 5000–6000 MJ·m⁻². The mean annual temperature varies between 4 °C and 14 °C, and the accumulated temperature ≥10 °C falls within 2000–4500 °C, making Shanxi one of the provinces with the richest solar resources in China. Mean annual precipitation ranges from 358 to 621 mm, exhibiting pronounced spatiotemporal heterogeneity, which results in prominent contradictions between water supply and demand. Consequently, Shanxi is recognized as one of the water-scarce provinces in China.
Despite these climatic and topographic constraints, coarse cereals are widely cultivated across Shanxi. The planting area of coarse cereals in the province is approximately 1.00 × 10⁶ ha, with an annual total yield of 1.40–1.60 × 10⁶ t. Notably, the yields of foxtail millet, oat, buckwheat and other coarse cereals have consistently ranked among the highest in China.
Figure 1.
Location of the study area.
2.2. Data Sources
Climate datasets were obtained from the Monthly Meteorological Dataset of China Surface Observation Stations, hosted on the National Meteorological Science Data Sharing Platform (http://data.cma.cn/). The extracted monthly variables included maximum temperature, minimum temperature, mean relative humidity, mean wind speed, precipitation, and sunshine duration.
Crop-related statistical data were collected from official statistical yearbooks and specialized databases. The acquired indicators covered the sown area and effective irrigated area of six coarse cereals (foxtail millet, mung bean, sorghum, oat, buckwheat, and potato), as well as agricultural production inputs, including chemical fertilizers, pesticides, agricultural plastic films, and diesel fuel. Missing records for certain variables were supplemented using linear interpolation methods.
Due to the limited planting scales of certain crop–city combinations, official statistics did not separately report the following: mung bean in Xinzhou City; and oat, buckwheat, and mung bean in Yangquan, Jincheng, and Yuncheng Cities. Consequently, these crop–city combinations were excluded from the spatial analysis, and the corresponding areas were denoted as no data in all GIS mapping outputs.
2.3. Methodology
2.3.1. Water Footprint Accounting Model
The water footprint concept, originally formalized by Hoekstra [13], is defined as the total volume of freshwater used to produce the goods and services consumed by an individual, community, or nation over a specified period. In the context of agricultural systems, the crop water footprint (CWF) refers to the total consumptive water use during crop growth, which is partitioned into three color-coded components: green (rainwater consumed via evapotranspiration), blue (irrigation water consumed), and grey (freshwater required to assimilate pollutants).For the six minor coarse cereals crops in Shanxi Province, the total water footprint per unit yield (, m³ kg⁻¹) was calculated as:
where , andrepresent the green, blue and grey water footprints components (m3 kg−1), respectively.
The green and blue water footprints were estimated by integrating the daily crop evapotranspiration (ETc, mm) over the entire growing season, using the CROPWAT 8.0 model (FAO, Rome) in combination with the single-crop coefficient approach recommended by FAO Irrigation and Drainage Paper No. 56 [14,15]. The computation followed these equations:
where andare the green and blue water evapotranspiration (mm), respectively; is the unit conversion factor (from mm·ha to m³); andis the crop yield per unit area (kg ha⁻¹).represents the growth period (d).
where is crop evapotranspiration (mm),and is effective precipitation (mm).
where is reference crop evapotranspiration (mm); is crop coefficient; is daily precipitation (mm).was calculated via the Penman–Monteith equation:
where is net crop surface radiation (MJ m−2 day−1); is soil heat flux (MJ m−2 day−1); is average daily air temperature at 2 m height (℃); is wind speed at 2 m height (m s−1); is saturated water vapor pressure (kPa); is actual water vapor pressure (kPa); is slope of saturated water vapor pressure curve (kPa ℃−1); is dry and wet table constants (kPa ℃−1).
Grey water footprint refers to the volume of freshwater required to dilute pollutant loads generated from agricultural production to meet permissible environmental water quality standards. The grey water footprint formula for minor grains in this study is:
whereis the leaching-runoff fraction, representing the proportion of chemical pollutants entering water bodies relative to total chemical application, set to 10% in this study [16,17,18,19,20]; is chemical fertilizer application rate per unit area (kg hm−2); is the maximum allowable pollutant concentration in water (kg m−3), with a fixed value of 0.01 adopted [19]; is natural background pollutant concentration (kg m−3), assumed to be 0 [20].
2.3.2. Carbon Footprint Accounting Model
Derived from the ecological footprint framework, carbon footprint is an emerging environmental impact assessment tool proposed to quantify greenhouse gas (GHG) emissions amid intensifying global warming [21]. Crop carbon footprint consists of direct and indirect GHG emissions. In this study, a life cycle assessment (LCA) framework was adopted to calculate the carbon footprint of six minor grains during cultivation in Shanxi Province from 2010 to 2020, and the overall calculation formula is given as follows:
(1) GHG emissions from agricultural input materials
whereis total carbon emissions from all agricultural inputs during minor grain cultivation (kg CO2-eq); denotes the application amount of the i-th agricultural input (kg); represents the corresponding CO2 emission factor for the agricultural inputs(Table 1) [22].
(2) Direct and indirect N₂O emissions from farmland
1) Direct N₂O emissions induced by nitrogen fertilizer application
(11)
where is direct N₂O emissions converted to CO₂ equivalent (kg CO₂-eq); represents pure nitrogen application rate in farmland (kg); is direct N₂O emission factor from nitrogen fertilization, set to 1%; is the ratio of the molecular weight of N2O to N2, and is the global warming potential of N2O relative to CO2 on a 100-year time scale, expressed in CO2 equivalents [23,24].
2) Indirect N₂O emissions from atmospheric nitrogen deposition and leaching-runoff loss
where and refer to indirect N₂O emissions from atmospheric nitrogen deposition and nitrogen leaching-runoff, respectively (kg CO₂-eq); is leaching-runoff fraction (default: 24%); is proportion of nitrogen loss via atmospheric deposition (default: 11%); is indirect emission factor for leaching-runoff-derived N₂O (default: 1%);and is indirect emission factor for leaching-runoff-derived N₂O (default: 1.1%) [23,24].
3) Total field N₂O emissions
(3) Area-based and yield-based carbon footprints of coarse cereals
whereis total greenhouse gas emissions generated during the production of six coarse cereals (kg CO₂-eq);is carbon footprint per unit yield (kg CO2-eq kg−1);is carbon footprint per unit area (kg CO2-eq hm−2);is total sown area of each coarse cereal (hm²); is total yield of each coarse cereal (kg).
2.3.3. Coupling Coordination Degree Model
The coupling coordination degree (CCD) quantifies the interaction and interdependency between two or more systems and serves as a core indicator for evaluating the equilibrium relationship among systems. In this study, the CCD was calculated to characterize the synergistic relationship between the water footprint (WF) and carbon footprint (CF) of the six coarse cereals. Since WF and CF have inconsistent dimensional units, standardization pretreatment was required prior to CCD calculation. The standardization formulas are specified as follows:
(1) Data standardization
where and represent standardized values of WF and CF for six coarse cereals; and are maximum and minimum WF values across all study years; and are maximum and minimum CF values across all study years; and are original raw values of WF and CF.
The CCD integrates the coupling degree and coordination degree, and is calculated using the following equations:
whereis CCD of coarse cereals, ranging from 0 to 1; is coupling degree, ranging from 0 to 1; is coordination index;andare undetermined weighting coefficients,while and are undetermined weighting coefficients for WF and CF, respectively, set as .The grading criteria for CCD are listed in Table 2 [25].
2.3.4. Temporal Trend Analysis: Mann–Kendall Test
The Mann–Kendall test is a non-parametric statistical method widely adopted for trend detection in time-series analysis of environmental variables. For a time series with observations, the test statistic is defined as:
Wheredenotes the sign function; represents the number of years;and refer to the water and carbon footprints of six minor grains in the j-th and i-th years of the time series, respectively. When , the statistic approximately follows a normal distribution with a mean of zero, and its variance is calculated as:
The standardized test statistic is then constructed as:
The statistic follows a standard normal distribution. A positive value indicates an upward trend in the time series, whereas a negative value indicates a downward trend. The trend is considered statistically significant if the absolute value of exceeds the critical value at a given confidence level (e.g., ∣Z∣≥1.28 for the 90% confidence level,∣Z∣≥1.64 for the 95% confidence level, or ∣Z∣≥2.32 for the 99% confidence level) [26,27].
2.3.5. Entropy Weight–TOPSIS Model
The entropy weight TOPSIS (Technique for Order Preference by Similarity to Ideal Solution) is a multi-criteria decision-making framework that combines the entropy weighting technique with the TOPSIS approach to solve comprehensive evaluation problems involving multiple indicators [28,29,30]. This model was employed to quantify the comprehensive production potential (CPP) of the six coarse cereals across Shanxi Province from 2010 to 2020. The calculation procedures are as follows
(1) Indicator standardization
For positive indicators (the larger the better):
For negative indicators (the smaller the better):
(2) Information entropy calculation
(3) Indicator weight determination
(4) Construction of standardized evaluation matrix
(5) Construction of weighted standardized matrix
(6) Identification of positive and negative ideal solutions
Positive ideal solution: (32)
Negative ideal solution: (33)
(7) Euclidean distance measurement
(8) Calculation of relative closeness (comprehensive evaluation index)
Where is the relative closeness of the i-th year (or city) to the ideal solution, ranging from 0 to 1. A higher value corresponds to stronger comprehensive production potential (CPP), and vice versa.A higher value of corresponds to stronger comprehensive production potential of minor grains, and vice versa.
2.3.6. Exploratory Spatial Data Analysis (ESDA)
Exploratory spatial data analysis (ESDA) is a spatial statistical tool used to identify spatial correlation and agglomeration patterns of geographical elements, consisting of Global Moran's I (global spatial autocorrelation) and Local Moran's I (local spatial autocorrelation) [31]. This study adopted ESDA to analyze the spatial distribution of the comprehensive production potential (CPP) of the six coarse cereals.
(1) Global spatial autocorrelation
Global Moran’s I was used to determine whether the CPP of coarse cereals exhibits clustered or dispersed spatial patterns across Shanxi Province. It is calculated as:
where is Global Moran’s I index; = 11, corresponding to the 11 prefecture-level cities in Shanxi Province; and are CPP values of a given coarse cereal in the i-th and j-th cities, respectively; is the mean CPP across all 11 cities;and is spatial weight matrix coefficient(defined as 1 if cities i and j share a common border, and 0 otherwise, following the queen contiguity rule).Global Moran's I ranges from −1 to 1. An I>0 indicates positive spatial autocorrelation, with values closer to 1 representing stronger clustering of similar observations. An I<0 indicates negative spatial autocorrelation, with values closer to −1 suggesting spatial dispersion of similar observations. When I approaches 0, no significant spatial autocorrelation exists, indicating a random spatial distribution. The statistical significance of I was evaluated using the pseudo-p value based on 999 permutations.
(2) Local spatial autocorrelation
Local Moran's I was applied to detect local clustering or dispersion patterns between a target prefecture-level city and its neighboring units, calculated as:
where is Local Moran’s I index; other parameters share identical definitions as above.
2.3.7. Path Analysis
Path analysis, an extension of multiple linear regression, quantifies the relationships between multiple independent variables and a dependent variable by decomposing their correlations into direct, indirect, and total effects [28]. Specifically, the direct path coefficient measures the direct effect of a given explanatory variable on the dependent variable; the indirect path coefficient captures the effect transmitted through other explanatory variables; and the total path coefficient is the sum of the direct and indirect coefficients. In this study, path analysis was employed to quantify the direct and indirect contributions of selected driving factors to the comprehensive production potential (CPP) of coarse cereals in Shanxi Province.
3. Results
3.1. Water Footprints Dynamics
3.1.1. Temporal Trends
Temporal variations in water footprints and Mann–Kendall (MK) test statistics for the six coarse cereals (foxtail millet, sorghum, potato, oat, buckwheat, and mung bean) in Shanxi Province during 2010–2020 are presented in Table 3. The total water footprints of all six coarse cereals exhibited decreasing trends over the study period. The MK Z-statistics for foxtail millet, sorghum, potato, and buckwheat were all below −2.576 (p < 0.01), indicating significant decreasing trends at the 99% confidence level. The MK Z-statistics for oat (−1.090) and mung bean (−1.868) were significant at the 95% confidence level (p < 0.05). These results suggest that the water-use efficiency of coarse cereal production in Shanxi Province gradually improved throughout the study period.
The grey water footprints of all six coarse cereals also exhibited significant decreasing trends, with MK Z-statistics below −2.576 (p < 0.01) and reduction magnitudes exceeding 60% for all crops. Among the six coarse cereals, potato exhibited the most pronounced decreasing trends in green and blue water footprints, with MK Z-statistics of −2.335 (p < 0.05) and −3.114 (p < 0.01), respectively.
The composition of the water footprints of the six coarse cereals over 2010–2020 is illustrated in Figure 2. As shown in Figure 2, the grey water footprint constituted the largest fraction of the total water footprint, followed by the blue water footprint, while the green water footprint accounted for the smallest proportion. Among the six crops, mung bean and oat had the highest green water fractions, both exceeding 34%, followed by sorghum and buckwheat (>27%). Foxtail millet and potato had the lowest green water fractions, at 23.33% and 24.11%, respectively. Regarding the blue water footprint, oat, mung bean and buckwheat displayed a higher dependence on irrigation water, followed by foxtail millet, potato and sorghum. The relatively high proportions of blue and green water footprints for oat, buckwheat and mung bean were largely associated with their relatively low unit-area yields (approximately 1000 kg·hm⁻²). In terms of the grey water footprint, foxtail millet, sorghum and potato imposed the greatest pressure on water resources from non-point source pollution, followed by buckwheat, oat and mung bean.
3.1.2. Spatial Patterns
Spatial patterns of green, blue, grey, and total water footprints for the six coarse cereals across prefecture-level cities during 2010–2020 are summarized in Table 4 and visualized in Figure 3. Overall, the green, blue and grey water footprints exhibited pronounced spatial heterogeneity and substantial interannual variability. For most crop–city combinations, the grey water footprint was higher than both the green and blue water footprints, and its interannual variability also exceeded that of the green and blue components.
Across crop types, oat presented notably higher green, blue and grey water footprints with strong interannual fluctuations in most cities, with mean values ranging from 1.323 to 2.540 m³ kg⁻¹, 1.568 to 3.877 m³ kg⁻¹, and 0.105 to 3.880 m³ kg⁻¹, respectively. In contrast, sorghum displayed consistently lower water footprints and weaker fluctuations across most cities, with mean values concentrated within 0.341–2.670 m³ kg⁻¹.
From a regional perspective, most coarse cereals in Datong, Shuozhou and Xinzhou exhibited high water footprints accompanied by strong interannual variability, whereas Jinzhong, Yangquan and Changzhi maintained relatively low values with weak fluctuations.
As shown in Figure 3, the total water footprints of the six coarse cereals displayed substantial spatial heterogeneity, following a distinct gradient of high values in northern Shanxi, low values in southern Shanxi, and intermediate values in central Shanxi.
Considerable crop-specific differences were further observed. For foxtail millet, the highest total water footprint was recorded in Xinzhou, while the lowest values were found in Jinzhong and Jincheng. For sorghum, the highest values were observed in Datong, Shuozhou and Linfen, and the lowest in Taiyuan, Jinzhong and Jincheng. Potato reached its maximum total water footprint in Datong and its minimum in Jinzhong and Changzhi. Oat showed the highest total water footprint and the largest interannual fluctuation in Taiyuan, with lower values in Jinzhong and Xinzhou. For buckwheat, Shuozhou recorded the highest total water footprint and Jinzhong the lowest. Mung bean exhibited its highest total water footprint in Lüliang and its lowest in Changzhi.
3.2. Carbon Footprints Dynamics
3.2.1. Temporal Trends
Total carbon emissions, carbon footprint per unit area (CF_area), and carbon footprint per unit yield (CF_yield) of coarse cereals in Shanxi Province during 2010–2020 are presented in Table 5, Table 6 and Table 7.
As shown in Table 5, total carbon emissions of foxtail millet, potato, oat, buckwheat and mung bean exhibited significant decreasing trends. The Mann–Kendall (MK) Z-statistics for foxtail millet, potato and oat were all below −2.576 (p < 0.01), indicating significance at the 99% confidence level. The MK Z-statistics for buckwheat and mung bean were both −2.180 (p < 0.05), reaching significance at the 95% confidence level. In contrast, sorghum showed a non-significant decreasing trend (Z = −0.623, p > 0.05).
Table 6 reveals that the CF_area of all six coarse cereals decreased significantly, with MK Z-statistics below −2.576 (p < 0.01) and reduction rates exceeding 45% for all crops. As shown in Table 7, the CF_yield of the six coarse cereals also exhibited pronounced decreasing trends, with all MK Z-statistics below −2.576 (p < 0.01) and reduction magnitudes greater than 65% for all varieties. Collectively, these results indicate that coarse cereal production in Shanxi Province achieved a relative decoupling of carbon emissions from yield growth over the study period.
3.2.2. Spatial Patterns
Spatial variations in total carbon emissions, carbon footprint per unit area (CF_area), and carbon footprint per unit yield (CF_yield) of coarse cereal production across prefecture-level cities during 2010–2020 are shown in Table 8 and visualized in Figure 4. Overall, pronounced spatial heterogeneity was observed in the annual mean values and interannual fluctuations of total carbon emissions and CF_area for the six coarse cereals.
Across crop types, potato exhibited notably higher mean values of total carbon emissions and CF_area with large standard deviations in most cities, followed by sorghum, foxtail millet and oat. In contrast, buckwheat and mung bean displayed consistently lower mean values of total carbon emissions and CF_area across most cities, accompanied by generally modest standard deviations.
At the regional scale, Datong, Shuozhou and Xinzhou maintained high levels of total carbon emissions and CF_area for coarse cereal production with pronounced interannual fluctuations. In contrast, Yangquan and Yuncheng exhibited low total carbon emissions and CF_area, together with weak interannual variability.
As shown in Figure 4, the CF_yield of the six coarse cereals displayed notable spatial heterogeneity, following a distinct gradient of high values in northern Shanxi, low values in southern Shanxi, and intermediate values in central Shanxi. Specifically, high CF_yield values were observed for foxtail millet, sorghum and potato in Datong City, as well as for sorghum, buckwheat and mung bean in Linfen City. By contrast, low CF_yield values were found for foxtail millet and potato in Yangquan City, and for sorghum, potato and buckwheat in Jinzhong City.
3.3. Coupling Coordination Degree Dynamics
3.3.1. Temporal Trends
The coupling degree (CD) and coupling coordination degree (CCD) between water footprint and carbon footprint of coarse cereals in Shanxi Province from 2010 to 2020 are summarized in Table 9 and Table 10, respectively.
Overall, the CD between the water footprint (WF) and carbon footprint (CF) systems of coarse cereals in Shanxi remained at the running-in and benign coupling stages throughout the study period, with most values ranging from 0.500 to 1.000. This indicates favorable interactive relationships between the WF and CF systems for coarse cereal production in Shanxi.
From 2010 to 2016, the CD values of the six coarse cereals exhibited phased fluctuations, with relatively low values observed in certain years. During 2017–2020, however, the CD values of all six crops stabilized above 0.900. As shown in Table 10, the CCD between WF and CF for coarse cereals in Shanxi exhibited a persistent upward trend across the study period. In 2010, all six coarse cereals were at the low coupling coordination stage, with CCD values ranging from 0.1 to 0.3. By 2020, the CCD values of all six crops had exceeded 0.900, reaching the excellent coupling coordination level, indicating continuous improvement in the coordination status of the WF and CF systems over time.
The upward trends in CCD for all six coarse cereals were statistically significant, with MK Z-statistics exceeding 2.576 (p < 0.01). Among them, potato exhibited the most pronounced increasing trend, with the highest MK Z-statistic of 4.048.
3.3.2. Spatial Patterns
The coupling degree (CD) and coupling coordination degree (CCD) between water footprint and carbon footprint of coarse cereal production across prefecture-level cities during 2010–2020 are presented in Table 11 and visualized in Figure 5.
Overall, most coarse cereals in individual cities remained at the benign coupling stage, with CD values above 0.800, indicating strong interactive relationships between the WF and CF systems for the majority of coarse cereal crops in these cities.
At the city level, all six coarse cereals in Taiyuan, Datong, Xinzhou, Jinzhong and Changzhi exhibited benign coupling with CD values exceeding 0.800. In contrast, buckwheat in Shuozhou, mung bean in Lüliang, and both buckwheat and mung bean in Linfen fell into the antagonistic coupling stage, with CD values ranging from 0.000 to 0.400. This discrepancy may be associated with divergent cultivation and management practices across cities.
Across crop types, foxtail millet, sorghum, potato and oat maintained high CD values above 0.800, consistently falling within the benign coupling stage across most cities.
As shown in Figure 5, pronounced spatial heterogeneity was detected in the CCD of the six coarse cereals. For foxtail millet, only Xinzhou exhibited low coordination, whereas all other cities showed high or excellent coordination. For sorghum, Xinzhou and Linfen were classified as low-coordination regions, while the remaining cities achieved high or excellent coordination. Except for Datong, which remained at the low coordination level, potato exhibited high or excellent coordination in all other cities. Oat displayed relatively balanced CCD values, generally staying at the medium–high coordination level. Buckwheat exhibited a spatial pattern of lower values in northern and southern cities and higher values in central cities: Taiyuan, Xinzhou and Jinzhong reached excellent coordination; Shuozhou and Linfen fell into low coordination; and the remaining cities were at medium or high coordination levels. For mung bean, Jinzhong and Changzhi achieved excellent coordination; Datong, Shuozhou and Taiyuan exhibited high coordination; and Lüliang and Linfen showed low coordination.
3.4. Comprehensive Productive Potential Dynamics
3.4.1. Temporal Trends
As shown in Table 12, the comprehensive production potential (CPP) of foxtail millet, sorghum, oat, buckwheat, potato, and mung bean exhibited significant increasing trends. The Mann–Kendall (MK) Z-statistics for all six crops exceeded 2.576 (p < 0.01), satisfying the significance test at the 99% confidence level. Among these crops, potato exhibited the fastest increase in CPP, with the highest MK Z-statistic of 4.048.
In 2010, the CPP values of the six coarse cereals were relatively low, ranging from 0.000 to 0.295. By 2020, the CPP of all six crops had reached their peak values, all exceeding 0.900. Over the entire study period, the annual mean CPP of each crop surpassed 0.500, with relatively small gaps among the six crops. Ranked in descending order of mean CPP, the six crops followed the sequence: foxtail millet > buckwheat > oat > sorghum > potato > mung bean.
3.4.2. Spatial Patterns
As shown in Figure 6, the comprehensive production potential (CPP) of different coarse cereals exhibited pronounced spatial heterogeneity across Shanxi Province. High CPP values were concentrated in central and eastern Shanxi, whereas low values were observed in northern and southern Shanxi, as well as in western Shanxi.
Specifically, extremely high CPP zones for foxtail millet included Shuozhou, Yangquan, Jinzhong, Changzhi and Jincheng, while Lüliang and Taiyuan represented high CPP zones. For sorghum, Taiyuan, Jinzhong, Changzhi and Jincheng were classified as extremely high CPP areas, with high CPP zones in Xinzhou, Yangquan and Lüliang. Extremely high CPP zones for potato were identified in Yangquan, Jinzhong, Changzhi, Jincheng and Yuncheng, while high CPP zones covered Shuozhou and Xinzhou. Oat and buckwheat exhibited prominent production advantages in Xinzhou and Jinzhong. Mung bean showed extremely high CPP in Jinzhong and Changzhi, with high CPP zones distributed in Datong, Shuozhou and Taiyuan.
Spatial correlation tests were further performed, with results summarized in Table 13 and Table 14. Foxtail millet, sorghum, potato, oat and mung bean yielded p-values greater than 0.05, indicating no significant global spatial autocorrelation for these crops. In contrast, buckwheat showed a p-value below 0.05 with a positive global Moran's I coefficient, revealing significant positive spatial autocorrelation.
Considering that global spatial autocorrelation was not significant for the other five crops, we restricted the local spatial autocorrelation analysis to buckwheat. For buckwheat, significant local clustering (p < 0.05) was detected in Taiyuan, Xinzhou, Jinzhong, Jincheng and Yuncheng, with positive local Moran's I indices indicating the presence of high-high or low-low agglomeration. Yangquan exhibited a negative local Moran's I index (p < 0.05), indicating pronounced spatial heterogeneity. The remaining prefecture-level cities showed non-significant local spatial association.
3.5. Analysis of Influencing Factors on Comprehensive Productive Potential
The comprehensive production potential (CPP) of coarse cereals is influenced by climate conditions, agronomic management, and cropping systems. To identify the drivers underlying spatial variations in CPP across Shanxi Province, six explanatory variables were selected for path analysis: mean minimum temperature (X₁), annual precipitation (X₂), net application rate of agricultural chemical fertilizers (X₃), effective irrigated area (X₄), proportion of leguminous coarse cereals (X₅), and sowing proportion of coarse cereals (X₆).
Prior to path analysis, normality tests were conducted for the dependent variable Y (CPP), with outputs presented in Table 15. The Shapiro–Wilk statistic for Y yielded a significance value of 0.475 (p > 0.05), indicating that CPP followed a normal distribution and satisfied the preconditions for path analysis.
Path analysis was subsequently performed, and the results are summarized in Table 16. In terms of direct path coefficients, annual precipitation (X₂), effective irrigated area (X₄), and sowing proportion of coarse cereals (X₆) exerted positive effects on CPP, whereas mean minimum temperature (X₁), net application rate of agricultural chemical fertilizers (X₃), and proportion of leguminous coarse cereals (X₅) showed negative effects.
Regarding total effects, effective irrigated area contributed the largest positive total effect, with a coefficient of 0.888. The net application rate of agricultural chemical fertilizers and the proportion of leguminous coarse cereals imposed notable negative total effects.
Overall, the influencing factors ranked by the magnitude of their total effects on CPP in descending order were: effective irrigated area (0.888) > sowing proportion of coarse cereals > net application rate of agricultural chemical fertilizers > proportion of leguminous coarse cereals > mean minimum temperature > annual precipitation.
4. Discussion
First, this study demonstrates that coupling water and carbon footprint analyses can provide more targeted guidance for regional agricultural structure adjustment and production optimization. Overall, the total, area-scaled, and yield-scaled water and carbon footprints of coarse cereals in Shanxi Province exhibited steady decreasing trends, which are broadly consistent with previous findings [29,30]. Zhang [30] reported that foxtail millet and soybean in Shanxi are high-water-consuming crops. Feng et al. [31] revealed that the total water footprint of major grain crops in Shanxi declined from 2005 to 2014. Liu et al. [32] demonstrated a year-by-year reduction in the carbon footprint of coarse cereals across Shanxi. These conclusions are in good agreement with our results. Regarding water-footprint composition, the grey water footprint accounted for the largest proportion, followed by the blue water footprint, while the green water footprint constituted the smallest share, further supporting the robustness of our calculations. Collectively, these findings suggest that the enhancement of agricultural infrastructure—such as the expansion of water-saving irrigation systems—and the widespread adoption of improved agronomic practices, including soil-testing and formula-based fertilization, have yielded tangible benefits over the past decade.
Second, regarding the regional performance of coarse cereal production, northern Shanxi including Datong, Shuozhou and Xinzhou, presented relatively high water and carbon footprints, resulting in an overall spatial pattern of high values in the north and low values in the south. This pattern is consistent with the climatic gradient, as temperature and precipitation gradually increase from north to south across Shanxi. Nevertheless, Deng et al. [9] identified a north-low and south-high spatial pattern for the total water footprint of grain crops, which differs from our results. This discrepancy is primarily attributable to the differences in research subjects: Deng et al. [9] focused on irrigated wheat and maize, whose water consumption is dominated by blue water (irrigation). In southern Shanxi, these staple crops have large planting areas and high total yields, leading to substantial total water consumption and thus a north-low-south-high pattern. In contrast, our study targets coarse cereals that largely rely on green water (precipitation), resulting in a north-high-south-low pattern. Both findings are consistent with the respective production realities in Shanxi.
Third, from a water-carbon coupling perspective, the coupling coordination degree (CCD) between water and carbon footprints of coarse cereals in Shanxi increased steadily over the study period, with southern and central Shanxi outperforming northern Shanxi in spatial performance. Compared with independent analyses of crop water or carbon footprints, this study fills a research gap by providing empirical analysis on the coupling coordination of water-carbon footprints for coarse cereals. Traditional studies typically employ progressive correction models to estimate crop production potential based on biophysical drivers such as light, temperature, water, and soil conditions [33,34,35]. By contrast, we applied the entropy-weighted TOPSIS model using water footprint, carbon footprint, and their CCD as inputs. Our coupling analysis reveals that, given stable coarse cereal output, lower water and carbon footprints coupled with higher CCD correspond to greater comprehensive production potential (CPP). Among the various production factors, rational utilization of temperature and precipitation, appropriate fertilizer application, and improved irrigation efficiency can effectively enhance the CPP of coarse cereals.
Furthermore, comprehensive evaluation of regional agricultural systems from multi-dimensional perspectives has become a prevailing trend and a future research frontier. Although coupled water-carbon footprint analysis can effectively inform agricultural practices [5,6], growing attention has been paid to the economic, ecological, and social benefits of agriculture. Integrating ecological, economic, and social indicators could better support the sustainable development of agriculture and agri-food systems [7,8,36].
Admittedly, several limitations remain in this study. First, the crop parameters embedded in the CROPWAT software are calibrated at the global scale and may not fully adapt to local production conditions in Shanxi. Second, the calculation formulas for water and carbon footprints are based on standardized farmland assumptions, which may deviate from field realities and introduce biases into the final outputs. Third, data completeness and the study time span present constraints. Specifically, data gaps for some niche coarse cereal varieties partially undermine analytical accuracy, while the relatively short study period (11 years) limits the capacity to robustly identify long-term trends and driving factors. Future studies should incorporate longer time series and, where possible, complement the footprint-based approach with field-measured data to improve estimation accuracy.
5. Conclusions
This study integrated multiple methods to investigate the comprehensive production potential (CPP) and its influencing factors of coarse cereals in Shanxi Province for the period 2010–2020. The main conclusions are summarized as follows:
(1) The total, area-scaled, and yield-scaled water and carbon footprints of coarse cereals in Shanxi decreased from 2010 to 2020. Considerable spatial disparities in total water and carbon footprints existed across prefecture-level cities. Nevertheless, an overall spatial pattern of high values in the north, low values in the south, and intermediate values in central Shanxi was observed. The effectiveness of low-water-carbon production for regional coarse cereals continuously increased over the study period.
(2) Both the coupling degree (CD) and coupling coordination degree (CCD) between water and carbon footprints of coarse cereals in Shanxi exhibited upward trends, with pronounced spatial heterogeneity in CCD. Based on the mean CPP values, the six coarse cereals were ranked in descending order as: foxtail millet > buckwheat > oat > sorghum > potato > mung bean.
(3) Annual precipitation, effective irrigated area, and sowing proportion of coarse cereals were positively correlated with the CPP of the six coarse cereals in Shanxi. In contrast, the net application rate of agricultural chemical fertilizers and the proportion of leguminous coarse cereals showed negative correlations. Overall, the factors affecting CPP were ranked by total effect magnitude in descending order: effective irrigated area > sowing proportion of coarse cereals > net application rate of agricultural chemical fertilizers > proportion of leguminous coarse cereals > mean minimum temperature > annual precipitation.
(4) To enhance the CPP of coarse cereals, future strategies should prioritize the optimization of spatial layout to fully exploit natural resource endowments, the improvement of water-conservancy infrastructure and irrigation efficiency, and the promotion of sustainable fertilization practices, including soil-testing-based formula fertilization and the substitution of chemical fertilizers with organic alternatives.
Author Contributions
Wenyu Song (First Author ) conceptualized the study, designed the methodology, performed the investigation and formal analysis, wrote the original draft, and reviewed and edited the manuscript. She is a Master's student at the School of Management Science and Engineering, Guizhou University of Finance and Economics, specializing in rural development. She can be contacted at: 2735476124@qq.com. Prof. Long Liang (Corresponding Author) contributed to the supervision of the research and provided critical revisions to the manuscript. He is a Professor at the School of Management Science and Engineering, Guizhou University of Finance and Economics, specializing in pan-ecology and sustainable development. E-mail: txws0109@126.com.
Acknowledgments
This work was supported by the Guizhou Provincial Science and Technology Program under Grant No. Qiankehejichu-ZK[2023]Yiban032 (Project: "Peak Carbon Emissions and Carbon Neutrality Potential of Characteristic Agricultural Industries in Guizhou"), the National College Students' Innovation and Entrepreneurship Training Program under Grant No. 2024106710157S (Project: "New Endeavors in Jiuzhou: Digital Courtyards Empowered by New Quality Productive Forces to Drive High-Quality Development of Emerging Rural Industries"), and the Guizhou Provincial Graduate Research Fund Project under Grant No. 2025YJSKYJJ233. The authors gratefully acknowledge the financial support from these funding agencies. The funders had no role in the study design, data collection and analysis, decision to publish, or preparation of the manuscript.
References
- Ababaei B, Etedali H R. Water footprint assessment of main cereals in Iran[J]. Agricultural Water Management, 2017, 179: 401-411. [CrossRef]
- Nayak A K, Tripathi R, Debnath M, et al.Carbon and water footprints of major crop production in India[J]. Pedosphere, 2023, 33(3): 448-462. [CrossRef]
- Zhang G , Wang X K , Zhang L, et al. Carbon and water footprints of major cereal crops production in China[J]. Journal of Cleaner Production, 2018, 194: 613-623. [CrossRef]
- Wang C F, Niu J. Water and carbon footprints of major grain crops and planting layout optimization in Northwest China[J]. Scientia Agricultura Sinica, 2024, 57(6): 1137-1152.
- Yan C J, Li M, Zhuola, et al. Spatiotemporal evolution of crop production water footprint and evaluation of water-saving potential in Shaanxi Province during 1989—2019[J]. Resources Science, 2023, 45(1): 158-173.
- Holka M,Bieńkowski J.Carbon Footprint and Life-Cycle Costs of Maize Production in Conventional and Non-Inversion Tillage Systems[J].Agronomy,2020,12(10):1877-1877.
- Hai J X, Li Y B, Lin Y M, et al. Spatiotemporal evolution and driving mechanism of regional agricultural carbon footprint toward the "dual carbon" goals: An empirical analysis based on typical crops in Xinjiang[J/OL]. Journal of Ecology and Rural Environment, 1-17[2026-05-18]. [CrossRef]
- Lu X L, Li Y Q, Guo Q X, et al. Optimization of crop planting structure in different hydrological years under economic-water footprint-carbon sink objectives: A case study of Heshun County, Shanxi Province[J]. Acta Ecologica Sinica, 2025, 45(13): 6194-6206.
- Deng X Z, Wang W X, Li Z H. Spatiotemporal characteristics of water footprint of grain production and evaluation of water resources utilization in Shanxi Province[J]. Yellow River, 2023, 45(9): 52-57+76.
- Feng B B, Liu X F, Zhao Y G, et al. Study on water footprint of main grain crops production in Shanxi Province[J]. Journal of Arid Land Resources and Environment, 2018, 32(3): 133-137.
- Xue J F, Li H, Gao Z Q, et al. Dynamic changes and composition analysis of wheat carbon footprint in Shanxi Province from 2004 to 2013 based on life cycle assessment[J]. Journal of China Agricultural University, 2017, 22(10): 15-25.
- Wang N, Zhao X Q. Spatiotemporal changes and competitiveness analysis of minor grain crops production in Shanxi Province[J]. Chinese Journal of Agricultural Resources and Regional Planning, 2025, 46(10): 36-46.
- Hoekstra A Y. Water Footprint Assessment: Evolvement of a New Research Field[J]. Water Resources Management. 2017, 31(10): 3061-3081. [CrossRef]
- Han S L, Zhang P F, Lu Y, et al. Optimization and adjustment of crop planting structure in Guizhou based on water-energy-food nexus[J]. Chinese Journal of Agrometeorology, 2024, 45(12): 1426-1437.
- Jiang J Y, Liu J M, Zhang S Y. Study on water footprint and water use efficiency of cereal production in Huaihe River Basin[J]. Journal of Agricultural Resources and Environment, 2024, 41(2): 371-382.
- Fan X, Chen B. Spatiotemporal characteristics and influencing factors of water footprint for grain crop production in Sanjiang Plain[J]. Acta Ecologica Sinica, 2022, 42(15): 6368-6380.
- Geng N, Han X B. Dynamic evolution and driving effects of carbon footprint of grain production in China[J/OL]. Environmental Science, 1-22[2026-05-23]. [CrossRef]
- Han X Y, Han X, Li T L, et al. Provincial carbon footprint accounting and emission reduction strategies of potato production in China based on life cycle assessment[J]. Chinese Journal of Agricultural Resources and Regional Planning, 2024, 45(1): 11-19.
- IPCC. Refinement to the 2006 IPCC guidelines for national greenhouse gas inventories Volume 4 Agriculture,Forestry and Other Land Use[Z].2019.
- Liu J L, Li Y C, Zong S X, et al. Carbon footprint analysis and emission reduction paths of typical hawthorn and cherry producing areas in China[J]. Journal of Beijing Forestry University, 2026, 48(1): 155-165.
- Yue J, Dai X Y. Coupling mechanism and coordination effect of regional cultural heritage and tourism development: An empirical analysis based on Beijing-Tianjin-Hebei region[J]. Economic Geography, 2024, 44(1): 230-240.
- Jia L B, Wu W H, Yuan G H. Evaluation and early warning of marine ecological environment carrying capacity in China's coastal waters based on Mann-Kendall test[J]. Ecological Economy, 2019, 35(2): 208-214.
- Li Y, Zhang R, Gu Q, et al. Water consumption analysis of major grain crops in five central provinces from the perspective of water footprint[J]. Yellow River, 2020, 42(12): 56-60.
- Qiu D. Systematic analysis of synthesis methods in multi-index comprehensive evaluation[J]. Research on Financial and Economic Issues, 1991, (6): 39-42.
- Kailiman Paerhati, Muhabaiti Pareti, Chen Y Z. Evaluation of agricultural production guarantee level and obstacle factors in major grain-producing areas of China based on entropy weight-TOPSIS method[J]. Journal of Chinese Agricultural Mechanization, 2026, 47(4): 268-275.
- Zhou M C, Li J. Measurement, regional differences and influencing factors of rural cultural revitalization level[J/OL]. Statistics & Decision, 2026, (8): 40-46[2026-05-10]. [CrossRef]
- Wang Z F, Sun C B, Luo S W, et al. Spatiotemporal distribution and equity of bed resources at county scale in Xizang based on exploratory spatial data analysis[J]. Modern Preventive Medicine, 2023, 50(1): 127-133.
- Han Y P, Jia D D, Huang H P, et al. Water footprint and influencing factors of winter wheat in Haihe River Basin based on path analysis[J]. Water Resources Protection, 2019, 35(1): 6-13.
- Guo X P, Gao S, Wu M Y, et al. Spatiotemporal distribution and influencing factors analysis of crop water footprint in China[J]. Transactions of the Chinese Society for Agricultural Machinery, 2018, 49(5): 295-302.
- Zhang P F, Xiao M L, Zhang Z R, et al. Optimization and adjustment of agricultural planting structure in Shanxi Province based on water-energy-food nexus[J]. Water Saving Irrigation, 2023, (1): 55-63+70.
- Feng B B, Liu X F, Zhao Y G, et al. Accounting of blue and green water footprints of crop production and analysis of its influencing factors in Shanxi Province[J]. Research of Soil and Water Conservation, 2018, 25(4): 200-205+214.
- Liu Y F, Yuan Z H, Guo L X, et al. Carbon footprint of crop production in China and its spatial distribution characteristics[J]. Chinese Journal of Applied Ecology, 2017, 28(8): 2577-2587.
- Wang M X, Gesangzhuoma, Pan Z F, et al. Production potential of major crops on the Qinghai-Xizang Plateau and its influencing factors[J]. Chinese Journal of Applied and Environmental Biology, 2024, 30(6): 1133-1141.
- Luo H P, Zou N, Hu X Y, et al. Climatic production potential and climate resource utilization efficiency of major grain crops in China's main grain-producing areas from 1980 to 2019[J]. Resources Science, 2021, 43(6): 1234-1247.
- Ren J Q, Guo C M, Liu Y X, et al. Spatiotemporal variation of land production potential of spring maize and its relationship with climatic factors in Jilin Province[J]. Chinese Journal of Soil Science, 2017, 48(2): 270-277.
- Chrisendo D , Heikonen S , Piipponen J ,et al.A systematic review of sustainable food systems identifies socio-economic pathways driving food systems transformations[J].Nature Food, 2026, 7(3):234-246. [CrossRef]
Figure 2.
Water footprint and composition of coarse cereals in Shanxi Province.
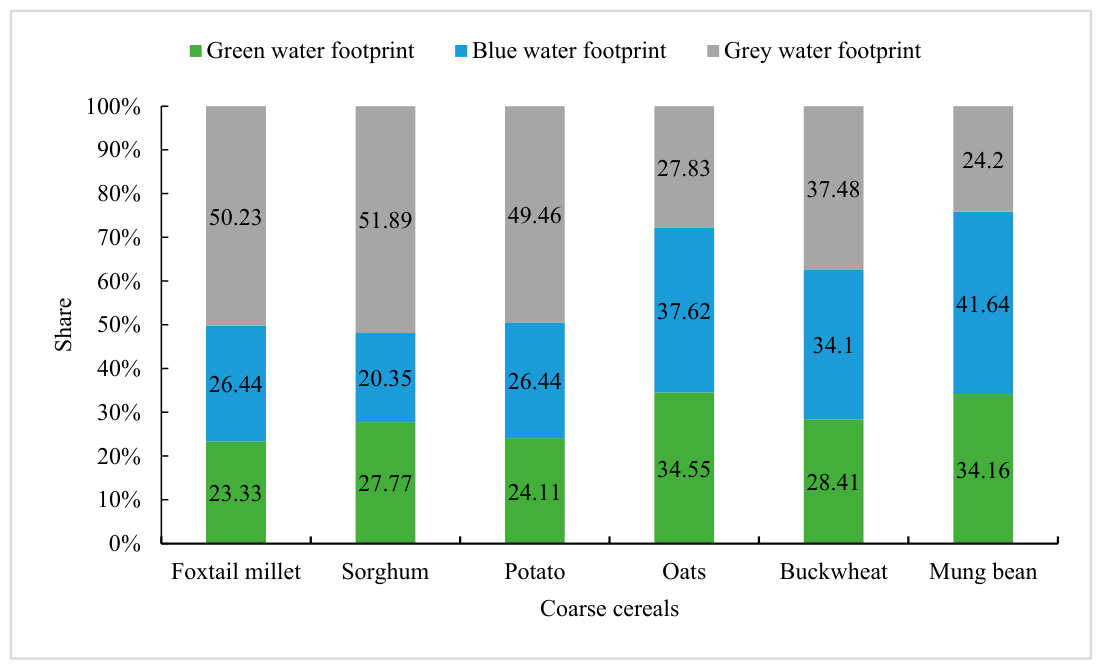
Figure 3.
Spatial distribution of total water footprint of coarse cereals production in Shanxi Province from 2010 to 2020.
Figure 3.
Spatial distribution of total water footprint of coarse cereals production in Shanxi Province from 2010 to 2020.
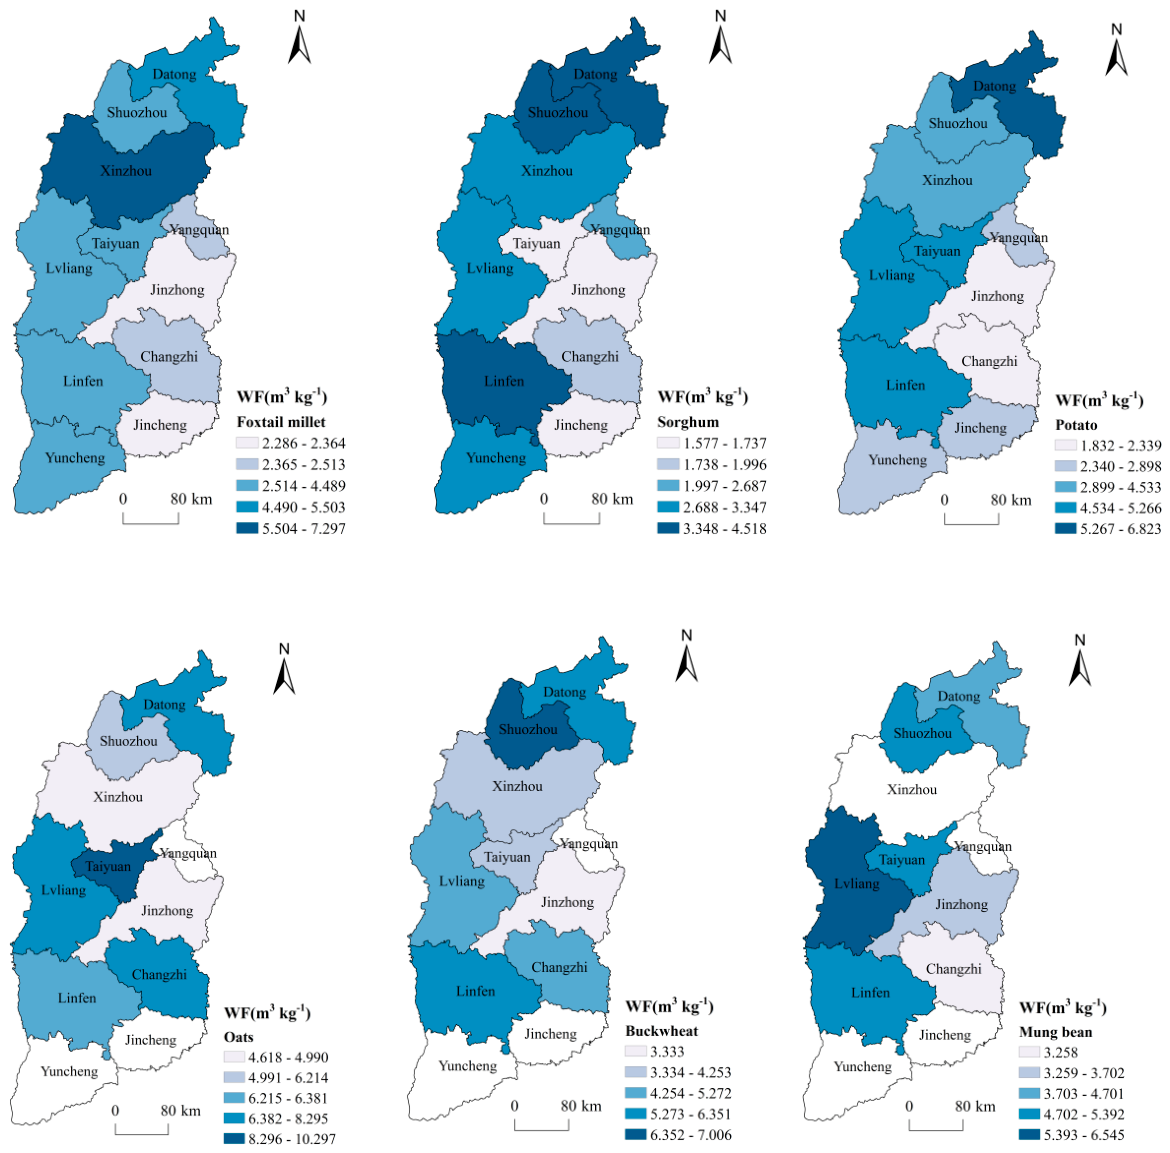
Figure 4.
Spatial distribution of carbon footprint per unit yield of coarse cereals production in Shanxi Province from 2010 to 2020.
Figure 4.
Spatial distribution of carbon footprint per unit yield of coarse cereals production in Shanxi Province from 2010 to 2020.
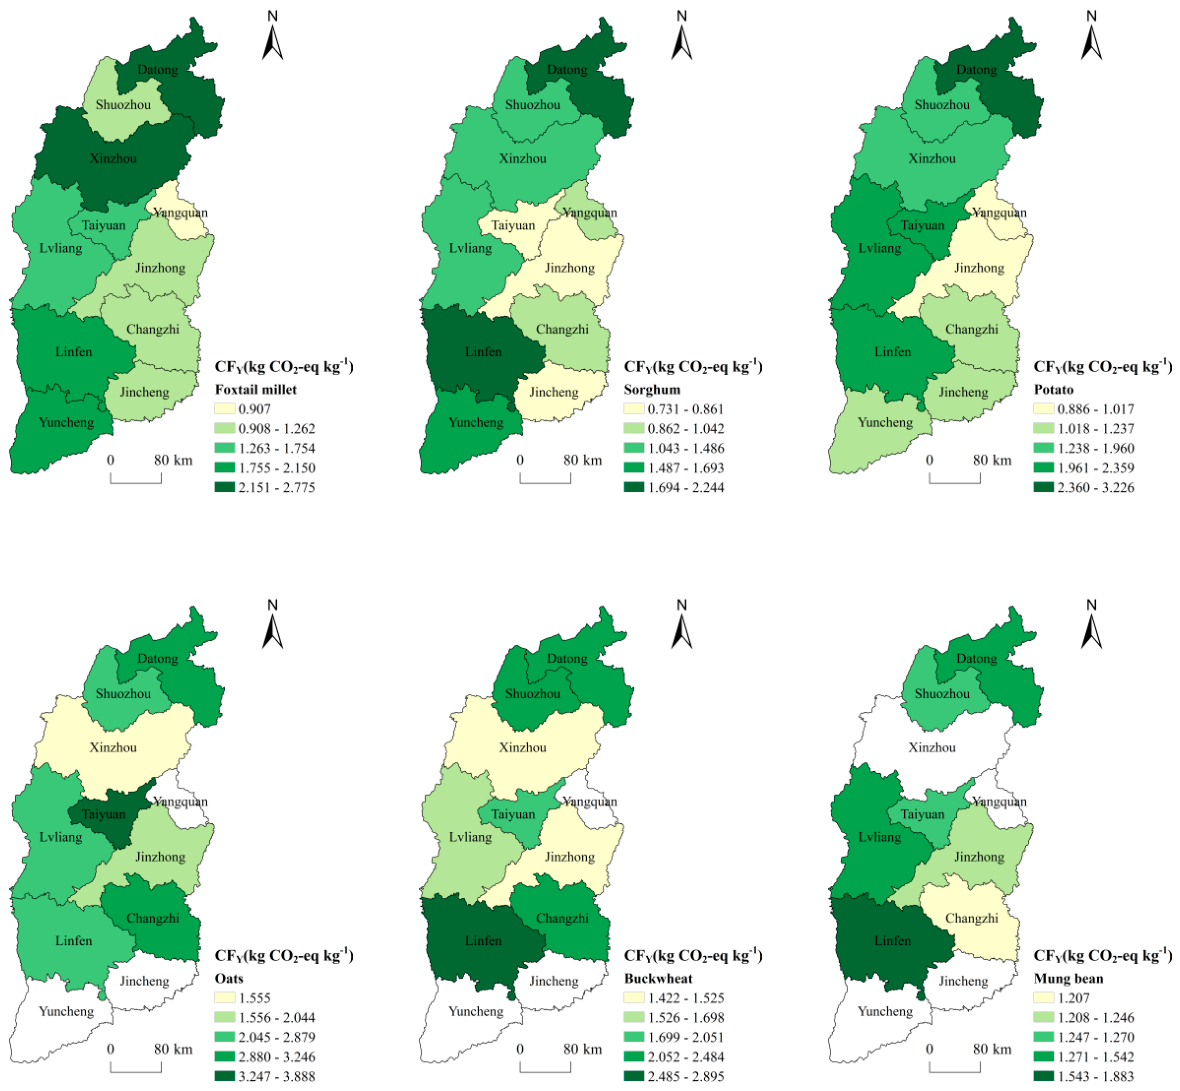
Figure 5.
Spatial distribution of coupling coordination degree of coarse cereals production in Shanxi Province from 2010 to 2020.
Figure 5.
Spatial distribution of coupling coordination degree of coarse cereals production in Shanxi Province from 2010 to 2020.
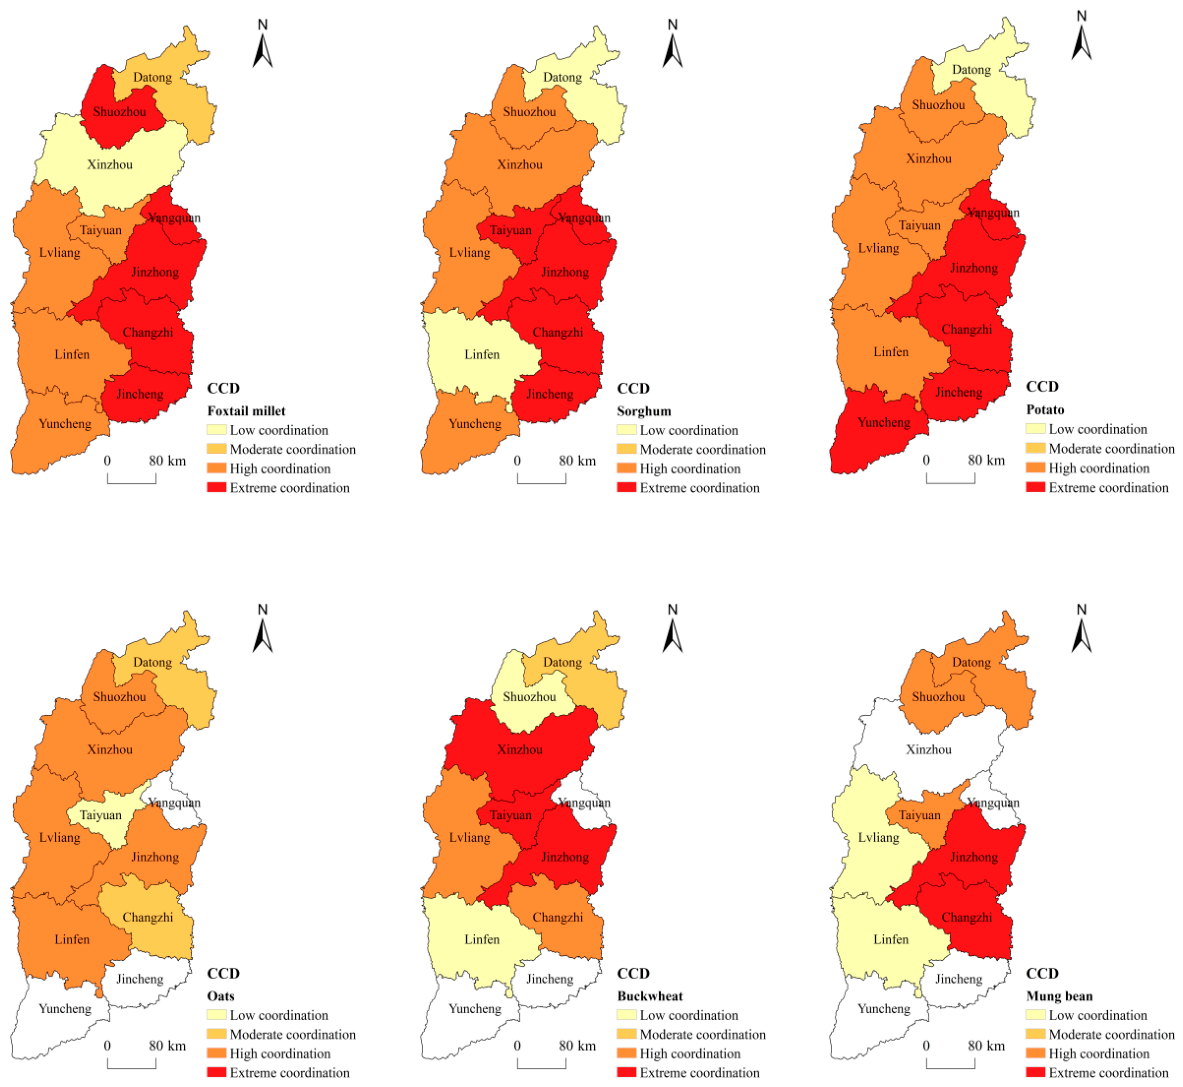
Figure 6.
Spatial distribution of comprehensive production potential of coarse cereals in Shanxi Province from 2010 to 2020.
Figure 6.
Spatial distribution of comprehensive production potential of coarse cereals in Shanxi Province from 2010 to 2020.
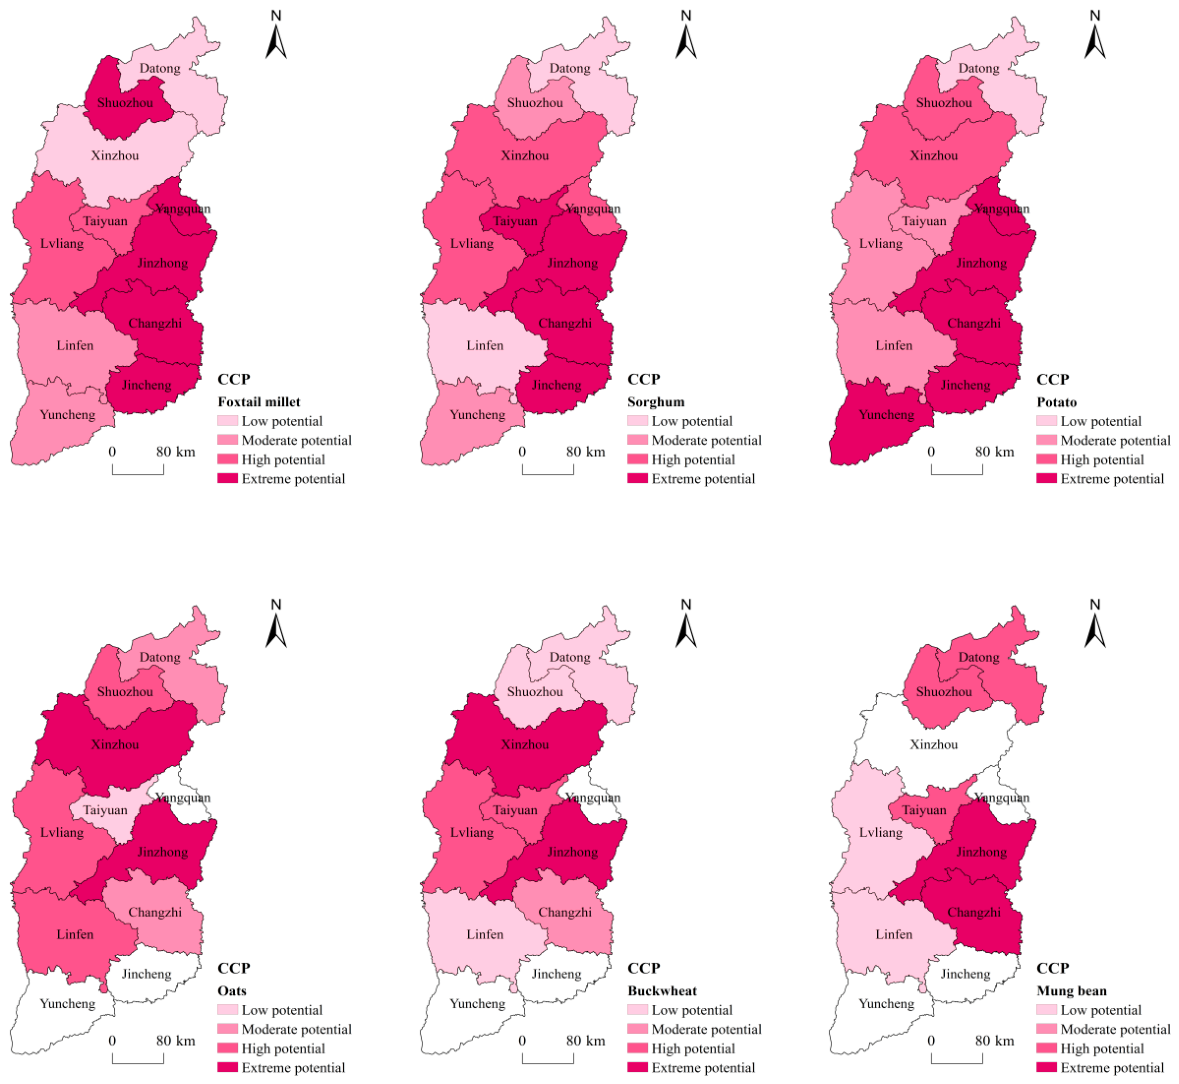

Table 1.
Carbon emission factor for agricultural inputs.
| Agricultural inputs | Emission factors | Data sources |
| Nitrogen fertilizer | 1.53 kg co2-eq kg-1 | CLCD |
| Phosphate fertilizer | 1.63 kg co2-eq kg-1 | CLCD |
| Potash fertilizer | 0.65 kg co2-eq kg-1 | CLCD |
| Compound fertilizer | 1.77 kg co2-eq kg-1 | CLCD |
| Agricultural plastic film | 5.18 kg co2-eq kg-1 | IREEA |
| Pesticides | 4.9341 kg co2-eq kg-1 | ORNL |
| Agricultural diesel fuel | 0.5927 kg co2-eq kg-1 | IPCC |
| Farmland irrigation | 20.476 kg co2-eq kg-1 | Li et al. |
Table 2.
Classification of coupling coordination degrees.
| Coupling degree | Types of coupling degree | Coupling coordination degree | Types of coupling coordination degree |
| [0.0,0.3] | Malignant coupling stage | [0.0,0.3] | Low coupling coordination |
| (0.3,0.5] | Antagonistic coupling stage | (0.3,0.5] | Moderate coupling coordination |
| (0.5,0.8] | Run-in coupling stage | (0.5,0.8] | High coupling coordination |
| (0.8,1.0] | Benign coupling stage | (0.8,1.0] | Extreme coupling coordination |
Table 3.
Temporal trends and MK test results of total water footprint of coarse cereals production in Shanxi Province from 2010 to 2020.
Table 3.
Temporal trends and MK test results of total water footprint of coarse cereals production in Shanxi Province from 2010 to 2020.
| Crop types | Total water footprint(m3 kg-1) | |||||
| 2010 | 2012 | 2015 | 2018 | 2020 | Mann-Kendall test value | |
| Foxtail millet | 4.655 | 4.064 | 3.690 | 2.193 | 2.154 | -3.425*** |
| Sorghum | 3.228 | 2.751 | 2.804 | 1.960 | 1.783 | -3.581*** |
| Potato | 7.139 | 6.052 | 4.930 | 1.597 | 0.927 | -3.892*** |
| Oats | 5.777 | 5.728 | 7.219 | 4.661 | 4.118 | -1.090 |
| Buckwheat | 7.321 | 6.529 | 6.837 | 3.974 | 4.049 | -3.114*** |
| Mung bean | 5.514 | 4.770 | 6.310 | 3.991 | 3.505 | -1.868** |
Table 4.
Green, blue and grey water footprints of coarse cereals production in prefectural cities of Shanxi Province from 2010 to 2020 (m³ kg-1).
Table 4.
Green, blue and grey water footprints of coarse cereals production in prefectural cities of Shanxi Province from 2010 to 2020 (m³ kg-1).
| Area | Crop types | Green water footprint | Blue water footprint | Grey water footprint |
| Taiyuan City | Foxtail millet | 0.940±0.241 | 1.095±0.356 | 1.768±0.599 |
| Sorghum | 0.477±0.134 | 0.341±0.101 | 0.760±0.144 | |
| Potato | 1.245±0.534 | 1.341±0.673 | 2.236±1.138 | |
| Oats | 2.540±1.789 | 3.877±6.120 | 3.880±5.107 | |
| Buckwheat | 1.234±0.272 | 1.486±0.649 | 1.533±0.627 | |
| Mung bean | 1.681±0.454 | 2.310±1.196 | 1.062±0.492 | |
| Datong City | Foxtail millet | 1.114±0.402 | 1.342±0.521 | 3.047±1.852 |
| Sorghum | 1.019±0.293 | 0.873±0.560 | 2.553±1.655 | |
| Potato | 1.426±0.617 | 1.655±0.908 | 3.742±2.492 | |
| Oats | 2.198±0.433 | 2.561±0.623 | 3.536±1.225 | |
| Buckwheat | 1.673±0.593 | 2.022±0.649 | 2.656±1.105 | |
| Mung bean | 1.473±0.266 | 2.017±0.369 | 1.211±0.455 | |
| Shuozhou City | Foxtail millet | 0.874±0.209 | 1.109±0.571 | 1.431±1.009 |
| Sorghum | 1.226±0.568 | 0.990±0.745 | 1.795±1.331 | |
| Potato | 1.174±0.449 | 1.324±0.782 | 1.799±1.256 | |
| Oats | 2.949±1.663 | 3.159±1.464 | 0.105±0.068 | |
| Buckwheat | 2.180±0.699 | 2.581±0.882 | 2.245±1.359 | |
| Mung bean | 1.910±1.498 | 2.424±1.654 | 0.860±0.720 | |
| Xinzhou City | Foxtail millet | 1.791±2.259 | 1.882±1.912 | 3.624±4.680 |
| Sorghum | 0.875±0.282 | 0.725±0.569 | 1.603±1.292 | |
| Potato | 1.142±0.448 | 1.250±0.771 | 2.140±1.476 | |
| Oats | 1.459±0.421 | 1.585±0.349 | 1.573±0.491 | |
| Buckwheat | 1.219±0.465 | 1.428±0.404 | 1.340±0.682 | |
| Mung bean | - | - | - | |
| Yangquan City |
Foxtail millet | 0.751±0.148 | 0.823±0.245 | 0.939±0.539 |
| Sorghum | 0.990±0.470 | 0.644±0.365 | 1.053±0.596 | |
| Potato | 0.907±0.305 | 0.879±0.362 | 1.111±0.724 | |
| Oats | - | - | - | |
| Buckwheat | - | - | - | |
| Mung bean | - | - | - | |
| Lvliang City | Foxtail millet | 0.938±0.400 | 1.161±0.380 | 1.951±1.004 |
| Sorghum | 0.874±0.321 | 0.733±0.342 | 1.696±1.000 | |
| Potato | 1.274±0.558 | 1.494±0.629 | 2.498±1.312 | |
| Oats | 2.142±0.550 | 2.515±0.664 | 2.901±1.395 | |
| Buckwheat | 1.496±0.833 | 1.858±0.799 | 1.903±0.940 | |
| Mung bean | 2.157±0.932 | 2.941±0.931 | 1.447±0.753 | |
| Jinzhong City | Foxtail millet | 0.537±0.108 | 0.644±0.204 | 1.183±0.281 |
| Sorghum | 0.483±0.164 | 0.349±0.133 | 0.905±0.185 | |
| Potato | 0.420±0.293 | 0.463±0.340 | 0.948±0.710 | |
| Oats | 1.323±0.380 | 1.620±1.025 | 2.047±1.180 | |
| Buckwheat | 0.889±0.255 | 1.100±0.495 | 1.345±0.670 | |
| Mung bean | 1.209±0.320 | 1.629±0.374 | 0.863±0.231 | |
| Changzhi City | Foxtail millet | 0.583±0.163 | 0.582±0.260 | 1.312±0.441 |
| Sorghum | 0.520±0.128 | 0.347±0.208 | 1.129±0.516 | |
| Potato | 0.524±0.267 | 0.543±0.319 | 1.272±0.859 | |
| Oats | 2.053±0.950 | 1.887±0.805 | 3.332±2.212 | |
| Buckwheat | 1.446±0.634 | 1.418±0.668 | 2.408±1.549 | |
| Mung bean | 1.077±0.324 | 1.285±0.501 | 0.896±0.488 | |
| Jincheng City | Foxtail millet | 0.642±0.226 | 0.436±0.249 | 1.209±0.546 |
| Sorghum | 0.500±0.132 | 0.263±0.194 | 0.953±0.481 | |
| Potato | 0.812±0.495 | 0.592±0.264 | 1.339±0.420 | |
| Oats | - | - | - | |
| Buckwheat | - | - | - | |
| Mung bean | - | - | - | |
| Linfen City | Foxtail millet | 0.999±0.391 | 0.897±0.532 | 2.593±1.367 |
| Sorghum | 1.199±0.450 | 0.649±0.410 | 2.670±1.385 | |
| Potato | 1.111±0.325 | 1.009±0.527 | 2.641±1.473 | |
| Oats | 1.738±0.913 | 1.568±1.226 | 3.083±2.545 | |
| Buckwheat | 1.565±0.910 | 1.558±1.451 | 3.055±2.645 | |
| Mung bean | 2.032±1.077 | 1.867±0.567 | 1.494±0.699 | |
| Yuncheng City | Foxtail millet | 1.040±0.294 | 0.815±0.567 | 2.491±1.068 |
| Sorghum | 0.883±0.296 | 0.491±0.295 | 1.973±0.782 | |
| Potato | 0.672±0.318 | 0.599±0.289 | 1.571±0.796 | |
| Oats | - | - | - | |
| Buckwheat | - | - | - | |
| Mung bean | - | - | - |
Table 5.
Total carbon emissions and MK test results coarse cereals production in Shanxi Province from 2010 to 2020.
Table 5.
Total carbon emissions and MK test results coarse cereals production in Shanxi Province from 2010 to 2020.
| Year | Total carbon emissions(108kg) | |||||
| Foxtail millet | Sorghum | Potato | Oats | Buckwheat | Mung bean | |
| 2010 | 7.838 | 1.652 | 9.338 | 2.114 | 0.443 | 0.898 |
| 2011 | 7.635 | 1.381 | 9.112 | 1.831 | 0.410 | 0.737 |
| 2012 | 7.266 | 1.272 | 8.476 | 1.761 | 0.402 | 0.733 |
| 2013 | 7.602 | 1.314 | 8.730 | 1.810 | 0.427 | 0.983 |
| 2014 | 6.786 | 1.196 | 7.521 | 1.627 | 0.365 | 1.101 |
| 2015 | 6.199 | 0.784 | 6.479 | 1.463 | 0.334 | 1.049 |
| 2016 | 5.878 | 0.767 | 6.894 | 1.441 | 0.335 | 0.770 |
| 2017 | 5.375 | 0.753 | 6.346 | 1.315 | 0.314 | 0.692 |
| 2018 | 4.698 | 0.965 | 5.171 | 1.174 | 0.385 | 0.544 |
| 2019 | 4.461 | 1.715 | 4.699 | 1.051 | 0.352 | 0.484 |
| 2020 | 3.954 | 1.904 | 3.902 | 0.874 | 0.345 | 0.241 |
| Mann-Kendall test value | -4.048*** | -0.623 | -3.892*** | -4.048*** | -2.180** | -2.180** |
Table 6.
Carbon footprint per unit area and MK test results of coarse cereals production in Shanxi Province from 2010 to 2020.
Table 6.
Carbon footprint per unit area and MK test results of coarse cereals production in Shanxi Province from 2010 to 2020.
| Year | Carbon footprint per unit area(103kg co2-eq hm-2) | |||||
| Foxtail millet | Sorghum | Potato | Oats | Buckwheat | Mung bean | |
| 2010 | 4.014 | 5.089 | 5.740 | 3.551 | 2.708 | 1.996 |
| 2011 | 3.939 | 4.983 | 5.616 | 3.488 | 2.670 | 1.972 |
| 2012 | 3.779 | 4.767 | 5.368 | 3.351 | 2.576 | 1.913 |
| 2013 | 3.941 | 4.971 | 5.605 | 3.497 | 2.689 | 1.998 |
| 2014 | 3.458 | 4.342 | 4.896 | 3.077 | 2.383 | 1.794 |
| 2015 | 3.045 | 3.804 | 4.290 | 2.719 | 2.124 | 1.618 |
| 2016 | 300.1 | 3.743 | 4.221 | 2.681 | 2.099 | 1.600 |
| 2017 | 2.699 | 3.351 | 3.775 | 2.418 | 1.906 | 1.466 |
| 2018 | 2.375 | 2.929 | 3.293 | 2.136 | 1.702 | 1.327 |
| 2019 | 2.109 | 2.580 | 2.894 | 1.906 | 1.536 | 1.217 |
| 2020 | 1.795 | 2.173 | 2.428 | 1.632 | 1.335 | 1.079 |
| Mann-Kendall test value | -3.892*** | -4.048*** | -4.048*** | -3.892*** | -3.892*** | -3.737*** |
Table 7.
Carbon footprint per unit yield and MK test results of coarse cereals production in Shanxi Province from 2010 to 2020.
Table 7.
Carbon footprint per unit yield and MK test results of coarse cereals production in Shanxi Province from 2010 to 2020.
| Crop types | Carbon footprint per unit yield(kg co2-eq kg-1) | |||||
| Foxtail millet | Sorghum | Potato | Oats | Buckwheat | Mung bean | |
| 2010 | 4.055 | 3.262 | 4.610 | 6.953 | 5.038 | 2.138 |
| 2011 | 3.089 | 2.722 | 3.860 | 6.125 | 4.828 | 1.799 |
| 2012 | 2.891 | 2.207 | 3.475 | 4.961 | 3.907 | 1.630 |
| 2013 | 2.546 | 2.046 | 3.194 | 4.662 | 3.983 | 2.531 |
| 2014 | 1.921 | 1.754 | 2.590 | 3.949 | 3.042 | 2.118 |
| 2015 | 1.952 | 1.527 | 2.403 | 3.551 | 1.963 | 2.056 |
| 2016 | 1.554 | 1.356 | 1.861 | 2.528 | 1.765 | 1.673 |
| 2017 | 1.292 | 1.141 | 1.553 | 2.155 | 1.571 | 1.472 |
| 2018 | 0.994 | 0.836 | 1.141 | 1.676 | 1.240 | 1.209 |
| 2019 | 0.883 | 0.738 | 0.891 | 1.347 | 1.034 | 0.988 |
| 2020 | 0.729 | 0.599 | 0.725 | 1.079 | 0.861 | 0.688 |
| Mann-Kendall test value | -4.048*** | -4.204*** | -4.204*** | -4.204*** | -4.048*** | -2.958*** |
Table 8.
Total carbon emissions and carbon footprint per unit area of coarse cereals production in prefectural cities of Shanxi Province from 2010 to 2020.
Table 8.
Total carbon emissions and carbon footprint per unit area of coarse cereals production in prefectural cities of Shanxi Province from 2010 to 2020.
| Area | Crop types | Total carbon emissions | Carbon footprint per unit area |
| Taiyuan City | Foxmail millet | 20.475±2.749 | 3.002±0.457 |
| Sorghum | 9.869±9.159 | 3.711±0.606 | |
| Potato | 27.667±4.757 | 4.129±0.691 | |
| Oats | 1.529±0.579 | 2.690±0.391 | |
| Buckwheat | 2.908±0.491 | 2.137±0.276 | |
| Mung bean | 0.406±0.151 | 1.627±0.175 | |
| Datong City | Foxmail millet | 68.577±12.102 | 3.484±0.940 |
| Sorghum | 21.031±13.570 | 4.403±1.224 | |
| Potato | 128.120±48.196 | 4.917±1.375 | |
| Oats | 31.277±3.788 | 3.074±0.813 | |
| Buckwheat | 16.063±4.810 | 2.361±0.592 | |
| Mung bean | 17.028±8.641 | 1.668±0.382 | |
| Shuozhou City | Foxmail millet | 17.777±4.485 | 2.197±0.739 |
| Sorghum | 7.841±2.553 | 2.740±0.971 | |
| Potato | 87.765±46.638 | 3.080±1.117 | |
| Oats | 39.797±9.965 | 1.964±0.642 | |
| Buckwheat | 12.318±2.790 | 1.636±0.459 | |
| Mung bean | 4.794±1.272 | 1.181±0.320 | |
| Xinzhou City | Foxmail millet | 118.429±18.377 | 2.685±0.735 |
| Sorghum | 10.821±5.692 | 3.369±0.975 | |
| Potato | 172.872±52.626 | 3.773±1.112 | |
| Oats | 41.990±18.548 | 2.391±0.633 | |
| Buckwheat | 1.498±0.691 | 1.854±0.444 | |
| Mung bean | - | - | |
| Yangquan City |
Foxmail millet | 8.612±3.490 | 2.006±0.783 |
| Sorghum | 0.101±0.085 | 2.483±1.034 | |
| Potato | 5.028±2.215 | 2.753±1.168 | |
| Oats | - | - | |
| Buckwheat | - | - | |
| Mung bean | - | - | |
| Lvliang City | Foxmail millet | 115.001±46.399 | 2.755±1.149 |
| Sorghum | 26.150±9.182 | 3.500±1.489 | |
| Potato | 166.479±76.595 | 3.910±1.658 | |
| Oats | 5.682±3.522 | 2.416±0.988 | |
| Buckwheat | 2.254±2.079 | 1.840±0.728 | |
| Mung bean | 3.956±2.173 | 1.246±0.423 | |
| Jinzhong City | Foxmail millet | 46.002±7.036 | 3.348±0.536 |
| Sorghum | 12.358±4.250 | 4.171±0.707 | |
| Potato | 29.230±8.711 | 4.662±0.807 | |
| Oats | 0.674±0.309 | 2.991±0.462 | |
| Buckwheat | 3.023±0.960 | 2.524±0.358 | |
| Mung bean | 0.774±0.298 | 1.789±0.216 | |
| Changzhi City | Foxmail millet | 54.411±16.202 | 3.864±1.291 |
| Sorghum | 8.451±1.966 | 4.829±1.686 | |
| Potato | 52.529±22.695 | 5.422±1.902 | |
| Oats | 1.008±0.417 | 3.442±1.117 | |
| Buckwheat | 0.563±0.467 | 2.687±0.810 | |
| Mung bean | 0.099±0.075 | 2.009±0.525 | |
| Jincheng City | Foxmail millet | 30.641±9.796 | 3.557±1.420 |
| Sorghum | 1.686±0.806 | 4.476±1.852 | |
| Potato | 11.287±7.421 | 4.993±2.086 | |
| Oats | - | - | |
| Buckwheat | - | - | |
| Mung bean | - | - | |
| Linfen City | Foxmail millet | 55.553±21.105 | 3.622±1.110 |
| Sorghum | 10.602±8.049 | 4.557±1.446 | |
| Potato | 33.934±12.427 | 5.098±1.630 | |
| Oats | 1.103±0.676 | 3.210±0.962 | |
| Buckwheat | 1.874±1.659 | 2.480±0.700 | |
| Mung bean | 12.885±6.707 | 1.810±0.465 | |
| Yuncheng City | Foxmail millet | 7.225±1.489 | 4.085±0.582 |
| Sorghum | 8.485±5.711 | 5.129±0.762 | |
| Potato | 1.790±0.307 | 5.792±0.860 | |
| Oats | - | - | |
| Buckwheat | - | - | |
| Mung bean | - | - |
Table 9.
Coupling degree of water and carbon footprints and MK test results of coarse cereals production in Shanxi Province from 2010 to 2020.
Table 9.
Coupling degree of water and carbon footprints and MK test results of coarse cereals production in Shanxi Province from 2010 to 2020.
| Year | Coupling degree | |||||
| Foxtail millet | Sorghum | Potato | Oats | Buckwheat | Mung bean | |
| 2010 | 1.000 | 1.000 | 1.000 | 0.290 | 1.000 | 0.991 |
| 2011 | 1.000 | 0.986 | 0.938 | 0.828 | 0.914 | 0.999 |
| 2012 | 0.982 | 0.996 | 0.971 | 0.987 | 0.998 | 0.998 |
| 2013 | 0.579 | 0.469 | 0.917 | 0.998 | 0.975 | 0.311 |
| 2014 | 1.000 | 0.970 | 0.971 | 0.994 | 1.000 | 0.994 |
| 2015 | 0.971 | 0.929 | 0.974 | 0.262 | 0.754 | 0.376 |
| 2016 | 1.000 | 0.986 | 0.998 | 0.228 | 1.000 | 0.996 |
| 2017 | 1.000 | 0.989 | 0.997 | 0.995 | 0.995 | 1.000 |
| 2018 | 0.999 | 1.000 | 1.000 | 0.999 | 0.999 | 0.998 |
| 2019 | 1.000 | 1.000 | 0.993 | 1.000 | 1.000 | 1.000 |
| 2020 | 1.000 | 1.000 | 1.000 | 1.000 | 1.000 | 1.000 |
| Mann-Kendall test value | 0.455 | 1.204 | 1.737** | 2.108** | 0.985 | 1.737** |
Table 10.
Coupling coordination degree and MK test results of coarse cereals production in Shanxi Province from 2010 to 2020.
Table 10.
Coupling coordination degree and MK test results of coarse cereals production in Shanxi Province from 2010 to 2020.
| Year | Coupling coordination degree | |||||
| Foxtail millet | Sorghum | Potato | Oats | Buckwheat | Mung bean | |
| 2010 | 0.100 | 0.100 | 0.100 | 0.260 | 0.100 | 0.501 |
| 2011 | 0.536 | 0.497 | 0.373 | 0.529 | 0.302 | 0.643 |
| 2012 | 0.540 | 0.604 | 0.482 | 0.634 | 0.508 | 0.720 |
| 2013 | 0.381 | 0.337 | 0.490 | 0.644 | 0.568 | 0.250 |
| 2014 | 0.798 | 0.664 | 0.638 | 0.676 | 0.699 | 0.453 |
| 2015 | 0.703 | 0.663 | 0.671 | 0.278 | 0.577 | 0.226 |
| 2016 | 0.856 | 0.776 | 0.811 | 0.294 | 0.882 | 0.651 |
| 2017 | 0.907 | 0.826 | 0.850 | 0.855 | 0.865 | 0.758 |
| 2018 | 0.971 | 0.941 | 0.941 | 0.919 | 0.972 | 0.874 |
| 2019 | 0.974 | 0.964 | 0.917 | 0.984 | 0.984 | 0.906 |
| 2020 | 0.995 | 0.995 | 0.995 | 0.990 | 0.989 | 0.995 |
| Mann-Kendall test value | 3.737*** | 3.737*** | 4.048*** | 2.958*** | 3.892*** | 2.335*** |
Table 11.
Coupling degree of coarse cereals production in prefectural cities of Shanxi Province from 2010 to 2020.
Table 11.
Coupling degree of coarse cereals production in prefectural cities of Shanxi Province from 2010 to 2020.
| Area | Coupling degree | |||||
| Foxtail millet | Sorghum | Potato | Oats | Buckwheat | Mung bean | |
| Taiyuan City | 0.993 | 1.000 | 0.997 | 1.000 | 0.991 | 0.944 |
| Datong City | 0.970 | 0.991 | 1.000 | 0.999 | 0.977 | 0.995 |
| Shuozhou City | 0.999 | 0.881 | 0.999 | 0.979 | 0.344 | 0.929 |
| Xinzhou City | 1.000 | 0.997 | 0.997 | 0.999 | 0.994 | - |
| Yangquan City | 1.000 | 0.990 | 0.996 | - | - | - |
| Lvliang City | 0.914 | 0.990 | 0.978 | 0.990 | 0.966 | 0.276 |
| Jinzhong City | 0.978 | 1.000 | 1.000 | 0.999 | 0.999 | 0.999 |
| Changzhi City | 0.846 | 0.966 | 0.969 | 0.989 | 0.952 | 0.966 |
| Jincheng City | 0.998 | 1.000 | 1.000 | - | - | - |
| Linfen City | 0.969 | 1.000 | 0.999 | 0.986 | 0.399 | 0.327 |
| Yuncheng City | 0.973 | 0.999 | 0.999 | - | - | - |
Table 12.
Comprehensive production potential and MK test resuls of coarse cereals in Shanxi Province from 2010 to 2020.
Table 12.
Comprehensive production potential and MK test resuls of coarse cereals in Shanxi Province from 2010 to 2020.
| Year | Foxtail millet | Sorghum | Potato | Oats | Buckwheat | Mung bean |
| 2010 | 0.000 | 0.000 | 0.000 | 0.223 | 0.000 | 0.295 |
| 2011 | 0.320 | 0.301 | 0.165 | 0.382 | 0.129 | 0.464 |
| 2012 | 0.312 | 0.386 | 0.255 | 0.466 | 0.291 | 0.566 |
| 2013 | 0.226 | 0.214 | 0.267 | 0.472 | 0.370 | 0.190 |
| 2014 | 0.662 | 0.441 | 0.416 | 0.508 | 0.519 | 0.243 |
| 2015 | 0.488 | 0.433 | 0.456 | 0.221 | 0.454 | 0.135 |
| 2016 | 0.748 | 0.589 | 0.664 | 0.275 | 0.796 | 0.478 |
| 2017 | 0.839 | 0.663 | 0.721 | 0.761 | 0.761 | 0.620 |
| 2018 | 0.960 | 0.892 | 0.899 | 0.867 | 0.944 | 0.793 |
| 2019 | 0.961 | 0.937 | 0.810 | 0.979 | 0.974 | 0.849 |
| 2020 | 1.000 | 1.000 | 1.000 | 0.989 | 0.985 | 1.000 |
| Mann-Kendall test value | 3.581*** | 3.737*** | 4.048*** | 2.803*** | 3.892*** | 2.335*** |
| annual average value | 0.592 | 0.532 | 0.514 | 0.560 | 0.566 | 0.512 |
Table 13.
Global Moran's I.
| Crop types | Foxtail millet | Sorghum | Potato | Oats | Buckwheat | Mung bean |
| Moran’sI | -0.160 | 0.038 | 0.097 | -0.109 | 0.194 | -0.057 |
| P | 0.362 | 0.208 | 0.124 | 0.478 | 0.042 | 0.401 |
Table 14.
Local Moran's I of buckwheat.
| Area | Moran’sI | P |
| Taiyuan City | 0.554 | 0.010 |
| Datong City | 0.029 | 0.191 |
| Shuozhou City | -0.392 | 0.081 |
| Xinzhou City | 0.286 | 0.027 |
| Yangquan City | -0.742 | 0.023 |
| Lvliang City | 0.170 | 0.117 |
| Jinzhong City | 0.546 | 0.041 |
| Changzhi City | -0.014 | 0.223 |
| Jincheng City | 0.549 | 0.044 |
| Linfen City | 0.038 | 0.187 |
| Yuncheng City | 0.921 | 0.040 |
Table 15.
Normality test for comprehensive production potential of coarse cereals.
| Statistic | df | Sig. |
| 0.936 | 11 | 0.475 |
Table 16.
Path analysis of influencing factors of coarse cereals production in Shanxi Province.
| Influencing factors | Direct path coefficient | Indirect path coefficient | Total influence | |||||
| X1 | X2 | X3 | X4 | X5 | X6 | |||
| X1 | -0.011 | -0.046 | 0.077 | -0.093 | 0.125 | 0.076 | 0.148 | |
| X2 | 0.049 | -0.005 | -0.034 | 0.101 | 0.013 | -0.019 | 0.136 | |
| X3 | -0.124 | 0.007 | 0.013 | -0.185 | -0.128 | -0.149 | -0.615 | |
| X4 | 0.480 | 0.002 | 0.010 | 0.048 | 0.027 | 0.128 | 0.888 | |
| X5 | -0.174 | 0.008 | -0.004 | -0.091 | -0.074 | -0.119 | -0.523 | |
| X6 | 0.198 | -0.004 | -0.005 | 0.094 | 0.312 | 0.104 | 0.778 | |
Disclaimer/Publisher’s Note: The statements, opinions and data contained in all publications are solely those of the individual author(s) and contributor(s) and not of MDPI and/or the editor(s). MDPI and/or the editor(s) disclaim responsibility for any injury to people or property resulting from any ideas, methods, instructions or products referred to in the content. |
© 2026 by the authors. Licensee MDPI, Basel, Switzerland. This article is an open access article distributed under the terms and conditions of the Creative Commons Attribution (CC BY) license (http://creativecommons.org/licenses/by/4.0/).
Copyright: This open access article is published under a Creative Commons CC BY 4.0 license, which permit the free download, distribution, and reuse, provided that the author and preprint are cited in any reuse.