
Submitted:
22 August 2026
Posted:
24 August 2026
You are already at the latest version
Abstract
The north-eastern hilly region of Bangladesh is characterized by subtropical evergreen hilly forests, haors, tea estates, and nationally designated protected areas, and is undergoing rapid land-use transformation. This study analyzes spatiotemporal changes in land use and land cover (LULC) in Moulvibazar and Habiganj districts of Bangladesh over three decades (1994-2024) using Landsat imagery and supervised Maximum Likelihood Classification in QGIS and predicts future LULC for 2054 using the Cellular Automata-Artificial Neural Network (CA-ANN) model in the MOLUSCE (Modules for Land Use Change Evaluation) plugin. Five major land cover classes were examined: croplands, water bodies, forests, tea gardens, and settlements. Croplands declined substantially from 379,716.66 ha (72.07%) in 1994 to 303,873.97 ha (57.68%) in 2024, a net loss of 14.40%. Tea gardens nearly doubled, expanding from 28,523.84 ha (5.41%) in 1994 to 69,600.19 ha (13.21%) in 2024. Forests initially declined by 1.33% between 1994 and 2004; however, then subsequently recovered, with a net gain of 4.46% by 2024. Settlement areas expanded from 17,103.54 ha (3.25%) to 26,795.58 ha (5.09%), indicating ongoing urbanization. NDVI indicates improved vegetation health, while the NDWI indicates surface water fluctuation. The projections indicate continued tea garden and settlement expansion alongside further cropland and forest cover decline, emphasizing the need for sustainable cropland management and long-term forest management to ensure ecological sustainability in this region.
Keywords:
land use and land cover
; remote sensing
; GIS
; prediction modeling
; vegetation indices
; hilly ecosystem
1. Introduction
Land use and land cover (LULC) are thought to have a significant impact on global change because they constantly shift and interact with changes in biodiversity, biogeochemical cycles, climatic systems, and ecological processes [1,2]. Increasing anthropogenic activities and the global need for food and bioenergy directly drive LULC, creating large-scale modifications to Earth's land surface that influence the environment, ecosystems, and biodiversity [3,4,5]. Over the past 50 years, wetlands, forests, agricultural lands, arable lands, and developed lands have all undergone significant changes due to urban and commercial development, and the rapid advancement of industrial and agricultural activities worldwide [6]. To understand the fundamental causes and environmental implications of global LULC changes, precise information is required.
In the 20th and 21st centuries, the worldwide all types of forest cover loss has unfortunately become irreversible, and Bangladesh is no exception [7]. According to Global Forest Watch (2024) [8], Bangladesh's natural forests covered 1.82 million hectares in 2020, or more than 13% of its total area, significantly below the officially reported forest cover objective of 17.5%. Bangladesh has experienced significant changes in LULC and experienced a significant deforestation rate of 0.3- 2% per year over the last 30 years, resulting in a high level of degraded forest cover across the country [9]. Hill forest or mountainous terrain covers around 12% of Bangladesh's area [10]. In recent years, Bangladesh's forests are severely threatened by several natural and anthropogenic factors. In 2020, it lost 17.7 thousand hectares of natural forest, equivalent to 9.68 million tons of CO2 emissions [8].
The northeastern hilly region of Bangladesh, encompassing the northern and eastern fringe of the Sylhet Division, is consistently significant, as it hosts the majority of the nation's tea gardens, a wetland of global significance, and subtropical moist forests [11]. The peoples of Bangladesh's northeastern hilly regions depend heavily on both forests and agricultural land. Overexploitation is reducing Sylhet forest resources at an alarming rate [12], similar to other regions of the nation. The northeastern districts of Sylhet Division, both Moulvibazar and Habiganj, are home to many nationally designated protected areas, wildlife sanctuaries, and Ecologically Critical Areas (ECAs), making them important places for biodiversity conservation. Moulvibazar district's natural forest covered 74.9 kilo hectare (kha) in 2020, accounting for more than 28% of the total land area, and 270 ha of natural forest were lost, and Habiganj district's natural forest covered 25.1 kha in 2020, or more than 9.7% of its total land area [8]. In 2024, it lost 167 hectares of natural forest, equivalent to 61.3 kt of CO₂ emissions [8]. Understanding the patterns, rates, and trends in land cover change is essential for sustainability, conservation, management evaluation, and forest dynamics. Thus, monitoring changes in land use and land cover has become a crucial element for managing natural resources and tracking environmental changes.
Geographic Information Systems (GIS) and remote sensing are effective methods for deriving precise, timely data on the spatial distribution of land cover and land-use changes over large areas at local, regional, and global levels [14,15]. The long-term, spatially explicit assessment of forest and land cover change at medium spatial resolution (10-50 m) was made possible by over five decades of Landsat observations [15]. Multispectral data from sensors such as the Thematic Mapper (TM) on Landsat 5 and the Operational Land Imager (OLI) on Landsat 8 and 9 can be used to classify forest, agricultural, settlement, waterbody, and fallow land cover classes in different ecological zones [16]. Thematic LULC maps and estimates of forest loss have been derived using supervised classification algorithms, such as Maximum Likelihood Classification (MLC), and have proven to be accurate in tropical and subtropical landscapes [18,19]. These spatial and spectral analytical approaches enable a comprehensive assessment of LULC dynamics and forest cover loss.
Most research conducted in Bangladesh has concentrated on the Sundarbans mangrove ecosystem, the Chittagong Hill Tracts, and coastal areas, and rapidly urbanizing regions. Comparatively limited attention has been given to subtropical hilly forests in the Sylhet region. This study evaluated long-term (1994-2024) land use and land cover (LULC) changes using supervised classification and the Likelihood classification algorithm, along with their primary drivers, by integrating multitemporal Landsat data with vegetation and water indices (NDVI and NDWI) and a CA-ANN-based future simulation framework. To date, no study has applied this combined historical and predictive LULC approach specificly the Habiganj and Moulvibazar districts. By linking historical land transitions with future landscape trajectories, this study provides a comprehensive and data driven for sustainable land use management and conservation in this ecologically important hilly landscape of northeastern Bangladesh.
2. Materials and Methods
2.1. Study Area
The study area is located in the Sylhet Division of northeastern Bangladesh, which includes the well-known districts of Moulvibazar and Habiganj (Figure 1). These districts are situated in the Lower Himalayan foothills and the Surma Valley. The coordinates are between 24°20′ and 24°50′ N and 91°15′ and 91°55′ E. Moulvibazar is located at 24°22′N to 24°50′N and 91°30′E to 92°15′E, and Habiganj is located at 24°10′N to 24°36′N and 91°15′E to 91°45′E. Several geomorphological features, such as hillocks (tilas) and hills, beels and haors (wetlands), and floodplains, distinguish the northeastern region from the rest of Bangladesh [19]. Elevation in the region ranges from 10 to 100 meters above sea level, resulting in diverse topography and drainage patterns. This region includes critical wetlands such as Hakaluki Haor, Hail Haor, and Baaikka Beel, as well as protected areas such as Lawachara National Park and Rema-Kelaga Wildlife Sanctuary. These areas have been designated Ecologically Critical Areas (ECAs) by the Bangladeshi government due to their biodiversity and the presence of endangered species. This area receives an average annual rainfall of 3500- 4500 mm, with roughly 80% of the total precipitation occurring between May and September. Moulvibazar's average yearly temperature is about 26°C, while Habiganj's is slightly higher at about 27°C. Throughout the year, relative humidity is constantly high, usually between 70% and 90%, particularly during the monsoon season (Figure 1).
2.2. Data Collection and Preprocessing
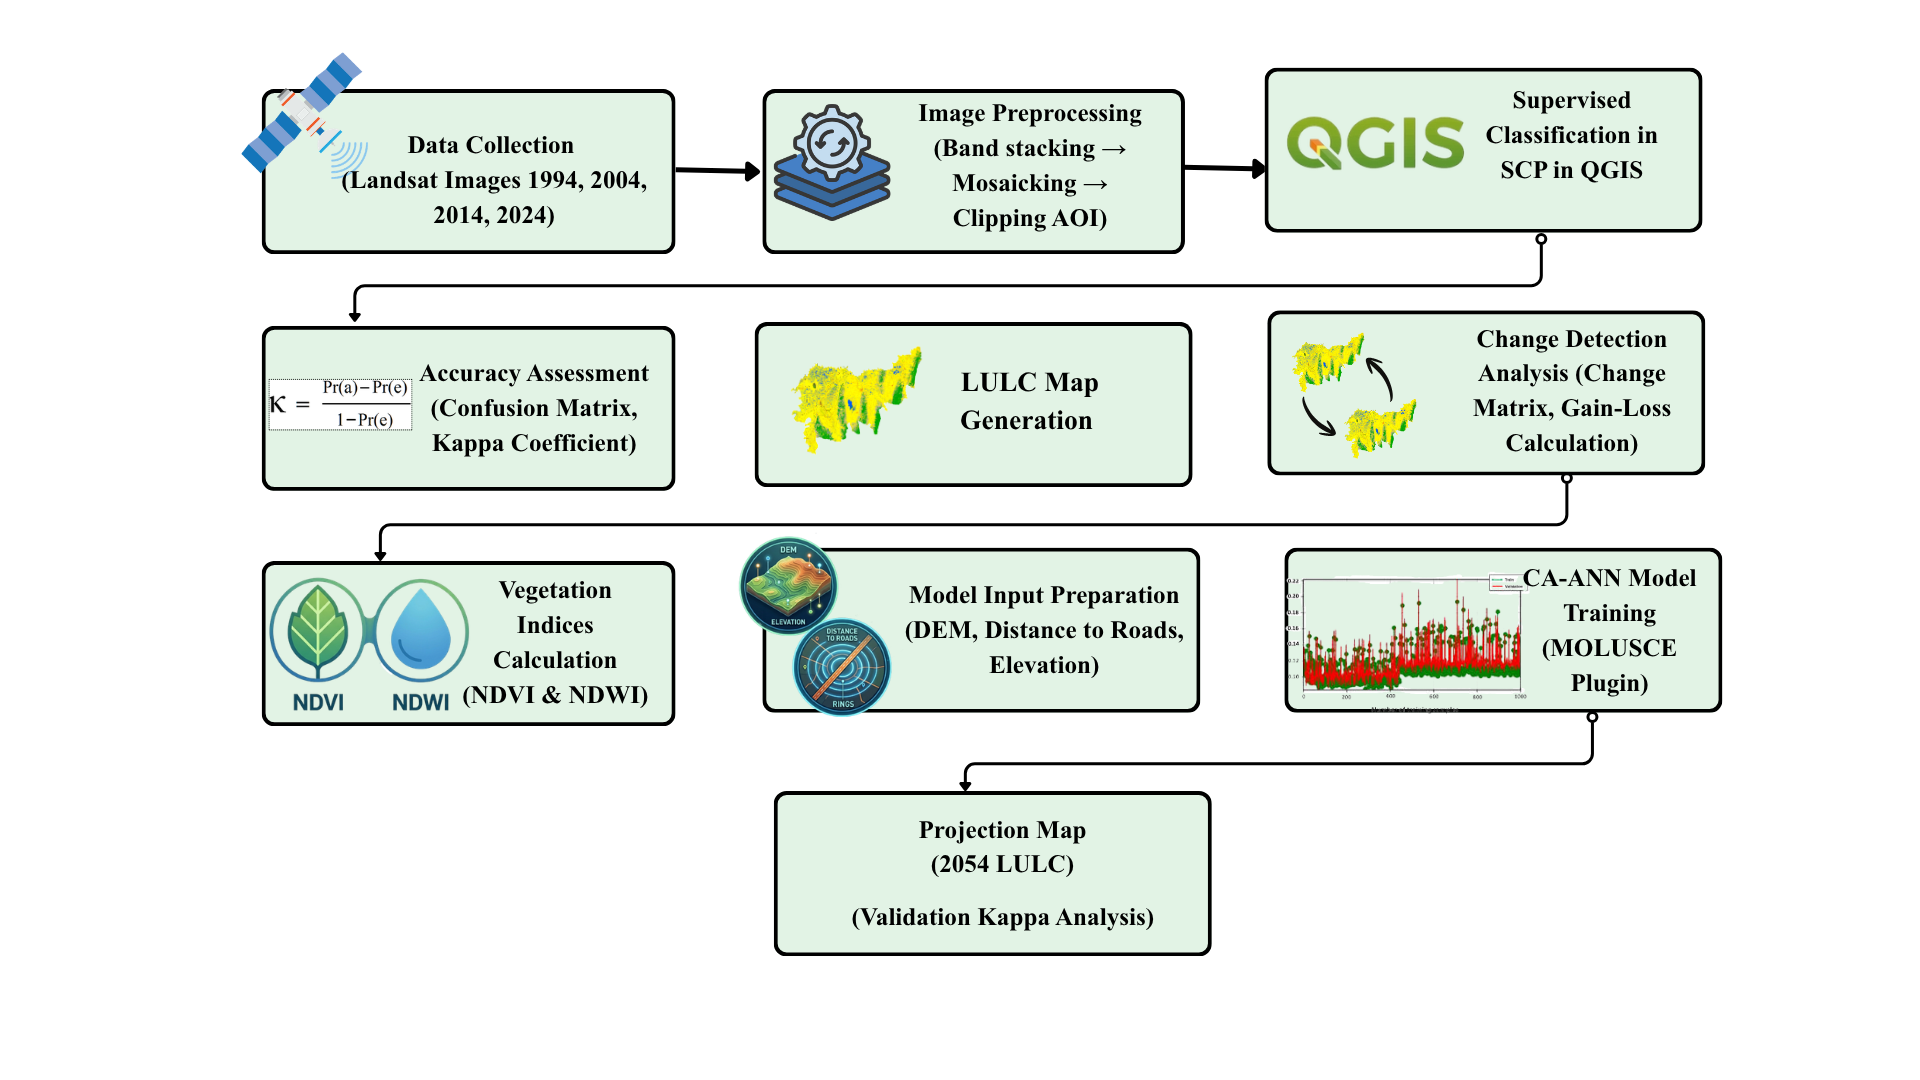
Satellite imagery was used to analyze LULC changes over 30 years, with 10-year intervals (1994, 2004, 2014, and 2024). The decadal time periods have been selected to minimize the influence of short-term variability. Two scenes per year were required because the study area lies at the boundary between two Landsat rows with a 30 m spatial resolution. Landsat surface reflectance images were obtained from USGS Earth Explorer, using Landsat 4-5 TM C2 L2 imagery for 1994 and 2004, and Landsat 8-9 OLI/TIRS C2 L2 imagery for 2014 and 2024. The Landsat Level-2 data are pre-processed with the LEDAPS (TM) and LaSRC (OLI) atmospheric correction algorithms and are systematically radiometrically consistent across sensors [21,22]. Therefore, no additional inter-sensor normalization was implemented. The Landsat data utilized in the study are compiled in Table S1. Images were primarily selected from October to December to minimize atmospheric interference, and cloud cover was kept below 10%. All images were projected to the WGS 84 / UTM Zone 46N coordinate reference system (EPSG: 32646). Since two images were obtained for each year, images were initially preprocessed by stacking the distinct spectral bands for each scene and mosaicking the two scenes to produce a single image, providing a seamless dataset. The "Create Virtual Raster" tool in QGIS was then used to build a multiband composition from this mosaicked image. Then, the clipping tool was used to extract the Area of Interest (AOI) shapefile from the DIVA-GIS administrative boundary shapefile. This shapefile was used to extract the corresponding area from the virtual raster file for each year, thereby ensuring that subsequent image processing and analysis were limited to the study area.
2.3. Image Classification
The study area's LULC classes were grouped into five categories, as listed in Table S2: Crop Land, Water Body, Forest, Tea Garden, and Settlement. Supervised classification was performed in QGIS 3.36 (Maidenhead) using the Maximum Likelihood Classification on the Semi-Automatic Classification Plugin. MLC was selected for this study because it is a well-established parametric classifier that has proven accurate for LULC mapping using Landsat data in tropical and subtropical countries [22]. For each year's mosaicked composite, a band set was constructed using relevant spectral bands, and a false-color composite (bands 4-3-2 for Landsat 4-5 TM and bands 5-4-3 for Landsat 8-9 OLI/TIRS) was generated to support visual interpretation during sample collection. Training samples (Regions of Interest) were manually digitized as polygons over false-color composites within the SCP dock. Historical imagery in Google Earth Pro was used to verify land cover classes for each year. For each LULC class, a minimum of 30 training polygons was digitized per scene, yielding at least 150 polygons per class across the four time periods.
2.4. Accuracy Assessment
Accuracy assessment quantifies how well classified pixels correspond to actual ground-truth land cover and is essential for evaluating the reliability of the classification results. Evaluating the accuracy of the classified image is an important step in image classification utilizing a GIS system [23]. The accuracy of the LULC-categorized image was calculated using the confusion matrix approach described by [24] and implemented with the post-processing tools of the Semi-Automatic Classification Plugin (SCP). For each classification year, a validation shapefile was digitized manually using Google Satellite imagery as the reference base map, with an ID field assigning each polygon to one of the five LULC classes. At least 10 representative polygons were digitized per class across the study area. The classified map was compared against these reference polygons using the SCP Post-processing tool to generate a confusion matrix, from which overall accuracy, producer's accuracy, user's accuracy, and the Kappa coefficient were calculated to quantify classification reliability. A Kappa coefficient ranges from 0 to 1, with values close to 1 indicating near-perfect agreement and values near 0 indicating agreement no better than chance. Following the classification of [23], Kappa coefficient 0.81-1.00 indicate almost perfect agreement (Table S3).
2.5. Change Matrix and Gain-Loss Calculation
Change detection was performed using a post-classification comparison approach. All classified LULC maps for consecutive years were overlaid to generate transition matrices for three decadal intervals (1994-2004, 2004-2014, and 2014-2024) and the overall 1994 to 2024 period. Transition matrices were produced using the Land Cover Change tool under the post-processing module of the SCP. For each interval, the earlier classified map was designated as the reference map, and the later map as the new classification. An alluvial diagram illustrating LULC transition between 1994 and 2024 was produced in R version 4.5.2. Flow widths proportional to transition area (ha) and node labels displaying total class area at each time point.
The overall gain and loss were calculated using the change matrix table for each time interval. Change matrix tables present quantitative results, with each row representing the original land cover class in the earlier period and each column representing the destination class in the later period. The analysis was based on transition matrices derived from classified LULC maps across selected temporal intervals. The following equations are used to calculate the Gain, Loss, and Net Change for each land use/land cover (LULC) class:
Gainᵢ = ∑ⱼ₍ⱼ ≠ ᵢ₎ Tⱼᵢ
Lossᵢ = ∑ⱼ₍ⱼ ≠ ᵢ₎ Tᵢⱼ
Net Changeᵢ = Gainᵢ − Lossᵢ
Where:
- Tᵢⱼ is the transition area from class i to class j.
- i and j represent different LULC classes.
- ∑ⱼ₍ⱼ ≠ ᵢ₎ indicates the summation over all j not equal to i.
2.6. Analysis of Vegetation and Water Indices
2.6.1. The Normalized Difference Vegetation Index (NDVI)
The Normalized Difference Vegetation Index is one of the most widely used indices for vegetation evaluation [25], calculated by comparing near-infrared and red reflectance in green vegetation, with values ranging from -1 to 1 (Table S4). The NDVI values and their corresponding land-cover interpretations were adopted from [25]. The NDVI was calculated by the following formulae given in the equation:
NDVI =
Where:
ρNIR = Surface reflectance in the Near-Infrared (NIR) band
ρRed = Surface reflectance in the Red band
2.6.2. Normalized Difference Water Index (NDWI)
The Normalized Difference Water Index (NDWI) is a satellite spectral band-based method for monitoring water bodies and moisture content in vegetation or soil. It helps to distinguish water features from other types of land cover. Positive NDWI values indicate the presence of water, whereas negative values indicate the absence of water features such as crop land, settlements, forests, and so on (Table S5). The NDWI values and their corresponding land-cover interpretations were adopted from [26]. The general formula is:
NDWI =
Where:
= Surface reflectance in the Green band
ρNIR = Reflectance in the Near-Infrared (NIR) band
2.7. Projected Map Preparation
Future LULC was predicted using the MOLUSCE plugin in QGIS 3.36.1 "Maidenhead," which computes LULC changes over two time periods (1994 and 2024). LULC prediction is critical for developing strategies that balance conservation, competing users, and developmental needs [27]. The CA-ANN technique has been widely used and shown to outperform linear regression, providing precise future LULC forecasts for land-use planning and management [29,30]. It has proven effective at predicting future changes in land and forest cover, identifying deforestation in sensitive areas, examining temporal variations in LULC, and forecasting future land use changes [31,32]. The classified LULC maps for 1994 and 2024 were used as input layers after ensuring consistency in spatial resolution, spatial extent, and coordinate reference system, along with explanatory variables, including a Digital Elevation Model (DEM) map, distance to roads, distance to rivers, and elevation data, to support the land-use change pattern. Pearson's correlation analysis was conducted to assess multicollinearity among predictors, and variables exhibiting high correlation (r > 0.7) were carefully evaluated to ensure statistical stability and improve model performance. The sample was defined using an Artificial Neural Network (Multi-layer perceptron) trained using the observed 1994-2024 land cover transition to estimate transition probabilities among LULC classes and generate a transition potential map. The trained ANN model was integrated with a Monte Carlo cellular automata (CA) to generate the simulated map. To validate the model prior to future projection, the calibrated model was used to simulate the 2024 LULC, which was compared against the actual classified 2024 map using the Kappa coefficient. A higher kappa value for the projected map indicates stronger agreement between simulated and observed maps, reflecting improved model accuracy and reliability. Following successful validation, the model was applied to project the LULC transition for 2054, generating the LULC map and associated area statistics.
3. Results
3.1. Accuracy Assessment
The accuracy assessment of the supervised classification results indicates a high level of reliability for all analyzed years. The overall accuracies for LULC maps of 1994, 2004, 2014, and 2024 were 97.84%, 90.74%, 89.88%, and 93.15%, respectively. The corresponding Kappa coefficient ranged from 0.82 to 0.95, indicating almost perfect agreement between the classified images and the referenced data (Table 1).
3.2. Monitoring of LULC Changes
The spatial distribution of LULC in the study area exhibited significant changes over the past three decades. The generated maps for 1994, 2004, 2014, and 2024 illustrate clear spatial and temporal variation in land use distribution across the region (Figure 2a-d). In 1994, the landscape was predominantly cropland, while forest and tea garden areas were mostly concentrated in the hilly regions (Figure 2a). Over time, tea plantations and settlements expanded, whereas cropland declined in several parts of the study area (Figure 2a-d). The maps highlight the dynamic nature of land-use transitions driven by agricultural expansion, tea plantations, and infrastructure development.
Over time, a noticeable spatial transformation occurred across the study area. Cropland declined continuously from 379,716.66 ha in 1994 to 303,873.97 ha in 2024, representing a total loss of 75,842.69 ha over three decades (Figure 3a,b). Tea garden expanded substantially from 28,523.84 ha in 1994 to 69,600.19 ha in 2024, indicating an impressive growth of 41,076.35 ha. Settlement areas grew from 17,103.54 ha to 26,795.58 ha, indicating continued urban and infrastructural expansion. Forest cover initially decreased from 74,760.71 ha in 1994 to 67,731.45 ha in 2004, before recovering substantially to 90,932.94 ha in 2014 and 98,282.60 ha in 2024, resulting in a net gain of 23,521.89 ha over the study period (Table S6). Water bodies showed minor fluctuations during the same period, with an overall increase of 1,552.41 ha. (Figure 3a,b).
3.3. LULC Change Matrix Analysis
3.3.1. Assessment of LULC Change Matrix from 1994 to 2004
The change matrix for 1994-2004 reveals significant transitions among LULC classes (Table 2). Croplands remained the dominant class, although it decreased from 379,716.66 ha to 368,118.81 ha. A large portion (322,527.93 ha) of croplands remained unchanged. The forest area also declined from 74,760.71 ha to 67,731.45 ha, primarily due to conversion to a tea garden (13,521.55 ha). Some forest gain occurred through conversion from other classes, with 49,330.30 ha remaining unchanged. The tea garden expanded significantly from 28,523.84 ha to 46,995.33 ha. Water bodies declined slightly, with around 11,336.53 ha remaining unchanged and 14,251.37 ha transitioning to croplands (Table 2). The settlement area also increased moderately over the decade from 17,103.54 ha to 19,362.65 ha.
3.3.2. Assessment of LULC Change Matrix from 2004 to 2014
Between 2004 and 2014, the most prominent land-use transition was the conversion of cropland to tea gardens, accounting for 28,907.89 ha (Table 3). Cropland declined from 368,118.83 ha to 323,244.37 ha, with 287,634.17 ha remaining unchanged. Forest cover increased from 67,731.44 ha to 90,932.94 ha, with 49,655.85 ha remaining stable. Tea gardens continued to expand, from 46,995.34 ha to 66,427.59 ha, while 26,086.14 ha of the tea garden remained unchanged. Settlement areas also expanded from 19,362.65 ha to 22,549.76 ha, mainly through cropland conversion. Water bodies remained relatively stable with minor inter-class transitions.
3.3.3. Assessment of LULC Change Matrix from 2014 to 2024
The 2014-2024 change matrix indicates continued land-use transition, though at a moderate pace (Table 4). Croplands declined from 323,244.36 ha to 303,873.97 ha, with a significant loss to tea garden (18,958.33 ha), and settlement (18,711.39 ha). Forest cover continued to increase, rising from 90,932.94 ha to 98,282.60 ha, with 63,691.61 ha remaining stable. The tea garden area grew slightly from 66,427.59 ha to 69,600.19 ha, primarily through conversion of croplands and forest areas. Settlement expansion continued, reaching 26,795.58 ha, with the most significant inflow coming from crop land area and forest area. Water bodies also expanded from 23,712.10 ha to 28,314.41 ha, largely due to seasonal flooding and conversion of low-lying croplands (Table 4).
3.3.4. Assessment of Overall LULC Change Matrix from 1994 to 2024
The spatial transitions among land-use classes are illustrated by the change matrix map (Figure 4a) and the Sankey diagram (Figure 4b), which highlight the dominant land-use conversions across the study area. Croplands remained the most dominant land cover, declining from 379,716.66 ha (72.07%) in 1994 to 303,873.97 ha (57.68%) in 2024 (Table S6). The most prominent transition was the conversion of cropland to tea gardens, covering 43,515.10 ha. Forest showed a considerable increase from 74,760.71 ha (14.19%) to 98,282.60 ha (18.65%), with 33,504.64 ha remaining unchanged. Tea gardens experienced a significant expansion, increasing from 28,523.84 ha (5.41%) in 1994 to 69,600.19 ha (13.21%) in 2024 (Table S6). Settlement areas also increased steadily from 17,103.54 ha (3.25%) to 26,795.58 ha (5.09%), mainly through the conversion of croplands. Water bodies showed relatively modest change, increasing from 26,762.00 ha (5.08%) to 28,314.41 ha (5.37%) (Figure 4b).
3.4. Gain-Loss and Long-Term LULC Change (1994-2024)
The gain-loss analysis and long-term (1994-2024) land use and land cover change (LULC) showed significant losses of cropland and forest, while there were significant gains in tea garden and built-up land in the study area (Table 5). Cropland experienced the largest decline, decreasing from 379,716.66 ha (72.07%) in 1994 to 303,873.97 ha (57.68%) in 2024, a net reduction of 14.40%. Cumulative losses were considerably higher than gains, highlighting a persistent reduction in agricultural land over time. Water bodies showed relatively minor fluctuation, declining slightly to 23,712.11 ha (4.50%) by 2014 before recovering to 28,314.41 ha (5.37%) in 2024. Overall, water bodies remained relatively stable, with a net gain of 0.29% across the study period.
Forest cover followed a non-linear transition; it initially declined between 1994 and 2004; however, it recovered significantly in the following decades. The forest area increased from 74,760.71 ha (14.19%) in 1994 to 98,282.60 ha (18.65%) in 2024, resulting in an overall gain of 4.46%. Tea gardens exhibited the most pronounced expansion among all land-use classes. The area increased from 28,523.84 ha (5.41%) to 69,600.19 ha (13.21%), representing a net gain of 7.80%. This substantial growth reflects the increasing dominance of tea plantations within the region.
Settlement areas expanded continuously throughout the study period, increasing from 17,103.54 ha (3.25%) to 26,795.58 ha (5.09%), representing an overall increase of 1.84%. This growth indicates increasing urban and infrastructural development across the study area.
3.5. Vegetation and Water Indices
3.5.1. Normalized Difference Vegetation Index (NDVI)
The Normalized Difference Vegetation Index (NDVI) indicates a noticeable improvement in vegetation conditions from (a) 1994 to (b) 2024 (Figure 5). In 1994, the NDVI ranged from -0.0836 to 0.4232, representing areas with no vegetation to moderately low vegetation. By 2024, NDVI values ranged from -0.1734 to 0.51281, indicating an overall increase in vegetation density and healthier vegetation conditions across the study area. The increase in NDVI values in 2024 is consistent with the growth in forest cover and tea garden area.
3.5.2. Normalized Difference Water Index (NDWI)
Normalized Difference Water Index (NDWI) values were derived for the years (a) 1994 and (b) 2024 to assess surface water conditions (Figure 6). NDWI values range from -0.3059 to 0.2458 for 1994 and -0.8562 to 0.2169 in 2024. This result indicates spatial variability in surface water distribution, with some areas showing lower moisture levels in 2024 than in 1994. However, the comparison between these two years should be interpreted with caution, as the 1994 imagery was acquired in February-March and the 2024 imagery in December; thus, seasonal variability might be limiting the comparison.
3.6. Prediction of Future Land Use and Land Cover Map
The prediction map for 2054 demonstrates a high level of reliability with an overall accuracy of 94.03% and a kappa of 0.9024, indicating almost perfect agreement between the simulated and reference maps. The overall Kappa coefficient (0.90), Kappa histogram (0.95), and Kappa location (0.94), demonstrate strong spatial correspondence between the simulated and observed maps (Table S8). The projections suggest that the tea gardens and settlement areas will continue to expand in the coming decades (Table 6). Tea gardens are expected to increase from 69,600.19 ha (13.21%) in 2024 to 77,445.72 ha (14.69%) in 2054, while settlement may expand from 26,795.58 ha (5.09%) to 33,013.98 ha (6.26%) (Figure 7). In contrast, other land-use categories are projected to decline slightly. Cropland is projected to decrease marginally to 303,598.98 ha. Forest areas are projected to experience a total loss of 13,768 hectares, reducing the forest cover from 18.65% to 16.04% between 2024 and 2054. Water bodies are expected to remain stable, with a slight decline (Figure 7).
4. Discussion
Rapid land-use change in ecologically sensitive hilly landscapes poses a significant threat to biodiversity, carbon stock, and food security. The northeastern hilly region of Bangladesh is a landscape known for commercial tea cultivation, industrialization, hilly forests, and haors. This study examines three decades of LULC (1994-2024) using multi-temporal Landsat imagery and supervised Maximum Likelihood Classification in QGIS. The classified map achieved overall accuracies of 89.88%-97.84% and an overall Kappa coefficient of 0.82-0.95, indicating strong classification reliability. These results are consistent with other Landsat-based LULC studies in Bangladesh [33,34,35]
Cropland remained the most dominant land cover class throughout the study period, declining from 379,716.66 ha (72.07%) in 1994 303,873.97 ha (57.68%) in 2024, representing a loss of 14.40% over the three decades (Table 5). The conversion of croplands to forest areas (50,910.68 ha), tea gardens (43,515.10 ha), and settlements (20,695.76 ha) was the primary driver of decline. The acceleration of cropland loss during the study period coincides with the commercial expansion of tea cultivation in the study area. Since fallow land is included in the classification of croplands, some reclassification of abandoned fallow to tea or forest may also be contributing to the apparent cropland decline [35]. Moulvibazar alone accounts for 63% of the country's total tea production, with Habiganj contributing another 22%, showcasing their critical role in the industry [37,38]. A similar pattern of agricultural land conversion has been observed in other studies examining land-use changes in Bangladesh [38].
Forest cover showed a non-linear trend, decreasing from 74,760.71 ha (14.19%) in 1994 to 67,731.45 ha (12.86%) in 2004, before recovering substantially to 98,282.60 ha (18.65%) by 2024, with a net gain of 23,521.89 ha (Table 5). The post-2004 recovery of forest loss coincides with the introduction of co-management in Bangladesh's national forestry policy framework in 2004, a productive and protective forestry management approach [39]. These findings align with similar previous studies in the Sylhet region, which emphasized that forest cover area has grown since co-management, with mean forest cover decreasing from 121,533 ha (1988-1997) to 120,216 ha (1998-2007), then increasing to 124,556 ha from 2007 to 2018. This improvement is supported by NDVI analysis: maximum values increased from 0.4232 (1994) to 0.5128 (2024), and the broader NDVI distribution in 2024 indicates more spatially extensive and healthier vegetative cover (Table S4). This improvement may be attributed to changes in land-use practices, reforestation, and restoration initiatives over the past 30 years. Despite this positive trend, future studies should further evaluate the ecological quality of regrown forests by estimating carbon stocks and assessing biodiversity.
Tea gardens exhibit the most pronounced expansion among all land-use classes, increasing from 28,523.84 ha (5.41%) in 1994 to 69,600.19 ha (13.21%) in 2024, a 7.80% increase (Table 5). The primary sources of expansion were cropland (43,515.10 ha) and forest (15,600.82 ha), largely through the conversion of tillas and fallow land into commercial plantations. These findings align with national statistics indicating significant growth in tea cultivation in Bangladesh. The tea cultivation area in Bangladesh expanded from around 47,929.73 hectares in 1995 to about 63,266.37 hectares in 2019 [40], and eventually reached 118,325 hectares in 2024 [41]. These upward trends can be linked to economic, environmental, and societal causes, combined with higher production and local consumption, and to tea export revenues driving a commercial shift towards tea farming. However, monoculture tea plantations support lower biodiversity than subtropical hill forests; therefore, economic development that supports long-term environmental sustainability is necessary.
The water body class showed relatively minor fluctuation over the study period, with a net increase of only 1,552.41 ha (0.29%) over three decades. NDWI values ranged from -0.3059 to 0.2458 in 1994 and from -0.8562 to 0.2169 in 2024 (Figure 5). The wider negative NDWI range in 2024 most likely reflects drier December acquisition conditions rather than a genuine long-term moisture reduction, since the 1994 imagery was acquired in February-March, when surface moisture levels are seasonally elevated. Future research incorporating high-temporal-resolution satellite imagery (e.g., Sentinel-1 SAR) would enable seasonally corrected, sensor-independent assessment of surface water dynamics and improve the reliability of inter-annual comparisons.
Settlement expanded from 17,103.54 ha (3.25%) to 26,795.58 ha (5.09%), with the rate of expansion accelerating across successive decades (0.43%, 0.60%, 0.81% per decade) (Table 5). This land-use transformation was primarily driven by rapid urbanization, substantial population growth, and infrastructure development, with cropland as the primary land type. In Bangladesh, converting agricultural land into settlements is a multifaceted issue driven by various environmental and social factors. Buildup area expansion at a cost of cropland has been documented in many studies in Bangladesh [2,43].
The change matrix analysis provides further insight into the multi-directionality of the five classes and the experiences of gains and losses. The northeastern hilly landscape reflects the outcome of overlapping economic, demographic, and governance drivers operating at different spatial and temporal scales. Some studies also reveal that, in the Sylhet region, some forests in the northeastern hilly region are increasing, while others are declining [43]. These transitions highlight the ongoing shift from traditional agricultural landscapes toward commercial plantations on the one hand and urban development on the other, while the landscape is simultaneously experiencing reforestation through co-management practices and localized deforestation due to tea plantation expansion.
The CA-ANN model within MOLUSCE achieved a validation accuracy of 94.03% and Kappa of 0.9024, confirming high predictive reliability (Table S7). This demonstrates reliable performance comparable to similar MOLUSE-based studies in South Asia [45,46]. Under current land-use trends, tea gardens and settlements are expected to continue expanding, reaching 77,445.72 ha (14.69%) and 33,013.98 ha (6.26%) by 2054, respectively. The most concerning projection is a forest loss of 13,767.90 ha, reducing cover from 18.65% to 16.04% (Table 6). This reversal of trends suggests that continued land-use pressure may threaten recent gains in recovery and affect the biodiversity of forest areas. This mixed outcome may be attributed to differences in interference rates, management paradigms, and recent conservation and plantation activities. Improved conservation policies, community-based co-management, and sustainable land-use planning could play an important role in minimizing future forest decline. However, future modeling efforts would benefit from incorporating high-resolution imagery, climatic scenarios, biodiversity assessment, and carbon stock, and socioeconomic drivers to produce more realistic and policy-relevant long-range projections.
5. Conclusion
Satellite-based Land Use and Land Cover (LULC) monitoring is a cost-effective and useful method for evaluating land-use change. This study provides a comprehensive assessment of spatiotemporal changes in LULC over 30 years in the northeastern hilly districts of Bangladesh by integrating multi-temporal satellite data and a CA-ANN-based future projection using the MOLUSCE plugin in QGIS. The findings showed that a consistent decline in cropland may affect agricultural sustainability and rural food security. Tea garden expansion emerges as one of the most dominant land-use transitions, reflecting intensive commercial cultivation driven by economic demand and favorable terrain in the hilly landscape. The forest area initially declined between 1994 and 2004 before recovering substantially by 2024 under co-management initiatives and conservation efforts within the region's protected areas. However, projected forest loss serves as a critical warning to strengthen co-management and conservation initiatives in this ecologically sensitive region. These findings highlight the importance of integrated and data-driven management practices for sustainable land management and conservation planning in this ecologically important landscape of the Sylhet region.
Supplementary Materials
The following supporting information can be downloaded at the website of this paper posted on Preprints.org, Table S1: Characteristics of satellite images; Table S2: Description of Land Use and Land Cover (LULC) classes; Table S3: Value and accuracy of kappa statistics; Table S4: Comparative table of NDVI range and class description; Table S5: Comparative table of NDWI range and class description; Table S6: Overall change matrix table calculation from 1994 to 2024; Table S7: MOLUSCE model validation metrics and interpretation; Table S8: Main abbreviations used in the manuscript; Figure S1: LULC change matrix maps for 1994-2004, 2004-2014, and 2014-2024; Figure S2: Overall LULC transition matrix from 1994 to 2024; Figure S3: Water bodies and river network map of the study area; Figure S4: Road and railway network map of the study area; Figure S5: Digital Elevation Model (DEM) of the study area; Figure S6: Topographic map of the study area; Figure S7: Building and land-use map of the study.
Author Contributions
The following statements should be used “Conceptualization, M.R.M.; methodology, M.R.M. and T.A.; software, M.R.M, T.T., R.H.; validation, T.A. and R.R; formal analysis, M.R.M, investigation, M.R.M., T.T., R.H.; resources, M.M.R. and T.A.; data curation, M.R.M.; writing—original draft preparation, M.R.M.; writing—review and editing, M.R.M., T.A., R.R.; visualization, M.R.M. supervision, M.S.A.T., T.A., R.R.; project administration, M.S.A.T., T.A., R.R.; All authors have read and agreed to the published version of the manuscript.
Funding
Not applicable.
Data availability Statement
Landsat satellite imagery is freely available from the USGS Earth Explorer, and LULC classification output will be made available from the corresponding author upon reasonable request.
Conflicts of Interest
The authors declare no conflicts of interest.
Abbreviations
The following abbreviations are used in this manuscript:
| AOI | Area of Interest |
| ANN | Artificial Neural Network |
| CA | Cellular Automata |
| ECA | Ecologically Critical Area |
| GEE | Google Earth Engine |
| GIS | Geographic Information System |
| ha | Hectare |
| kha | kilo hectare |
| LULC | Land Use and Land Cover |
| NDVI | Normalized Difference Vegetation Index |
| NDWI | Normalized Difference Water Index |
| OLI | Operational Land Imager |
| QGIS | Quantum Geographic Information System |
| ROIs | Regions of Interest |
| SCP | Semi-Automatic Classification Plugin |
| SWIR | Shortwave Infrared |
| TM | Thematic Mapper |
| USGS | United States Geological Survey |
References
- Hufnagel, L.; El-Esawi, M.A.; Summers, J.K. Vegetation Dynamics, Changing Ecosystems and Human Responsibility; BoD–Books on Demand, 2023. [Google Scholar]
- Rai, R.; Zhang, Y.; Paudel, B.; Li, S.; Khanal, N.R. A Synthesis of Studies on Land Use and Land Cover Dynamics during 1930–2015 in Bangladesh. Sustainability 2017, 9, 1866. [Google Scholar] [CrossRef]
- Winkler, K.; Fuchs, R.; Rounsevell, M.; Herold, M. Global Land Use Changes Are Four Times Greater than Previously Estimated. Nat. Commun. 2021, 12, 2501. [Google Scholar] [CrossRef]
- Taylor, C.A.; Rising, J. Tipping Point Dynamics in Global Land Use. Environ. Res. Lett. 2021, 16, 125012. [Google Scholar] [CrossRef]
- Zeng, Z.; Estes, L.; Ziegler, A.D.; Chen, A.; Searchinger, T.; Hua, F.; Guan, K.; Jintrawet, A.; F. Wood, E. Highland Cropland Expansion and Forest Loss in Southeast Asia in the Twenty-First Century. Nat. Geosci. 2018, 11, 556–562. [Google Scholar] [CrossRef]
- Chen, J.; Sun, B.-M.; Chen, D.; Wu, X.; Guo, L.-Z.; Wang, G. Land Use Changes and Their Effects on the Value of Ecosystem Services in the Small Sanjiang Plain in China. Sci. World J. 2014, 2014, 752846. [Google Scholar] [CrossRef]
- Mahbub, R.B.; Ahmed, N.; Rahman, S.; Hossain, M.M.; Sujauddin, M. Human Appropriation of Net Primary Production in Bangladesh, 1700–2100. Land Use Policy 2019, 87, 104067. [Google Scholar] [CrossRef]
- Global Forest Watch (2024). Available online: https://www.globalforestwatch.org/ (accessed on 16 June 2024).
- Reddy, C.S.; Pasha, S.V.; Jha, C.S.; Diwakar, P.G.; Dadhwal, V.K. Development of National Database on Long-Term Deforestation (1930–2014) in Bangladesh. Glob. Planet. Change 2016, 139, 173–182. [Google Scholar] [CrossRef]
- Biswas, S.; Swanson, M.E.; Vacik, H. Natural Resources Depletion in Hill Areas of Bangladesh: A Review. J. Mt. Sci. 2012, 9, 147–156. [Google Scholar] [CrossRef]
- Samad, A.; Raihan, Farzana; Masum, K.M. Urban Growth Assessment in the Northeastern Region of Bangladesh for Sustainable Landscape Management and Conservation. Geol. Ecol. Landsc. 2023, 7, 419–428. [Google Scholar] [CrossRef]
- Sylhet Divisional Forest Office. Available online: https://forest.sylhetdiv.gov.bd/en (accessed on 29 July 2024).
- Dezso, Z.; Bartholy, J.; Pongracz, R.; Barcza, Z. Analysis of Land-Use/Land-Cover Change in the Carpathian Region Based on Remote Sensing Techniques. Phys. Chem. Earth Parts ABC 2005, 30, 109–115. [Google Scholar] [CrossRef]
- Rogan, J.; Chen, D. Remote Sensing Technology for Mapping and Monitoring Land-Cover and Land-Use Change. Prog. Plan. 2004, 61, 301–325. [Google Scholar] [CrossRef]
- Hansen, M.C.; Loveland, T.R. A Review of Large Area Monitoring of Land Cover Change Using Landsat Data. Remote Sens. Environ. 2012, 122, 66–74. [Google Scholar] [CrossRef]
- Markham, B.L.; Helder, D.L. Forty-Year Calibrated Record of Earth-Reflected Radiance from Landsat: A Review. Remote Sens. Environ. 2012, 122, 30–40. [Google Scholar] [CrossRef]
- Avcı, C.; Budak, M.; Yağmur, N.; Balçık, F. Comparison between Random Forest and Support Vector Machine Algorithms for LULC Classification. Int. J. Eng. Geosci. 2023, 8, 1–10. [Google Scholar] [CrossRef]
- Tariq, A.; Jiango, Y.; Li, Q.; Gao, J.; Lu, L.; Soufan, W.; Almutairi, K.F.; Habib-ur-Rahman, M. Modelling, Mapping and Monitoring of Forest Cover Changes, Using Support Vector Machine, Kernel Logistic Regression and Naive Bayes Tree Models with Optical Remote Sensing Data. Heliyon 2023, 9. [Google Scholar] [CrossRef]
- Choudhury, S.A.; Terao, T.; Murata, F.; Hayashi, T. Seasonal Variations of Temperature and Rainfall Characteristics in the Northeastern Part of Bangladesh around Sylhet. 2012. [Google Scholar]
- Feng, M.; Huang, C.; Channan, S.; Vermote, E.F.; Masek, J.G.; Townshend, J.R. Quality Assessment of Landsat Surface Reflectance Products Using MODIS Data. Comput. Geosci. 2012, 38, 9–22. [Google Scholar] [CrossRef]
- Masek, J.G.; Vermote, E.F.; Saleous, N.E.; Wolfe, R.; Hall, F.G.; Huemmrich, K.F.; Gao, F.; Kutler, J.; Lim, T.-K. A Landsat Surface Reflectance Dataset for North America, 1990-2000. IEEE Geosci. Remote Sens. Lett. 2006, 3, 68–72. [Google Scholar] [CrossRef]
- Akomolafe, G.F.; Rosazlina, R. Land Use and Land Cover Changes Influence the Land Surface Temperature and Vegetation in Penang Island, Peninsular Malaysia. Sci. Rep. 2022, 12, 21250. [Google Scholar] [CrossRef]
- Landis, J.R.; Koch, G.G. The Measurement of Observer Agreement for Categorical Data. Biometrics 1977, 33, 159–174. [Google Scholar] [CrossRef]
- Castillo-Santiago, M.Á.; Mondragón-Vázquez, E.; Domínguez-Vera, R. Sample Data for Thematic Accuracy Assessment in QGIS. In Land Use Cover Datasets and Validation Tools: Validation Practices with QGIS; García-Álvarez, D., Camacho Olmedo, M.T., Paegelow, M., Mas, J.F., Eds.; Springer International Publishing: Cham, 2022; pp. 85–96. ISBN 978-3-030-90998-7. [Google Scholar]
- Huang, S.; Tang, L.; Hupy, J.P.; Wang, Y.; Shao, G. A Commentary Review on the Use of Normalized Difference Vegetation Index (NDVI) in the Era of Popular Remote Sensing. J. For. Res. 2021, 32, 1–6. [Google Scholar] [CrossRef]
- McFEETERS, S.K. The Use of the Normalized Difference Water Index (NDWI) in the Delineation of Open Water Features. Int. J. Remote Sens. 1996, 17, 1425–1432. [Google Scholar] [CrossRef]
- Kamaraj, M.; Rangarajan, S. Predicting the Future Land Use and Land Cover Changes for Bhavani Basin, Tamil Nadu, India, Using QGIS MOLUSCE Plugin. Environ. Sci. Pollut. Res. 2022, 29, 86337–86348. [Google Scholar] [CrossRef]
- El-Tantawi, A.M.; Bao, A.; Chang, C.; Liu, Y. Monitoring and Predicting Land Use/Cover Changes in the Aksu-Tarim River Basin, Xinjiang-China (1990–2030). Environ. Monit. Assess. 2019, 191, 480. [Google Scholar] [CrossRef]
- Aneesha Satya, B.; Shashi, M.; Deva, P. Future Land Use Land Cover Scenario Simulation Using Open Source GIS for the City of Warangal, Telangana, India. Appl. Geomat. 2020, 12, 281–290. [Google Scholar] [CrossRef]
- Rahman, M.T.U.; Tabassum, F.; Rasheduzzaman, Md.; Saba, H.; Sarkar, L.; Ferdous, J.; Uddin, S.Z.; Zahedul Islam, A.Z.M. Temporal Dynamics of Land Use/Land Cover Change and Its Prediction Using CA-ANN Model for Southwestern Coastal Bangladesh. Environ. Monit. Assess. 2017, 189, 565. [Google Scholar] [CrossRef]
- Saputra, M.H.; Lee, H.S. Prediction of Land Use and Land Cover Changes for North Sumatra, Indonesia, Using an Artificial-Neural-Network-Based Cellular Automaton. Sustainability 2019, 11, 3024. [Google Scholar] [CrossRef]
- Hossain, Md.S.; Khan, Md.A.H.; Oluwajuwon, T.V.; Biswas, J.; Rubaiot Abdullah, S.M.; Tanvir, Md.S.S.I.; Munira, S.; Chowdhury, Md.N.A. Spatiotemporal Change Detection of Land Use Land Cover (LULC) in Fashiakhali Wildlife Sanctuary (FKWS) Impact Area, Bangladesh, Employing Multispectral Images and GIS. Model. Earth Syst. Environ. 2023, 9, 3151–3173. [Google Scholar] [CrossRef]
- Imran, H.M.; Hossain, A.; Islam, A.K.M.S.; Rahman, A.; Bhuiyan, M.A.E.; Paul, S.; Alam, A. Impact of Land Cover Changes on Land Surface Temperature and Human Thermal Comfort in Dhaka City of Bangladesh. Earth Syst. Environ. 2021, 5, 667–693. [Google Scholar] [CrossRef]
- Islam, M.S.; Crawford, T.W.; Shao, Y. Evaluation of Predicted Loss of Different Land Use and Land Cover (LULC) Due to Coastal Erosion in Bangladesh. Front. Environ. Sci. 2023, 11, 1144686. [Google Scholar] [CrossRef]
- Afroz, T.; Giashuddin Miah, Md.; Abdullah, H.M.; Rafiqul Islam, Md.; Mizanur Rahman, Md. Estimation of Land Cover Changes and Biomass Carbon Stock in North-Eastern Hill Forests of Bangladesh. J. For. Sci. 2023, 69, 217–227. [Google Scholar] [CrossRef]
- Islam, M.N.; Al-Amin, M. Life behind Leaves: Capability, Poverty and Social Vulnerability of Tea Garden Workers in Bangladesh. Labor Hist. 2019, 60, 571–587. [Google Scholar] [CrossRef]
- Siddik, Md.A.; Siddiki, Md.H.; Chakraborty, B.; Zohora, K.F.T. Bangladesh Tea Research Institute, Srimangal Geospatial Distribution of Tea Estates in Bangladesh: A Cartographic Gestalt. J. Agrofor. Environ. 2025, 18, 102–115. [Google Scholar] [CrossRef]
- Ahammad, R.; Stacey, N.; Sunderland, T. Assessing Land Use Changes and Livelihood Outcomes of Rural People in the Chittagong Hill Tracts Region, Bangladesh. Land Degrad. Dev. 2021, 32, 3626–3638. [Google Scholar] [CrossRef]
- Bangladesh Forest Department. Available online: https://bforest.gov.bd/ (accessed on 30 April 2024).
- Bangladesh Tea Board. 2019.
- Bangladesh Tea Board. Available online: https://teaboard.gov.bd/pages/publications/annual-review-of-bangladesh-tea-2023-24-c2aed0-6922da2f81fc96cef9eb5833 (accessed on 30 April 2026).
- Jahan, I.; DeLiberty, T.; Walter, M.; Mondal, P. Urban Growth and Landscape Change in Three Bangladesh Cities: Dhaka, Chattogram, and Sylhet. 2023. [Google Scholar] [CrossRef]
- Ahmed, N.; Mahbub, R.B.; Hossain, M.M.; Sujauddin, M. Modelling Spatio-Temporal Changes of Tropical Forest Cover in the North-Eastern Region of Bangladesh. J. Trop. For. Sci. 2020, 32, 42–51. [Google Scholar] [CrossRef]
- Rahman, M.T.U.; Tabassum, F.; Rasheduzzaman, Md.; Saba, H.; Sarkar, L.; Ferdous, J.; Uddin, S.Z.; Zahedul Islam, A.Z.M. Temporal Dynamics of Land Use/Land Cover Change and Its Prediction Using CA-ANN Model for Southwestern Coastal Bangladesh. Environ. Monit. Assess. 2017, 189, 565. [Google Scholar] [CrossRef]
- Tharik, M.; Arumugam, K.; Vijayaraghavalu, S.S. Spatiotemporal Assessment and Simulation of Land Use and Land Cover Dynamics in Coastal Tamil Nadu Using CA–ANN Modelling for Sustainable Development Planning. Results Eng. 2025, 107771. [Google Scholar] [CrossRef]
Figure 1.
The location of the study area in Bangladesh.
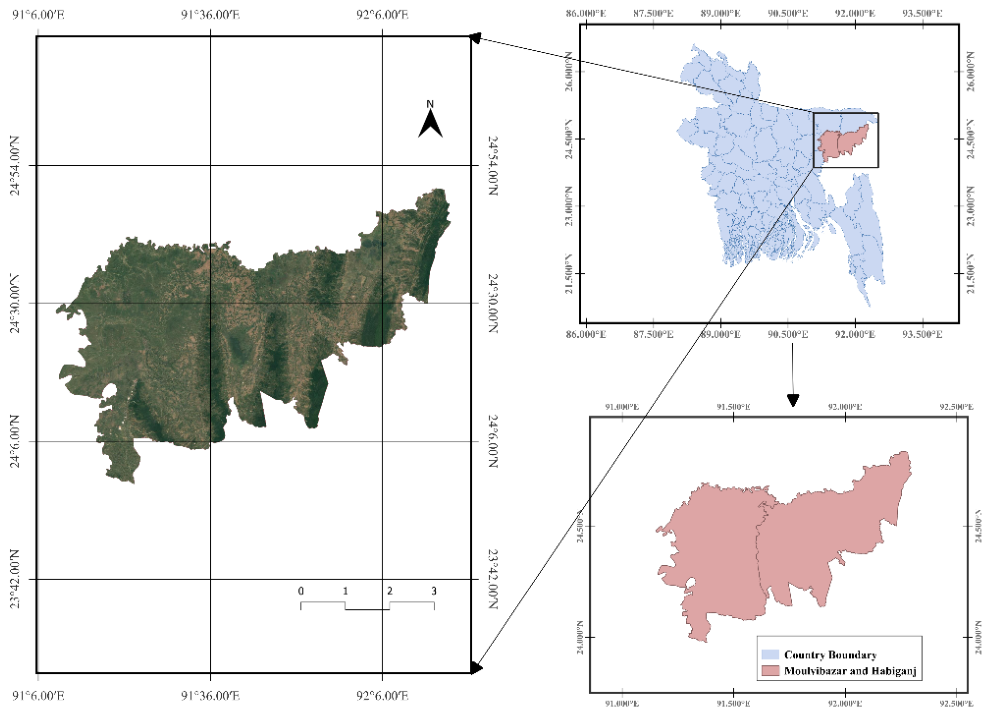
Figure 2.
Land Use Land Cover (LULC) map of the study area for the years (a) 1994, (b) 2004, (c) 2014, and (d) 2024.
Figure 2.
Land Use Land Cover (LULC) map of the study area for the years (a) 1994, (b) 2004, (c) 2014, and (d) 2024.
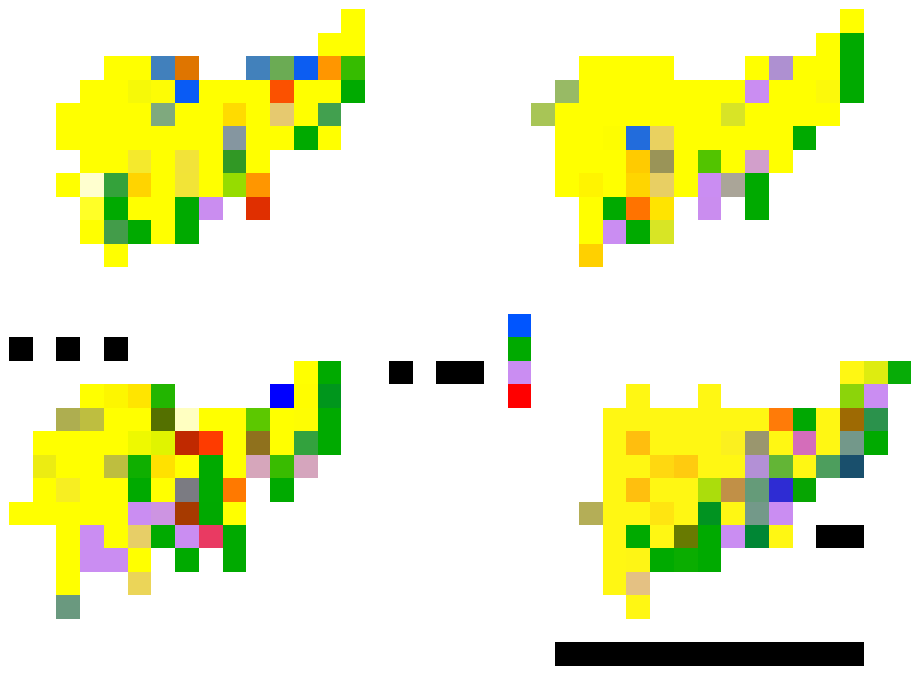
Figure 3.
Area and percentage change of LULC classes in the study area (1994, 2004, 2014, and 2024), (a) area (ha) by class, and (b) percentage share of total study area in each year.
Figure 3.
Area and percentage change of LULC classes in the study area (1994, 2004, 2014, and 2024), (a) area (ha) by class, and (b) percentage share of total study area in each year.
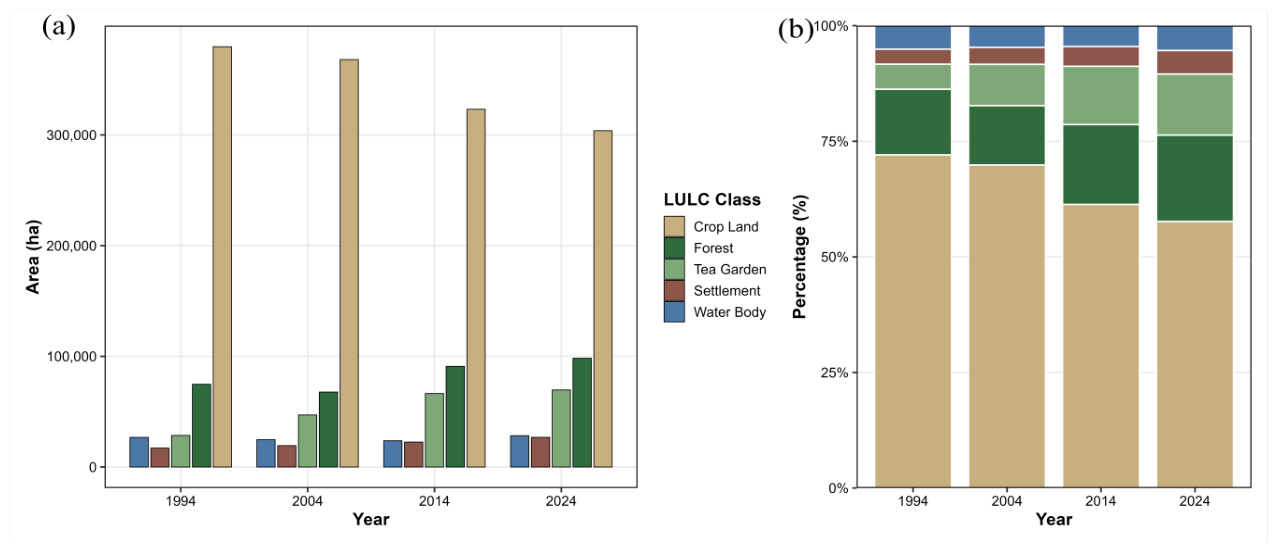
Figure 4.
Overall Land use and land cover (LULC) transition from 1994 to 2024; (a) LULC change matrix map showing spatial patterns of land cover transition (b) Sankey diagram illustrating the overall magnitude and direction of LULC transition.
Figure 4.
Overall Land use and land cover (LULC) transition from 1994 to 2024; (a) LULC change matrix map showing spatial patterns of land cover transition (b) Sankey diagram illustrating the overall magnitude and direction of LULC transition.
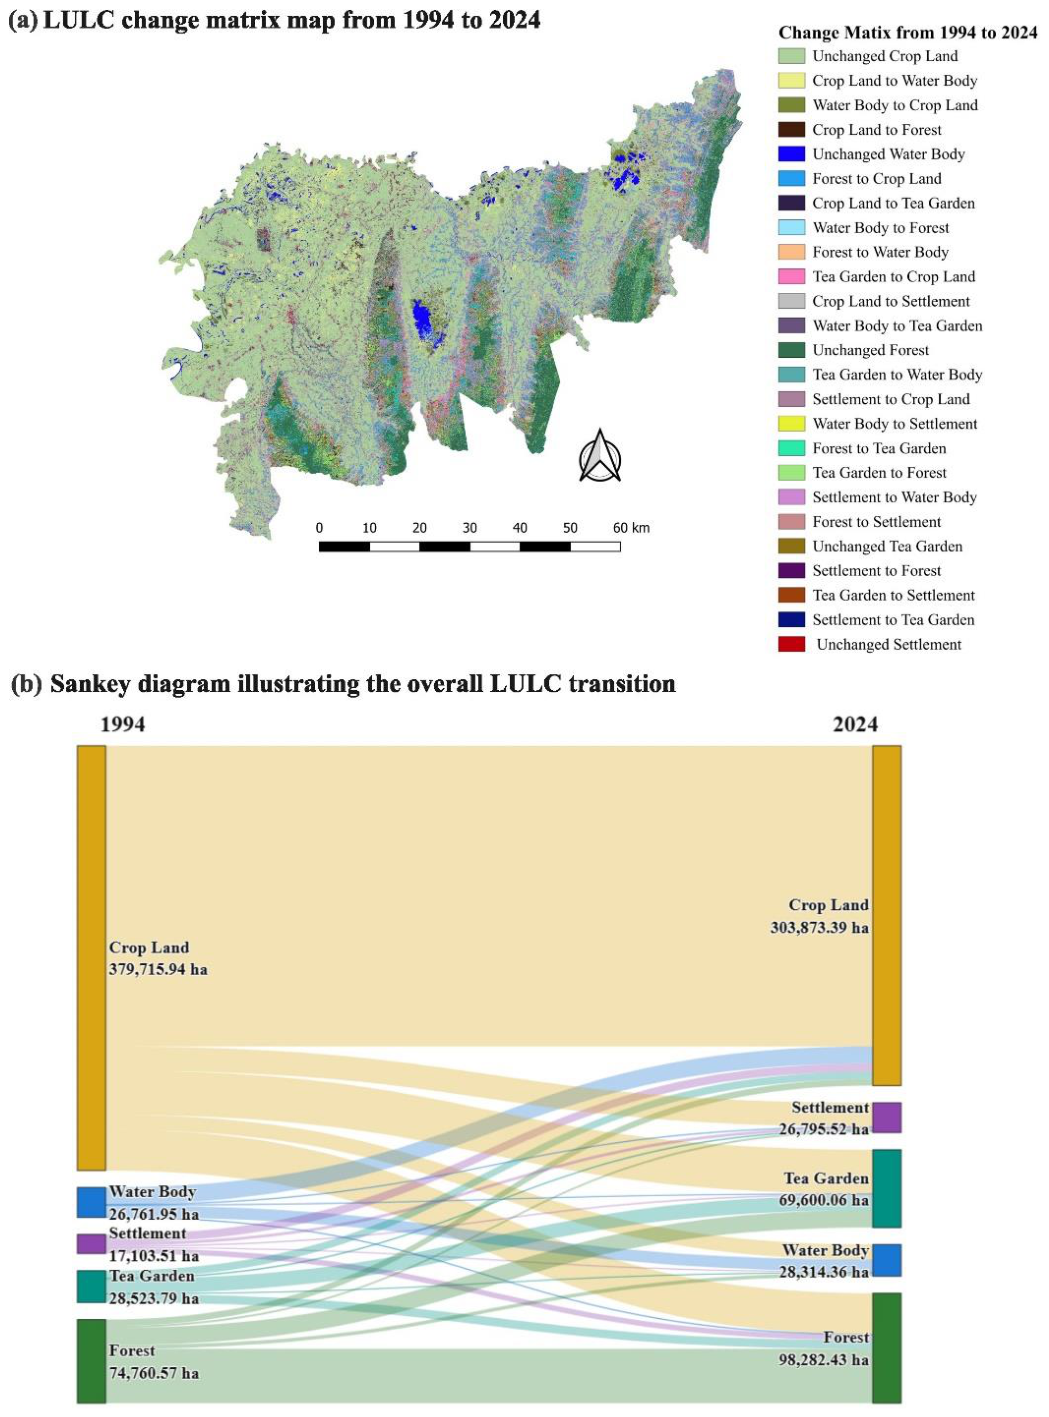
Figure 5.
Spatial distribution of Normalized Difference Vegetation Index (NDVI in the study area for (a) 1994 to (b) 2024.
Figure 5.
Spatial distribution of Normalized Difference Vegetation Index (NDVI in the study area for (a) 1994 to (b) 2024.
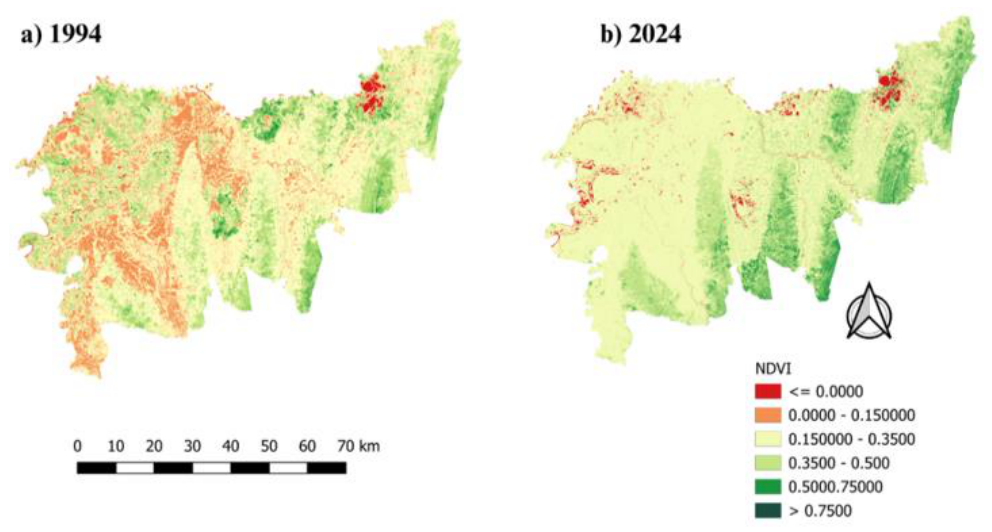
Figure 6.
Spatial distribution of Normalized Difference Water Index (NDWI) in the study area for (a) 1994 to (b) 2024.
Figure 6.
Spatial distribution of Normalized Difference Water Index (NDWI) in the study area for (a) 1994 to (b) 2024.
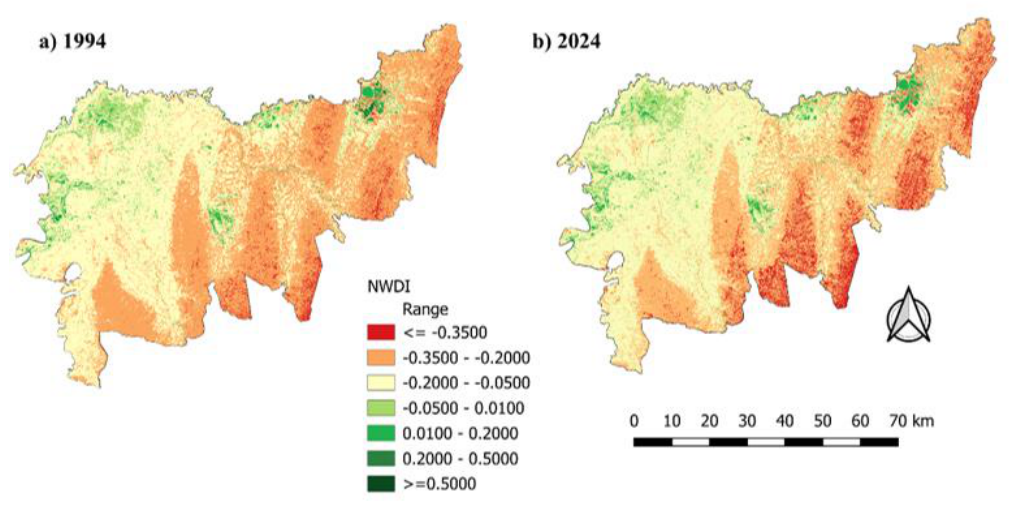
Figure 7.
Prediction map of LULC for 2054, simulated using CA-ANN model based on 1994-2024 land-use trends.
Figure 7.
Prediction map of LULC for 2054, simulated using CA-ANN model based on 1994-2024 land-use trends.
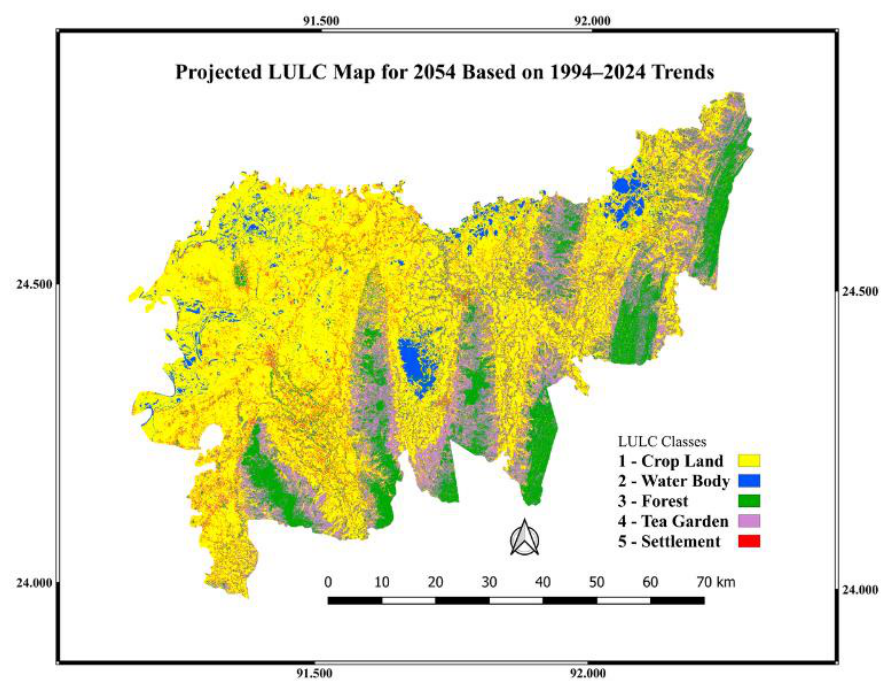

Table 1.
Accuracy assessment for the classified images.
| Reference year | Classified image | Overall classification accuracy (%) | Overall kappa statistics |
|---|---|---|---|
| 1994 | Landsat 4-5 TM | 97.8434 | 0.9538 |
| 2004 | Landsat 4-5 TM | 90.7409 | 0.8280 |
| 2014 | Landsat 8 OLI | 89.8858 | 0.8509 |
| 2024 | Landsat 8 OLI | 93.1501 | 0.8960 |
Table 2.
Change Matrix calculation from 1994 to 2004.
| To \ From | Crop Land (ha) | Water Body (ha) | Forest (ha) | Tea Garden (ha) | Settlement (ha) | 1994 Total |
|---|---|---|---|---|---|---|
| Crop Land (ha) | 322,527.93 (61.22%) | 10,835.11 (2.06%) | 11,520.31 (2.19%) | 20,344.75 (3.86%) | 14,488.56 (2.75%) | 379,716.66 (72.07%) |
| Water Body (ha) | 14,251.37 (2.70%) | 11,336.53 (2.15%) | 750.84 (0.14%) |
43.11 (0.01%) |
380.15 (0.07%) | 26,762.00 (5.08%) |
| Forest (ha) | 8,907.53 (1.69%) | 1,945.01 (0.37%) | 49,330.30 (9.36%) | 13,521.55 (2.57%) | 1,056.32 (0.20%) | 74,760.71 (14.19%) |
| Tea Garden (ha) | 12,150.45 (2.31%) | 69.57 (0.01%) |
3,234.62 (0.61%) | 12,761.85 (2.42%) | 307.35 (0.06%) | 28,523.84 (5.41%) |
| Settlement (ha) | 10,281.53 (1.95%) | 472.29 (0.09%) | 2,895.38 (0.55%) | 324.07 (0.06%) | 3,130.27 (0.59%) | 17,103.54 (3.25%) |
| 2004 Total | 368,118.81 (69.87%) | 24,658.51 (4.68%) | 67,731.45 (12.86%) | 46,995.33 (8.92%) | 19,362.65 (3.68%) | 526,866.75 (100.00%) |
Table 3.
Change Matrix calculation from 2004 to 2014.
| To \ From | Crop Land (ha) | Water Body (ha) | Forest (ha) | Tea Garden (ha) | Settlement (ha) | 2004 Total |
|---|---|---|---|---|---|---|
| Crop Land (ha) | 287,634.17 (54.59%) | 12,910.39 (2.45%) | 22,722.90 (4.31%) | 28,907.89 (5.49%) | 15,943.48 (3.03%) | 368,118.83 (69.87%) |
| Water Body (ha) | 12,507.33 (2.37%) | 9,900.99 (1.88%) | 1,951.84 (0.37%) | 127.71 (0.02%) |
170.64 (0.03%) | 24,658.51 (4.68%) |
| Forest (ha) | 4,820.29 (0.91%) |
652.16 (0.12%) |
49,655.85 (9.42%) | 10,913.39 (2.07%) | 1,689.75 (0.32%) | 67,731.44 (12.86%) |
| Tea Garden (ha) | 6,644.62 (1.26%) |
132.66 (0.03%) |
13,391.48 (2.54%) | 26,086.14 (4.95%) | 740.44 (0.14%) | 46,995.34 (8.92%) |
| Settlement (ha) | 11,637.96 (2.21%) | 115.91 (0.02%) |
3,210.87 (0.61%) | 392.46 (0.07%) |
4,005.45 (0.76%) | 19,362.65 (3.68%) |
| 2014 Total | 323,244.37 (61.35%) | 23,712.11 (4.50%) | 90,932.94 (17.26%) | 66,427.59 (12.61%) | 22,549.76 (4.28%) | 526,866.77 (100.00%) |
Table 4.
Change Matrix table calculation 2014 to 2024.
| To \ From | Crop Land (ha) | Water Body (ha) | Forest (ha) | Tea Garden (ha) | Settlement (ha) | 2014 Total |
|---|---|---|---|---|---|---|
| Crop Land (ha) | 261,380.75 (49.61%) | 10,736.71 (2.04%) | 13,457.18 (2.55%) | 18,958.33 (3.60%) | 18,711.39 (3.55%) | 323,244.36 (61.35%) |
| Water Body (ha) | 10,277.17 (1.95%) | 13,040.91 (2.48%) | 139.60 (0.03%) | 52.29 (0.01%) | 202.13 (0.04%) | 23,712.10 (4.50%) |
| Forest (ha) | 7,376.40 (1.40%) | 3,732.69 (0.71%) | 63,691.61 (12.09%) | 13,329.36 (2.53%) | 2,802.88 (0.53%) | 90,932.94 (17.26%) |
| Tea Garden (ha) | 14,530.59 (2.76%) | 198.88 (0.04%) | 15,419.69 (2.93%) | 35,306.64 (6.70%) | 971.79 (0.18%) | 66,427.59 (12.61%) |
| Settlement (ha) | 10,309.06 (1.96%) | 605.22 (0.11%) | 5,574.52 (1.06%) | 1,953.57 (0.37%) | 4,107.39 (0.78%) | 22,549.76 (4.28%) |
| 2024 Total | 303,873.97 (57.68%) | 28,314.41 (5.37%) | 98,282.60 (18.65%) | 69,600.19 (13.21%) | 26,795.58 (5.09%) | 526,866.75 (100.00%) |
Table 5.
LULC change in study area in the last three decades.
| LULC Class | 1994 | 2004 | 2014 | 2024 | 1994-2004 | 2004-2014 | 2014-2024 | 1994-2024 |
|---|---|---|---|---|---|---|---|---|
| Area(ha) | Area(ha) | Area(ha) | Area(ha) | |||||
| Crop Land | 379,716.66 (72.07%) | 368,118.81 (69.87%) | 323,244.37 (61.35%) | 303,873.97 (57.68%) | -2.20 | -8.52 | -3.68 | -14.40 |
| Water Body | 26,762.00 (5.08%) | 24,658.51 (4.68%) | 23,712.11 (4.50%) | 28,314.41 (5.37%) | -0.40 | -0.18 | 0.87 | +0.29 |
| Forest | 74,760.71 (14.19%) | 67,731.45 (12.86%) | 90,932.94 (17.26%) | 98,282.60 (18.65%) | -1.33 | +4.40 | +1.39 | +4.46 |
| Tea Garden | 28,523.84 (5.41%) | 46,995.33 (8.92%) | 66,427.59 (12.61%) | 69,600.19 (13.21%) | +3.51 | +3.69 | +0.60 | +7.80 |
| Settlement | 17,103.54 (3.25%) | 19,362.65 (3.68%) | 22,549.76 (4.28%) | 26,795.58 (5.09%) | +0.43 | +0.60 | +0.81 | +1.84 |
Table 6.
Area calculation of the study area for the projected map for 2054.
| Class | Percentage (%) | Area (ha) |
|---|---|---|
| Crop Land | 57.62 | 303,598.98 |
| Water Body | 5.36 | 28,292.58 |
| Forest | 16.04 | 84,514.50 |
| Tea Garden | 14.69 | 77,445.72 |
| Settlement | 6.26 | 33,013.98 |
Disclaimer/Publisher’s Note: The statements, opinions and data contained in all publications are solely those of the individual author(s) and contributor(s) and not of MDPI and/or the editor(s). MDPI and/or the editor(s) disclaim responsibility for any injury to people or property resulting from any ideas, methods, instructions or products referred to in the content. |
© 2026 by the authors. Licensee MDPI, Basel, Switzerland. This article is an open access article distributed under the terms and conditions of the Creative Commons Attribution (CC BY) license.
Copyright: This open access article is published under a Creative Commons CC BY 4.0 license, which permit the free download, distribution, and reuse, provided that the author and preprint are cited in any reuse.