

Submitted:
22 August 2026
Posted:
24 August 2026
You are already at the latest version
Abstract
Semaglutide and tirzepatide are increasingly used for obesity and diabetes, producing substantial changes in appetite, dietary intake, body weight, glycemic control, and gastrointestinal physiology that could plausibly influence oral health. Reports of xerostomia and dental complications have emerged, but population-scale risk of new-onset oral disease remains unclear. Using de-identified electronic health records from a federated system of 29 million patients, we evaluated 15 oral and dental conditions over a 12-month follow-up period in 184,582 semaglutide or tirzepatide users after excluding patients with substantial pre-existing oral-health burden. GLP-1 receptor agonist users were propensity-score matched to patients initiating other anti-diabetic therapies (42,093 pairs) and undergoing bariatric surgery (15,793 pairs) and comparisons were performed based on structured diagnosis codes and natural language processing-derived phenotypes from clinical notes. During follow-up, 8.69% of GLP-1 users developed at least one newly documented oral-health condition, with dry mouth most frequent (5.29%). Compared with matched users of other anti-diabetic therapies, GLP-1 users had lower incidence of any oral-health condition (RR 0.74, 95% CI 0.71–0.77), dental caries (RR 0.47, 0.40–0.56), and periodontitis (RR 0.50, 0.40–0.61). Dental plaque/calculus was the only condition with higher incidence (RR 1.27, 1.02–1.56). Similar trends were observed versus bariatric surgery (any oral-health condition: RR 0.80, 0.75–0.86). Dry-mouth incidence increased with greater treatment-associated weight loss (P<0.001). Overall, semaglutide or tirzepatide initiation was not associated with broadly increased oral-health risk, although dry mouth may represent a weight-loss-associated phenotype warranting further study.
Keywords:
oral health
; GLP1
; semaglutide
; tirzepatide
Introduction
Glucagon like peptide (GLP-1) receptor agonists (e.g., semaglutide) and GLP-1/Gastric Inhibitory Polypeptide Receptor (GIPR) dual agonists (e.g., tirzepatide) are increasingly used to manage type 2 diabetes, weight, and other cardiometabolic conditions.[1,2] Their profound impacts on metabolism and cardiovascular health have been demonstrated in randomized clinical trials and several real-world analyses.[3,4,5,6,7,8] Their expanding use, however, has also increased attention to their broader safety and tolerability profiles. Gastrointestinal adverse effects, particularly nausea, vomiting, constipation, and diarrhea, are common and can contribute to treatment discontinuation or poor adherence, potentially limiting the clinical benefits of therapy for some patients.[9,10,11,12,13]
As exposure to these medications has increased, less common or secondary effects that may not have been readily apparent in clinical trials are also being recognized. Oral health represents one potentially important but poorly characterized domain. Recently, there have been concerns raised about oral health complications associated with semaglutide use, including xerostomia, halitosis, and enamel erosion, which could be related at least in part to treatment-associated gastroesophageal reflux, vomiting, and/or hyposalivation.[14] However, much of this evidence remains anecdotal (e.g., discussed in case reports or case series), with no quantitative evidence at the population level published to date.[15] For tirzepatide, the data is even more limited, though similar effects have been proposed based on the pharmacologic similarity of these agents.[16]
Large-scale longitudinal clinical data provide an opportunity to evaluate these signals systematically and to distinguish the absolute frequency of oral-health outcomes from their relative risk compared with clinically relevant populations. Here, we leveraged a large federated network of U.S. health systems to characterize the incidence of new-onset oral and dental conditions following initiation of semaglutide or tirzepatide. We additionally compared these outcomes with propensity-score-matched cohorts of patients initiating other anti-diabetic medications or undergoing bariatric surgery, providing complementary metabolic comparators with distinct mechanisms of action. Finally, we examined whether selected oral-health phenotypes varied with the magnitude of treatment-associated weight loss, with the goal of determining whether emerging oral-health concerns represent a broad safety signal or more specific consequences of treatment-associated physiological change.
Results
New initiators of semaglutide or tirzepatide (“GLP-1 users”) were defined as adults with at least two prescriptions of either medication within twelve months and at least twelve months of available follow-up data after treatment initiation (N = 198,576). To enable analysis of the incidence (new onset) of oral health conditions, patients who had three or more encounter days recording any of fifteen prespecified oral health conditions (Table S1) during the five years before the index date were excluded, thus yielding a single at-risk population of 184,582 patients (13,994 excluded). These cohorts were subsequently propensity matched with comparator cohorts (Table 1 and Table 2). Patient counts across the marketed brands of each analyzed ingredient are summarised in Table 3. Two metabolically relevant comparator groups were assembled with the same new-user and follow-up requirements: (1) patients who initiated another anti-diabetic therapy (new users of metformin, a dipeptidyl peptidase-4 [DPP-4] inhibitor or a sodium-glucose cotransporter-2 [SGLT-2] inhibitor) and (2) patients who underwent bariatric surgery. GLP-1 new users were propensity-score matched one-to-one to each comparator, with matching covariates including age, baseline body-mass index, baseline type 2 diabetes, sex, and race (Figure 1). Achieved weight loss magnitude (defined as the percent of body weight lost) was also considered for matching in the bariatric surgery comparison. Covariate balance was quantified by the standardized mean difference, with an absolute value below 0.1 considered acceptable.
Fifteen oral health outcomes (listed in Table S1) were analyzed during the follow-up period (12 months following the index date), with events defined by the presence of a corresponding structured diagnosis code or confirmed diagnosis in a clinical note as determined by a previously validated Bidirectional Encoder Representations from Transformers (BERT) natural language processing model (Table S1).17 The composite ‘any oral-health condition’ outcome was defined as new onset of one or more of fourteen oral-health diseases listed in Table S1; toothache (dental pain) was analyzed as an individual outcome but excluded from this composite, because it is a symptom of several component diseases (e.g., dental caries, pulpitis, dental abscess) and would otherwise double-count them. Twelve-month incidence was expressed as a percentage with a Wilson score 95% confidence interval. Incidence was compared between matched cohorts using the relative risk with a normal-approximation 95% confidence interval; between-cohort differences in each outcome were tested with the chi-square test, or Fisher’s exact test for sparse strata. Trends across ordered weight-loss and glycaemic strata were assessed with the Cochran–Armitage trend test. Correction for multiple hypothesis testing was performed using the Benjamini–Hochberg false discovery rate (reported as q).
Among the 184,582 patients with multiple prescriptions for semaglutide or tirzepatide, at least 12 months of follow-up after their first prescription (“index date”), and fewer than three oral-health encounter-days in the five-year baseline (the at-risk population defined in the Methods), 16,035 (8.7%, 95% CI 8.6-8.8%) patients developed at least one oral health condition during the 12-month follow-up period. The most common condition was dry mouth (N = 9,765, 5.3%), followed by dental caries (N = 1,375, 0.7%), stomatitis and mouth ulcers (N = 1,325, 0.7%), and oral thrush (N = 1,290, 0.7%) (Figure 2; Table 4).
After 1:1 propensity-score matching, there were 42,093 matched pairs of GLP-1 users and patients who initiated other anti-diabetic medications, and 15,793 matched pairs of GLP-1 users and patients who underwent bariatric surgery (A). Matching was performed on the full new-user cohorts; the five-year ≥3-encounter-day baseline washout was then applied within each matched arm to define the at-risk populations for the new-onset analyses, so the at-risk numbers in Table 5 and Table 6 are smaller than, and differ slightly between, the matched-pair counts. The matched GLP-1 user and other anti-diabetic medication cohorts were well-balanced (standardized mean difference [SMD] less than 0.1) across all matching covariates, with average ages of 51.8 versus 52.9 years (SMD: −0.07), 72.4% versus 70.6% female patients (SMD: 0.04), average BMI of 36.0 versus 35.7 (SMD: 0.05), and 23.0% versus 25.9% of patients with documented type 2 diabetes (SMD: −0.07) (B). For the GLP-1 user versus bariatric surgery comparison, there was a modest residual difference in baseline BMI (34.1 versus 33.4 kg/m², SMD: 0.17), while the other covariates were well balanced, including average age (53.7 versus 54.5 years, SMD: −0.06), female sex (69.8% versus 69.5%, SMD: 0.01), and diagnosed type 2 diabetes (22.1% versus 22.3%, SMD: −0.01) (C).
Compared to patients who initiated another anti-diabetic medication, GLP-1 users had a lower 12-month incidence of any oral health condition (relative risk [RR] 0.74, 95% CI 0.71-0.77) and several individual conditions including dental caries (RR 0.47, 95% CI 0.40–0.56), pulpitis (RR 0.46, 95% CI 0.37–0.57), dental abscess (RR 0.50, 0.41–0.61) and periodontitis (RR 0.50, 0.40–0.61) (Figure 4, Table 5). Dental plaque and calculus was the only condition that was observed significantly more frequently after initiation of a GLP-1 receptor agonist (RR 1.27, 1.02–1.56) (Table 5).
Similar trends were observed when comparing GLP-1 users to patients who underwent bariatric surgery. The rate of any new-onset oral health condition was lower in the GLP-1 receptor agonist cohort (RR 0.80, 0.75-0.86) (Figure 4, Table 6). Individual conditions that were observed less frequently after GLP-1 receptor agonist initiation included stomatitis and oral ulcers (RR 0.42, 0.34-0.51), oral thrush (RR 0.49, 0.39-0.62), dental caries (RR 0.59, 0.45-0.77), and pulpitis (RR 0.57, 0.41-0.81) (Figure 4, Table 6). None of the assayed oral health conditions were documented more frequently after semaglutide or tirzepatide initiation compared to bariatric surgery (Table 6). The cumulative incidence of new-onset oral-health disease over the 12-month follow-up is shown for both comparisons in Figure 5.
Negative-control outcomes did not demonstrate a systematic bias between the GLP-1 user and either matched comparator cohort (Figure S4). As a positive control analysis, we also compared the rates of gastrointestinal phenotypes (nausea, vomiting, constipation, and diarrhea) between these matched cohorts (Figure S5). The GLP-1 user cohort had higher incidence of nausea and constipation compared to the anti-diabetic medication cohort (A), consistent with the previously reported tolerability profile of this medication class. All gastrointestinal phenotypes were observed more commonly after bariatric surgery than after initiation of a GLP-1 receptor agonist (B), likely reflecting the known adverse effect profile of this class of surgery.[17]
Finally, we assessed the relationship between the post-treatment incidence of oral health conditions and several baseline and treatment-associated parameters among GLP-1 users. Higher baseline BMI was modestly associated with increased incidence of oral health conditions, with cumulative 12-month incidence of 7.4% among patients with BMI between 25-35 kg/m², 8.3% between 35-40 kg/m², and 8.7% above 40 kg/m² (Cochran–Armitage trend p<0.001; A). The incidence of oral health conditions was also correlated with weight loss magnitude, for example increasing from 6.9% among patients with less than 5% weight loss (N = 10,767) to 10.5% among those who lost at least 30% of their body weight (Cochran–Armitage trend p<0.001) (A). Baseline HbA1c, magnitude of HbA1c reduction, and the number of GLP-1 receptor agonist prescriptions were not significantly associated with the composite outcome (A). Of note, among the specific individual outcomes, dry mouth was the one that contributed most strongly and showed similar trends as the composite outcome, including a positive correlation between dry mouth incidence and baseline BMI or weight loss magnitude (Cochran–Armitage trend p<0.001 for both; B and B). Additional baseline features that were associated with development of an oral health condition after treatment initiation included chronic obstructive pulmonary disease (odds ratio [OR]: 1.98, 95% CI 1.77-2.23), heart failure (OR: 1.83, 1.65-2.03), chronic kidney disease (OR: 1.52, 1.40-1.64), atherosclerotic cardiovascular disease (OR: 1.51, 1.40-1.61), and cancer history (OR: 1.50, 1.39-1.62) (Figure S3, Table S2).
Figure 3.
Twelve-month incidence of oral-health disease across weight and adiposity exposure gradients. (A) Incidence of any oral-health condition across three ordered gradients — achieved weight loss (A1), baseline body-mass index (A2) and reduction in body-mass index (A3) — with Wilson 95% confidence intervals, the at-risk population size beneath each point, and the Cochran–Armitage trend test. (B–G) The same three gradients for each of the six higher-prevalence conditions: dry mouth (B), dental caries (C), stomatitis and mouth ulcers (D), oral thrush (E), toothache (F) and dental abscess (G). (H, I) Twelve-month incidence of any oral-health condition by achieved weight loss and, respectively, baseline body-mass index (H) and baseline glycated haemoglobin (I); each cell shows the incidence, the at-risk count and the Wilson 95% confidence interval. Throughout, strata or cells with fewer than eleven at-risk patients (or fewer than eleven incident cases, for the matrices) are not plotted or not labelled. The corresponding glycaemic and prescription-count gradients are shown in Figure S1, and the lower-prevalence conditions in Figure S2. The associated data are summarised in Table 7.
Figure 3.
Twelve-month incidence of oral-health disease across weight and adiposity exposure gradients. (A) Incidence of any oral-health condition across three ordered gradients — achieved weight loss (A1), baseline body-mass index (A2) and reduction in body-mass index (A3) — with Wilson 95% confidence intervals, the at-risk population size beneath each point, and the Cochran–Armitage trend test. (B–G) The same three gradients for each of the six higher-prevalence conditions: dry mouth (B), dental caries (C), stomatitis and mouth ulcers (D), oral thrush (E), toothache (F) and dental abscess (G). (H, I) Twelve-month incidence of any oral-health condition by achieved weight loss and, respectively, baseline body-mass index (H) and baseline glycated haemoglobin (I); each cell shows the incidence, the at-risk count and the Wilson 95% confidence interval. Throughout, strata or cells with fewer than eleven at-risk patients (or fewer than eleven incident cases, for the matrices) are not plotted or not labelled. The corresponding glycaemic and prescription-count gradients are shown in Figure S1, and the lower-prevalence conditions in Figure S2. The associated data are summarised in Table 7.
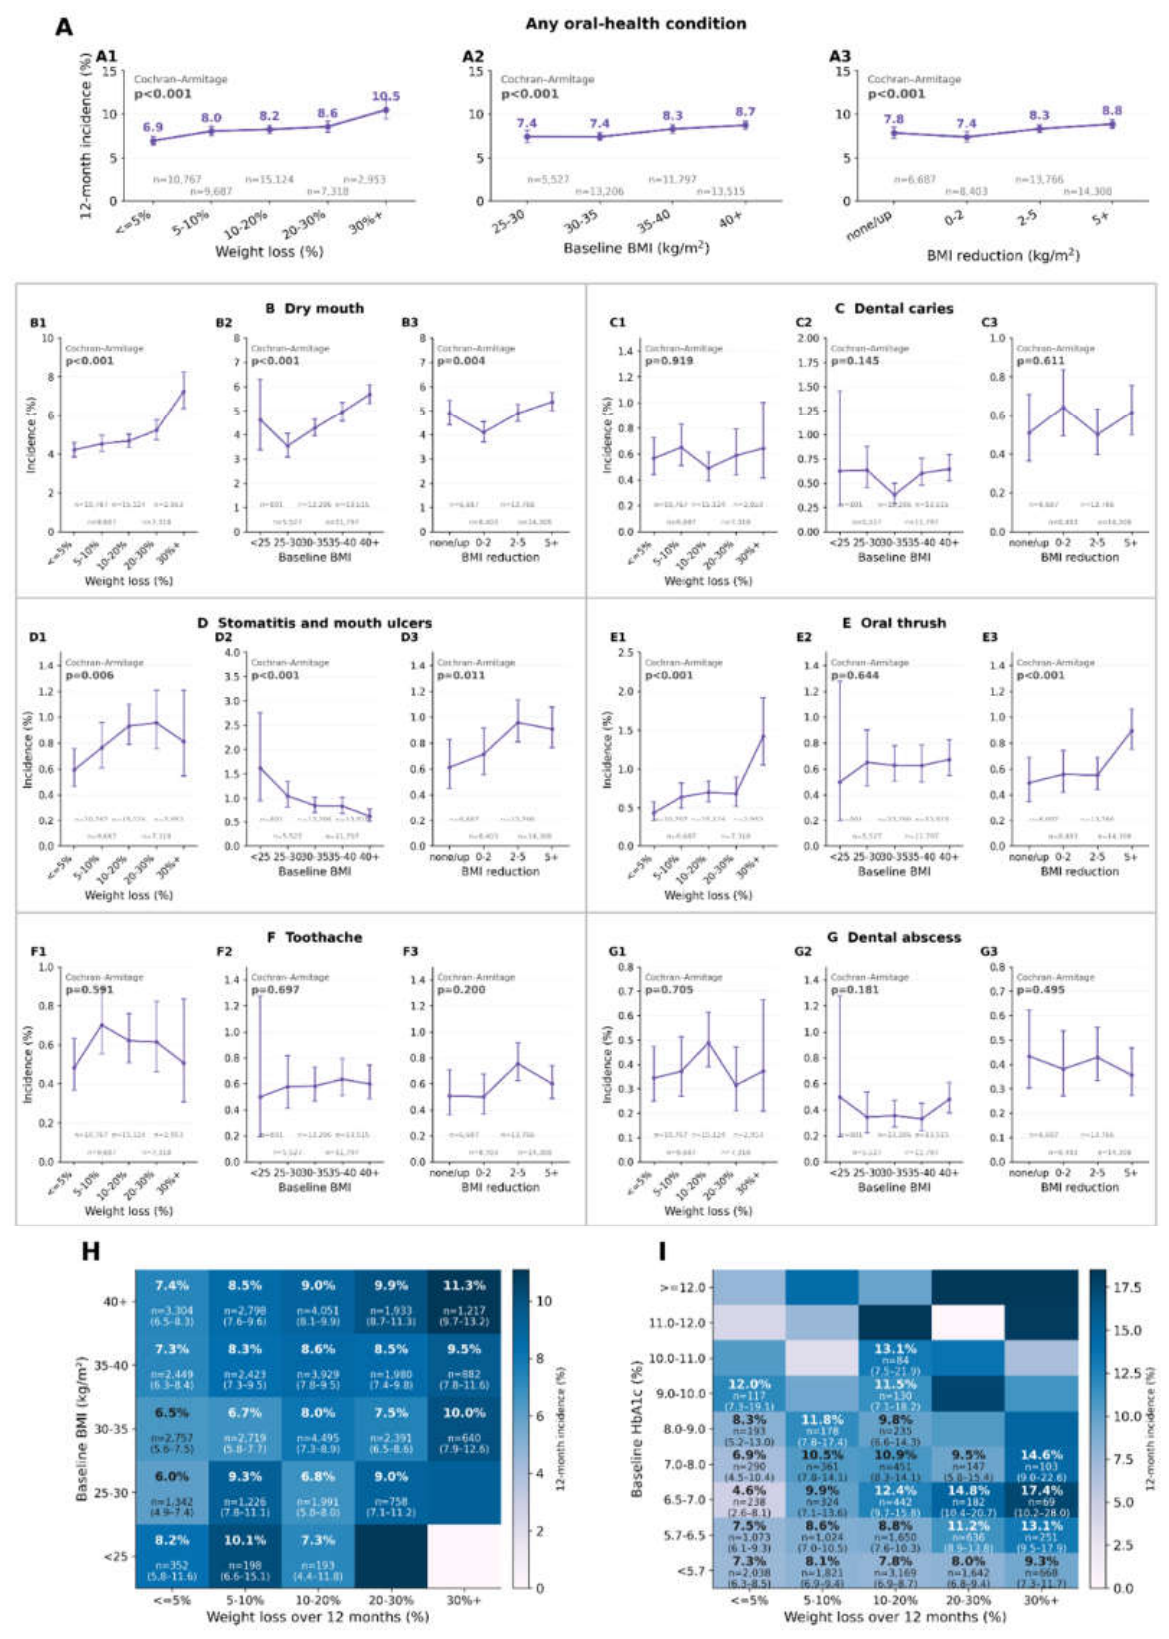

Table 7.
Twelve-month incidence of any oral-health condition across exposure strata (GLP-1 receptor agonist cohort). Trend across ordered strata assessed with the Cochran–Armitage trend test. Exposures with p<0.05 shown in bold.
Table 7.
Twelve-month incidence of any oral-health condition across exposure strata (GLP-1 receptor agonist cohort). Trend across ordered strata assessed with the Cochran–Armitage trend test. Exposures with p<0.05 shown in bold.
| Exposure | Stratum | At risk (N) | New-onset (n) | Incidence (%) | 95% CI | Cochran–Armitage p |
| Maximum achieved weight loss (%) | <=5% | 10,767 | 747 | 6.94 | 6.47–7.43 | <0.001 |
| 5-10% | 9,687 | 778 | 8.03 | 7.51–8.59 | ||
| 10-20% | 15,124 | 1,247 | 8.25 | 7.82–8.69 | ||
| 20-30% | 7,318 | 626 | 8.55 | 7.93–9.22 | ||
| 30%+ | 2,953 | 310 | 10.50 | 9.44–11.66 | ||
| Baseline body-mass index (kg/m²) | <25 | 801 | 70 | 8.74 | 6.98–10.90 | <0.001 |
| 25-30 | 5,527 | 409 | 7.40 | 6.74–8.12 | ||
| 30-35 | 13,206 | 975 | 7.38 | 6.95–7.84 | ||
| 35-40 | 11,797 | 978 | 8.29 | 7.81–8.80 | ||
| 40+ | 13,515 | 1,179 | 8.72 | 8.26–9.21 | ||
| Reduction in body-mass index (kg/m²) | none/up | 6,687 | 524 | 7.84 | 7.22–8.50 | <0.001 |
| 0-2 | 8,403 | 619 | 7.37 | 6.83–7.94 | ||
| 2-5 | 13,766 | 1,144 | 8.31 | 7.86–8.78 | ||
| 5+ | 14,308 | 1,266 | 8.85 | 8.39–9.32 | ||
| Baseline HbA1c (%) | <5.7 | 25,349 | 2,257 | 8.90 | 8.56–9.26 | 0.557 |
| 5.7-6.5 | 20,486 | 2,004 | 9.78 | 9.38–10.20 | ||
| 6.5-7 | 9,883 | 933 | 9.44 | 8.88–10.03 | ||
| 7-8 | 16,626 | 1,487 | 8.94 | 8.52–9.39 | ||
| 8-9 | 11,248 | 963 | 8.56 | 8.06–9.09 | ||
| 9-10 | 6,456 | 613 | 9.50 | 8.80–10.23 | ||
| 10-11 | 3,981 | 340 | 8.54 | 7.71–9.45 | ||
| 11-12 | 2,328 | 209 | 8.98 | 7.88–10.21 | ||
| >=12 | 2,244 | 224 | 9.98 | 8.81–11.29 | ||
| Reduction in HbA1c (percentage points) | none/up | 12,749 | 1,162 | 9.11 | 8.63–9.63 | 0.364 |
| 0-0.5 | 22,850 | 2,081 | 9.11 | 8.74–9.49 | ||
| 0.5-1 | 16,527 | 1,590 | 9.62 | 9.18–10.08 | ||
| 1-1.5 | 10,927 | 1,047 | 9.58 | 9.04–10.15 | ||
| 1.5-2 | 7,710 | 705 | 9.14 | 8.52–9.81 | ||
| 2-2.5 | 5,411 | 433 | 8.00 | 7.31–8.76 | ||
| 2.5-3 | 3,805 | 380 | 9.99 | 9.07–10.98 | ||
| 3-3.5 | 2,716 | 277 | 10.20 | 9.12–11.39 | ||
| 3.5-4 | 2,034 | 185 | 9.10 | 7.92–10.42 | ||
| 4-4.5 | 1,506 | 138 | 9.16 | 7.81–10.73 | ||
| 4.5-5 | 1,180 | 105 | 8.90 | 7.40–10.66 | ||
| 5-5.5 | 896 | 92 | 10.27 | 8.45–12.43 | ||
| 5.5-6 | 659 | 62 | 9.41 | 7.41–11.88 | ||
| 6+ | 1,431 | 142 | 9.92 | 8.48–11.58 | ||
| Number of prescriptions filled | 2-3 | 74,794 | 6,444 | 8.62 | 8.42–8.82 | 0.287 |
| 4-6 | 58,645 | 5,114 | 8.72 | 8.49–8.95 | ||
| 7-9 | 29,427 | 2,547 | 8.66 | 8.34–8.98 | ||
| 10+ | 21,716 | 1,930 | 8.89 | 8.52–9.27 |
Discussion
This real-world analysis provides the first quantitative estimate of the incidence of various oral health conditions in patients who initiated semaglutide or tirzepatide. To contextualize these results, we also compared the incidence of these conditions among GLP-1 users versus patients who initiated other anti-diabetic medications or underwent bariatric surgery. Overall, GLP-1 users had lower new-onset rates of any oral health condition relative to these two comparator groups, with lower documented rates of dental caries and pulpitis in both comparisons and a lower rate of stomatitis compared to bariatric surgery patients. These findings provide important context, as the development of oral health conditions after initiation of a GLP-1 receptor agonist may not be a consequence of the medication but rather could be related to other underlying risk factors. While the data presented here do not provide proof that GLP-1 receptor agonists protect against the development of oral health conditions, it does suggest that these agents at least do not significantly increase the risk for their development.
We found that patients with higher baseline BMI or higher magnitude weight loss tended to have higher incidence of oral health conditions after initiating a GLP-1 receptor agonist. While higher baseline BMI could be associated with higher infection risk, this explanation seems less likely given the lack of correlation with baseline HbA1c, which would also be expected to serve as a marker of infection risk.[18,19] The association with higher magnitude weight loss could suggest at least some component of treatment-related physiology, as patients who had the most notable measured treatment effect also experienced the highest rates of new onset oral health conditions. Whether such a relationship would reflect a direct pharmacologic effect of GLP-1 receptor and/or GIPR agonist versus an indirect effect (e.g., reduced intake leading to hyposalivation and altered oral immune and microbial composition) cannot be determined from this study. However, future randomized placebo-controlled studies assessing oral health outcomes and their associations with treatment response are warranted.
This study has several limitations. First, it is a retrospective analysis of EHR data and thus is susceptible to multiple sources of confounding, including but not limited to selection bias, treatment indication bias, and ascertainment bias. For example, it is likely that patients in three groups which were compared initiated or underwent their respective therapies for different reasons, including diabetes management, weight loss, or the presence of cardiovascular or renal comorbidities (e.g., heart failure, chronic kidney disease). Second, the outcomes analyzed likely suffer incomplete capture in the database, considering that many patients do not obtain their dental care at the same institution where they receive other forms of medical care and that documentation of dental care in EHRs is variable even across dentistry practices.[20,21] That said, there is no expected systematic difference between the GLP-1 user, other anti-diabetic medication, and bariatric surgery cohorts in this respect, so we would not anticipate disproportionate amounts of missing data between the cohorts. Third, outcomes were ascertained using a combination of diagnostic codes and clinical note extractions using a natural language processing model, which both have recognized limitations in sensitivity and specificity.[22,23] Lastly, the patients analyzed received care in a limited number of health systems participating in a federated network. While the sites are geographically diverse, the analyzed cohorts are likely not fully representative of the overall U.S. population.
Overall, this study provides novel insights about a class of phenotypes that has been underinvestigated in patients taking semaglutide and tirzepatide. Given the rapidly growing number of patients initiating these medications, the data presented here can provide clinicians and patients with data that can help guide counseling and decision making. Most importantly, the associations identified here should motivate further prospective studies to better characterize the impacts of GLP-1 receptor agonism on oral health.
Methods
Data source and Study Design
This retrospective study used de-identified EHR data harmonized to a common data model spanning demographics, encounters, diagnoses (ICD-10-CM), medications, procedures, labs, and vitals, as well as unstructured clinical narrative processed by a validated BERT-based NLP model that classifies whether a concept mention is affirmatively present (versus negated, hypothetical, or family history). All analyses ran on de-identified patient-level data, with small cells suppressed. A new-user cohort design compared three groups: (i) new users of a GLP-1 receptor agonist (semaglutide or tirzepatide), the exposure of interest; (ii) new users of another anti-diabetic therapy (metformin, DPP-4 inhibitor, or SGLT-2 inhibitor); and (iii) bariatric-surgery recipients, chosen to contextualize any GLP-1 association against populations with overlapping glycaemic/weight-management indications rather than the general population. Index date was the first qualifying prescription or status code; baseline covered the prior five years and follow-up was a fixed 12 months post-index.
Cohort Definitions
GLP-1 new users required ≥2 distinct prescriptions of semaglutide or tirzepatide within 12 months and ≥12 months of follow-up, with index date set to the first recorded fill (earlier fill used if both agents were received). Prior use of other GLP-1 agents did not exclude patients, and index date was not restricted by calendar year for unmatched analyses. Applying these criteria to 670,422 initiators yielded 339,763 with two or more prescriptions and 198,576 with complete follow-up. The anti-diabetic comparator used identical persistence and follow-up criteria (pharmacologic distinctness enforced at matching, not here), yielding 507,488 of 1,679,730 initiators with complete follow-up. Bariatric recipients were identified via post-surgical ICD-10-CM status codes (Z98.84, Z98.0, O99.84x), with the two-prescription requirement not applicable; this yielded 123,222 of 176,530 recipients with complete follow-up. Semaglutide (Ozempic, Rybelsus, Wegovy) and tirzepatide (Mounjaro, Zepbound) brands were counted per constituent ingredient, so multi-brand or combination-product patients could be counted more than once.
Baseline Washout, Covariates, and Propensity-Score Matching
A pooled washout excluded patients with ≥3 distinct encounter-days for any of 15 prespecified oral-health conditions during the five-year baseline (not a per-condition or zero-prior-history rule), removing 13,994 of 198,576 GLP-1 users and leaving 184,582 at-risk for unmatched analyses. For matched comparisons, matching preceded washout, so post-washout at-risk denominators (39,365/39,687 GLP-1–anti-diabetic; 14,786/14,621 GLP-1–bariatric) are smaller than, and differ slightly from, the 42,093 and 15,793 matched pairs, preserving intact pairs at the point of matching. Propensity scores (ridge-regularized logistic regression) used age, baseline BMI, baseline T2DM, sex, and race for the anti-diabetic comparison, plus 12-month weight loss for the bariatric comparison (included there to address surgery-driven confounding; excluded from the anti-diabetic score as it lies on the treatment–outcome pathway). A broader comorbidity panel was characterized descriptively only. Matching was 1:1 greedy nearest-neighbor without replacement on the logit propensity score (caliper 0.2 SD), restricted to index dates ≥2019 and excluding cross-class fills within ±12 months, yielding 42,093 and 15,793 matched pairs with all covariates achieving SMD < 0.1.
Outcome Definitions and Exposure-Response Variables
Fifteen prespecified oral/dental conditions (e.g., caries, periodontitis, xerostomia, oral candidiasis, halitosis, toothache) were each operationalized via curated ICD-10-CM codes and representative note concepts; an event required a qualifying code or NLP-affirmed concept during the 12-month follow-up, counted only within the washed-out at-risk population. The composite "any oral-health condition" outcome combined 14 core diseases, excluding toothache to avoid double-counting it as a symptom of other conditions; patients could contribute to multiple individual outcomes. Among GLP-1 users, exposure–response variables included maximum 12-month weight loss (% body weight), baseline and change in BMI, baseline and change in HbA1c, prescription count, and a high-incretin-dose indicator (tirzepatide ≥10 mg or semaglutide ≥1 mg). These defined ordered strata for exposure-gradient analyses and served as candidate features for enrichment analysis.
Statistical Analysis
Cumulative 12-month incidence was reported with Wilson score 95% CIs, overall and by exposure stratum. Matched comparisons used relative risk (Katz CI) with chi-square or Fisher's exact tests; ordered strata were tested via Cochran–Armitage trend test. Time-to-event curves used a one-month landmark to exclude a post-index documentation-clustering artefact, with Wilson confidence bands and log-rank tests (landmarked incidence therefore runs below the full 12-month incidence reported elsewhere). Feature enrichment in the unmatched GLP-1 cohort used Woolf odds ratios (logit CI) with Yates-corrected chi-square tests. Multiple-hypothesis correction throughout used the Benjamini–Hochberg procedure (q < 0.05 significant).
Control Analyses
Negative-control outcomes not expected to associated with GLP-1 exposure were evaluated in matched cohorts, with relative risks near one supporting the absence of systematic bias. Positive-control analysis of gastrointestinal symptoms (nausea, vomiting, constipation, diarrhoea) confirmed expected drug effects: higher incidence versus anti-diabetic therapy, and lower incidence versus bariatric surgery, consistent with known adverse-effect profiles.
Statistical Analysis Plan for Study Advancement
The analytic approach followed established pharmacoepidemiologic and biostatistical conventions, reported per STROBE and RECORD[24,25]. Covariate balance was assessed by SMD (>0.1 indicating residual imbalance); incidence was compared by relative risk with Katz CIs, supplemented by chi-square or Fisher's exact tests for sparse strata, and ordered-stratum trends by Cochran–Armitage[26,27,28,29]. Time-to-event comparisons used log-rank tests on landmarked curves to avoid post-index ascertainment artefact, and feature–outcome associations used Woolf odds ratios with Yates-corrected significance testing[30,31,32,33]. Multiplicity was controlled by Benjamini–Hochberg correction within each prespecified comparison family (q < 0.05 significant), and ascertainment/confounding bias was bounded by prespecified negative- and positive-control analyses[34,35]. Endpoints, comparison families, matching specifications, and small-cell suppression rules were fixed prior to outcome analysis[36].
Institutional Review Board Statement, Informed Consent Statement, De-identification and HIPAA Compliance Certification
Prior to analysis, all EHR data were de-identified under an expert determination consistent with the Health Insurance Portability and Accountability Act (HIPAA) Privacy Rule (45 CFR §164.514(b)(1)). The de-identification methodology[37,38] employed a multi-layered transformation approach to both structured and unstructured data fields. In structured data, direct identifiers including patient names and precise geographic locations were excluded entirely, while indirect identifiers underwent specific transformations: patient identifiers, medical record numbers, and accession numbers were replaced with one-way cryptographic hashes using confidential salts to preserve linkage across patient encounters; all dates were shifted backward by patient-specific random offsets (1 to 31 days) to preserve temporal relationships while obscuring exact event timing; ZIP codes were truncated to two-digit state-level resolution; and continuous variables including age, height, weight, and body mass index were thresholded to prevent identification of extreme values (for example, ages 89 years or older transformed to '89+' and BMI over 40 transformed to '40+'). In clinical text, an ensemble de-identification system that combines attention-based deep learning with rule-based methods achieved an estimated >99% recall for personally identifiable information (PII) detection, with detected identifiers replaced by plausible fictional surrogates. Institutional Review Board Statement and Informed Consent Statement are not applicable.
Data Harmonization
To address heterogeneity in EHR data, we harmonized clinical variables including medications, anthropometric measurements, and diagnoses to standardized concepts. For medications, we first constructed a standardized drug concept database combining the nference knowledge graph with RxNorm hierarchies to capture ingredient, brand, and dose-specific information. Medication records were matched using a hierarchical approach prioritizing RxNorm codes when available, followed by ingredient-level matching, and finally natural language processing and pattern matching on free-text medication orders when structured codes were absent. For anthropometric measurements (height, weight, body mass index), we created a unified vocabulary from SNOMED and LOINC and matched EHR measurement descriptions using standardized text matching algorithms with abbreviation expansion and synonym resolution; ambiguous mappings were resolved using OpenAI GPT-4o with summary statistics as context, followed by manual verification. For diagnoses, we developed a hierarchical disease concept database from the knowledge graph and matched EHR diagnosis records by identifying the most specific common child concept in the hierarchy.
Author Contributions
Venky Soundararajan conceived and supervised the study. Adhikaar Marwaha designed the study, performed the analyses, and prepared the visualizations. Karthik Murugadoss and A.J. Venkatakrishnan contributed to analysis, interpretation, and manuscript preparation. All authors prepared, reviewed, and approved the final manuscript.
Funding
No external funding was received for this study.
Data availability
This study analyzed de-identified electronic health record data. The data were extracted under an established privacy-preserving protocol and cannot be shared beyond what is reported here due to the parameters of the expert determination.
Code Availability
The analysis code is not publicly available. Please contact the corresponding author for details.
Acknowledgements
The authors thank Patrick Lenehan for thorough review of the manuscript.
Competing Interest Statement
The authors are employees of nference, inc., which conducts research collaborations with various biopharmaceutical companies whose therapeutic products are included in this study. None of these companies, nor any other nference collaborator, funded, supported, or had any role in the independent study design, data acquisition, analysis, interpretation, manuscript preparation, or the decision to submit this work for publication. All analyses were conducted by the authors using de-identified electronic health record data. The authors declare no additional competing interests.
References
- Ukhanova, M.; Wozny, J. S.; Truong, C. N.; Ghosh, L.; Krause, T. M. Trends in glucagon-like peptide 1 receptor agonist prescribing patterns. Am. J. Manag Care 2025, 31, e228–e234. [Google Scholar] [CrossRef]
- Wu, J.; Perez, A.; Sullivan, P. W. Patterns and costs associated with glucagon-like peptide-1 receptor agonist use in US adults with type 2 diabetes. J. Manag Care Spec. Pharm. 2025, 31, 1029–1038. [Google Scholar] [CrossRef]
- Wilding, J. P. H.; et al. Once-Weekly Semaglutide in Adults with Overweight or Obesity. N Engl. J. Med. 2021, 384, 989–1002. [Google Scholar] [CrossRef]
- Frías, J. P.; et al. Tirzepatide versus Semaglutide Once Weekly in Patients with Type 2 Diabetes. N Engl. J. Med. 2021, 385, 503–515. [Google Scholar] [CrossRef]
- Marso, S. P.; et al. Semaglutide and cardiovascular outcomes in patients with type 2 diabetes. N. Engl. J. Med. 2016, 375, 1834–1844. [Google Scholar] [CrossRef] [PubMed]
- Jastreboff, A. M.; et al. Tirzepatide Once Weekly for the Treatment of Obesity. N Engl. J. Med. 2022, 387, 205–216. [Google Scholar] [CrossRef]
- Hoog, M. M.; et al. Real-World Effectiveness of Tirzepatide versus Semaglutide on HbA1c and Weight in Patients with Type 2 Diabetes. Diabetes Ther. 2025, 16, 2237–2256. [Google Scholar] [CrossRef]
- Venkatakrishnan, A. J.; Murugadoss, K.; Soundararajan, V. Weight-loss dynamics with tirzepatide versus semaglutide. PNAS Nexus 2026, 5, gag171. [Google Scholar] [CrossRef]
- Xie, L.; et al. Glucagon-Like Peptide-1 Receptor Agonist Switching and Treatment Persistence in Adults Without Diabetes. JAMA Netw. Open 2026, 9, e261272. [Google Scholar] [CrossRef]
- Donnelly, L. A.; Singh, K.; McCrimmon, R. J.; Pearson, E. R. One-year usage patterns of SGLT-2 inhibitors and GLP-1 receptor agonists in individuals with type 2 diabetes in a real-world population. Diabetes Obes. Metab. 2026, 28, 972–981. [Google Scholar] [CrossRef]
- Meyer, K. B.; et al. Real-world 6-month persistence, adherence, and effectiveness of GLP-1 medications for overweight and obesity in a Medicaid population. J. Manag Care Spec. Pharm. 2026, 32, 271–280. [Google Scholar] [CrossRef]
- Xu, Y.; et al. Titration and discontinuation of semaglutide for weight management in commercially insured US adults. Obesity 2025, 33, 1243–1248. [Google Scholar] [CrossRef]
- Rodriguez, P. J.; et al. Discontinuation and reinitiation of dual-labeled GLP-1 receptor agonists among US adults with overweight or obesity. JAMA Netw. Open 2025, 8, e2457349. [Google Scholar] [CrossRef] [PubMed]
- Kofman, K.; Ouanounou, A. Oral Health Considerations and Dental Management Guidelines for Semaglutide Medications. Can. J. Diabetes 2026. [Google Scholar] [CrossRef]
- Mawardi, H. H.; et al. Semaglutide-associated hyposalivation: A report of case series. Medicine 2023, 102, e36730. [Google Scholar] [CrossRef]
- Bernardo, M. E.; Dallepiane, F. G.; Escobar, M.; Cruz, A. C. C.; Benfatti, C. A. M. Semaglutide and tirzepatide: Oral cavity effects of weight-loss therapies. EXCLI J. 2026, 25, 167–169. [Google Scholar] [CrossRef]
- Hyldmo, Å. A.; et al. Chronic Abdominal Pain and Gastrointestinal Symptoms 12 Years After Primary Roux-en-Y Gastric Bypass: A Cross-Sectional Controlled Study. Obes. Surg. 2025, 35, 2638–2646. [Google Scholar] [CrossRef]
- Carey, I. M.; et al. Body mass index and infection risks in people with and without type 2 diabetes: A cohort study using electronic health records. Int. J. Obes. (Lond) 2025, 49, 1800–1809. [Google Scholar] [CrossRef]
- Critchley, J. A.; et al. Increased Risk of Infections in People Living With Diabetes. Diabetes 2026, 75, 1381–1389. [Google Scholar] [CrossRef]
- Schwendicke, F.; Uribe, S. E.; Walji, M.; Lam, W.; Tichy, A. Electronic Health Records in Dentistry: Relevance, Challenges and Policy Directions. Int. Dent. J. 2025, 75, 103964. [Google Scholar] [CrossRef]
- Tokede, O.; Ramoni, R. B.; Patton, M.; Da Silva, J. D.; Kalenderian, E. Clinical documentation of dental care in an era of electronic health record use. J. Evid. Based Dent. Pract. 2016, 16, 154–160. [Google Scholar] [CrossRef]
- Azadani, E. N.; McDaniel, J.; Peng, J.; Townsend, J. A. The Validity of ICD-10 Codes in Recording the Incidence of Traumatic Dental Injuries. Dent. Traumatol. 2026. [Google Scholar] [CrossRef]
- Nelson, S. J.; et al. Are ICD codes reliable for observational studies? Assessing coding consistency for data quality. Digit Health 2024, 10, 20552076241297056. [Google Scholar] [CrossRef]
- von Elm, E.; et al. The Strengthening the Reporting of Observational Studies in Epidemiology (STROBE) statement: guidelines for reporting observational studies. PLoS Med. 2007, 4, e296. [Google Scholar] [CrossRef] [PubMed]
- Benchimol, E. I.; et al. The REporting of studies Conducted using Observational Routinely-collected health Data (RECORD) statement. PLoS Med. 2015, 12, e1001885. [Google Scholar] [CrossRef] [PubMed]
- Hall, D. B. Analysis of surveillance data: a rationale for statistical tests with comments on confidence intervals and statistical models. Stat. Med. 1989, 8, 273–8; discussion 279–81. [Google Scholar] [CrossRef]
- Bechhofer, R. E.; Blumenthal, S. A sequential multiple-decision procedure for selecting the best one of several normal populations with a common unknown variance, II: Monte Carlo sampling results and new computing formulae. Biometrics 1962, 18, 52. [Google Scholar] [CrossRef]
- Cochran, W. G. Some methods for strengthening the common χ 2 tests. Biometrics 1954, 10, 417. [Google Scholar] [CrossRef]
- Rao, C. R.; Chakravarti, I. M. Some small sample tests of significance for a Poisson distribution. Biometrics 1956, 12, 264. [Google Scholar] [CrossRef]
- Gehan, E. A. A generalized wilcoxon test for comparing arbitrarily singly-censored samples. Biometrika 1965, 52, 203–223. [Google Scholar] [CrossRef]
- Weinstein, M. C. Allocation of subjects in medical experiments. N. Engl. J. Med. 1974, 291, 1278–1285. [Google Scholar] [CrossRef]
- Woolf, B. On estimating the relation between blood group and disease. Ann. Hum. Genet. 1955, 19, 251–253. [Google Scholar] [CrossRef]
- Yates, F. Contingency tables involving small numbers and the χ2 test. J. R. Stat. Soc. Ser. B Stat. Methodol. 1934, 1, 217–235. [Google Scholar] [CrossRef]
- Benjamini, Y.; Hochberg, Y. Controlling the false discovery rate: A practical and powerful approach to multiple testing. J. R. Stat. Soc. Ser. B Stat. Methodol. 1995, 57, 289–300. [Google Scholar] [CrossRef]
- Chang, V. C.; Do, M. T. Risk factors for falls among seniors: implications of gender. Am. J. Epidemiol. 2015, 181, 521–531. [Google Scholar] [CrossRef]
- Kottner, J.; et al. Guidelines for Reporting Reliability and Agreement Studies (GRRAS) were proposed. J. Clin. Epidemiol. 2011, 64, 96–106. [Google Scholar] [CrossRef] [PubMed]
- Murugadoss, K.; et al. Building a best-in-class automated de-identification tool for electronic health records through ensemble learning. Patterns (N. Y.) 2021, 2, 100255. [Google Scholar] [CrossRef]
- Murugadoss, K.; et al. Scaling text de-identification using locally augmented ensembles. medRxiv 2024. [Google Scholar] [CrossRef]
Figure 1.
Study cohorts and covariate balance. (A) Construction of the study cohorts: new users of GLP-1 receptor agonists, anti-diabetic therapy and bariatric surgery were assembled with a common persistence and follow-up requirement and separately matched one-to-one by propensity score; counts are pooled across the U.S. federated data network. (B, C) Covariate balance before and after propensity-score matching versus anti-diabetic therapy (B) and bariatric surgery (C). Standardized mean differences before (open circles) and after (green where balance was achieved, red otherwise) matching are shown; the shaded band marks the acceptable region (absolute standardized mean difference below 0.1). The shaded upper block, above the divider, holds the covariates used for matching (all balanced after matching); the block below holds additional baseline covariates that were not used in the propensity model and are shown only for descriptive comparison, so residual imbalance there is expected. The anti-diabetic comparison used a five-covariate propensity score (PS-5: age, body-mass index, type 2 diabetes, sex and race), and the bariatric comparison a six-covariate propensity score (PS-6: the same five covariates plus twelve-month weight loss). Accordingly, achieved weight loss was a matching variable only for the bariatric comparison; for the anti-diabetic comparison it is shown as a descriptor, as it lies on the treatment–outcome pathway. The associated data are summarised in Table 1 and Table 2.
Figure 1.
Study cohorts and covariate balance. (A) Construction of the study cohorts: new users of GLP-1 receptor agonists, anti-diabetic therapy and bariatric surgery were assembled with a common persistence and follow-up requirement and separately matched one-to-one by propensity score; counts are pooled across the U.S. federated data network. (B, C) Covariate balance before and after propensity-score matching versus anti-diabetic therapy (B) and bariatric surgery (C). Standardized mean differences before (open circles) and after (green where balance was achieved, red otherwise) matching are shown; the shaded band marks the acceptable region (absolute standardized mean difference below 0.1). The shaded upper block, above the divider, holds the covariates used for matching (all balanced after matching); the block below holds additional baseline covariates that were not used in the propensity model and are shown only for descriptive comparison, so residual imbalance there is expected. The anti-diabetic comparison used a five-covariate propensity score (PS-5: age, body-mass index, type 2 diabetes, sex and race), and the bariatric comparison a six-covariate propensity score (PS-6: the same five covariates plus twelve-month weight loss). Accordingly, achieved weight loss was a matching variable only for the bariatric comparison; for the anti-diabetic comparison it is shown as a descriptor, as it lies on the treatment–outcome pathway. The associated data are summarised in Table 1 and Table 2.
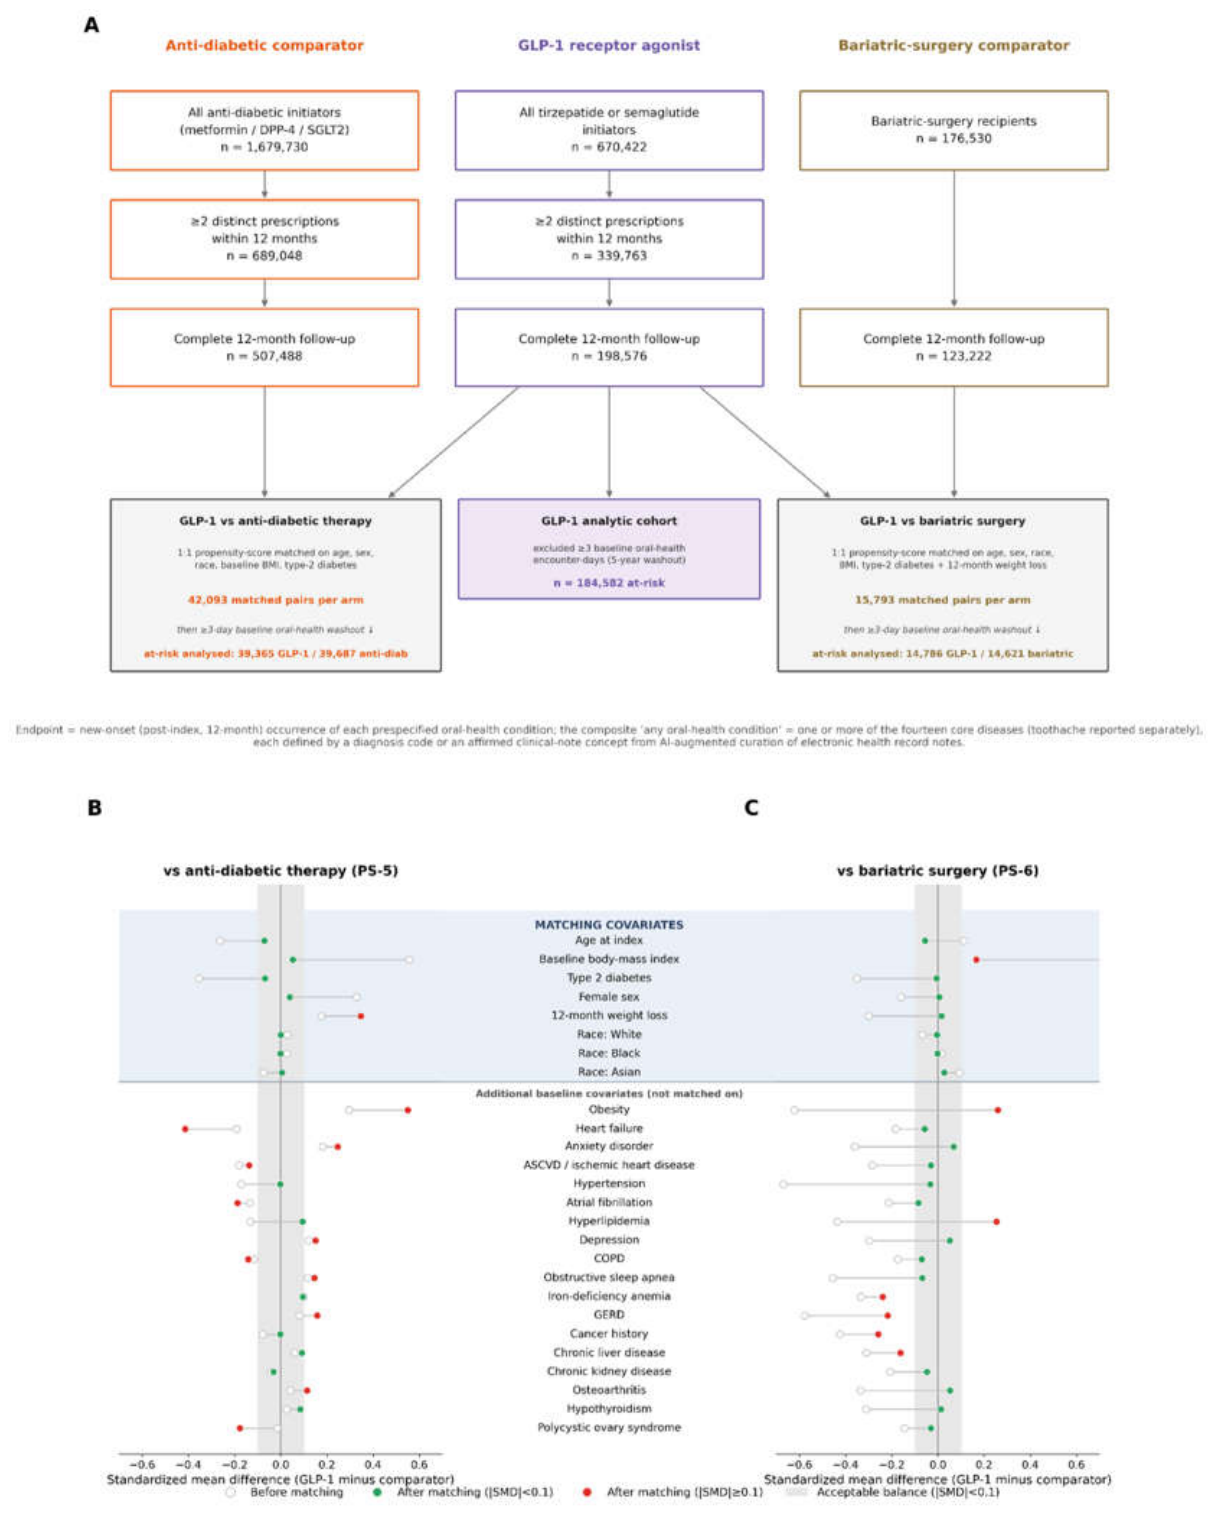
Figure 2.
Twelve-month new-onset incidence of oral-health conditions in the GLP-1 receptor agonist cohort. Twelve-month incidence of each new-onset oral-health condition among the 184,582 at-risk new users, shown as a percentage with the Wilson 95% confidence interval and the number of new-onset cases beside each bar. The composite ‘any oral-health condition’ (top bar) is one or more of the fourteen core diseases. The associated data are summarised in Table 4.
Figure 2.
Twelve-month new-onset incidence of oral-health conditions in the GLP-1 receptor agonist cohort. Twelve-month incidence of each new-onset oral-health condition among the 184,582 at-risk new users, shown as a percentage with the Wilson 95% confidence interval and the number of new-onset cases beside each bar. The composite ‘any oral-health condition’ (top bar) is one or more of the fourteen core diseases. The associated data are summarised in Table 4.
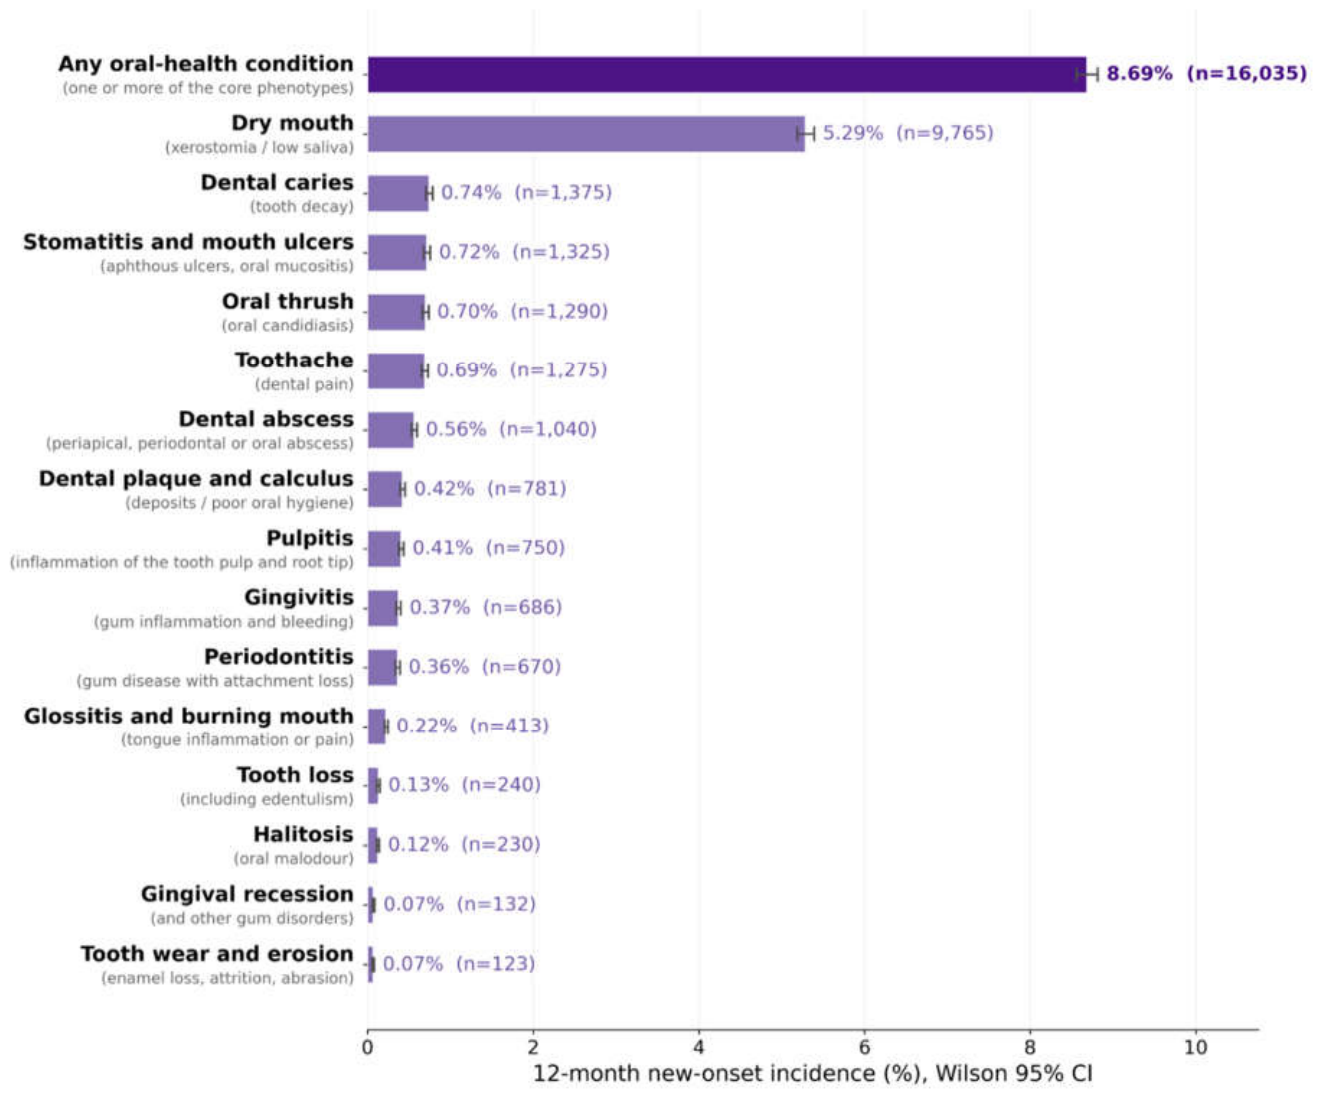
Figure 4.
Twelve-month relative risk of new-onset oral-health disease in the two propensity-score-matched comparisons. Relative risk of each new-onset oral-health condition for GLP-1 receptor agonists versus matched anti-diabetic therapy (A) and versus matched bariatric surgery (B); points are relative risks with 95% confidence intervals on a logarithmic scale, ordered from the lowest ratio, and are purple where incidence was lower with GLP-1 (ratio below one) or, respectively, orange or brown where it was lower with the comparator (ratio above one). Conditions significant after Benjamini–Hochberg false-discovery-rate correction (q<0.05) are shown in bold. The per-arm twelve-month incidence (percentage and new-onset cases over at-risk patients) is listed beside each forest; where fewer than eleven cases occurred in an arm the counts are shown as <11. The associated data are summarised in Table 5 and Table 6.
Figure 4.
Twelve-month relative risk of new-onset oral-health disease in the two propensity-score-matched comparisons. Relative risk of each new-onset oral-health condition for GLP-1 receptor agonists versus matched anti-diabetic therapy (A) and versus matched bariatric surgery (B); points are relative risks with 95% confidence intervals on a logarithmic scale, ordered from the lowest ratio, and are purple where incidence was lower with GLP-1 (ratio below one) or, respectively, orange or brown where it was lower with the comparator (ratio above one). Conditions significant after Benjamini–Hochberg false-discovery-rate correction (q<0.05) are shown in bold. The per-arm twelve-month incidence (percentage and new-onset cases over at-risk patients) is listed beside each forest; where fewer than eleven cases occurred in an arm the counts are shown as <11. The associated data are summarised in Table 5 and Table 6.
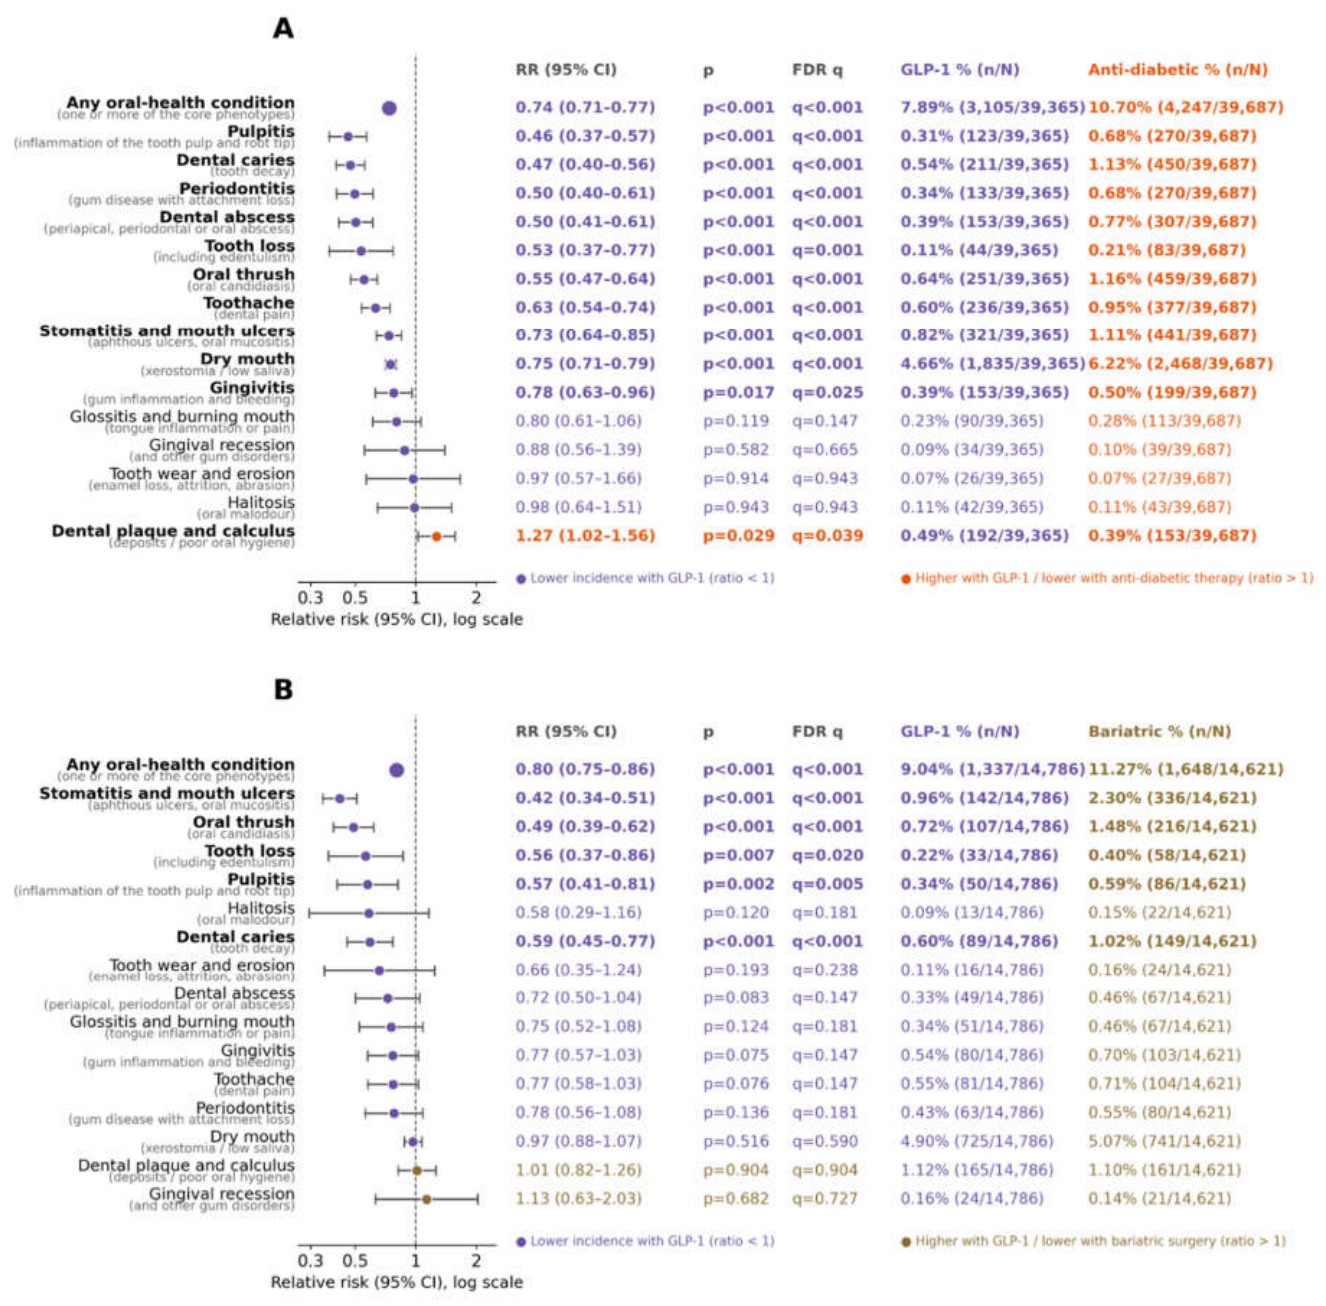
Figure 5.
Cumulative incidence of new-onset oral-health disease in the propensity-score-matched comparisons. (A, B) Cumulative incidence of any oral-health condition for GLP-1 receptor agonists versus matched anti-diabetic therapy (A) and versus matched bariatric surgery (B), plotted from a one-month landmark (index date plus one month, to avoid a coding-delay artefact at initiation; because this first post-index month is excluded, the landmarked curves run marginally below the full twelve-month incidence reported in Table 5 and Table 6) and expressed as a percentage of the at-risk matched cohort, with shaded pointwise Wilson 95% confidence bands and the log-rank P for the between-arm comparison; the number remaining at risk (event-free) is tabulated beneath each panel. The GLP-1 arm differs between comparisons because it was matched separately to each comparator. (C) Cumulative incidence of each higher-prevalence condition (those with more than eleven new-onset cases in both arms of both comparisons), versus matched anti-diabetic therapy (left) and versus matched bariatric surgery (right), with shaded 95% confidence bands and the log-rank P per panel. The associated data are summarised in Table 5 and Table 6.
Figure 5.
Cumulative incidence of new-onset oral-health disease in the propensity-score-matched comparisons. (A, B) Cumulative incidence of any oral-health condition for GLP-1 receptor agonists versus matched anti-diabetic therapy (A) and versus matched bariatric surgery (B), plotted from a one-month landmark (index date plus one month, to avoid a coding-delay artefact at initiation; because this first post-index month is excluded, the landmarked curves run marginally below the full twelve-month incidence reported in Table 5 and Table 6) and expressed as a percentage of the at-risk matched cohort, with shaded pointwise Wilson 95% confidence bands and the log-rank P for the between-arm comparison; the number remaining at risk (event-free) is tabulated beneath each panel. The GLP-1 arm differs between comparisons because it was matched separately to each comparator. (C) Cumulative incidence of each higher-prevalence condition (those with more than eleven new-onset cases in both arms of both comparisons), versus matched anti-diabetic therapy (left) and versus matched bariatric surgery (right), with shaded 95% confidence bands and the log-rank P per panel. The associated data are summarised in Table 5 and Table 6.
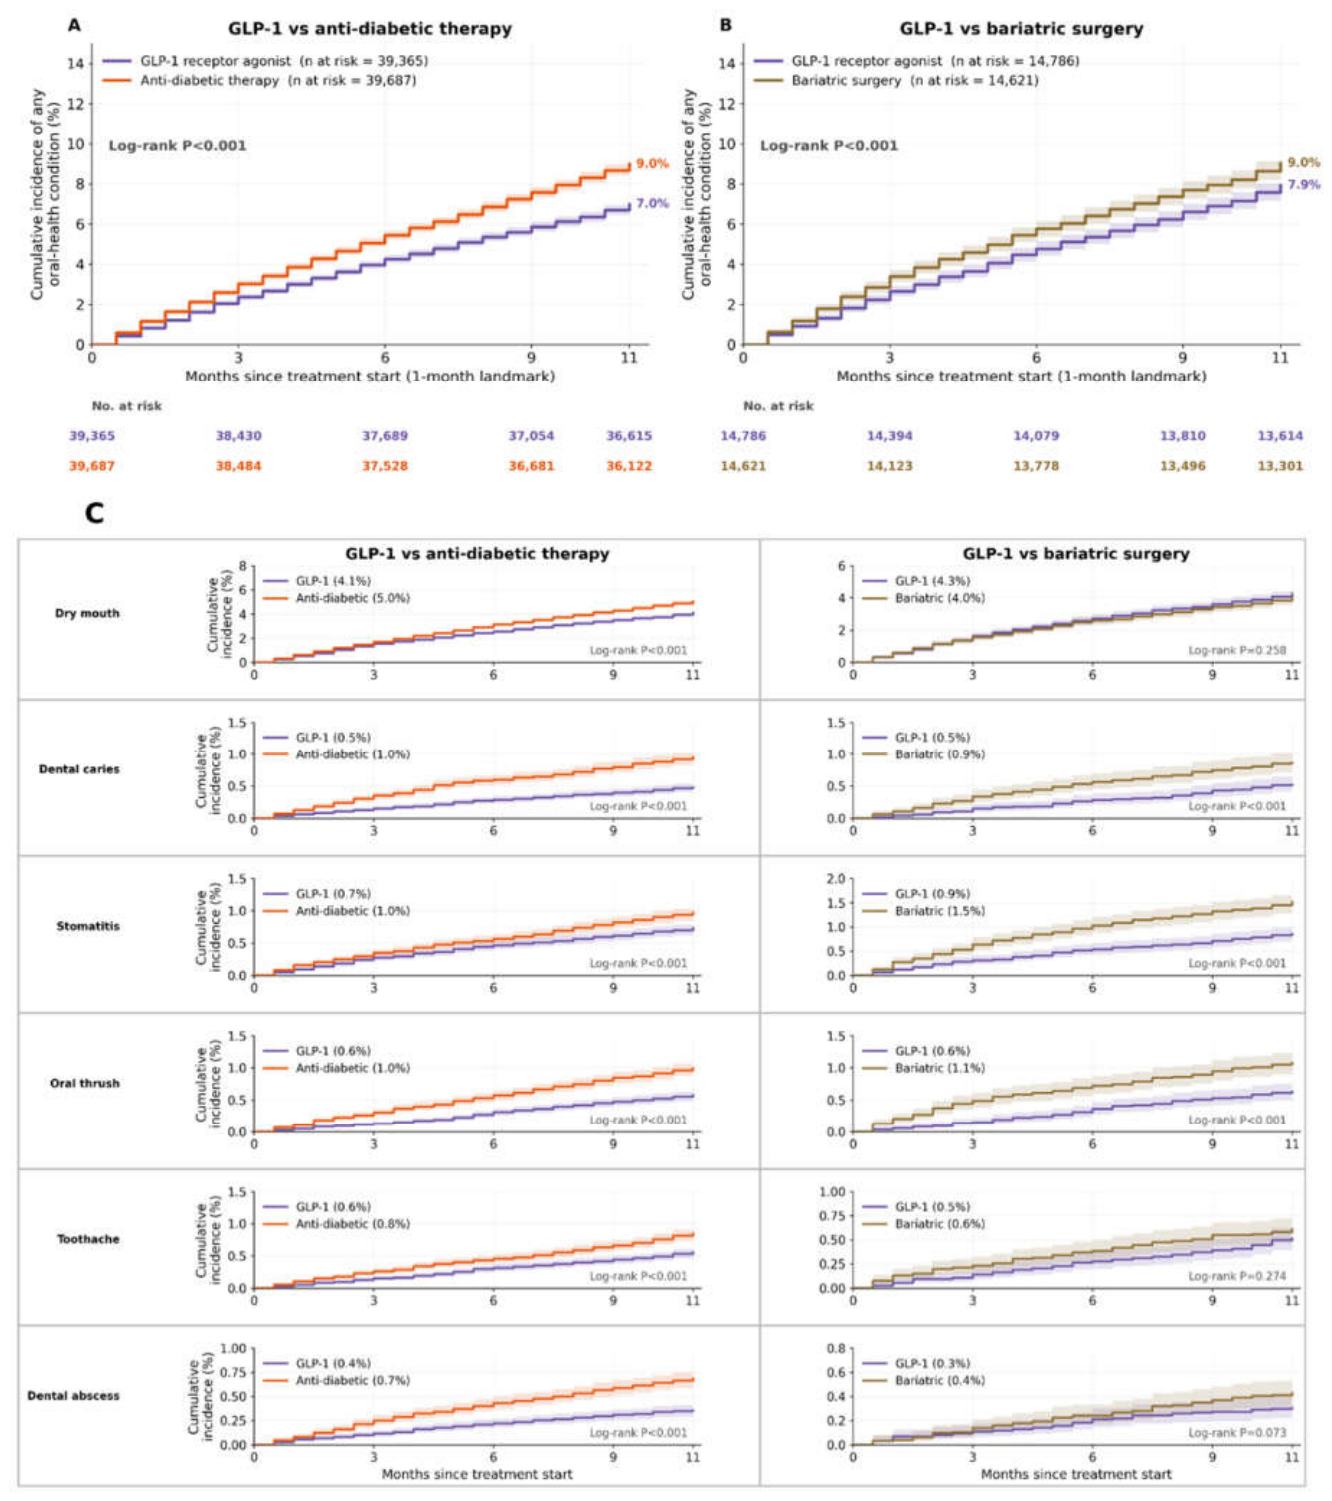
Table 1.
Baseline characteristics of the propensity-score-matched cohorts, GLP-1 receptor agonist versus anti-diabetic therapy.
Table 1.
Baseline characteristics of the propensity-score-matched cohorts, GLP-1 receptor agonist versus anti-diabetic therapy.
| Characteristic | GLP-1 receptor agonist | Anti-diabetic therapy | SMD |
| Age at index, years | 51.8 (13.9) | 52.9 (17.9) | -0.07 |
| Body-mass index, kg/m² | 36.0 (5.9) | 35.7 (6.3) | +0.05 |
| 12-month weight loss, % | 13.2 (10.4) | 9.6 (10.4) | +0.35 |
| Type 2 diabetes | 23.0 | 25.9 | -0.07 |
| Female sex | 72.4 | 70.6 | +0.04 |
| ASCVD / ischemic heart disease | 13.8 | 18.9 | -0.14 |
| Anxiety disorder | 39.9 | 28.3 | +0.25 |
| Atrial fibrillation | 5.0 | 9.9 | -0.19 |
| COPD | 4.2 | 7.5 | -0.14 |
| Cancer history | 10.9 | 11.0 | -0.00 |
| Chronic kidney disease | 10.7 | 11.6 | -0.03 |
| Chronic liver disease | 11.2 | 8.5 | +0.09 |
| Depression | 24.0 | 17.9 | +0.15 |
| GERD | 33.8 | 26.6 | +0.16 |
| Heart failure | 4.6 | 17.3 | -0.41 |
| Hyperlipidemia | 52.7 | 48.0 | +0.09 |
| Hypertension | 52.2 | 52.3 | -0.00 |
| Hypothyroidism | 18.8 | 15.7 | +0.08 |
| Iron-deficiency anemia | 10.3 | 7.6 | +0.09 |
| Obesity | 75.9 | 50.3 | +0.55 |
| Obstructive sleep apnea | 27.2 | 21.0 | +0.15 |
| Osteoarthritis | 26.0 | 21.2 | +0.11 |
| Polycystic ovary syndrome | 3.5 | 7.6 | -0.18 |
Table 2.
Baseline characteristics of the propensity-score-matched cohorts, GLP-1 receptor agonist versus bariatric surgery.
Table 2.
Baseline characteristics of the propensity-score-matched cohorts, GLP-1 receptor agonist versus bariatric surgery.
| Characteristic | GLP-1 receptor agonist | Bariatric surgery | SMD |
| Age at index, years | 53.7 (13.7) | 54.5 (14.1) | -0.06 |
| Body-mass index, kg/m² | 34.1 (4.6) | 33.4 (4.6) | +0.17 |
| 12-month weight loss, % | 13.0 (10.0) | 12.9 (13.3) | +0.02 |
| Type 2 diabetes | 22.1 | 22.3 | -0.01 |
| Female sex | 69.8 | 69.5 | +0.01 |
| ASCVD / ischemic heart disease | 16.1 | 17.2 | -0.03 |
| Anxiety disorder | 35.9 | 32.7 | +0.07 |
| Atrial fibrillation | 5.7 | 7.9 | -0.08 |
| COPD | 3.4 | 4.8 | -0.07 |
| Cancer history | 14.9 | 25.2 | -0.26 |
| Chronic kidney disease | 11.7 | 13.3 | -0.05 |
| Chronic liver disease | 12.5 | 18.4 | -0.16 |
| Depression | 20.6 | 18.6 | +0.05 |
| GERD | 32.2 | 42.7 | -0.22 |
| Heart failure | 5.5 | 6.9 | -0.06 |
| Hyperlipidemia | 53.9 | 41.4 | +0.25 |
| Hypertension | 52.3 | 54.0 | -0.03 |
| Hypothyroidism | 17.2 | 16.7 | +0.01 |
| Iron-deficiency anemia | 8.6 | 16.5 | -0.24 |
| Obesity | 70.1 | 57.8 | +0.26 |
| Obstructive sleep apnea | 26.6 | 29.7 | -0.07 |
| Osteoarthritis | 27.9 | 25.6 | +0.05 |
| Polycystic ovary syndrome | 2.6 | 3.1 | -0.03 |
Continuous variables are shown as mean (standard deviation); binary variables as percentages. SMD denotes the standardized mean difference after matching; |SMD|≥0.1 (shown in bold) indicates residual imbalance. Counts below eleven are shown as <11.
Table 3.
Patient counts across the therapeutic brands and active ingredients analyzed in this study, before and after propensity-score matching.
Table 3.
Patient counts across the therapeutic brands and active ingredients analyzed in this study, before and after propensity-score matching.
| Active ingredient | Pharmacologic class | Marketed brand | Pre-matching (N) | Matched vs anti-diabetic, PS-5 (N) | Matched vs bariatric, PS-6 (N) |
| Semaglutide | GLP-1 receptor agonist | Any brand | 167,520 | 28,797 | 11,506 |
| GLP-1 receptor agonist | Ozempic | 113,292 | 14,761 | 5,887 | |
| GLP-1 receptor agonist | Rybelsus | 16,080 | 1,469 | 620 | |
| GLP-1 receptor agonist | Wegovy | 47,504 | 13,304 | 6,044 | |
| Tirzepatide | Dual GIP and GLP-1 receptor agonist | Any brand | 111,687 | 16,255 | 5,564 |
| Dual GIP and GLP-1 receptor agonist | Mounjaro | 76,641 | 8,398 | 2,366 | |
| Dual GIP and GLP-1 receptor agonist | Zepbound | 41,157 | 9,281 | 3,373 | |
| Alogliptin | DPP-4 inhibitor | — | 3,199 | 47 | — |
| Canagliflozin | SGLT2 inhibitor | — | 21,731 | 106 | — |
| Dapagliflozin | SGLT2 inhibitor | — | 63,703 | 4,350 | — |
| Empagliflozin | SGLT2 inhibitor | — | 128,807 | 6,821 | — |
| Ertugliflozin | SGLT2 inhibitor | — | 403 | <11 | — |
| Linagliptin | DPP-4 inhibitor | — | 20,525 | 199 | — |
| Metformin | Biguanide | — | 462,010 | 33,255 | — |
| Saxagliptin | DPP-4 inhibitor | — | 10,307 | 29 | — |
| Sitagliptin | DPP-4 inhibitor | — | 92,200 | 713 | — |
Counts are distinct patients within each analyzed cohort; brand rows are derived from the raw drug descriptions, so a patient prescribed more than one brand of the same ingredient is counted under each brand and combination products contribute to each constituent ingredient. “Any brand” denotes all patients on that ingredient regardless of marketed product. PS-5 matched the GLP-1 and anti-diabetic cohorts; PS-6 matched the GLP-1 and bariatric cohorts; an em dash indicates a cell not applicable to that comparison. Counts below eleven are shown as <11.
Table 4.
Twelve-month incidence of new-onset oral-health conditions in GLP-1 receptor agonist new users. Incidence is shown as a percentage with the Wilson 95% confidence interval.
Table 4.
Twelve-month incidence of new-onset oral-health conditions in GLP-1 receptor agonist new users. Incidence is shown as a percentage with the Wilson 95% confidence interval.
| Oral-health condition | At risk (N) | New-onset (n) | Incidence (%) | 95% CI |
| Any oral-health condition | 184,582 | 16,035 | 8.69 | 8.56–8.82 |
| Dry mouth | 184,582 | 9,765 | 5.29 | 5.19–5.39 |
| Dental caries | 184,582 | 1,375 | 0.74 | 0.71–0.79 |
| Stomatitis and mouth ulcers | 184,582 | 1,325 | 0.72 | 0.68–0.76 |
| Oral thrush | 184,582 | 1,290 | 0.70 | 0.66–0.74 |
| Toothache | 184,582 | 1,275 | 0.69 | 0.65–0.73 |
| Dental abscess | 184,582 | 1,040 | 0.56 | 0.53–0.60 |
| Dental plaque and calculus | 184,582 | 781 | 0.42 | 0.39–0.45 |
| Pulpitis | 184,582 | 750 | 0.41 | 0.38–0.44 |
| Gingivitis | 184,582 | 686 | 0.37 | 0.34–0.40 |
| Periodontitis | 184,582 | 670 | 0.36 | 0.34–0.39 |
| Glossitis and burning mouth | 184,582 | 413 | 0.22 | 0.20–0.25 |
| Tooth loss | 184,582 | 240 | 0.13 | 0.11–0.15 |
| Halitosis | 184,582 | 230 | 0.12 | 0.11–0.14 |
| Gingival recession | 184,582 | 132 | 0.07 | 0.06–0.08 |
| Tooth wear and erosion | 184,582 | 123 | 0.07 | 0.06–0.08 |
Table 5.
Relative risk of new-onset oral-health conditions, GLP-1 receptor agonist versus matched anti-diabetic therapy. p from the chi-square test (Fisher’s exact test for sparse strata); q, Benjamini–Hochberg false-discovery rate. Counts below eleven are shown as <11. Conditions with q<0.05 shown in bold.
Table 5.
Relative risk of new-onset oral-health conditions, GLP-1 receptor agonist versus matched anti-diabetic therapy. p from the chi-square test (Fisher’s exact test for sparse strata); q, Benjamini–Hochberg false-discovery rate. Counts below eleven are shown as <11. Conditions with q<0.05 shown in bold.
| Oral-health condition | GLP-1 events/at-risk | Comparator events/at-risk | Relative risk | 95% CI | p | q (FDR) |
| Any oral-health condition | 3,105/39,365 | 4,247/39,687 | 0.74 | 0.71–0.77 | <0.001 | <0.001 |
| Xerostomia / dry mouth / salivary hypofunction | 1,835/39,365 | 2,468/39,687 | 0.75 | 0.71–0.79 | <0.001 | <0.001 |
| Dental caries / tooth decay | 211/39,365 | 450/39,687 | 0.47 | 0.40–0.56 | <0.001 | <0.001 |
| Stomatitis, oral mucositis and aphthous ulcers | 321/39,365 | 441/39,687 | 0.73 | 0.64–0.85 | <0.001 | <0.001 |
| Oral candidiasis / thrush | 251/39,365 | 459/39,687 | 0.55 | 0.47–0.64 | <0.001 | <0.001 |
| Toothache / dental pain | 236/39,365 | 377/39,687 | 0.63 | 0.54–0.74 | <0.001 | <0.001 |
| Dental, periapical or oral abscess | 153/39,365 | 307/39,687 | 0.50 | 0.41–0.61 | <0.001 | <0.001 |
| Dental deposits and poor oral hygiene | 192/39,365 | 153/39,687 | 1.27 | 1.02–1.56 | 0.029 | 0.039 |
| Pulpitis and periapical inflammation | 123/39,365 | 270/39,687 | 0.46 | 0.37–0.57 | <0.001 | <0.001 |
| Gingivitis | 153/39,365 | 199/39,687 | 0.78 | 0.63–0.96 | 0.017 | 0.025 |
| Periodontitis / periodontal disease | 133/39,365 | 270/39,687 | 0.50 | 0.40–0.61 | <0.001 | <0.001 |
| Glossitis and burning mouth / glossodynia | 90/39,365 | 113/39,687 | 0.80 | 0.61–1.06 | 0.119 | 0.147 |
| Tooth loss / edentulism | 44/39,365 | 83/39,687 | 0.53 | 0.37–0.77 | <0.001 | 0.001 |
| Halitosis (oral malodor) | 42/39,365 | 43/39,687 | 0.98 | 0.64–1.51 | 0.943 | 0.943 |
| Gingival recession and other gingival disorders | 34/39,365 | 39/39,687 | 0.88 | 0.56–1.39 | 0.582 | 0.665 |
| Dental hard-tissue wear and erosion | 26/39,365 | 27/39,687 | 0.97 | 0.57–1.66 | 0.914 | 0.943 |
Table 6.
Relative risk of new-onset oral-health conditions, GLP-1 receptor agonist versus matched bariatric surgery. p from the chi-square test (Fisher’s exact test for sparse strata); q, Benjamini–Hochberg false-discovery rate. Counts below eleven are shown as <11. Conditions with q<0.05 shown in bold.
Table 6.
Relative risk of new-onset oral-health conditions, GLP-1 receptor agonist versus matched bariatric surgery. p from the chi-square test (Fisher’s exact test for sparse strata); q, Benjamini–Hochberg false-discovery rate. Counts below eleven are shown as <11. Conditions with q<0.05 shown in bold.
| Oral-health condition | GLP-1 events/at-risk | Comparator events/at-risk | Relative risk | 95% CI | p | q (FDR) |
| Any oral-health condition | 1,337/14,786 | 1,648/14,621 | 0.80 | 0.75–0.86 | <0.001 | <0.001 |
| Xerostomia / dry mouth / salivary hypofunction | 725/14,786 | 741/14,621 | 0.97 | 0.88–1.07 | 0.516 | 0.590 |
| Dental caries / tooth decay | 89/14,786 | 149/14,621 | 0.59 | 0.45–0.77 | <0.001 | <0.001 |
| Stomatitis, oral mucositis and aphthous ulcers | 142/14,786 | 336/14,621 | 0.42 | 0.34–0.51 | <0.001 | <0.001 |
| Oral candidiasis / thrush | 107/14,786 | 216/14,621 | 0.49 | 0.39–0.62 | <0.001 | <0.001 |
| Toothache / dental pain | 81/14,786 | 104/14,621 | 0.77 | 0.58–1.03 | 0.076 | 0.147 |
| Dental, periapical or oral abscess | 49/14,786 | 67/14,621 | 0.72 | 0.50–1.04 | 0.083 | 0.147 |
| Dental deposits and poor oral hygiene | 165/14,786 | 161/14,621 | 1.01 | 0.82–1.26 | 0.904 | 0.904 |
| Pulpitis and periapical inflammation | 50/14,786 | 86/14,621 | 0.57 | 0.41–0.81 | 0.002 | 0.005 |
| Gingivitis | 80/14,786 | 103/14,621 | 0.77 | 0.57–1.03 | 0.075 | 0.147 |
| Periodontitis / periodontal disease | 63/14,786 | 80/14,621 | 0.78 | 0.56–1.08 | 0.136 | 0.181 |
| Glossitis and burning mouth / glossodynia | 51/14,786 | 67/14,621 | 0.75 | 0.52–1.08 | 0.124 | 0.181 |
| Tooth loss / edentulism | 33/14,786 | 58/14,621 | 0.56 | 0.37–0.86 | 0.007 | 0.020 |
| Halitosis (oral malodor) | 13/14,786 | 22/14,621 | 0.58 | 0.29–1.16 | 0.120 | 0.181 |
| Gingival recession and other gingival disorders | 24/14,786 | 21/14,621 | 1.13 | 0.63–2.03 | 0.682 | 0.727 |
| Dental hard-tissue wear and erosion | 16/14,786 | 24/14,621 | 0.66 | 0.35–1.24 | 0.193 | 0.238 |
Disclaimer/Publisher’s Note: The statements, opinions and data contained in all publications are solely those of the individual author(s) and contributor(s) and not of MDPI and/or the editor(s). MDPI and/or the editor(s) disclaim responsibility for any injury to people or property resulting from any ideas, methods, instructions or products referred to in the content. |
© 2026 by the authors. Licensee MDPI, Basel, Switzerland. This article is an open access article distributed under the terms and conditions of the Creative Commons Attribution (CC BY) license (http://creativecommons.org/licenses/by/4.0/).
Copyright: This open access article is published under a Creative Commons CC BY 4.0 license, which permit the free download, distribution, and reuse, provided that the author and preprint are cited in any reuse.