
Submitted:
21 August 2026
Posted:
21 August 2026
You are already at the latest version
Abstract
Background/Objectives: Malnutrition, feeding difficulties, and morbidity frequently coexist among vulnerable children and contribute to poor health and developmental outcomes. However, limited evidence has examined how these factors interact across diverse care settings or how structured nutrition interventions influence child health over time. This study examined the relationships among malnutrition, feeding difficulties, disability, and morbidity in children enrolled in Holt International's Child Nutrition Program (CNP) and evaluated changes in nutritional status, feeding difficulties, and morbidity after one year of participation.
Methods: We retrospectively analyzed deidentified health and nutrition records from 13,370 children (0–18 years) enrolled in the CNP across eight low- and middle-income countries. Nutritional status was classified using WHO growth standards and references. Logistic regression examined associations between baseline malnutrition, disability, and morbidity, adjusting for age and sex. A longitudinal subset (n = 1,452) was used to assess associations between feeding difficulties and morbidity and changes in nutritional status, feeding difficulties, and morbidity after one year using McNemar tests.
Results: At baseline, 45.5% of children were moderately or severely malnourished, 17.6% had at least one morbidity, 12.8% had feeding difficulties, and 22.3% had disabilities. Severe malnutrition was associated with higher odds of morbidity (OR = 1.39, 95% CI: 1.25–1.56), hospitalization (OR = 2.52, 95% CI: 1.92–3.31), cough, and constipation. Feeding difficulties were independently associated with morbidity (OR = 1.86, 95% CI: 1.53–2.25). After one year, nutritional status improved in 29.2% of children, feeding difficulties and morbidity declined, and the greatest improvements in malnutrition were observed among children with disabilities.
Conclusions: Malnutrition and feeding difficulties were independently associated with increased morbidity among vulnerable children. Participation in a structured nutrition intervention was accompanied by improved nutritional status and modest reductions in morbidity over one year. These findings support integrating nutrition rehabilitation, feeding assessment, and routine health monitoring into child nutrition programs serving vulnerable populations in low- and middle-income countries.
Keywords:
child nutrition
; feeding difficulties
; morbidity
; disability
; nutrition intervention
; global health
1. Introduction
Malnutrition remains one of the leading threats to child health and mortality globally [1]. UNICEF reports that more than 150 million children younger than 5 years are stunted, and tens of millions experience wasting or micronutrient deficiencies [2]. Undernutrition still contributes to nearly half of all deaths among children younger than 5 years. Malnutrition increases children’s susceptibility to infectious diseases and impairs immune function[1,3]. Malnutrition not only impacts child development but also imposes global economic, social, and medical burdens, leaving lasting consequences for individuals, families, communities, and countries [1]. While these burdens have been widely documented in community and country settings, less attention has been given to children living in alternative care environments, such as institution-based care or foster care, who are at an exceptionally high risk of malnutrition and micronutrient deficiencies [4]. In such settings, malnutrition may not only reflect inadequate intake but also underlying feeding dysfunction or comorbid illness.
Children living in low- and middle-income countries are often at high risk of malnutrition and poor health — especially infants, those with disabilities, or those who have been orphaned. Often, vulnerable children, such as those in foster care or institution-based care, can also be at high risk [5]. While these settings differ in structure and intensity of care, children in such environments often share common risk factors, including poverty, early-life adversity, disability, limited caregiver resources, and inconsistent access to healthcare and nutrition services [4,6,7,8].
Globally, more than 9 million children are separated from their biological families and living in alternative care settings [9]. Children in institutional settings experience elevated risks of growth faltering, developmental delay, micronutrient deficiencies, and chronic health conditions [4,10,11,12]. Those living in foster care experience growth and nutrition deficiencies due to their nutritional environment before entering care [13]. Children in their families living within communities can also face high risks of malnutrition, including stunting and deficiencies, directly linked to chronic poverty, food insecurity, and limited access to nutritious food. Across these diverse settings, ensuring adequate nutrition remains a central challenge [14].
Evidence that malnutrition is beyond a growth concern, but also a critical determinant of immune competence, abounds. Undernutrition in the forms of stunting and wasting is documented as the most harmful type of malnutrition in children [15]. The relationship between undernutrition and infections exists in a “vicious cycle.” Children who are stunted (length-for-age Z-score<-2) and/or wasted (weight-for-height/length Z-score<-2) often experience weakened immune systems, increasing their risks of illnesses and treatment-resistant infections [16,17]. Similarly, recurrent infections, such as diarrhea, cough, and other parasitic infestations, impair nutrient absorption and increase metabolic demands, contributing to undernutrition [17,18]. Hence, there is a need to continue to combat malnutrition to reduce morbidities and hospitalization, especially in the most vulnerable populations. However, few studies have examined whether this relationship holds in institution-based care settings, where environmental and caregiving dynamics differ substantially from household contexts.
The capacity to ingest food safely and efficiently is a foundational determinant of nutritional status, preceding downstream processes of digestion, absorption, and metabolic utilization. Feeding difficulties, such as aspiration, dysphagia, oral-motor dysfunction, and feeding refusal, present challenges to food ingestion, increasing the risks of inadequate nutrient intake and persistent malnutrition, also leading to morbidities [19]. Children with disabilities and developmental disabilities more commonly face these difficulties, making them even more vulnerable [20]. Physical, cognitive, or neuromotor impairments can limit feeding independence, reduce intake efficiency, and increase caregiver burden. Despite this, feeding dysfunction is often under-assessed in institutional nutrition programs, which typically focus on anthropometric indicators alone. Similarly, disability-inclusive nutrition programming remains limited in many low-resource institutional settings.
Although nutrition interventions have demonstrated effectiveness in community settings, evidence regarding their impact among children living in alternative care environments is sparse, and how those children perform in comparison to those living with their families in local communities is limited. We aim to address a gap in the literature by examining the associations between malnutrition, feeding difficulties, and morbidity among vulnerable children living in institution-based care or foster care in comparison to those living in local communities in eight low- and middle-income countries. We will also explore the impact of the same nutrition intervention on these different settings. Our objectives are to describe the nutritional status of enrolled children, to determine the prevalence of feeding difficulties and common childhood morbidities, and to evaluate associations between nutrition status, feeding difficulties, and morbidity outcomes. Our study assesses whether disability modifies these associations and evaluates changes in nutritional status and morbidity following one year of participation in a structured child nutrition program. By examining these interconnected factors within diverse care contexts, we seek to contribute to a more comprehensive understanding of health risks and programmatic needs among vulnerable children.
2. Materials and Methods
2.1. Study Design and Ethics
Our study uses a longitudinal approach to retrospectively analyze routine health and nutrition screening records from children enrolled in Holt International’s Child Nutrition Program (CNP), a multi-country nutrition intervention program [21]. De-identified secondary data were analyzed to examine the relationship among malnutrition, feeding difficulties, and morbidities in children 0-18 years. The study design and scientific merit were evaluated by the Oregon State University Institutional Review Board and approved under the [45CFR 46.111 (a) (1)(i) and 45CFR 46.111 (a)(2)] categories.
2.2. Holt International’s Child Nutrition Program
Holt International is a child welfare non-profit organization that provides programming and resources to support vulnerable children and their families in 17 low- and middle-income countries. Holt provides nutrition and health services, including the Child Nutrition Program (CNP). The CNP is a nutrition and feeding intervention with growth monitoring that aims to improve the health and developmental outcomes of children. This program is implemented in a variety of settings, including institution-based care, foster care, health centers, day care, schools, and communities. The CNP targets children at high risk for malnutrition, especially young children within the first 1,000 days of life and those with disabilities. The program is designed to improve nutrition, ensure safer feeding and has been implemented in more than 113 sites in Vietnam, China, India, Ethiopia, Cambodia, Mongolia, Haiti and the Philippines.
The core component of the CNP is caregiver training that focuses on age-appropriate nutrition, safe feeding practices, and standardized growth monitoring. Each participating site undergoes an initial needs assessment to identify context-specific challenges and inform implementation. Following this assessment, program personnel provide structured training to caregivers on nutrition principles, feeding techniques, and the proper use of growth monitoring tools. Caregivers are responsible for conducting routine nutrition and health screenings, which are documented in Holt’s electronic nutrition screening record system. Screening frequency varies by age: children aged 0–2 years are screened monthly; those aged 2–5 years are screened quarterly; and children older than 5 years are screened bi-annually. The program is routinely monitored and evaluated to ensure continuous quality improvement and responsiveness to the needs of the children it serves.
2.3. Participants and Study Size
Our study analyzed 63,545 de-identified health records from 13,370 children aged 0-18 years old at baseline, before they began participating in the CNP. Child health records are from CNP participants in institution-based care, foster care or community programs in Vietnam, China, India, Ethiopia, Cambodia, Mongolia, Haiti, and the Philippines. The initial dataset included health records from 13,478 children. Children older than 18 years or who had missing or implausible z-scores based on WHO growth cutoffs were excluded at baseline, leaving the final baseline sample size at 13,370. A subset of 1,452 children with complete data after one year in the CNP was used to estimate how the relationship among variables changes over time.
2.4. Data Management and Analysis
Our study utilizes a secondary, de-identified dataset provided by Holt International, and there was no direct data collection from human participants. The routine screening data are entered into the Nutrition Screening System (NSS), an electronic nutrition screening record system with automated WHO growth charts. To safeguard confidentiality, only a coded de-identified research dataset was analyzed with data from April 30, 20210, to Nov. 25, 2025. New data variables were generated to support analysis (e.g., generating age from date of birth, assigning an individual study ID from the child ID, etc.).
This study involves a longitudinal analysis for children from baseline to their closest screening to 1 year, within 300 and 450 days after their baseline screening. This captures children’s most recent screening by their one-year mark within the intervention, ensuring that all children included in the analysis have at least baseline and 1-year screenings. An upper bound of 450 days was applied to limit heterogeneity.
2.5. Variables
The exposure variables were malnutrition and feeding difficulties. Z-scores, including weight-for-age, height-for-age, weight-for-height, head circumference-for-age, mid-upper_arm circumference-for-age, and BMI-for-age, were classified according to WHO growth references and cut-offs [22]. A summary variable for malnutrition was created to reclassify participants into three malnutrition groups: normal growth, moderate malnutrition, and severe malnutrition. Children were determined to be malnourished if they had one or more growth references/standards classifying them as moderate or severe malnutrition.
We defined feeding difficulties as having at least one of the following difficulties: aspiration, difficulty sucking, cough/chokes during feeding, difficulty feeding self (>1 year), reflux/heartburn, spitting up, difficulty drinking from a cup (>1 year), difficulty swallowing, difficulty chewing, bad teeth, or other. The effect modifier is disabilities and medical needs reported, including: autism spectrum disorder, cerebral palsy, cleft lip/cleft palate, cognitive impairment, Down syndrome, hearing loss/deafness, heart disease/defect, HIV/AIDS, hydrocephaly, microcephaly, vision impairment/blindness, speech/language delay, missing limbs/digits, kidney disease or defect, and any other related disability or medical need.
The outcome variable was morbidities, defined as having episodes of cough, diarrhea, nausea/vomiting, constipation, fever, and hospitalization in the last month before their screening. Nutrition status (normal, moderate, and severe), feeding difficulties (yes/no), morbidities (yes/no), and disability status (yes/no) were all operationalized as categorical variables.
2.6. Statistical Method
We used a mix of descriptive analysis, logistic regression, and nonparametric statistical methods to analyze the de-identified health records. Participants’ health characteristics were derived using the chi-square test and are described in Table 1. Frequency counts and percentages are reported for categorical variables, while means and standard deviations are reported for continuous variables.
Our study estimates the relationship between malnutrition, feeding difficulties, and morbidities using logistic regression models estimating odds ratios while adjusting for covariates, including age, sex, birthweight, care setting, and supplementation (iron, multivitamin, food supplements). The association between malnutrition and morbidities tested at baseline was also adjusted for feeding difficulties.
Data from the one-year screening of a subset of 1,452 children who had screenings after one year of participation in the program were used to assess the relationship between feeding difficulties and morbidities. The McNemar test was used to generate 2x2 tables to examine how malnutrition, feeding difficulties, and morbidities change over time. For this analysis, malnutrition was categorized into two groups (Yes/No). No malnutrition was defined as having all observed indicators as normal, and the presence of malnutrition was defined as having at least one indicator as either moderate or severe. All analyses were conducted using SAS version 9.4 [23].
Several steps were taken to minimize potential sources of bias. The Child Nutrition Program uses standardized caregiver training, routine nutrition screening protocols, and an electronic nutrition screening system with automated WHO growth references to promote consistency in data collection across participating sites. Children with missing or biologically implausible anthropometric measurements were excluded to reduce misclassification. Regression analyses adjusted for key potential confounders, including age, sex, birthweight, care setting, supplementation, and feeding difficulties where appropriate. Restricting longitudinal analyses to screenings conducted between 300 and 450 days after baseline further reduced variability in follow-up time.
3. Results
3.1. Population Demographics
Baseline characteristics of all 13,370 children in our study included children ages 0-18 years. Many of the children were ages 1 to 5 years (7,343 [54.9%]). There were similar proportions of male and female children (Table 1).
The mean birthweight in the total population was observed as 2.41 kilograms. Most of the children were in institution-based care (6,120 [45.8%]) or in community settings (6,850 [51.2%]). About 17.6% (2,358) of the children had at least one morbidity, 12.8% (1,708) had at least one feeding difficulty and 22.3% (2972) had a disability or medical need (Table 1). Cough was the most common morbidity observed, while hospitalization was the least common (Figure 1).
Figure 1.
Data flow chart for inclusion and exclusion of study participants to arrive at the final baseline study size.
Figure 1.
Data flow chart for inclusion and exclusion of study participants to arrive at the final baseline study size.
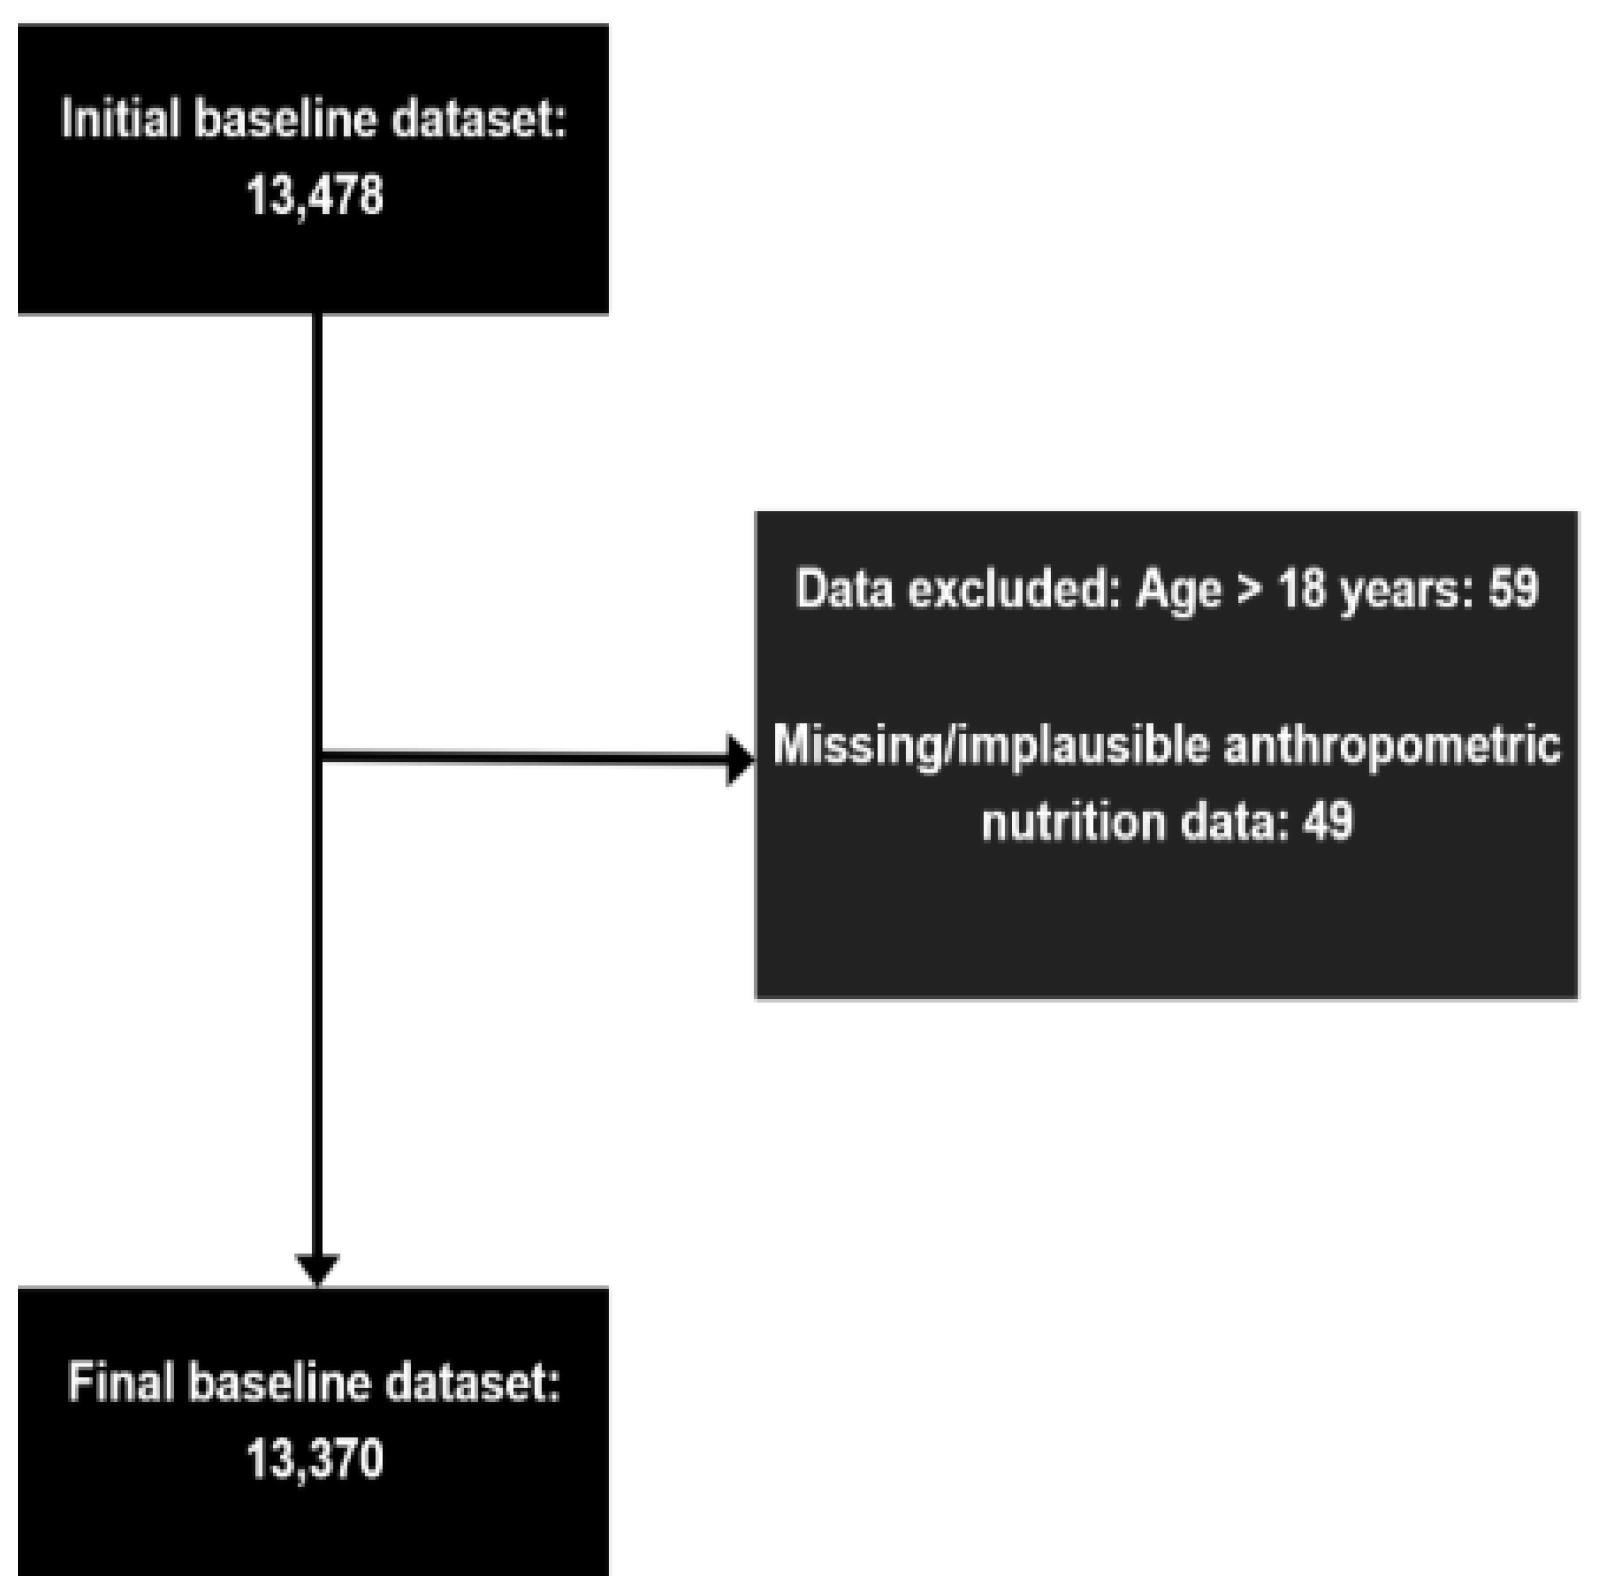
Figure 2.
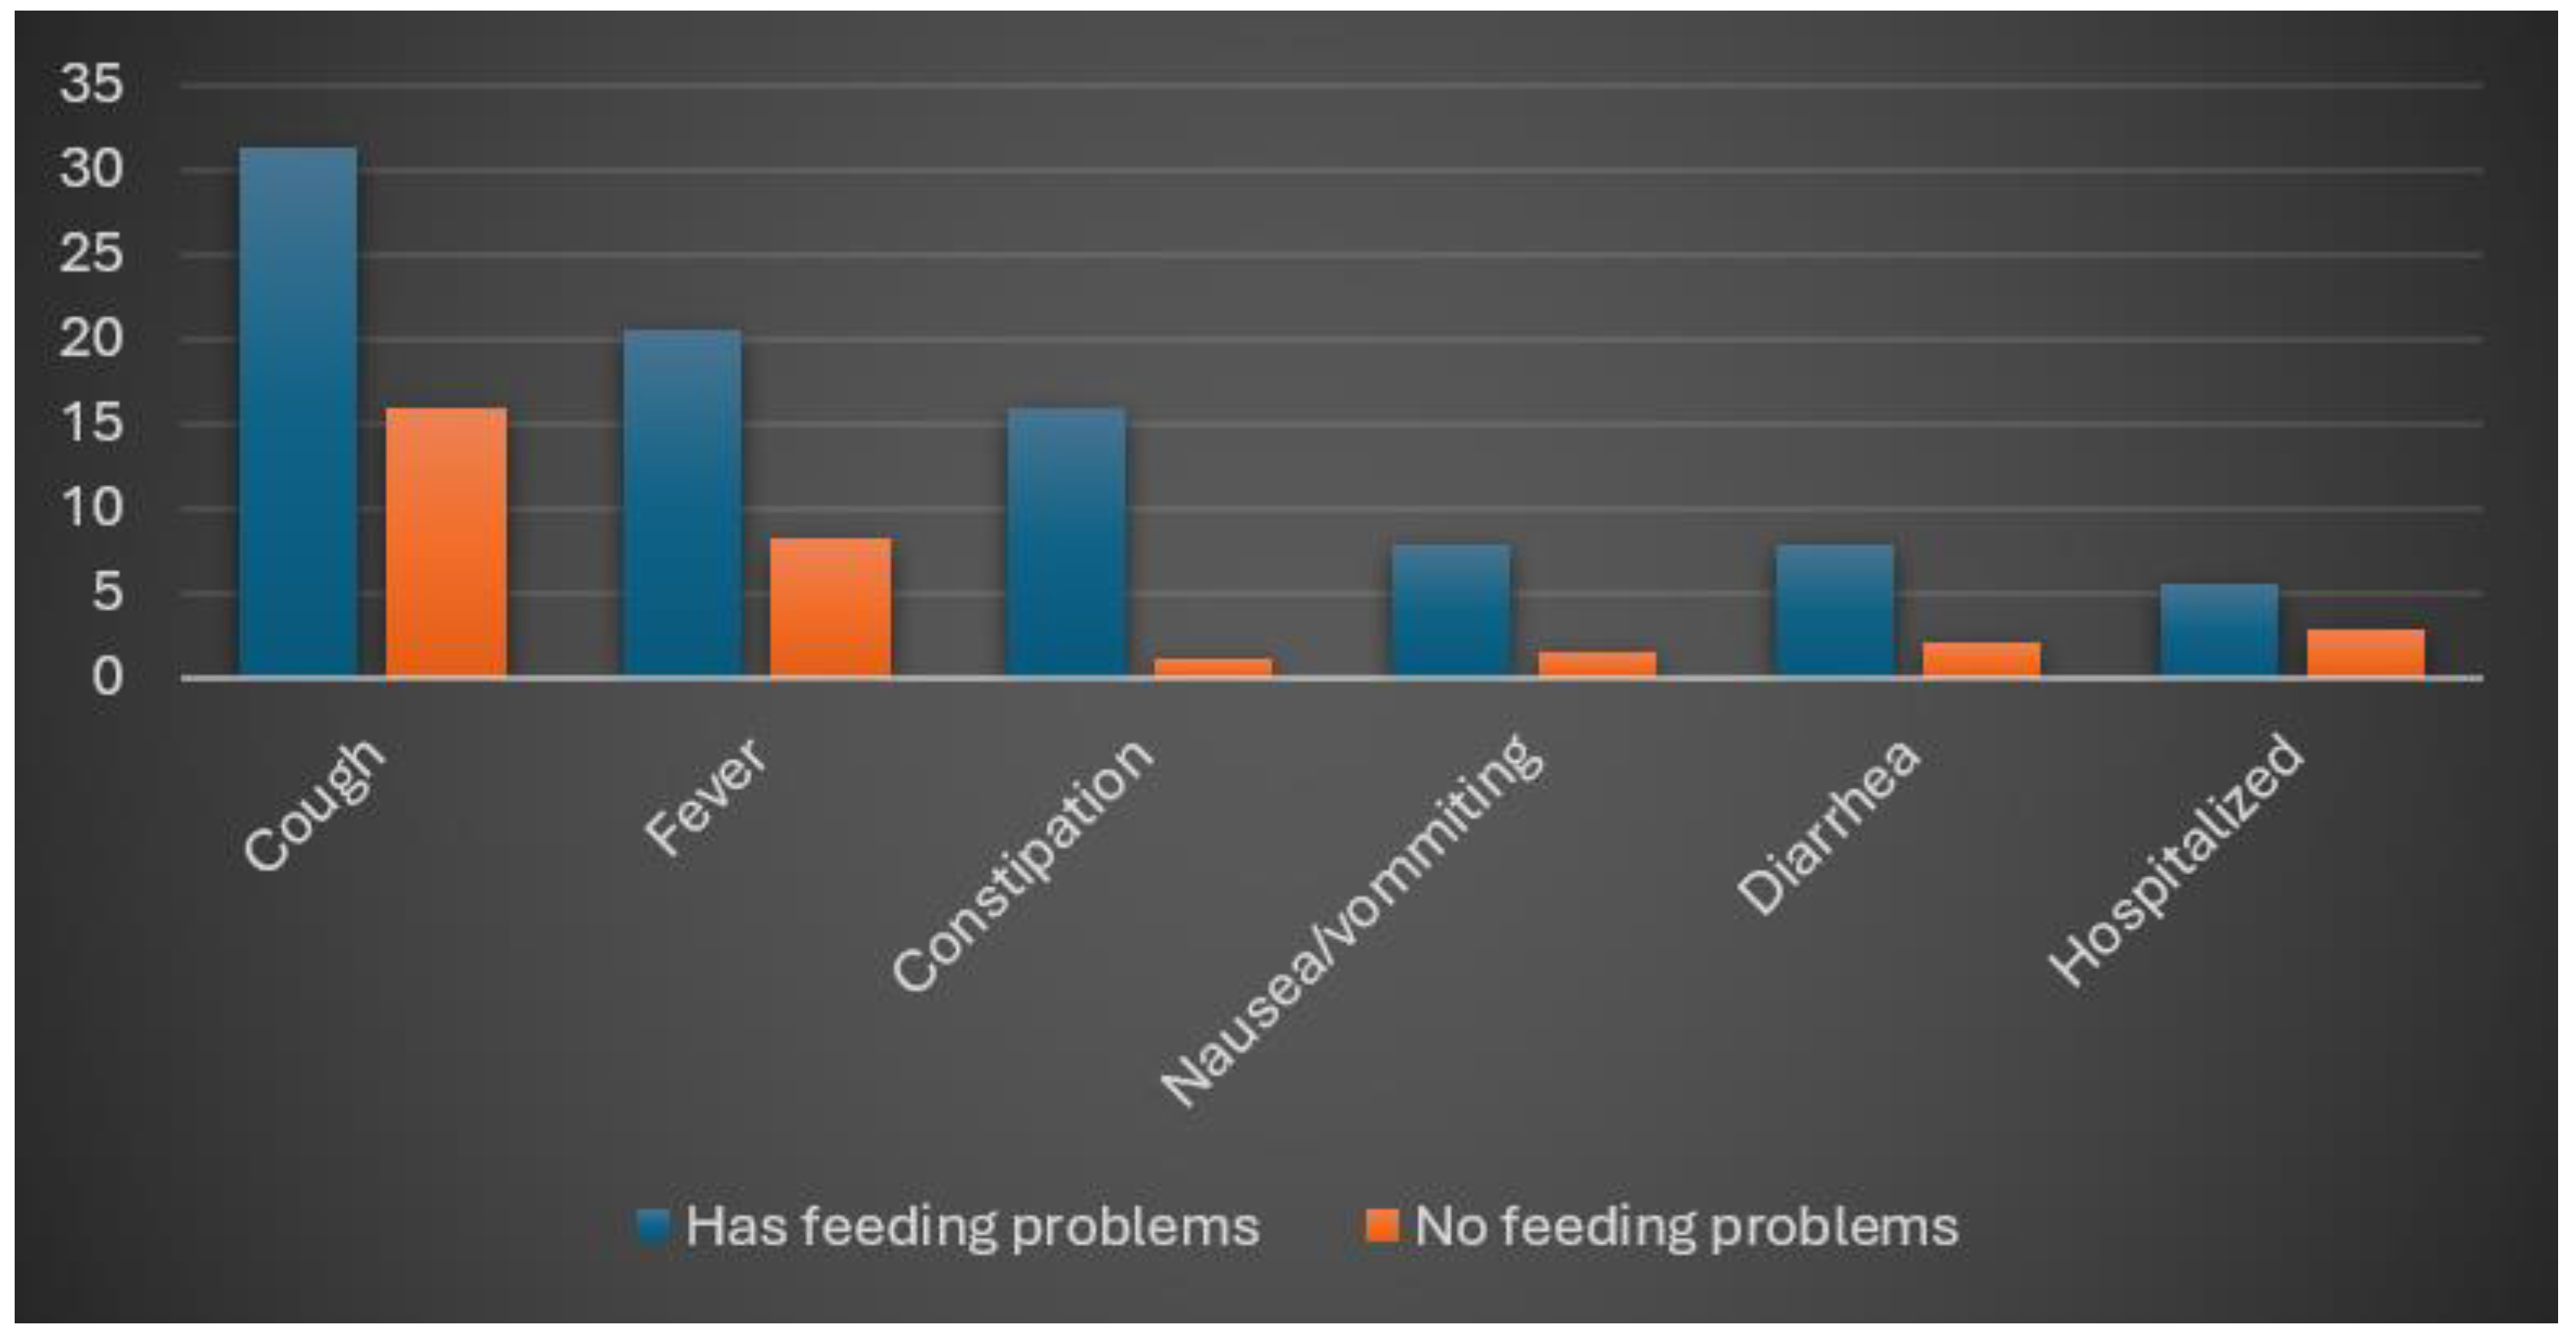
Prevalence distributions of morbidities among children 0-18 Years old in Holt’s CNP with feeding difficulties at initial screening.
Figure 2.
Prevalence distributions of morbidities among children 0-18 Years old in Holt’s CNP with feeding difficulties at initial screening.
Many of the children experienced either moderate malnutrition (3,287 [24.6%]) or severe malnutrition (2,793 [20.9%]) at baseline upon entry into the program. Severe malnutrition was most common among children between 1 and 5 years (50.9%). More males than females experienced both forms of malnutrition. Severe malnutrition was more prevalent among children in institution-based care (26.0%), children who had feeding difficulties (28.7%), and children who had some disabilities (30.3%), compared to children in community-based or foster care settings, who had no feeding difficulties and who had no disabilities, respectively (Table 2).
3.2. Morbidity and Malnutrition
The odds ratios of the relationship between malnutrition status and any morbidity observed, as well as each morbidity, are presented in Table 3. Each model accounted for different covariates, and severe malnutrition is associated with higher odds of having any morbidity across all models, compared to normal growth. Compared with children without malnutrition, children with severe malnutrition had 39% (95% CI: 1.25, 1.56) higher odds of having any morbidity and 24% (95% CI: 1.10, 1.41) higher odds of having cough after adjusting for demographic variables (age and sex).
When demographic variables and birthweight were adjusted for, children with moderate malnutrition had 18% (95% CI: 1.05, 1.32) higher odds of having any morbidity, 16% (95% CI: 1.10, 1.32) higher odds of having a cough, and 22% (95% CI: 1.03, 1.44) higher odds of having a fever compared to children experiencing normal growth. Children with severe malnutrition had 43% (95% CI: 1.27, 1.61) higher odds of having any morbidity, 22% (95% CI: 1.07, 1.40) higher odds of having a cough, 65% (95% CI: 1.27, 2.13) higher odds of having constipation, and 137% (95% CI: 1.76, 3.19) higher odds of being hospitalized.
When we adjusted for demographics and care type, severe malnutrition is associated with 29% (95% CI: 1.15, 1.45) higher odds of any morbidity, 72% (95% CI: 1.33, 2.23) higher odds of constipation, and 122% (95% CI: 1.68, 2.93) higher odds of hospitalization.
In the model adjusted for demographics and supplementation, severe malnutrition is associated with 26% (95% CI: 1.12, 1.42) higher odds of any morbidity, 50% (95% CI: 1.16, 1.92) higher odds of constipation, and 113% (95% CI: 1.61, 2.82) higher odds of hospitalization when compared to normal growth.
Additionally, when demographics and feeding difficulties were adjusted for, moderate malnutrition is associated with 20% (95% CI: 1.02, 1.40) higher odds of fever, while severe malnutrition is associated with 26% (95% CI: 1.24, 1.42) higher odds of any morbidity and 134% (95% CI: 1.78, 3.08) higher odds of hospitalization when compared to normal growth.
3.3. Effects of Disability
We tested the crude modifying effect of disability status in the relationship between malnutrition and morbidity and found an interaction (p-value = 0.0004). Interaction remained after adjusting for age and sex (p-value = 0.0217). Hence, we conducted a stratified analysis, and the results are presented in Table 4.
After adjusting for co-variates, moderate malnutrition is associated with higher odds of morbidity among children with disabilities in many of the models. Severe malnutrition is also associated with increased odds in some models, though results were not consistent across all models. Among children without disabilities, moderate malnutrition is not associated with morbidity. Unexpectedly, severe malnutrition is associated with lower odds of morbidity in two adjusted models, though this finding was not consistent and should be interpreted cautiously.
3.4. Morbidities and Feeding Difficulties
Our analysis was conducted with the subset data of 1,452 children who had screening after one year of participation in the program. At initial screening, 53.6% of children who had feeding difficulties also had some morbidities, with cough having the highest prevalence (31.3%), followed by fever (20.5%), and constipation (15.9%). Among children without feeding difficulties, 16% had a cough, 8.3% had a fever, and 1.2% had constipation.
Additionally, a logistic regression model that adjusted for age, sex, and disability was used to estimate the relationship between feeding difficulties and morbidities. Compared to children without feeding difficulties, children with feeding difficulties had 86% (95% CI: 1.53, 2.25) higher odds of experiencing a morbidity.
3.5. Outcomes of Morbidity over Time
Generally, 53.7% of children who had recent morbidities at baseline screening had no recent morbidity during the one-year screening. McNemar’s test indicated a change in morbidity status over time (χ2 = 26.11, p < 0.0001), with a greater proportion of children experiencing improvement than worsening. Among children with disabilities, 49.9% who experienced morbidities at baseline screening showed no morbidities at their 1-year screening (Table 5).
3.5.1. Malnutrition and Morbidity After One Year
At their one-year screening, 29.2% of children who were malnourished at their baseline screening were no longer malnourished. McNemar’s test indicates a change in morbidity status over time (χ2 = 71.86, p <0.0001). Of children with disabilities who were malnourished at baseline, 79% were no longer malnourished after one year of participation, with 21% of children remaining malnourished (Table 6).
3.5.2. Feeding Difficulties and Morbidities After One Year
We analyzed the trajectories of feeding difficulties by comparing feeding status at baseline and one-year screenings and categorized them as worsened, improved, persistent feeding difficulties, or stable independence (That is, children who had no feeding difficulties at any point: both at baseline and at one-year follow-up), and examined how morbidities changed after one year, within each trajectory (Appendix A1). When feeding difficulties improved, 53.8% of children who had experienced morbidities at baseline screening had no morbidities observed at their one-year screening (Table 7). However, when feeding difficulties persisted, 55.3% of children who experienced morbidities at their baseline screening had morbidities observed at their one-year screening.
4. Discussion
Our research finds an association between malnutrition and feeding challenges and morbidities among vulnerable children participating in the Child Nutrition program in different settings in low- and middle-income countries. We also show how disability exacerbates this association. Over time in the CNP, the prevalence of malnutrition substantially reduced, and some feeding difficulties were resolved for those with and without disabilities. While some children continue to experience feeding difficulties, the prevalence of morbidities substantially reduced after one year. Together, these findings present possible relationships to the increased prevalence of morbidities for these children [12,24].
4.1. Malnutrition Is a Health Risk
Our study presents evidence that malnutrition is beyond a mere growth issue, but also a critical risk to the health of children, particularly during developmental years. At baseline, both moderate and severe malnutrition were associated with higher odds of experiencing illness, with the strongest and most consistent associations observed for severe malnutrition. Children with severe malnutrition had substantially higher odds of hospitalization and constipation across multiple adjusted models, even after accounting for demographic characteristics, birthweight, care type, supplementation, and feeding difficulties. Children with moderate malnutrition also had substantially higher odds of any morbidity, cough, and fever after adjusting for age, sex, and birthweight.
These findings align with the well-established biological relationship between malnutrition and immune dysfunction [16,17,18]. When malnutrition is present, children often experience a weakened immune system and delayed wound healing, putting them at risk of illness and disease [4,25]. In our study, cough and fever were among the most frequently reported morbidities, and both were more common among malnourished children. The increased odds of hospitalization among severely malnourished children further highlight the association with poor nutritional status and risk of health consequences in this population. Early intervention to address malnutrition through growth monitoring and adequate nutritional support for vulnerable children can prevent many illnesses.
Importantly, nearly 45% of all children at baseline were either moderately or severely malnourished upon entry into the programs (Table 1). Additionally, many of the children entering the program were at increased risk due to low birth weight. The mean birthweight in the total population at baseline was 2.4 kg, quite below the average normal birthweight of 3.2-3.3 kg [22]. This further provides evidence of the magnitude of nutritional vulnerability across institution-based care, foster care, and community/daycare settings in low- and middle-income countries, and is consistent with findings from other studies [4,26]. Improvements in malnutrition status observed after one year of program participation were accompanied by modest reductions in morbidity prevalence. These concurrent improvements are consistent with the possibility that addressing nutritional deficits, providing caregiver training, and supporting behavior change may contribute to improved nutrition and health in vulnerable children [27]. Nutrition programming should, therefore, be inclusively framed as infection prevention and health protection, not just for growth monitoring.
4.2. Feeding Difficulties Are a Critical Risk Factor
For these children, feeding difficulties were also strongly associated with morbidities, independent of anthropometric indicators. Children with feeding difficulties had 86% higher odds of experiencing morbidities compared to those without feeding difficulties, even after adjusting for age, sex, and disability status. More than half of children with feeding difficulties had at least one morbidity at baseline (53.6%), and respiratory symptoms were particularly common in this group.
Feeding difficulties may increase morbidity risk through multiple pathways. Difficulties such as aspiration, coughing, or choking during feeding, and dysphagia may directly predispose children to respiratory infections [28,29]. Other challenges, such as feeding refusal or inability to feed self, may lead to inadequate nutrient intake, putting children at increased risk of malnutrition, and ultimately, the immunologic and growth consequences that come with it [30,31]. Additionally, feeding difficulties may reflect underlying neurologic or developmental vulnerabilities that increase susceptibility to illness [32].
Notably, while nearly one-third of children had their malnutrition resolved, feeding difficulties persisted, especially for children with disabilities. After one year, 18.2% of those with disabilities and 30.3% of those without saw their feeding difficulties resolve (Appendix A2). When feeding difficulties were resolved, there was a corresponding change in morbidity prevalence, while persistent feeding difficulties were also associated with morbidities after a year in the intervention. This pattern suggests children can see improved health when feeding difficulties are addressed. This is consistent with findings from other similar intervention or program evaluation studies addressing feeding difficulties in vulnerable children [20,33,34].
These findings highlight the importance of incorporating routine feeding assessments into nutrition surveillance systems for all children, not just those with disabilities [20]. The persistence of feeding difficulties after one year of program participation suggests that more resources, additional caregiver training, and support may be needed to address the individual needs of children. While caregiver education is essential, children with complex feeding difficulties may require more specialized, individualized support and adaptive equipment that might not be available in low-resource settings. Programs serving vulnerable children in institution-based care, foster care, and community settings should consider integrating caregiver/parent/teacher training to include safe feeding techniques, feeding therapy, oral-motor interventions, and disability-sensitive care alongside inclusive nutritional services and growth monitoring to more effectively address underlying feeding difficulties. To maximize long-term impact, these efforts should be supported by sustainable systems that reinforce and maintain caregiver knowledge over time. In settings where caregiver or staff turnover is common, integrating evidence-based feeding practices into routine staff orientation, refresher training, and ongoing mentorship may help ensure continuity of care and consistent implementation. Strengthening partner-site capacity through supportive supervision and standardized feeding protocols may further promote the sustainability of these interventions.
4.3. Disability Amplifies Risk
We found disability status modified the association between malnutrition and morbidity, indicating that children with disabilities experience compounded vulnerability. Among children with disabilities, moderate malnutrition was consistently associated with higher odds of morbidity across adjusted models. In contrast, malnutrition was not associated with morbidity among children without disabilities in most models.
This interaction suggests the health consequences of malnutrition may be more pronounced in children with underlying developmental, neurologic, or medical conditions or disabilities. Children with disabilities are commonly faced with challenges such as feeding difficulties, limited mobility, increased metabolic demands, and lack of access to care, all of which may predispose them to malnutrition [35,36].
Overall, disability appears to function not merely as a co-occurring condition but as a risk amplifier in the malnutrition–morbidity pathway among vulnerable children in diverse settings.
4.4. Programmatic Implications
The findings from our study have several important implications for nutrition programming among vulnerable children in institution-based care, foster care, and community settings.
First, the strong association between malnutrition and morbidity supports the importance of routine growth monitoring and early identification of nutritional risk or feeding difficulties. Given the high baseline prevalence of moderate and severe malnutrition, structured screening systems like the one used in the CNP may be an essential tool for identifying children at high risk of malnutrition, feeding difficulties and illnesses. Interventions aimed at improving nutritional intake and monitoring anthropometric indicators may not only promote growth but also contribute to reducing illness burden.
Second, the results highlight the need to integrate feeding assessments into standard nutrition programming. Feeding difficulties were strongly associated with morbidity and were less likely to be resolved over time compared to malnutrition. This suggests that general nutrition interventions or growth monitoring alone may not be sufficient. Programs serving vulnerable children should consider incorporating structured feeding evaluations and caregiver training on safe feeding practices, appropriate positioning, responsive feeding, and strategies to support children with feeding difficulties. These foundational approaches may be feasible across a wide range of care settings, including those with limited resources. Where additional resources and expertise are available, programs should also strengthen referral pathways and access to specialized services, such as feeding therapy, occupational or speech therapy, and adaptive feeding equipment, for children with persistent or complex feeding challenges.
Third, the modifying role of disability emphasizes the importance of disability-inclusive nutrition strategies. Children with disabilities experience an amplified risk when malnutrition is present and show slower improvement over time. Nutrition programs in diverse care environments should ensure that children with special health needs receive individualized assessment and targeted support, such as adaptive feeding strategies, closer health monitoring, and coordination with medical providers when needed.
4.5. Strengths and Limitations
Our study has several notable strengths. First, it utilized a large, multi-country dataset including more than 13,000 children across diverse settings in eight countries, increasing the applicability of findings within similar populations in low- and middle-income countries. Second, the analysis included several correlates of morbidities, including multiple indicators of malnutrition and feeding difficulties, as well as the interactive effects of disability status. This allows for a more comprehensive understanding of potential risk pathways. Third, the inclusion of longitudinal data for a subset of children enabled assessment of changes over time during program participation.
However, readers should review these findings in the context of some limitations. This is an observational study and does not provide causality between nutrition status and morbidity outcomes. Improvements observed over one year may reflect program effects, natural growth progression, regression to the mean, or other unmeasured factors. Additionally, morbidity was measured based on reported illness episodes within the prior month, so for many, it may not capture all trends in morbidity over time. This data may be subject to recall bias or reporting bias. The one-year screening analysis included only children who remained in the program for 300–450 days, which did not include all children who had participated in the program. The inconsistent association between severe malnutrition and morbidity among children without disabilities in some adjusted models may reflect unmeasured confounding, differential screening intervals, survival bias, or differences in care-seeking and illness reporting. Hence, these findings should be interpreted cautiously and warrant further investigation. Furthermore, data were pooled across eight countries, and contextual differences in healthcare access, caregiving practices, and environmental exposures present opportunities for future research to explore. Program delivery may also vary across implementing partners and countries (including differences in screening frequency, training completion, follow-up support, and timing of enrollment), which could affect program exposure and the interpretation of the one-year change results. Finally, feeding difficulties and disability status were recorded based on routine screening data rather than standardized clinical assessments, and many countries use different diagnostic criteria for disabilities.
Despite these limitations, the study provides valuable insight into the relationships between nutrition, feeding, and disability in shaping health outcomes among vulnerable children in diverse settings.
5. Conclusions
Our study examined the relationships between malnutrition, feeding difficulties, disability status, and morbidity among vulnerable children in institution-based care, foster care, and community settings across eight low- and middle-income countries. We found that both malnutrition and feeding difficulties are associated with increased odds of morbidity, and the presence of a disability amplifies this risk.
Severe malnutrition was consistently associated with higher odds of illness and hospitalization, underscoring the broader health implications of poor nutritional status. Feeding difficulties emerged as an independent and substantial risk factor for morbidity, particularly for respiratory symptoms. Furthermore, children with disabilities experienced compounded vulnerability, suggesting that the intersection of disability and undernutrition requires targeted attention.
Improvements in nutritional status and modest reductions in morbidity were observed after one year of program participation. These concurrent changes are consistent with the potential benefit of structured nutrition interventions, health monitoring, and caregiver training for children at high risk of malnutrition and morbidities.
Overall, these findings underscore the need to move beyond growth monitoring alone toward integrated nutrition programs that systematically identify and address feeding difficulties and disability-related vulnerabilities. Policymakers, practitioners, and child welfare organizations should prioritize disability-inclusive nutrition services, caregiver support and early intervention strategies within alternative care and community settings. Such investments have the potential to improve nutritional recovery, reduce morbidity and strengthen health equity for vulnerable children in low- and middle-income countries.
Author Contributions
Conceptualization, F.O and E.D.; methodology, F.O., J.H., and E.D.; software, F.O. and E.D.; validation, F.O., J.H., D.V., N.M.C., and E.D.; formal analysis, F.O.; investigation, F.O. and E.D.; resources, J.H. and E.D.; data curation, F.O.; writing—original draft preparation, F.O.; writing—review and editing, F.O., J.H., D.V., N.M.C., and E.D.; visualization, F.O., J.H., D.V., N.M.C; supervision, E.D.; project administration, J.H and E.D. All authors have read and agreed to the published version of the manuscript.
Funding
This research received no external funding.
Institutional Review Board Statement
The study was conducted in accordance with the Declaration of Helsinki, and approved by the Institutional Review Board of Oregon State University Ethics Committee (protocol code HE-2025-1750 – January 23, 2026.
Informed Consent Statement
Patient consent was waived because this study used de-identified secondary data for analysis and did not involve direct contact with participants.
Data Availability Statement
Data may be obtained from a third party and are not publicly available. Requests for access to this data need to be directed to Holt International. The data will be shared only on a contingent approval basis with interested parties. Additional related study protocols can be requested. Approval of a proposal, a data management protocol, and a signed data access agreement will be required. To be addressed by: Holt International, info@holtinternational.org; 250 Country Club Road, Eugene, OR 97401; tel: +1541.687.2202.
Acknowledgments
Ali Murray for proofreading this paper.
Conflicts of Interest
The authors declare no conflicts of interest.
Appendix A
Appendix A.1. Changes in Morbidity from Baseline to 1-Year Follow-Up Within Feeding Difficulties Trajectory Groups (n=1,452)
| Feeding Difficulties at Baseline | Feeding Difficulties at One-year Follow-up | Category of Change | Frequency | Percentage |
| No | No | Stabel independence | 3208 | 77.3 |
| No | Yes | Worsened | 144 | 3.5 |
| Yes | No | Improved | 171 | 4.1 |
| Yes | Yes | Persistent problem | 629 | 15.1 |
Appendix A.2. 2x2 Table of the Prevalence of Feeding Difficulties in Children 0-18 Years Old in Holt’s CNP After One-Year Participation by Disability Status (n=1,452)
| No Feeding Difficulties at One-year Screening | Feeding Difficulties at One-year Screening | Total | |
| Have Disability | 596 (51.9%) | 552 (48.1%) | 1148 |
| No Feeding Difficulties at Baseline Screening | 489 (87.6%) | 70 (12.5%) | 559 |
| Feeding Difficulties at Baseline Screening | 107 (18.2%) | 458 (81.8%) | 589 |
| No Disability | 2783 (92.6%) | 221 (7.4%) | 3004 |
| No Feeding Difficulties at Baseline Screening | 2719 (97.4%) | 74 (2.6%) | 2793 |
| Feeding Difficulties at Baseline Screening | 64 (30.3%) | 147 (69.7%) | 211 |
References
- World Health Organization Malnutrition. 2024.
- UNICEF Child Malnutrition. 2025.
- Gwela, A.; Mupere, E.; Berkley, J.A.; Lancioni, C. Undernutrition, Host Immunity and Vulnerability to Infection Among Young Children. Pediatr. Infect. Dis. J. 2019, 38, e175–e177. [Google Scholar] [CrossRef] [PubMed]
- DeLacey, E.; Tann, C.; Groce, N.; Kett, M.; Quiring, M.; Bergman, E.; Garcia, C.; Kerac, M. The Nutritional Status of Children Living within Institutionalized Care: A Systematic Review. PeerJ 2020, 8, e8484. [Google Scholar] [CrossRef] [PubMed]
- UNICEF Guidelines on Alternative Care for Children without Appropriate Care 2024
- Pac, J.; Waldfogel, J.; Wimer, C. Poverty among Foster Children: Estimates Using the Supplemental Poverty Measure. Soc. Serv. Rev. 2017, 91, 8–40. [Google Scholar] [CrossRef] [PubMed]
- Rogers, J.; Wilson, S.; Dixon, J. Exploring the Prevalence, Forms, Risk Factors, and Interventions Associated with Violence against Children in Alternative Care Settings: A Scoping Review. Child. Youth Serv. Rev. 2026, 182, 108766. [Google Scholar] [CrossRef]
- Szilagyi, M.A.; Rosen, D.S.; Rubin, D.; Zlotnik, S. the COUNCIL ON FOSTER CARE, ADOPTION, AND KINSHIP CARE, the COMMITTEE ON ADOLESCENCE and the COUNCIL ON EARLY CHILDHOOD Health Care Issues for Children and Adolescents in Foster Care and Kinship Care. In Pediatrics; Szilagyi, M.A., Harmon, D., Jaudes, P., Jones, V.F., Lee, P., et al., Eds.; 2015; Volume 136, pp. e1142–e1166. [Google Scholar] [CrossRef] [PubMed]
- UNICEF Children in Alternate Care.
- Berens, A.E.; Nelson, C.A. The Science of Early Adversity: Is There a Role for Large Institutions in the Care of Vulnerable Children? Lancet 2015, 386, 388–398. [Google Scholar] [CrossRef] [PubMed]
- Desmond, C.; Watt, K.; Saha, A.; Huang, J.; Lu, C. Prevalence and Number of Children Living in Institutional Care: Global, Regional, and Country Estimates. Lancet Child Adolesc. Health 2020, 4, 370–377. [Google Scholar] [CrossRef] [PubMed]
- DeLacey, E.; Hilberg, E.; Allen, E.; Quiring, M.; Tann, C.J.; Groce, N.E.; Vilus, J.; Bergman, E.; Demasu-Ay, M.; Dam, H.T.; et al. Nutritional Status of Children Living within Institution-Based Care: A Retrospective Analysis with Funnel Plots and Control Charts for Programme Monitoring. BMJ Open 2021, 11, e050371. [Google Scholar] [CrossRef]
- Tooley, U.A.; Makhoul, Z.; Fisher, P.A. Nutritional Status of Foster Children in the U.S.: Implications for Cognitive and Behavioral Development. Child. Youth Serv. Rev. 2016, 70, 369–374. [Google Scholar] [CrossRef] [PubMed]
- De Paiva, L.O.; De Oliveira, J.P.L.; Da Rocha Mariano, K.; Da Silva, P.S.; De Aguiar Toloni, M.H. Childhood at Risk: Nutritional Conditions of Children Living Under Food Insecurity. Curr. Nutr. Rep. 2025, 14, 107. [Google Scholar] [CrossRef] [PubMed]
- Morales, F.; Montserrat-de La Paz, S.; Leon, M.J.; Rivero-Pino, F. Effects of Malnutrition on the Immune System and Infection and the Role of Nutritional Strategies Regarding Improvements in Children’s Health Status: A Literature Review. Nutrients 2023, 16, 1. [Google Scholar] [CrossRef] [PubMed]
- Mutasa, K.; Tome, J.; Rukobo, S.; Govha, M.; Mushayanembwa, P.; Matimba, F.S.; Chiorera, C.K.; Majo, F.D.; Tavengwa, N.V.; Mutasa, B.; et al. Stunting Status and Exposure to Infection and Inflammation in Early Life Shape Antibacterial Immune Cell Function Among Zimbabwean Children. Front. Immunol. 2022, 13, 899296. [Google Scholar] [CrossRef] [PubMed]
- Suratri, M.A.L.; Indriasih, E.; Warouw, T.S.; Edwin, V.A.; Yulianto, A.; Faizal, D.R.; Deva, N.M.S.; Yulianti, A.; Agus, T.P.; Pracoyo, N.E.; et al. The Relationship between Infectious Diseases and Stunting among Toddlers in Indonesia. Iran. J. Nurs. Midwifery Res. 2025, 30, 936–940. [Google Scholar] [CrossRef] [PubMed]
- Karlsson, O.; Kim, R.; Guerrero, S.; Hasman, A.; Subramanian, S.V. Child Wasting before and after Age Two Years: A Cross-Sectional Study of 94 Countries. EClinicalMedicine 2022, 46, 101353. [Google Scholar] [CrossRef] [PubMed]
- Goday, P.S.; Huh, S.Y.; Silverman, A.; Lukens, C.T.; Dodrill, P.; Cohen, S.S.; Delaney, A.L.; Feuling, M.B.; Noel, R.J.; Gisel, E.; et al. Pediatric Feeding Disorder: Consensus Definition and Conceptual Framework. J. Pediatr. Gastroenterol. Nutr. 2019, 68, 124–129. [Google Scholar] [CrossRef] [PubMed]
- DeLacey, E.; Allen, E.; Tann, C.; Groce, N.; Hilberg, E.; Quiring, M.; Kaplan, T.; Smythe, T.; Kaui, E.; Catt, R.; et al. Feeding Practices of Children within Institution-based Care: A Retrospective Analysis of Surveillance Data. Matern. Child. Nutr. 2022, 18, e13352. [Google Scholar] [CrossRef] [PubMed]
- Holt International Holt’s Child Nutrition Program.
- World Health Organisation. Length/Height-for-Age, Weight-for-Age, Weight-for-Length, Weight-for-Height and Body Mass Index-for-Age; Methods and Development. In WHO child growth standards; de Onis, M., Ed.; WHO Press: Geneva, 2006; ISBN 978-92-4-154693-5. [Google Scholar]
- SAS/STAT® 9.4 User’s Guide SAS Institute Inc. 2013.
- Kurt, G.; Serdaroğlu, H.U. Prevalence of Infectious Diseases in Children at Preschool Education Institutions and Stakeholder Opinions. Children 2024, 11, 447. [Google Scholar] [CrossRef] [PubMed]
- Fan, Y.; Yao, Q.; Liu, Y.; Jia, T.; Zhang, J.; Jiang, E. Underlying Causes and Co-Existence of Malnutrition and Infections: An Exceedingly Common Death Risk in Cancer. Front. Nutr. 2022, 9, 814095. [Google Scholar] [CrossRef] [PubMed]
- Beggs, B.; Bustos, M.; Brubacher, L.J.; Little, M.; Lau, L.; Dodd, W. Facilitators and Barriers to Implementing Complex Community-Based Interventions for Addressing Acute Malnutrition in Low- and Lower-Middle Income Countries: A Scoping Review. Nutr. Health 2024, 30, 447–462. [Google Scholar] [CrossRef] [PubMed]
- K S, V.; Shah, P.B. Nutritional Problems Among Special Needs Children in a Rural Special Needs Children Home Near Chennai. Cureus 2024. [Google Scholar] [CrossRef] [PubMed]
- Tutor, J.D. Dysphagia and Chronic Pulmonary Aspiration in Children. Pediatr. Rev. 2020, 41, 236–244. [Google Scholar] [CrossRef] [PubMed]
- van den Engel-Hoek, L.; de Groot, I.J.M.; de Swart, B.J.M.; Erasmus, C.E. Feeding and Swallowing Disorders in Pediatric Neuromuscular Diseases: An Overview. J. Neuromuscul. Dis. 2015, 2, 357–369. [Google Scholar] [CrossRef] [PubMed]
- Daley, S.F.; Riaz, Y.; Sergi, C. Pediatric Feeding Disorders: Recognition, Diagnosis, and Management. In StatPearls; StatPearls Publishing: Treasure Island (FL), 2026. [Google Scholar]
- Groce, N.; Challenger, E.; Berman-Bieler, R.; Farkas, A.; Yilmaz, N.; Schultink, W.; Clark, D.; Kaplan, C.; Kerac, M. Malnutrition and Disability: Unexplored Opportunities for Collaboration. Paediatr. Int. Child Health 2014, 34, 308–314. [Google Scholar] [CrossRef] [PubMed]
- Putnick, D.L.; Bell, E.M.; Ghassabian, A.; Robinson, S.L.; Sundaram, R.; Yeung, E. Feeding Problems as an Indicator of Developmental Delay in Early Childhood. J. Pediatr. 2022, 242, 184–191.e5. [Google Scholar] [CrossRef] [PubMed]
- Gangil, A.; Patwari, A.K.; Aneja, S.; Ahuja, B.; Anand, V.K. Feeding Problems in Children with Cerebral Palsy. Indian Pediatr. 2001, 38, 839–846. [Google Scholar] [PubMed]
- Schwarz, S.M.; Corredor, J.; Fisher-Medina, J.; Cohen, J.; Rabinowitz, S. Diagnosis and Treatment of Feeding Disorders in Children With Developmental Disabilities. Pediatrics 2001, 108, 671–676. [Google Scholar] [CrossRef] [PubMed]
- Klein, A.; Uyehara, M.; Cunningham, A.; Olomi, M.; Cashin, K.; Kirk, C.M. Nutritional Care for Children with Feeding Difficulties and Disabilities: A Scoping Review. PLoS Glob. Public Health 2023, 3, e0001130. [Google Scholar] [CrossRef] [PubMed]
- Rice, I.; Opondo, C.; Nyesigomwe, L.; Ekude, D.; Magezi, J.; Kalanzi, A.; Kerac, M.; Hayes, J.; Robello, M.; Halfman, S.; et al. Children with Disabilities Lack Access to Nutrition, Health and WASH Services: A Secondary Data Analysis. Matern. Child. Nutr. 2024, 20, e13642. [Google Scholar] [CrossRef] [PubMed]

Table 1.
Baseline Characteristics of Children 0-18 years old in Holt’s CNP by Nutrition Status.
| Variables | Nutrition Status | ||||||||
| Total population (n=13,370) | Normal growth (7,290) 54.5% | Moderate malnutrition (3,287) 24.6% | Severe malnutrition (2,793) 20.9% |
Chi-square/ ANOVA p-value |
|||||
| n | % | n | % | n | % | n | % | ||
| Morbidity | <.0001 | ||||||||
| No morbidity | 11012 | 82.4 | 6153 | 84.4 | 2693 | 81.9 | 2166 | 77.5 | |
| Have at least one morbidity | 2358 | 17.6 | 1137 | 15.6 | 594 | 18.1 | 627 | 22.5 | |
| Age | <.0001 | ||||||||
| < 1 year | 2798 | 20.9 | 1245 | 17.1 | 626 | 19.0 | 927 | 33.2 | |
| 1-5 years | 7343 | 54.9 | 3844 | 52.7 | 2076 | 63.2 | 1423 | 50.9 | |
| 6-18 years | 3229 | 24.2 | 2201 | 30.2 | 585 | 17.8 | 443 | 15.9 | |
| Sex | 0.0017 | ||||||||
| Female | 6773 | 50.7 | 2776 | 51.8 | 1662 | 50.6 | 1335 | 47.8 | |
| Male | 6597 | 49.3 | 3514 | 48.2 | 1625 | 49.4 | 1458 | 52.2 | |
| Birth weight: Mean (SD) | 2.41 (0.63) | 2.43 (0.64) | 2.40 (0.59) | 2.36 (0.64) | <.0001 | ||||
| Disability | <.0001 | ||||||||
| No disability | 10398 | 77.8 | 5866 | 80.5 | 2640 | 80.3 | 1892 | 67.7 | |
| At least one disability/medical need | 2972 | 22.3 | 1424 | 19.5 | 647 | 19.7 | 901 | 32.3 | |
| Settings | <.0001 | ||||||||
| Institution-based care | 6120 | 45.8 | 2912 | 40.0 | 1619 | 49.3 | 1589 | 56.9 | |
| Foster care | 400 | 3.0 | 241 | 3.3 | 73 | 2.2 | 86 | 3.1 | |
| Community/Day care | 6850 | 51.2 | 4137 | 56.7 | 1595 | 48.5 | 1118 | 40.0 | |
| Iron Supplementation | <.0001 | ||||||||
| No | 11794 | 88.2 | 6734 | 92.4 | 2866 | 87.2 | 2194 | 78.6 | |
| Yes | 1576 | 11.8 | 556 | 7.6 | 421 | 12.8 | 599 | 21.4 | |
| Vitamin/Mineral Supplementation | <.0001 | ||||||||
| No | 9572 | 71.6 | 5534 | 75.9 | 2327 | 70.8 | 1711 | 61.3 | |
| Yes | 3798 | 28.4 | 1756 | 24.1 | 960 | 29.2 | 1082 | 38.7 | |
| Food Supplementation | <.0001 | ||||||||
| No | 12156 | 90.9 | 6474 | 92.2 | 2920 | 88.8 | 2512 | 89.9 | |
| Yes | 1214 | 9.1 | 566 | 7.8 | 367 | 11.2 | 281 | 10.1 | |
| Feeding Difficulties | <.0001 | ||||||||
| No | 11667 | 87.2 | 6483 | 88.9 | 2881 | 87.6 | 2303 | 82.5 | |
| Yes | 1708 | 12.8 | 811 | 11.1 | 407 | 12.4 | 490 | 17.5 | |
Table 2.
Prevalence of Malnutrition among Children 0-18 years old in Holt’s CNP.
| Moderate Malnutrition (3,287) | Severe Malnutrition (2,793) | |||
| n | % | n | % | |
| Disability | ||||
| Have disability | 2640 | 25.4 | 1892 | 18.2 |
| At least one disability/medical need | 647 | 21.9 | 901 | 30.3 |
| Settings | ||||
| Institution-based care | 1619 | 26.4 | 1589 | 26.0 |
| Foster care | 73 | 18.3 | 86 | 21.5 |
| Community/Day care | 1595 | 23.3 | 1118 | 16.3 |
| Feeding Difficulties | ||||
| No | 2881 | 24.7 | 2303 | 19.7 |
| Yes | 407 | 23.8 | 490 | 28.7 |
Table 3.
Logistic regression of the association between Malnutrition status and any morbidity, including individual morbidities among Children 0-18 Years old in Holt’s CNP at baseline screening (n=13,370).
Table 3.
Logistic regression of the association between Malnutrition status and any morbidity, including individual morbidities among Children 0-18 Years old in Holt’s CNP at baseline screening (n=13,370).
|
Malnutrition Categories |
Any Morbidities |
Cough | Diarrhea | Fever |
Nausea/ Vomiting |
Constipation | Hospitalization | |
| Model a | NG | 1.00 (ref) | 1.00 (ref) | 1.00 (ref) | 1.00 (ref) | 1.00 (ref) | 1.00 (ref) | 1.00 (ref) |
| MM | 1.12 (1.00,1.25) |
1.12 (0.99, 1.26) |
1.20 (0.93, 1.55) |
1.21 (1.03, 1.42) |
0.91 (0.69, 1.20) |
1.1 (0.85, 1.41) |
1.24 (0.90, 1.71) |
|
| SM |
1.39 (1.25, 1.56) |
1.24 (1.1, 1.41) |
1.19 (0.91, 1.54) |
1.19 (1.00, 1.40) |
1.18 (0.90, 1.54) |
1.36 (1.05, 1.75) |
2.52 (1.92, 3.31) |
|
| Model b | NG | 1.00 (ref) | 1.00 (ref) | 1.00 (ref) | 1.00 (ref) | 1.00 (ref) | 1.00 (ref) | 1.00 (ref) |
| MM |
1.18 (1.05, 1.32) |
1.16 (1.01, 1.32) |
1.26 (0.96, 1.65) |
1.22 (1.03, 1.44) |
0.93 (0.69, 1.26) |
1.24 (0.96, 1.62) |
1.23 (0.88, 1.73) |
|
| SM |
1.43 (1.27, 1.61) |
1.22 (1.07, 1.40) |
1.34 (0.85, 1.51) |
1.14 (0.95, 1.37) |
1.06 (0.78, 1.45) |
1.65 (1.27, 2.13) |
2.37 (1.76, 3.19) |
|
| Model c | NG | 1.00 (ref) | 1.00 (ref) | 1.00 (ref) | 1.00 (ref) | 1.00 (ref) | 1.00 (ref) | 1.00 (ref) |
| MM | 1.08 (0.96, 1.20) |
1.06 (0.94, 1.20) |
1.15 (0.89, 1.49) |
1.15 (0.98, 1.35) |
0.87 (0.66, 1.15) |
1.22 (0.94, 1.57) |
1.15 (0.84, 1.59) |
|
| SM |
1.29 (1.15, 1.45) |
1.14 (1.0, 1.29) |
1.08 (0.83, 1.41) |
1.08 (0.91, 1.28) |
1.08 (0.82, 1.42) |
1.72 (1.33, 2.23) |
2.22 (1.68, 2.93) |
|
| Model d | NG | 1.00 (ref) | 1.00 (ref) | 1.00 (ref) | 1.00 (ref) | 1.00 (ref) | 1.00 (ref) | 1.00 (ref) |
| MM | 1.10 (0.98, 1.23) |
1.10 (0.97, 1.25) |
1.14 (0.88, 1.47) |
1.18 (1.00, 1.38) |
0.85 (0.64, 1.12) |
1.16 (0.9, 1.50) |
1.17 (0.85, 1.61) |
|
| SM |
1.26 (1.12, 1.42) |
1.15 (1.0, 1.31) |
0.99 (0.75, 1.30) |
1.06 (0.90, 1.26) |
0.95 (0.72, 1.25) |
1.5 (1.16, 1.92) |
2.13 (1.61, 2.82) |
|
| Model e | NG | 1.00 (ref) | 1.00 (ref) | 1.00 (ref) | 1.00 (ref) | 1.00 (ref) | 1.00 (ref) | 1.00 (ref) |
| MM | 1.11 (0.99, 1.24) |
1.10 (0.97, 1.25) |
1.19 (0.92, 1.54) |
1.20 (1.02, 1.40) |
0.88 (0.67, 1.17) |
1.03 (0.79, 1.35) |
1.23 (0.89, 1.69) |
|
| SM |
1.26 (1.24, 1.42) |
1.14 (1.0, 1.30) |
1.08 (0.83, 1.41) |
1.07 (0.90, 1.27) |
1.00 (0.76, 1.31) |
1.00 (0.77, 1.3) |
2.34 (1.78, 3.08) |
Model a: Adjust for demographics ---- Age, sex; Model b: Adjust for birth factors ---- Model a + birthweight; Model c: Adjust for care environment and location ---- Model a + Setting; Model d: Adjust for supplementation ---- Model a + iron, multivitamin, food supplements; Model e: Adjust for physical need ---- Model a + feeding difficulties; NG = Normal growth, MM = Moderate malnutrition, SM = Severe malnutrition.
Table 4.
Stratified logistic regression analysis of malnutrition and morbidity by disability status among children 0-18 years old participating in the Child Nutrition Program at baseline screening (n=13,370).
Table 4.
Stratified logistic regression analysis of malnutrition and morbidity by disability status among children 0-18 years old participating in the Child Nutrition Program at baseline screening (n=13,370).
| Any Morbidity | |||
| Malnutrition Categories | Disability | No Disability | |
| Model a | NG | 1.00 (ref) | 1.00 (ref) |
| MM | 1.25 (1.03, 1.53) | 1.0 (0.87, 1.15) | |
| SM | 1.18 (0.99, 1.42) | 0.95 (0.81, 1.12) | |
| Model b | NG | 1.00 (ref) | 1.00 (ref) |
| MM | 1.28 (1.03, 1.58) | 1.03 (0.89, 1.20) | |
| SM | 1.24 (1.02, 1.52) | 0.95 (0.80, 1.13) | |
| Model c | NG | 1.00 (ref) | 1.00 (ref) |
| MM | 1.23 (1.01, 1.51) | 0.92 (0.79, 1.06) | |
| SM | 1.16 (0.96, 1.40) | 0.80 (0.67, 0.94) | |
| Model d | NG | 1.00 (ref) | 1.00 (ref) |
| MM | 1.21 (0.99, 1.48) | 0.97 (0.83, 1.12) | |
| SM | 1.22 (1.01, 1.47) | 0.82 (0.69, 0.97) | |
| Model e | NG | 1.00 (ref) | 1.00 (ref) |
| MM | 1.22 (0.99, 1.49) | 1.02 (0.88, 1.18) | |
| SM | 1.17 (0.97, 1.41) | 0.99 (0.84, 1.16) | |
Model a: Adjust for demographics ---- Age, sex; Model b: Adjust for birth factors ---- Model a + birthweight; Model c: Adjust for care environment and location ---- Model a + Setting; Model d: Adjust for supplementation ---- Model a + iron, multivitamin, food supplements; Model e: Adjust for physical need ---- Model a + feeding difficulties; NG = Normal growth, MM = Moderate malnutrition, SM = Severe malnutrition.
Table 5.
2x2 table of the prevalence of morbidities in children 0-18 years old in Holt’s CNP after 1-year of participation by disability status (n=1,452).
Table 5.
2x2 table of the prevalence of morbidities in children 0-18 years old in Holt’s CNP after 1-year of participation by disability status (n=1,452).
| No Morbidity at One-year Screening | Morbidity at One-year Screening | Total | |
| Have Disability | 742 (64.7%) | 406 (35.3%) | 1148 |
| No Morbidity at Baseline Screening | 482 (76.8%) | 145 (23.2%) | 627 |
| Morbidity at Baseline Screening | 260 (49.9%) | 261 (50.1%) | 521 |
| No Disability | 2531 (84.3%) | 473 (15.7%) | 3004 |
| No Morbidity at Baseline Screening | 2334 (89.8%) | 254 (10.2%) | 2488 |
| Morbidity at Baseline Screening | 297 (57.6%) | 219 (42.4%) | 516 |
Table 6.
2x2 table of the prevalence of malnutrition in children 0-18 years old in the CNP after 1-year participation by disability status (n=1,452).
Table 6.
2x2 table of the prevalence of malnutrition in children 0-18 years old in the CNP after 1-year participation by disability status (n=1,452).
| No Malnutrition at One-year Screening | Malnutrition at One-year Screening | Total | |
| Have Disability | 484 (42.2%) | 664 (57.8%) | 1148 |
| No Malnutrition at Baseline Screening | 364 (79.0%) | 97 (21.0%) | 461 |
| Malnutrition at Baseline Screening | 120 (17.5%) | 567 (82.5%) | 687 |
| No Disability | 1923 (64.0%) | 1081 (36.0%) | 3004 |
| No Malnutrition at Baseline Screening | 1459 (86.3%) | 231 (13.7%) | 1690 |
| Malnutrition at Baseline Screening | 464 (35.5%) | 850 (54.7%) | 1314 |
Table 7.
Change in morbidities observed in children 0-18 years old in Holt’s CNP after 1-year of participation within each feeding trajectory (n=1,452).
Table 7.
Change in morbidities observed in children 0-18 years old in Holt’s CNP after 1-year of participation within each feeding trajectory (n=1,452).
| No Morbidity at Screening | Morbidity at Screening | Total | |
| When Feeding Difficulties Improved | 108 (63.2%) | 63 (36.8%) | 171 |
| No Morbidity at Baseline Screening | 65 (71.4%) | 26 (28.6%) | 91 |
| Morbidity at Baseline Screening | 43 (53.8%) | 37 (46.3%) | 80 |
| When Feeding Difficulties Worsened | 80 (55.6%) | 64 (44.4%) | 144 |
| No Morbidity at Baseline Screening | 52 (69.3%) | 23 (30.7%) | 75 |
| Morbidity at Baseline Screening | 28 (40.6%) | 41 (59.4%) | 69 |
| When Feeding Difficulties Persisted | 392 (62.3%) | 237 (37.7%) | 629 |
| No Morbidity at Baseline Screening | 262 (77.5%) | 76 (22.5%) | 338 |
| Morbidity at Baseline Screening | 130 (44.7%) | 161 (55.3%) | 291 |
| When there were no Feeding Difficulties | 2693 (84.0%) | 515 (16.1%) | 3208 |
| No Morbidity at Baseline Screening | 2337 (89.5%) | 274 (10.5%) | 2611 |
| Morbidity at Baseline Screening | 356 (59.6%) | 241 (40.4%) | 597 |
Disclaimer/Publisher’s Note: The statements, opinions and data contained in all publications are solely those of the individual author(s) and contributor(s) and not of MDPI and/or the editor(s). MDPI and/or the editor(s) disclaim responsibility for any injury to people or property resulting from any ideas, methods, instructions or products referred to in the content. |
© 2026 by the authors. Licensee MDPI, Basel, Switzerland. This article is an open access article distributed under the terms and conditions of the Creative Commons Attribution (CC BY) license (http://creativecommons.org/licenses/by/4.0/).
Copyright: This open access article is published under a Creative Commons CC BY 4.0 license, which permit the free download, distribution, and reuse, provided that the author and preprint are cited in any reuse.