

Submitted:
20 August 2026
Posted:
21 August 2026
You are already at the latest version
Abstract
Electric vehicle (EV) powertrains couple electrochemical and electromechanical subsystems whose interacting degradation and thermal behaviours are difficult to observe with conventional bench testing alone. This paper presents a modular digital twin (DT) framework for EVs that couples high-fidelity, open-source battery modelling in PyBaMM (Python Battery Mathematical Modelling), based on the Doyle–Fuller–Newman (DFN) electrochemical model, with electromechanical motor simulation in the GYM Electric Motor (GEM) library for a permanent magnet synchronous motor (PMSM). A physics-based vehicle-dynamics layer converts a commanded speed profile into power demand and coordinates energy flow between the two subsystems in real time. The framework was exercised over standardized highway, urban, and combined drive cycles and evaluated in terms of state of charge (SoC), state of health (SoH), remaining useful life (RUL), torque, efficiency, and thermal behaviours. An interactive web-based dashboard exposes these metrics for simulation control and visual diagnostics. Correlation analysis of the resulting time-series confirms physically consistent relationships among key variables, notably a near-unity correlation between vehicle speed and motor speed and a strong thermal coupling (r = 0.91) between battery and motor temperature, which supports the framework’s validity as a basis for predictive maintenance and control-strategy research. The results indicate that coupling open-source, physics-based battery and motor solvers within a single interactive DT is a practical and extensible route to EV powertrain diagnostics that does not depend on proprietary simulation suites.
Keywords:
electric vehicles
; digital twin
; battery management
; PyBaMM
; GYM electric motor
; state of charge
; predictive maintenance
1. Introduction
Global electric car sales exceeded 17 million units in 2024, a year-on-year increase of more than 25%, while more than 1.3 million new public charging points were added, representing an annual increase above 30%, as battery costs and vehicle prices continued to fall, according to the International Energy Agency [1]. This rapid uptake has been driven by tightening environmental regulation, falling battery prices, and expanding charging infrastructure, with the Asia-Pacific region leading global sales and Europe and North America following, as reported in industry analyses of the automotive digital twin market [2,3].
Despite this growth, fundamental challenges remain in both the battery and motor subsystems of EVs. On the battery side, capacity degradation with age, thermal instability, and the difficulty of estimating state of health under real driving conditions continue to constrain range, safety, and warranty planning, motivating digital twin models built around the embedded battery management system (BMS) to address these state-estimation and monitoring gaps [4]. On the motor side, electric traction motors face persistent trade-offs between magnet cost, efficiency across the full operating envelope, torque ripple, and thermal management, which continue to motivate refined control strategies and simulation-based design [5].
Digital twins, understood as virtual representations of a physical asset that are kept synchronised with it through data exchange across the asset’s lifecycle, offer a way to address these challenges jointly rather than in isolation [6,7]. In EV powertrain applications, digital twins have been used for diagnostics, degradation prediction, scenario and risk assessment, and system-level health monitoring, and can be constructed at the level of the full vehicle, individual subsystems, or individual components [8].
The main contribution of this paper is a modular DT framework that integrates high-fidelity, open-source battery modelling in PyBaMM with electromechanical motor simulation in GYM Electric Motor, coordinated through a physics-based vehicle-dynamics layer that converts a commanded speed profile into power demand for both subsystems in real time [9,10,11]. The framework computes SoC, SoH, RUL, torque, power, and thermal behaviours, and exposes these metrics through an interactive, web-based dashboard that supports simulation control and visual diagnostics. Unlike EV digital twins built around proprietary suites such as MATLAB/Simulink, or studies that model the battery and motor subsystems separately, the framework couples two actively maintained open-source solvers within a single interactive tool, which lowers the barrier to reproducing and extending EV powertrain digital twins in academic settings.
The main contributions of this paper are summarized as follows.
- A modular digital twin framework is proposed, coupling open-source battery and motor solvers for electric vehicles.
- Battery dynamics are represented with the Doyle–Fuller–Newman electrochemical model in PyBaMM, and motor dynamics are represented with GYM Electric Motor.
- A shared vehicle-dynamics layer synchronizes power demand between the battery and motor subsystems in real time.
- State of charge, state of health, remaining useful life, torque, power, and thermal behaviours are computed and exposed through an interactive dashboard.
- Physically consistent correlations are demonstrated across highway, urban, and combined drive cycles, including a strong thermal coupling between battery and motor temperature.
The remainder of the paper is organized as follows. Section 2 reviews related work on digital twins in EVs and adjacent autonomous systems. Section 3 details the proposed framework, covering the system architecture, the frontend, and the backend battery, motor, and vehicle-dynamics models. Section 4 presents simulation experiments over standardized drive cycles, together with a correlation analysis of the resulting data and a discussion of the framework’s limitations. Section 5 concludes the paper and outlines directions for future work.
2. Related Work
The digital twin concept was introduced as a virtual counterpart that mirrors a physical system across its lifecycle in order to mitigate unpredictable emergent behaviours [7], and has since been given a more product-development-oriented definition emphasizing bidirectional data exchange between the physical and virtual representations [6]. Building on these foundations, digital twins have been applied across a wide range of cyber-physical domains, including autonomous robotics, unmanned aerial vehicles, and connected and autonomous ground vehicles, typically for scenario evaluation, safety assessment, and trust-building between collaborating autonomous agents [12], before being adopted more specifically within the automotive and EV powertrain domain [3,8].
Within the EV domain specifically, reviews of digital twin applications in the powertrain identify the power source, power electronics, and electric motor as the three core subsystems most commonly targeted, and note that most published implementations address only one of these subsystems at a time rather than their coupled dynamics [8]. On the battery side, digital twin models have been built directly around the embedded battery management system to enable real-time state estimation without additional hardware or sensor calibration [4], while comparative studies using PyBaMM have evaluated the trade-off between electrochemical model fidelity, for example the Single Particle Model, the Single Particle Model with Electrolyte, and the full DFN model, and computational cost for digital-twin-oriented battery state estimation [13].
On the motor side, reviews of EV traction motors highlight persistent challenges around cost, efficiency, and control across the permanent magnet synchronous motor (PMSM), induction motor, and switched reluctance motor topologies that dominate current EV designs [5], motivating simulation environments such as GYM Electric Motor that provide standardized, reinforcement-learning-compatible interfaces for motor control research [10,11]. Table 1 summarizes this body of work, categorized by domain and by the underlying method or tool.
The present work differs from this body of literature in two respects. First, rather than modelling the battery or the motor in isolation, the two subsystems are coupled, using PyBaMM for the battery and GYM Electric Motor for the PMSM, through a shared vehicle-dynamics layer that converts a single commanded speed profile into power demand for both subsystems simultaneously, allowing joint battery and motor interactions, such as thermal coupling and power-sharing under regenerative braking, to be observed directly. Second, both underlying solvers are open-source and actively maintained, which distinguishes the framework from EV digital twins built around commercial simulation environments and makes the approach straightforward to reproduce and extend.
3. Proposed Digital Twin Framework
The objective of the proposed EV digital twin framework is to provide a simulation tool that accurately replicates the dynamic behaviours of an EV powertrain under diverse driving conditions. The system integrates vehicle, battery, and motor models into a modular architecture that supports flexible upgrades and component replacement.
At its core, the framework processes a commanded speed profile that drives a physics-based vehicle model computing acceleration, resistive forces such as aerodynamic drag and rolling resistance, and the resulting instantaneous power demand.
Power demand is then distributed between the battery and motor models. The battery model, implemented in PyBaMM around the DFN electrochemical model, receives the power demand and computes current draw, SoC, terminal voltage, and internal temperature using an ordinary differential equation (ODE) solver that captures degradation and thermal effects. In parallel, the motor model, implemented in GYM Electric Motor for a PMSM, receives the corresponding torque request and simulates the electromechanical response, including motor speed, torque generation, power losses, overall efficiency, and, at high speed, field-weakening behaviour. A tightly coordinated interaction is maintained between the two subsystems throughout the simulation to preserve energy-flow consistency. Outputs are produced as high-resolution time-series data, comprising vehicle speed and acceleration, motor torque, speed, and efficiency, and battery SoC, voltage, current, and temperature, which are visualised through the dashboard and exportable as CSV files for offline analysis.
3.1. System Architecture
The framework follows a modular pipeline, illustrated in Figure 1: a driver-commanded speed profile is processed first by the battery model in PyBaMM, which outputs voltage, temperature, SoC, and SoH; this voltage feeds the motor model in GYM Electric Motor, which in turn computes torque, speed, efficiency, and RUL. This layered structure allows either solver to be replaced or refined, for example by swapping the DFN model for a reduced-order equivalent-circuit model, without altering the surrounding interface.
3.2. Frontend: Control and Visualisation
The user-facing layer is a responsive, browser-based dashboard built with HTML, CSS, JavaScript, and Bootstrap for layout and styling, with a Flask-based Python backend serving simulation requests and streaming results to the client, as presented in Figure 2. Vehicle speed is set through a slider, and Start, Pause, and Stop controls govern the simulation; the requested speed is continually compared against the simulated vehicle speed to derive acceleration or braking commands that are propagated to the motor, battery, and vehicle-dynamics models. Figure 2(a) shows the simulation control panel, where the target speed is set and the run is started, paused, stopped, exported to CSV, or summarised in a generated report, alongside live speed and SoC trends. Figure 2(b) shows the battery diagnostics panel, reporting SoH, RUL in cycles, pack configuration, and rated capacity. Figure 2(c) shows the motor diagnostics panel, reporting efficiency, temperature, RUL in hours, predicted time to failure, and rated power. Figure 2(d) shows the reports panel, from which a full detailed simulation report summarising vehicle, battery, and motor parameters can be generated and downloaded.
3.3. Backend Simulation Engine
3.3.1. Vehicle Dynamics and Power Demand
The vehicle-dynamics layer converts the commanded speed profile into the tractive force and instantaneous electrical power demand supplied to the battery and motor models, accounting for aerodynamic drag, rolling resistance, and the inertial force required to track the commanded acceleration. This layer also mediates the reverse energy path during deceleration, routing recovered kinetic energy back to the battery model as a negative power demand to emulate regenerative braking. In the reference configuration, summarized in Table 2, the vehicle is parameterized as a 2,000 kg passenger EV with a 0.33 m wheel radius, a 9.0:1 fixed gear ratio, and a 0.28 aerodynamic drag coefficient.
3.3.2. Battery Modelling with PyBaMM
The battery, as the core energy-storage component of the EV, was modelled with priority given to physical accuracy. PyBaMM was selected for its open-source, flexible architecture and its library of physics-based electrochemical models [9]. The DFN model was adopted for its fine spatial resolution across the electrolyte, anode, separator, and cathode, and its correspondingly strong predictive capability for terminal voltage and thermal behaviour, at the cost of greater computational load than reduced-order alternatives such as the Single Particle Model [13,14]. In the reference configuration, the pack is modelled as a nickel-manganese-cobalt (NMC) chemistry with a 96S4P cell arrangement, a nominal capacity of 75.0 Ah, and a nominal pack voltage of 410 V. PyBaMM’s ODE/DAE solver is used to compute SoC via coulomb counting, SoC-to-voltage behaviours via internal resistance, current draw from power demand, and thermal response; the same solver architecture supports the addition of empirical SoH degradation models in extended configurations.
3.3.3. Motor Modelling with GYM Electric Motor
Motor simulation followed a parallel path. GYM Electric Motor (GEM) was selected for its standardized, reinforcement-learning-compatible electric-drive environments and built-in control algorithms for modelling a PMSM [10,11]. The reference PMSM is rated at 150 kW, with a peak rating of 250 kW, coupled to a 400 V DC bus, and configured to deliver up to 300 Nm of peak torque. GEM is used to simulate motor speed, demand-tracking torque delivery, power consumption, and thermal behaviours, and, at high operating speed, field-weakening effects that extend the constant-power region, which together balance model complexity against real-time execution requirements within the wider simulation loop.
3.3.4. Health and Prognostic Indicators
Three indicators summarise powertrain health across both subsystems. State of Charge (SoC) expresses the battery’s instantaneous charge level as a percentage of full capacity, derived from real-time voltage, current, and temperature data, and is central to range estimation and charge-cycle management. State of Health (SoH) expresses the battery’s present capacity relative to its rated capacity, starting at 100% for a new pack and decreasing with degradation, and is used to project remaining battery lifespan and to inform charging strategy. Remaining Useful Life (RUL) is estimated for both the battery and the motor, expressed in equivalent cycles or in calendar time, such as the number of days or hours remaining before the component is expected to require replacement or major service, and underpins the predictive-maintenance use case of the framework.
4. Simulation Results and Discussion
4.1. Experimental Setup
To characterize EV behaviours across representative operating conditions, the framework was exercised over three standardized drive-cycle scenarios, namely highway, urban, and combined, each commanding a speed profile with acceleration from rest, a cruise segment, and deceleration, so as to observe component interaction during power ramp-up, steady-state operation, and simulated regenerative braking. Individual components were additionally exercised in isolation: the battery model under constant current charge and discharge profiles and power ramps to validate capacity and voltage response, and the motor model under speed and torque ramps to assess dynamic response and efficiency. While these targeted tests do not capture the full complexity of real-world driving, they were sufficient to confirm correct component behaviours and correct interaction between the custom-built subsystems. Table 2 summarizes the input parameters common to all three scenarios together with the resulting peak operating values, and Figure 3, Figure 4, Figure 5 and Figure 6 show the corresponding SoC, torque, power, and speed trends.

Table 2.
Reference vehicle, battery, and motor parameters and peak operating values by drive cycle.
| Parameter | Highway | Urban | Combined |
|---|---|---|---|
| Battery capacity (kWh) | 75.0 | 75.0 | 75.0 |
| Nominal battery voltage (V) | 410.0 | 410.0 | 410.0 |
| Motor rated power (kW) | 150.0 | 150.0 | 150.0 |
| Vehicle mass (kg) | 2000.0 | 2000.0 | 2000.0 |
| Wheel radius (m) | 0.33 | 0.33 | 0.33 |
| Gear ratio | 9.0 | 9.0 | 9.0 |
| Aerodynamic drag coefficient | 0.28 | 0.28 | 0.28 |
| Average speed (km/h) | 108 | 36 | 72 |
| Max. distance (km) | 24 | 8.2 | 18 |
| Peak motor speed (rpm) | 9634 | 5880 | 8779 |
| Peak motor temperature (°C) | 130 | 53 | 96 |
| Peak battery temperature (°C) | 45 | 36 | 47 |
| Simulation duration (s) | 400 | 400 | 400 |
4.2. Drive-Cycle Results
As shown in Figure 3, battery SoC falls fastest under highway driving, reflecting sustained high-speed energy draw; the urban cycle shows a slower, step-wise decline consistent with lower average speed and frequent stops that permit regenerative recovery; and the combined cycle falls in between. As illustrated in Figure 4, motor torque is high and comparatively steady on the highway, consistent with sustained acceleration, whereas the urban cycle shows fluctuating torque peaking near 210 Nm as the vehicle repeatedly accelerates from a stop; the combined cycle shows an initial peak followed by a dip as the profile transitions between driving styles.
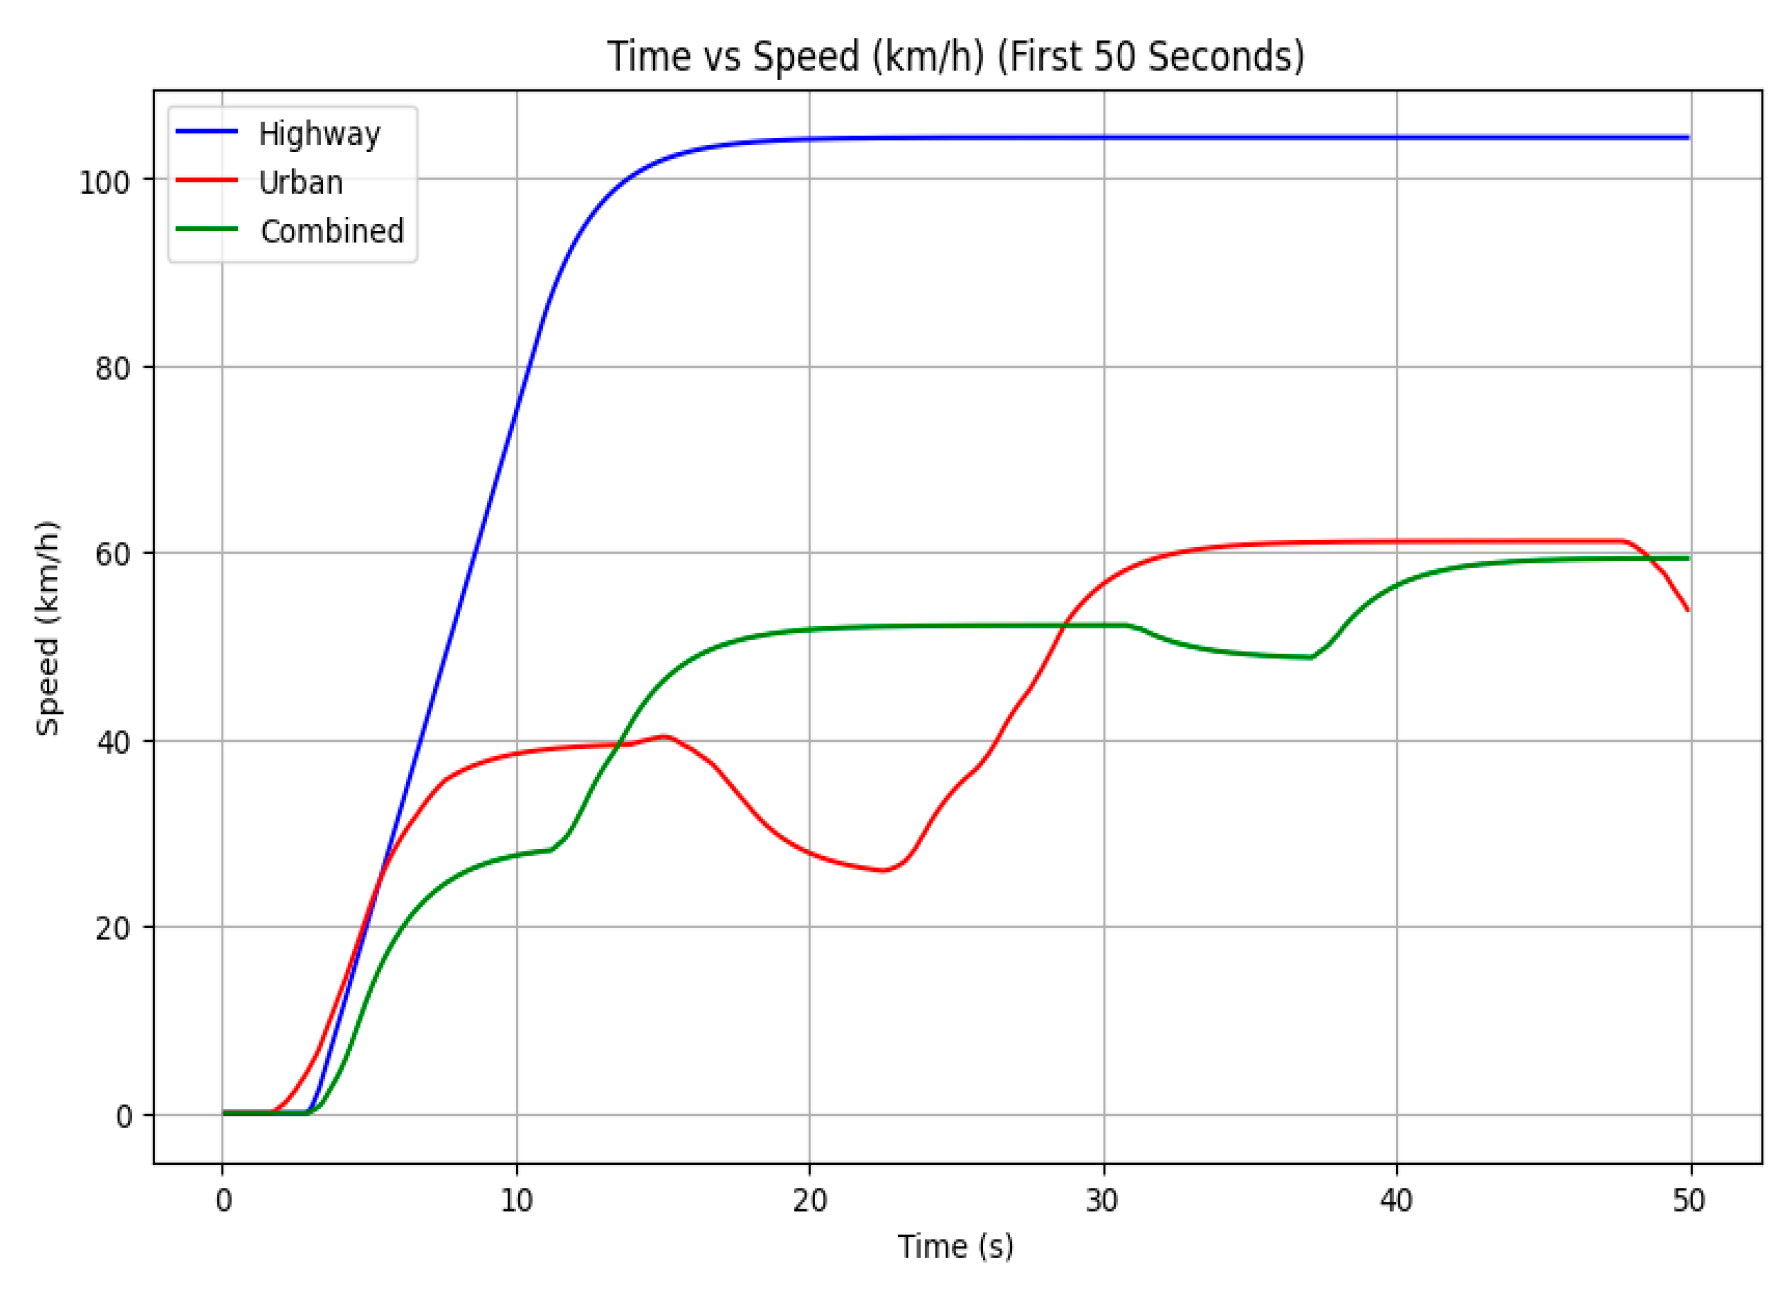
As presented in Figure 5, power demand increases roughly linearly with speed on the highway, exceeding 40 kW under continuous acceleration; the urban cycle shows a brief peak near 38 kW followed by decline as the vehicle alternates between motion and stops; and the combined cycle shows an intermediate peak near 20 kW. Over the first 50 s, as shown in Figure 6, the highway cycle reaches and holds roughly 105 km/h within about 10 s, while the urban and combined cycles show slower, more irregular acceleration peaking near 60 km/h with frequent interruptions, which illustrates the smoother, faster-settling dynamics of highway travel relative to the stop-and-go character of urban and mixed driving.
Beyond the reported peak values, closer inspection of the underlying time series shows several consistent physical patterns. Instantaneous power demand peaks under aggressive acceleration and swings negative during energy recuperation in regenerative braking; battery terminal voltage tracks SoC but sags measurably under peak current draw owing to internal resistance; battery and motor temperatures both rise under sustained high-current operation and relax once load is removed; and motor efficiency is highest near mid-range speed and torque, falling off at the extremes of the operating envelope. These patterns are consistent with expected EV powertrain physics and support the use of the framework as a qualitative diagnostic and predictive-maintenance tool, although the absolute magnitudes have not yet been validated against instrumented vehicle or dynamometer data.
Figure 3.
Battery SoC over the 400 s drive cycle.
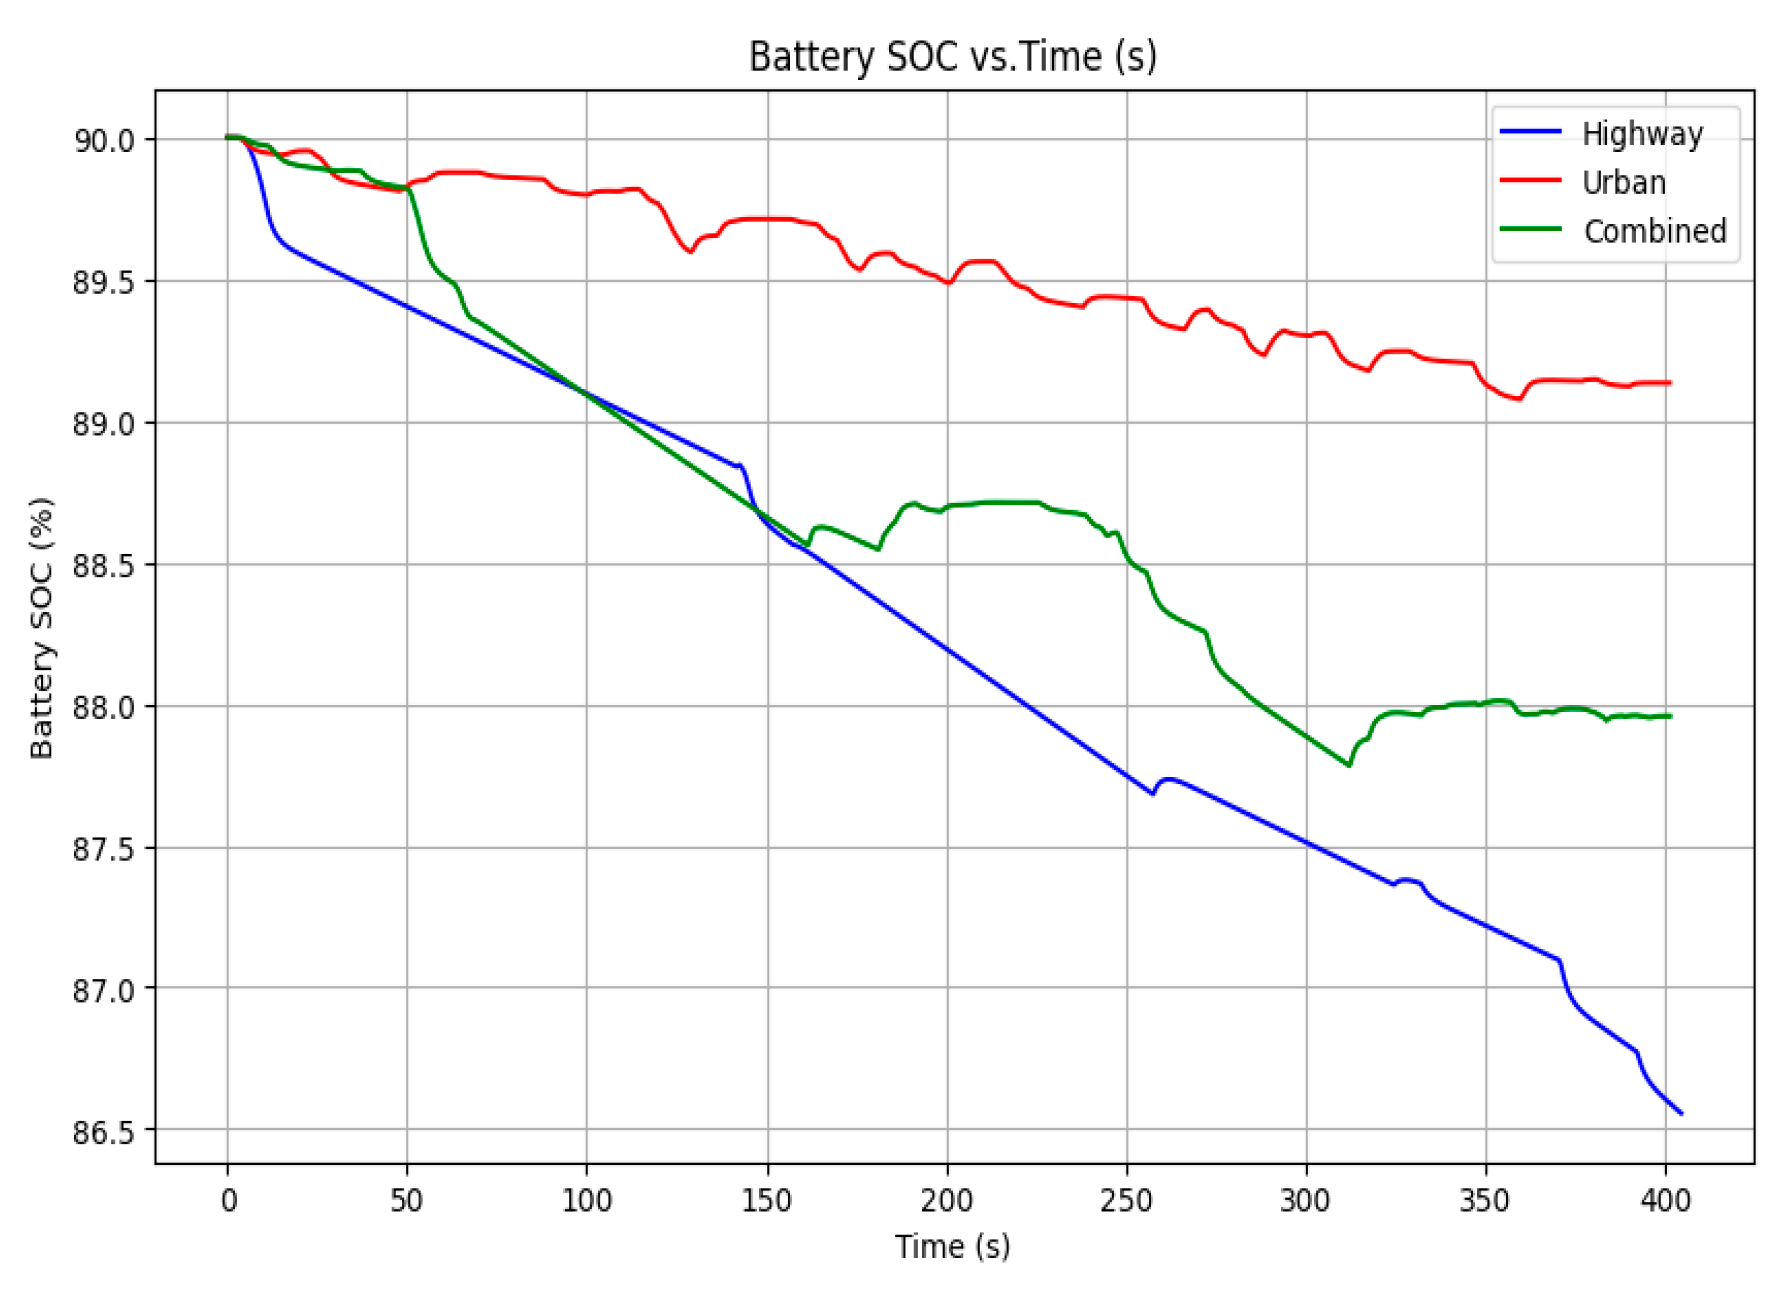
Figure 4.
Motor torque versus motor speed, first 5 s.
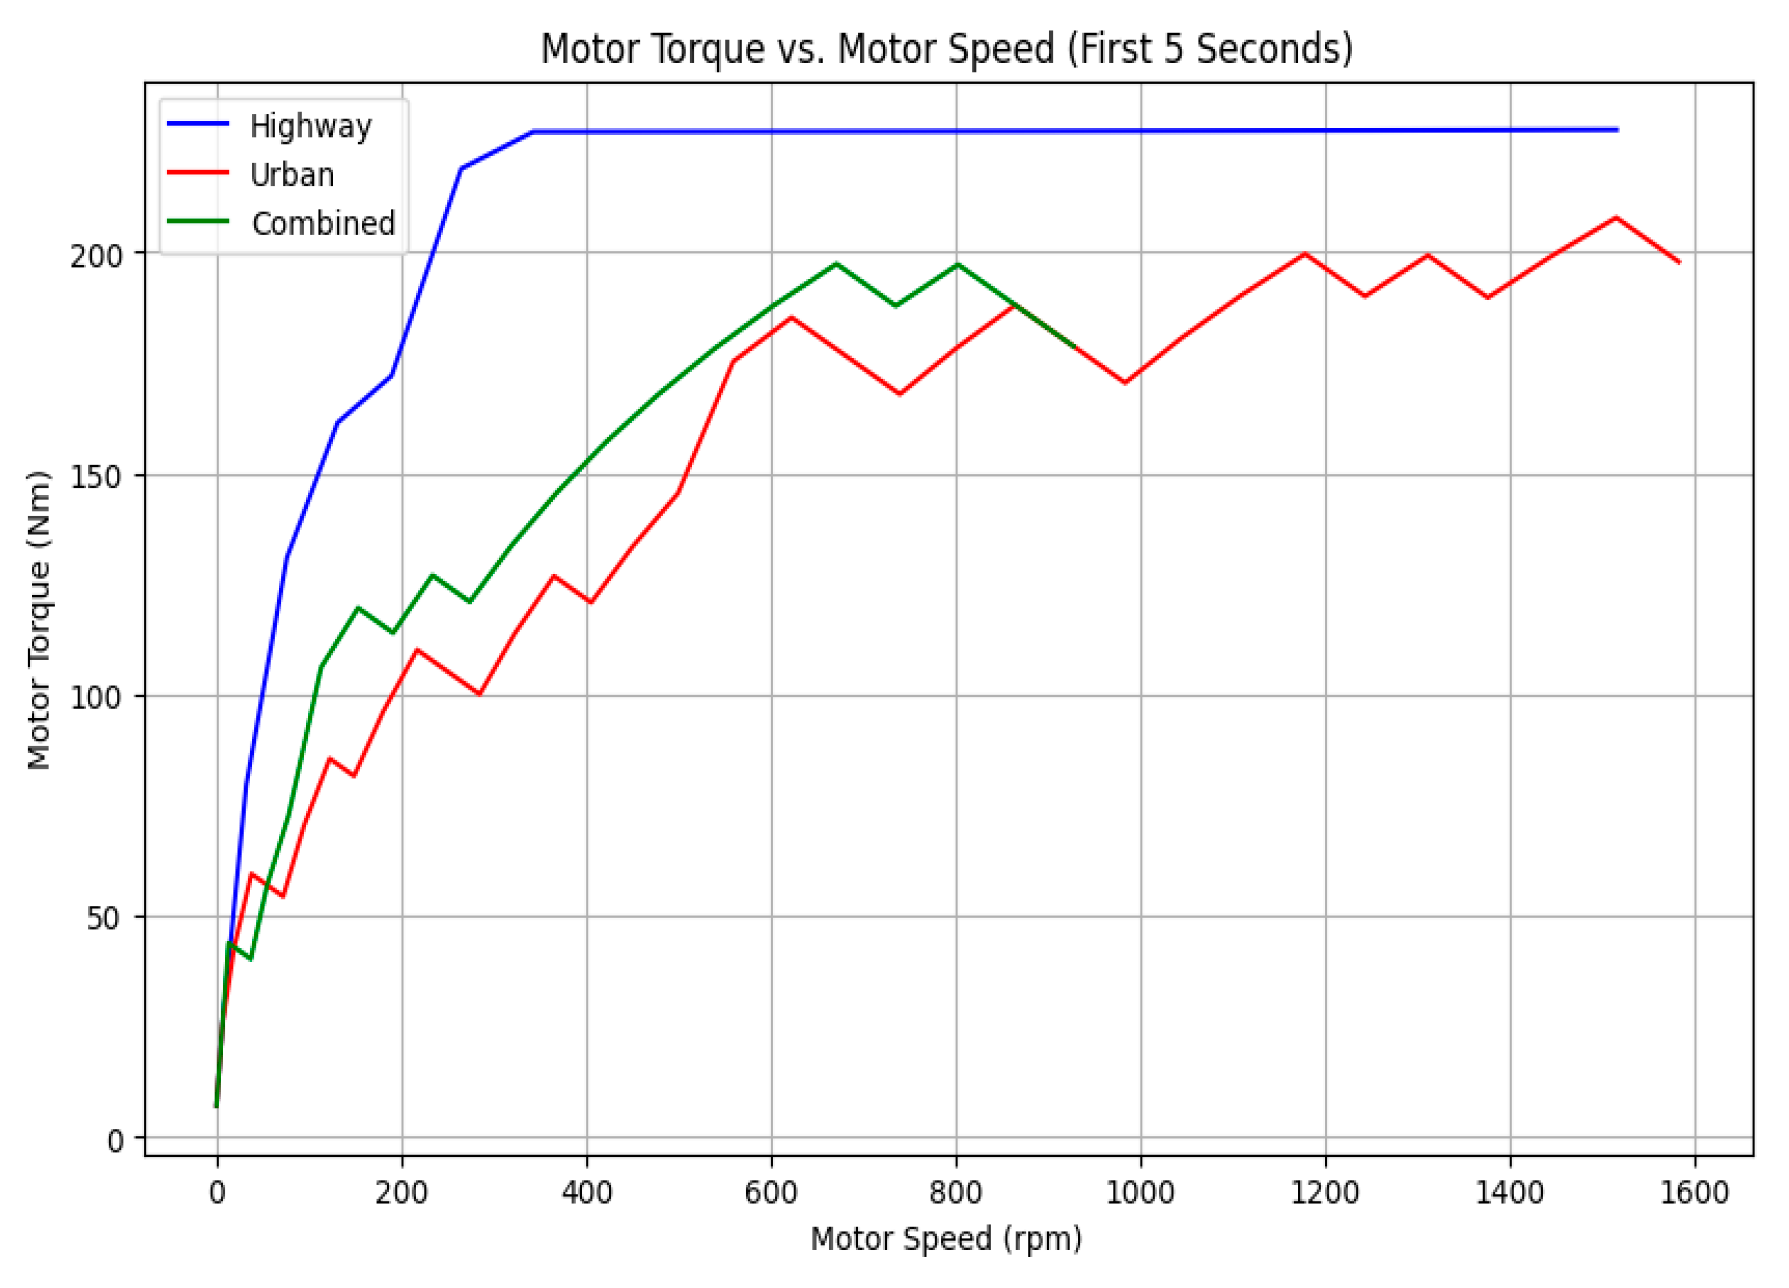
Figure 5.
Power demand versus motor speed, first 5 s.
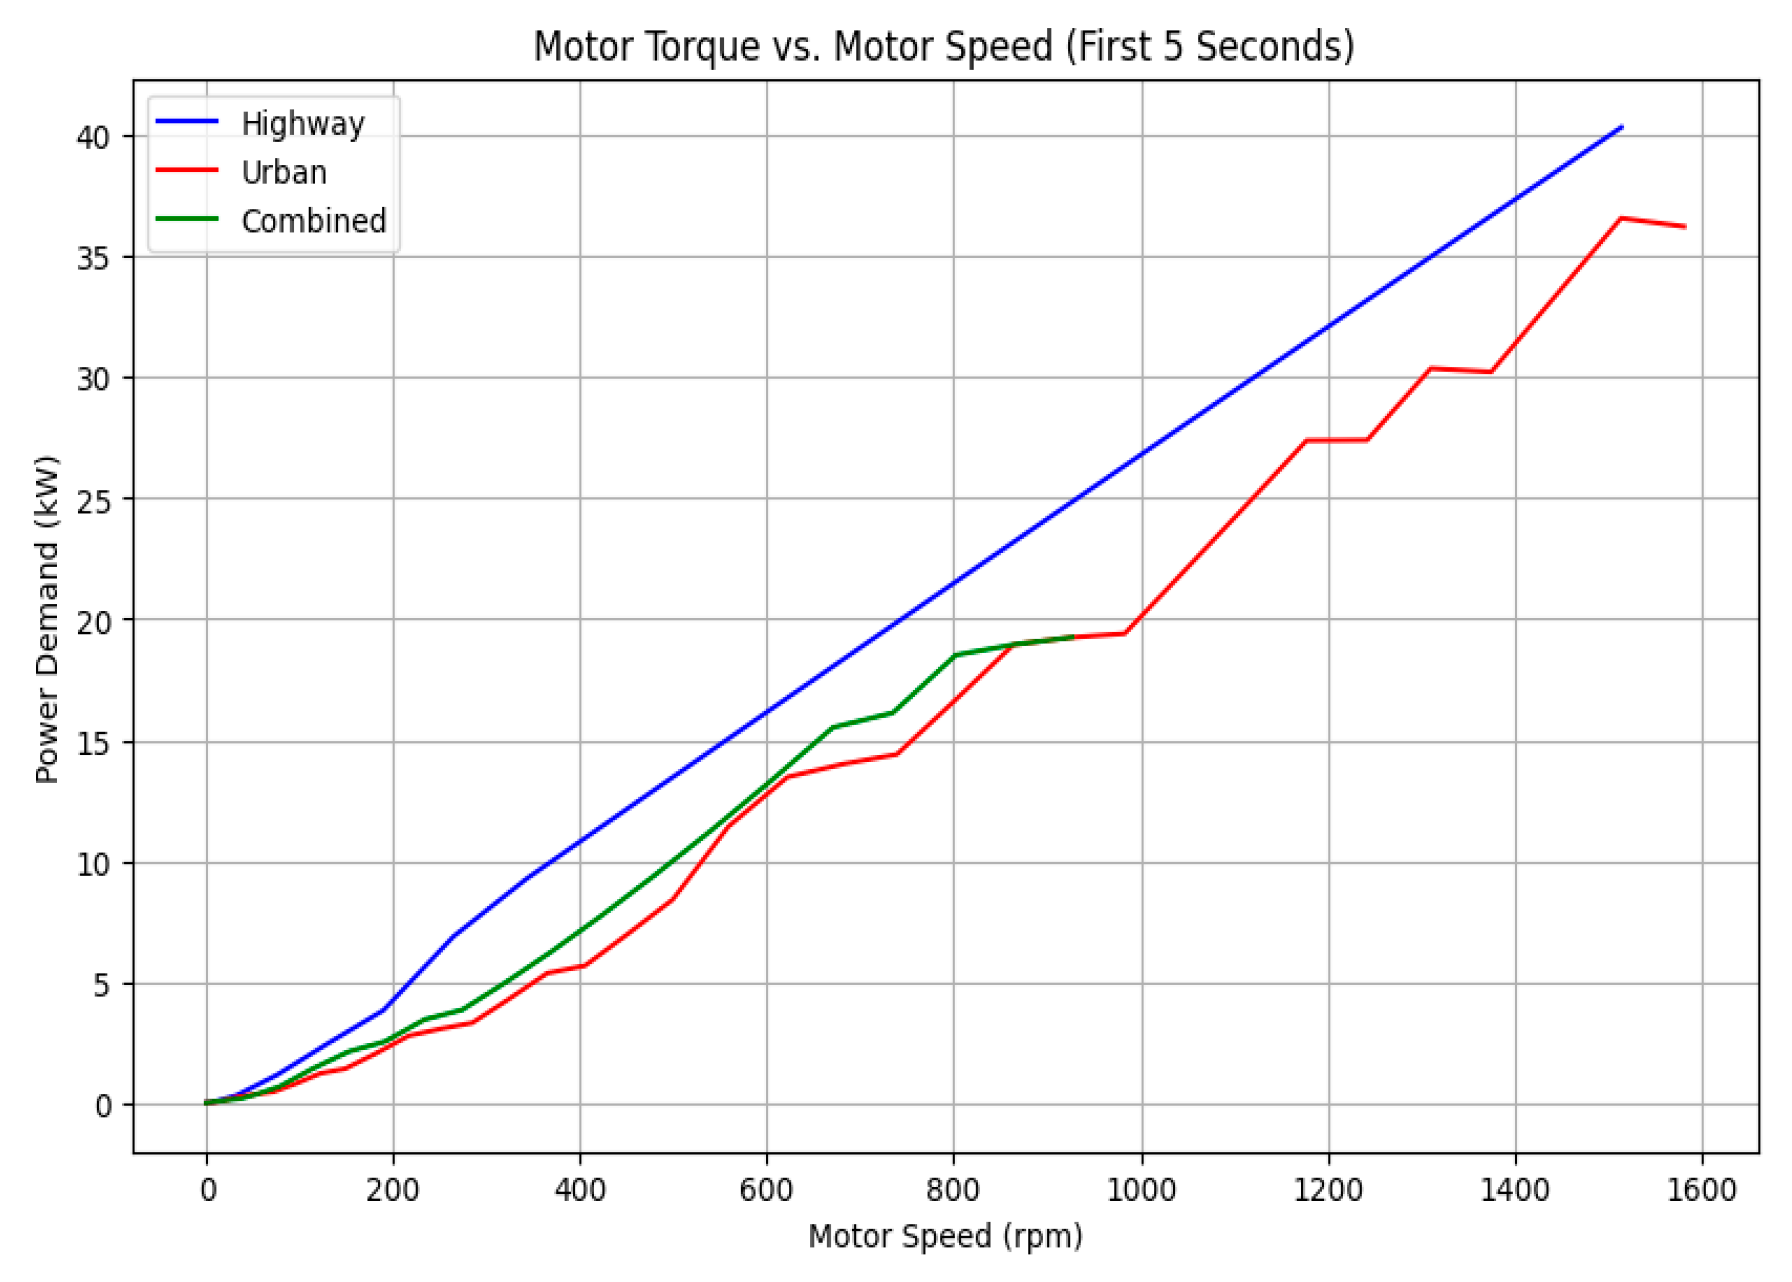
Figure 6.
Vehicle speed versus time for all three cycles, first 50 s.
4.3. Correlation Analysis of Key EV Parameters
A correlation matrix was computed across the pooled simulation output to examine the relationships among key EV parameters, summarized in a plain numerical table to aid interpretation, as presented in Table 3.
Vehicle speed and motor speed are perfectly correlated (r = 1.00), as expected from the fixed gear ratio linking them. Motor torque and power demand are strongly correlated (r = 0.83), reflecting their shared dependence on instantaneous acceleration. Battery SoC is negatively correlated with both speed and motor speed (r = −0.41), consistent with faster energy depletion at higher speed. Battery and motor temperature are strongly correlated (r = 0.91), indicating shared thermal loading under sustained operation, while motor temperature is also strongly correlated with vehicle speed (r = 0.95). These relationships are consistent with the underlying EV powertrain physics and support the use of correlation-based monitoring, for example flagging deviations from these expected relationships as candidate indicators of sensor faults or emerging component degradation, for energy and thermal optimization.
4.4. Challenges and Limitations
The present form of the framework has several limitations that bound the interpretation of the results reported above. First, the vehicle-dynamics layer uses a proportional speed-tracking controller rather than a more representative PID or model-predictive controller, which may under-represent transient response under highly dynamic driving. Second, SoH and RUL prediction rely on empirical degradation relationships rather than fully physics-based electrochemical or fatigue models, trading fidelity for computational tractability. Third, the simulation does not yet represent road gradient, road-surface friction, wind, or driver behaviours beyond the commanded speed profile, nor ancillary electrical loads such as HVAC, infotainment, lighting, and power steering, both of which lead to an underestimate of total energy consumption relative to real-world use. Fourth, vehicle mass is held constant, whereas payload and occupancy vary in practice. Fifth, the full DFN battery model is computationally demanding relative to reduced-order alternatives, creating a fidelity and real-time trade-off that is only partially mitigated by fallback to simpler solvers when the DFN solver fails to converge. Finally, and most importantly for a research contribution intended for external use, the framework has not yet been validated against instrumented real-vehicle or dynamometer data; the physically consistent correlation structure reported above is evidence of internal consistency, not of quantitative accuracy against ground truth.
5. Conclusions and Future Work
This paper introduced a modular digital twin framework for electric vehicles that couples high-fidelity battery simulation in PyBaMM with motor dynamics simulation in GYM Electric Motor through a shared vehicle-dynamics layer, enabling real-time computation of SoC, SoH, RUL, torque, efficiency, and thermal behaviours. Validation across standardized highway, urban, and combined drive cycles showed physically consistent behaviours: battery SoC depleted fastest under highway driving and more gradually under urban conditions; motor torque profiles differed characteristically across acceleration, cruising, and deceleration phases, with urban driving producing higher fluctuation; and correlation analysis confirmed strong, physically expected relationships between speed, motor and battery temperature, and power demand. The accompanying web-based dashboard supported interactive simulation control and diagnostics throughout.
Building on the limitations identified above, future work will pursue three directions. The first is extending the battery model with additional formulations, including equivalent-circuit models for faster real-time execution, refined thermal sub-models, and empirical degradation models across further chemistries such as solid-state batteries, in order to broaden applicability and address the numerical-stability and runtime constraints of the DFN model. The second is extending the PMSM model with more detailed electromagnetic, thermal, and mechanical sub-models to improve prediction of efficiency, torque ripple, and thermal limits under a wider range of operating points. The third is adding a three-dimensional visualization of the vehicle to the dashboard, mapping real-time simulation data such as thermal hotspots, charge level, and motor RPM onto the corresponding physical components to support more intuitive diagnostics and design review. In parallel, closing the validation gap identified above, through comparison against instrumented vehicle or dynamometer data, will be prioritized before the framework is applied to downstream tasks such as machine-learning-based failure prediction and adaptive control.
Author Contributions
All authors contributed equally to this work. The research was conducted as a graduation project at the School of Computer Science, Canadian International College (CIC), Cairo, Egypt, under the supervision of Sara Abdelghafar. All student authors, namely Rana Reda, Mohammed Osama, Shahd Abdallah, Roaa Mohamed, Saad Ali, Hazem Hossam, and Mohamed Yasser, participated in the conceptualization, design, implementation, experimentation, and writing of this manuscript. Academic supervision, research guidance, and critical review were provided by Sara Abdelghafar throughout all stages of the project.
AI Use Disclosure
AI-assisted writing tools were used during the preparation of this manuscript for language editing and formatting purposes. All scientific content, results, analysis, and conclusions are the sole responsibility of the authors.
References
- International Energy Agency, “Global EV Outlook 2025,” IEA, Paris, France, 2025. https://www.iea.org/reports/global-ev-outlook-2025.
- Piromalis D, Kantaros A. Digital Twins in the Automotive Industry: The Road toward Physical-Digital Convergence. Applied System Innovation. 2022; 5(4):65. [CrossRef]
- Liu, H.; Zhang, B.; Wu, V.; Yang, X.; Wang, L. Review of Digital Twin in the Automotive Industry on Products, Processes and Systems. International Journal of Automotive Manufacturing and Materials 2025, 4 (1), 6. [CrossRef]
- H. Li, M. Bin Kaleem, I.-J. Chiu, D. Gao, J. Peng, and Z. Huang, “An Intelligent Digital Twin Model for the Battery Management Systems of Electric Vehicles,” International Journal of Green Energy, vol. 21, no. 3, pp. 461–475, 2024. [CrossRef]
- Z. Wang, T. W. Ching, S. Huang, H. Wang, and T. Xu, “Challenges Faced by Electric Vehicle Motors and Their Solutions,” IEEE Access, vol. 9, pp. 5228–5249, 2021. [CrossRef]
- J. Trauer, S. Schweigert-Recksiek, C. Engel, K. Spreitzer, and M. Zimmermann, “What Is a Digital Twin? Definitions and Insights From an Industrial Case Study in Technical Product Development,” Proc. Design Society: DESIGN Conference, vol. 1, pp. 757–766, 2020. [CrossRef]
- M. Grieves and J. Vickers, “Digital Twin: Mitigating Unpredictable, Undesirable Emergent Behavior in Complex Systems,” in Transdisciplinary Perspectives on Complex Systems, F.-J. Kahlen, S. Flumerfelt, and A. Alves, Eds. Cham, Switzerland: Springer, 2017, pp. 85–113. [CrossRef]
- X. Li, W. Niu, and H. Tian, “Application of Digital Twin in Electric Vehicle Powertrain: A Review,” World Electric Vehicle Journal, vol. 15, no. 5, p. 208, 2024. [CrossRef]
- V. Sulzer, S. G. Marquis, R. Timms, M. Robinson, and S. J. Chapman, “Python Battery Mathematical Modelling (PyBaMM),” Journal of Open Research Software, vol. 9, no. 1, p. 14, 2021. [CrossRef]
- P. Balakrishna, G. Book, W. Kirchgässner, M. Schenke, A. Traue, and O. Wallscheid, “gym-electric-motor (GEM): A Python Toolbox for the Simulation of Electric Drive Systems,” Journal of Open Source Software, vol. 6, no. 58, p. 2498, 2021. [CrossRef]
- Traue, G. Book, W. Kirchgässner, and O. Wallscheid, “Toward a Reinforcement Learning Environment Toolbox for Intelligent Electric Motor Control,” IEEE Transactions on Neural Networks and Learning Systems, vol. 33, no. 3, pp. 919–928, 2022. [CrossRef]
- S. Almeaibed, S. Al-Rubaye, A. Tsourdos, and N. P. Avdelidis, “Digital Twin Analysis to Promote Safety and Security in Autonomous Vehicles,” IEEE Communications Standards Magazine, vol. 5, no. 1, pp. 40–46, 2021. [CrossRef]
- J. N. Njoku, C. I. Nwakanma, J.-M. Lee, and D.-S. Kim, “Model Comparison and Selection for Battery Digital Twin Development Using PyBaMM,” in Proc. 33rd Joint Conf. Communication and Information (JCCI), Yeosu, South Korea, 2023.
- M. Doyle, T. F. Fuller, and J. Newman, “Modeling of Galvanostatic Charge and Discharge of the Lithium/Polymer/Insertion Cell,” Journal of the Electrochemical Society, vol. 140, no. 6, pp. 1526–1533, 1993. [CrossRef]
Figure 1.
The proposed digital twin framework architecture.
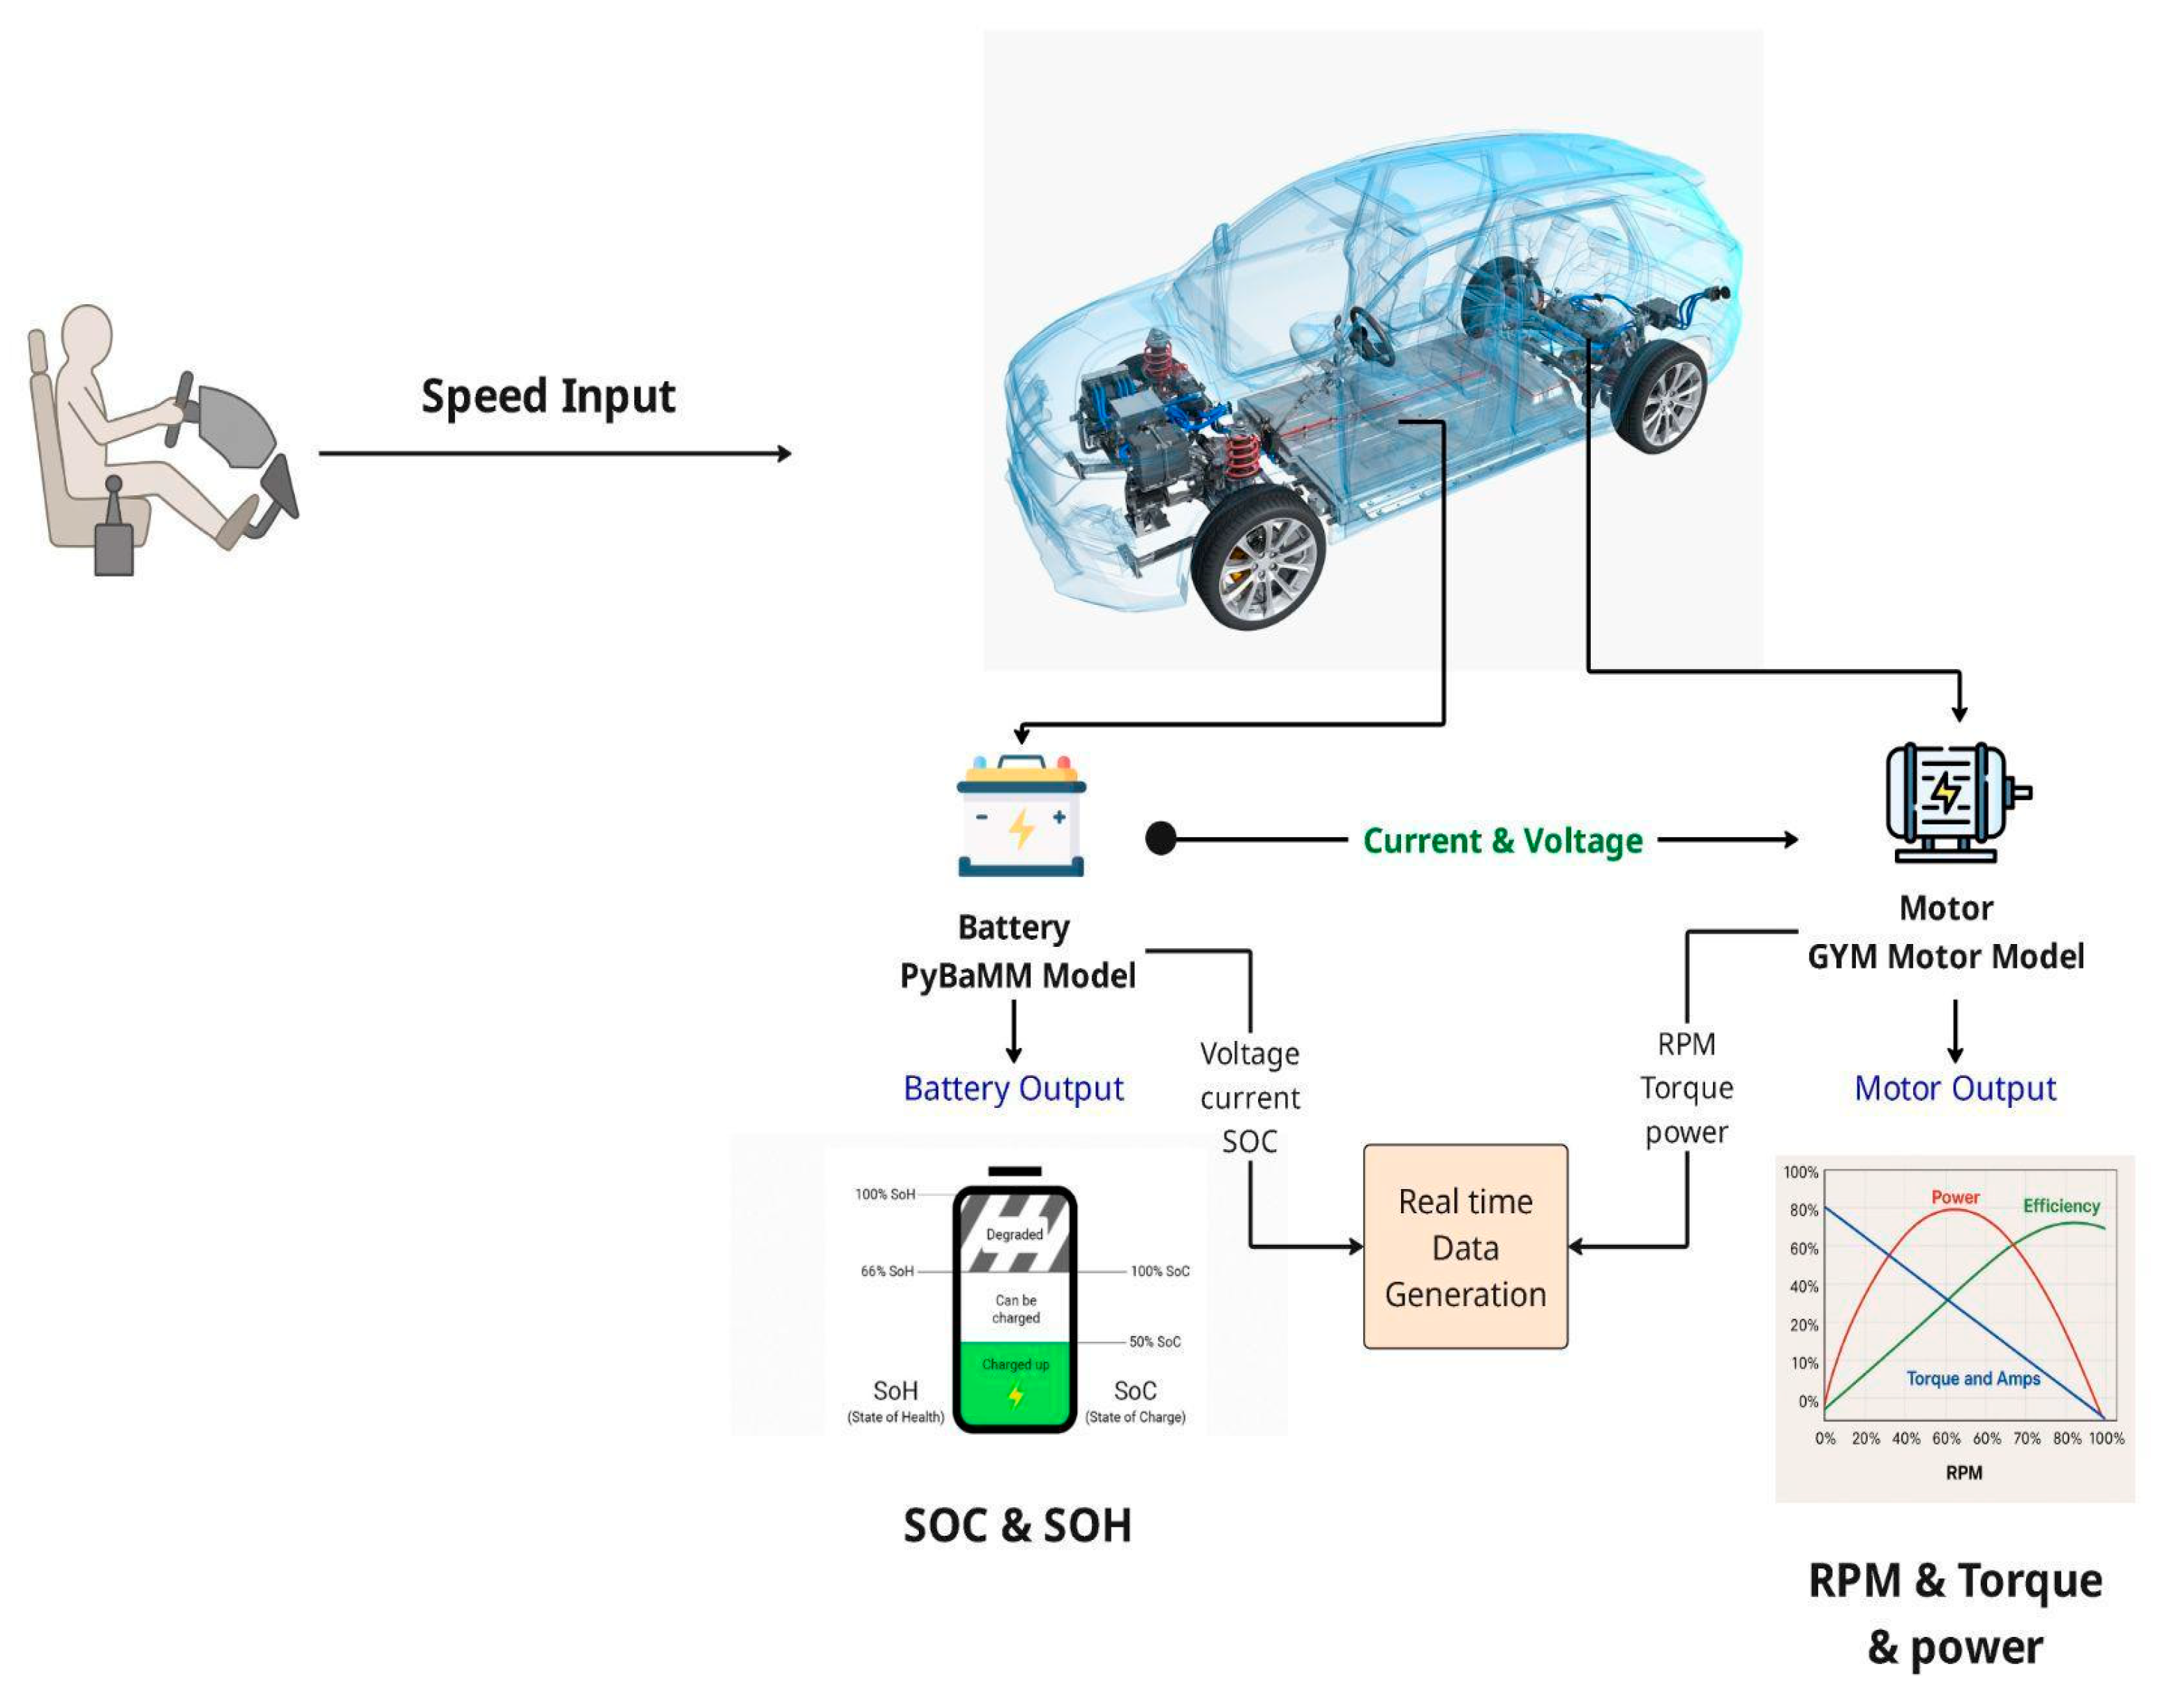
Figure 2.
Simulation dashboard, comprising the (a) simulation control, (b) battery diagnostics, (c) motor diagnostics, and (d) reports panels.
Figure 2.
Simulation dashboard, comprising the (a) simulation control, (b) battery diagnostics, (c) motor diagnostics, and (d) reports panels.
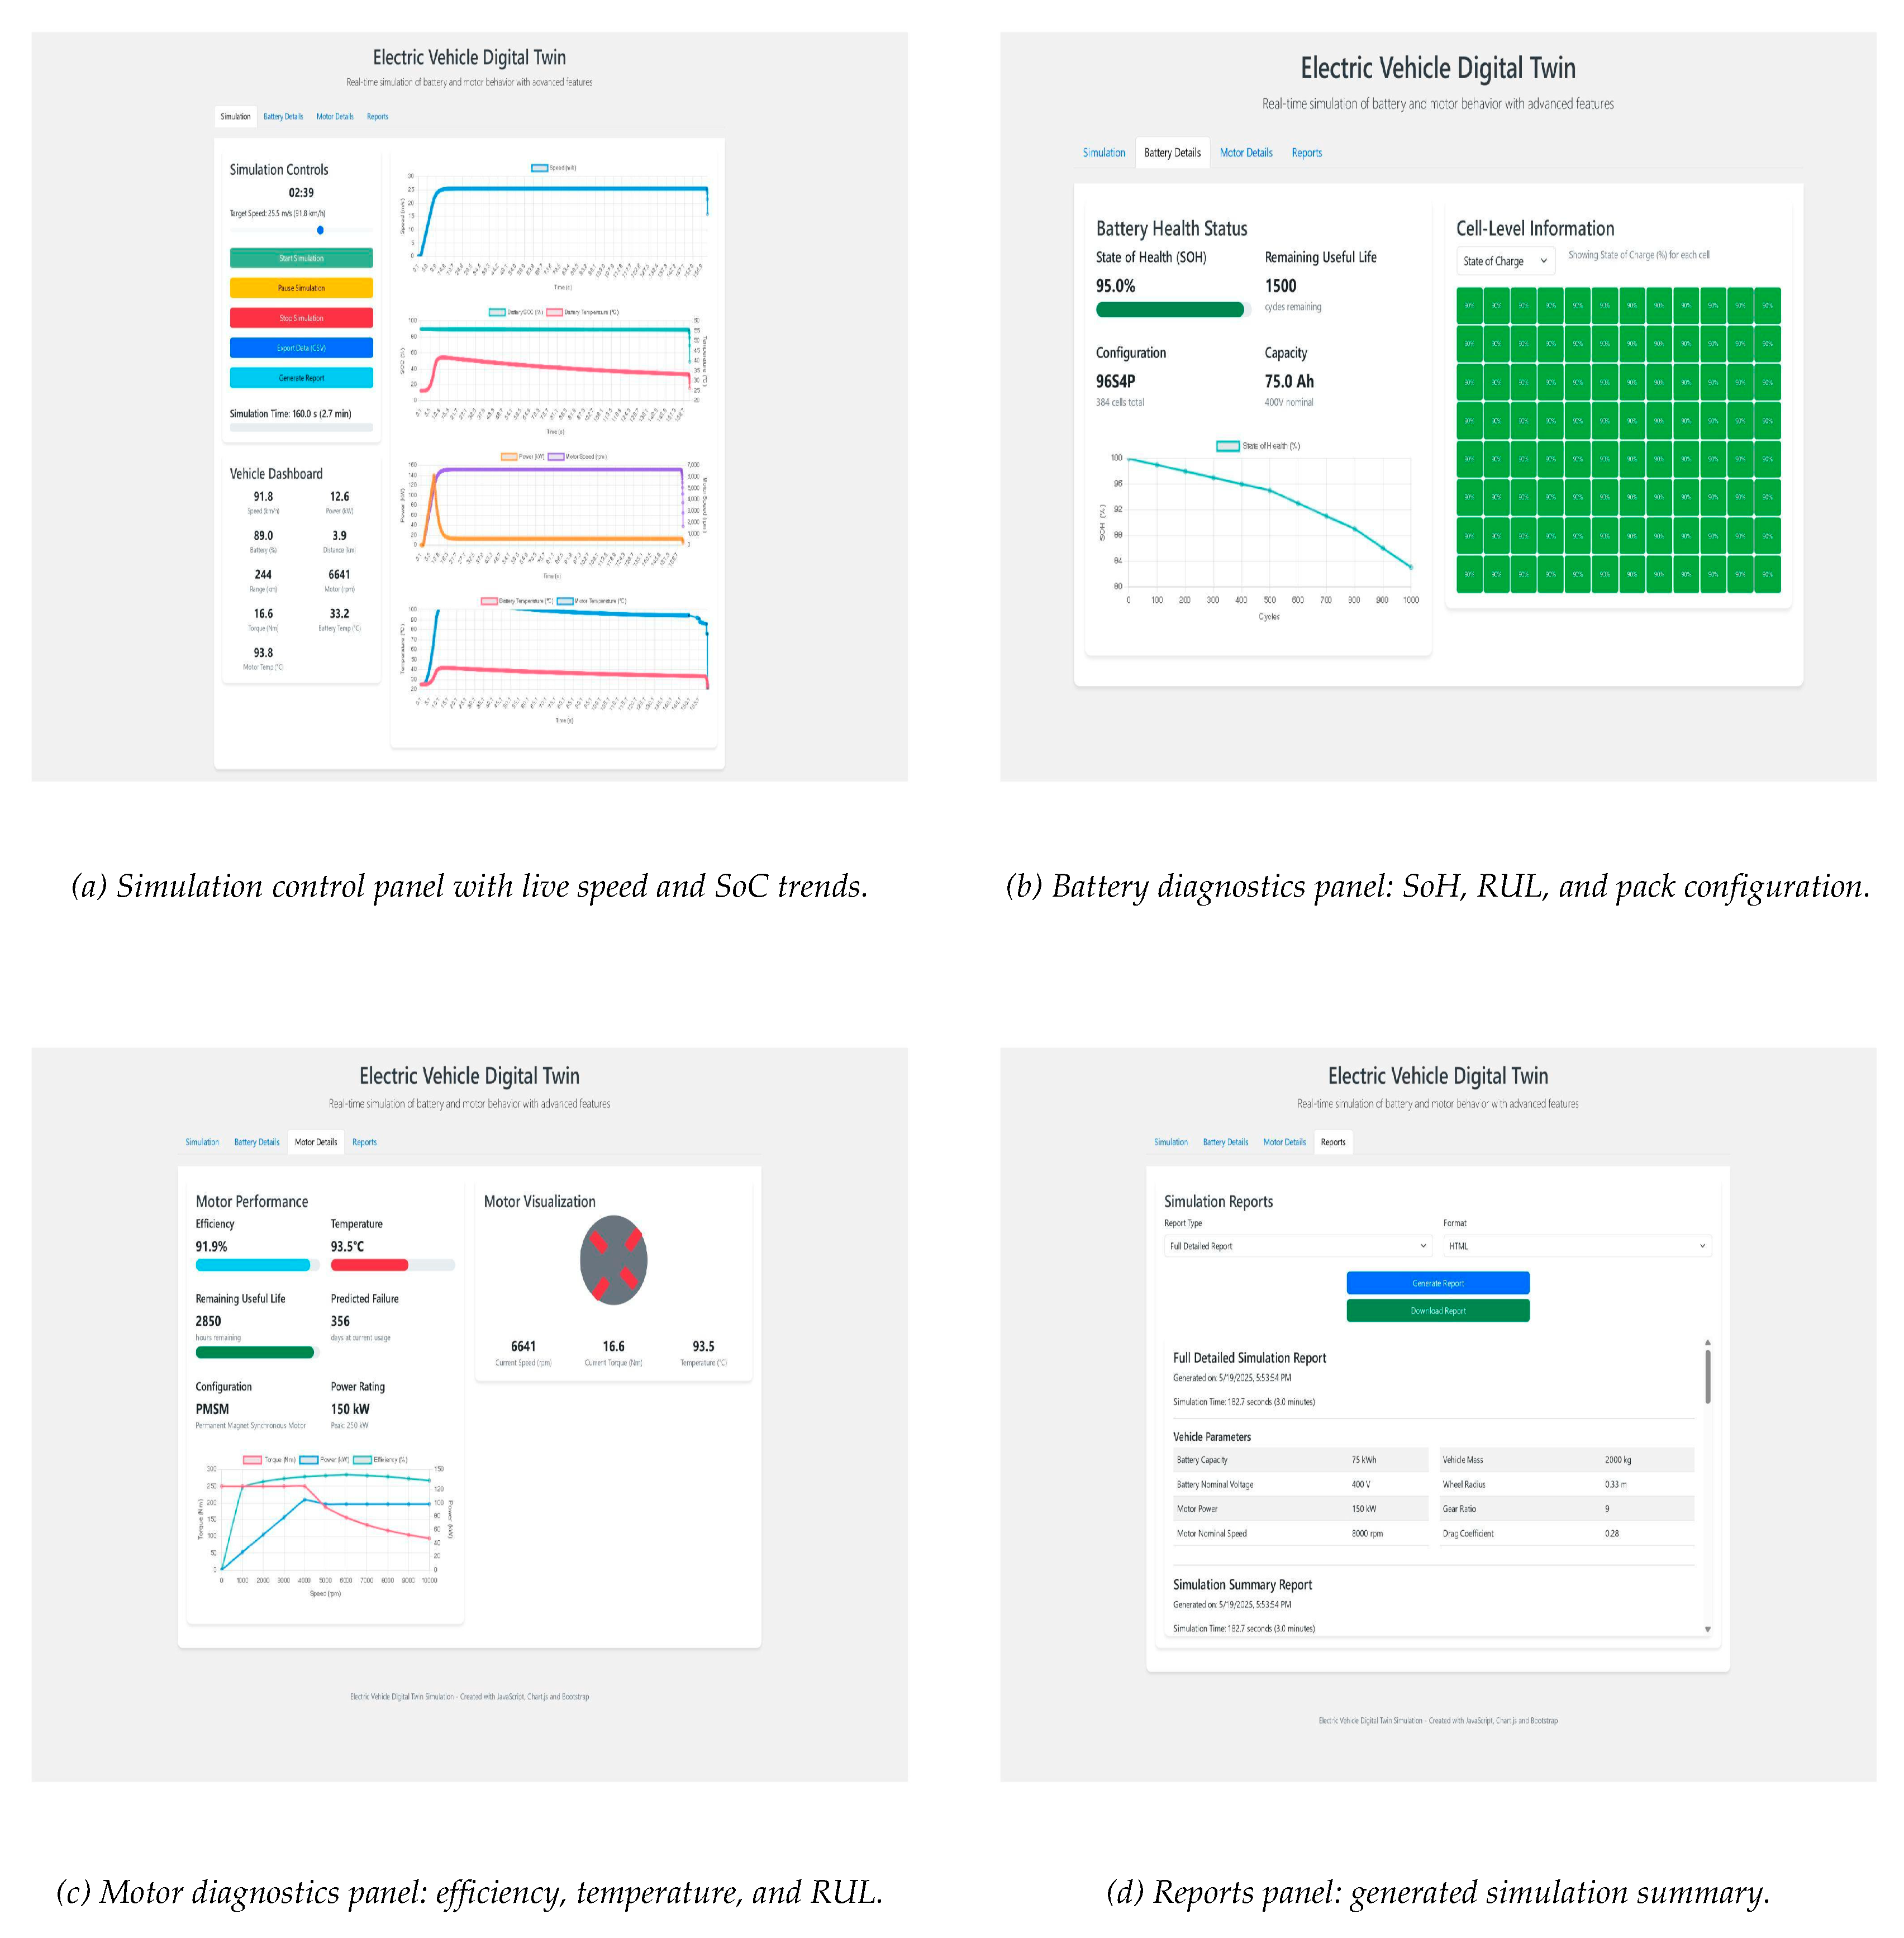
Table 1.
Summary of related digital twin literature by domain, method, and contribution.
| Ref. | Domain | Method / Tool | Key Contribution |
|---|---|---|---|
| [4] | EV battery / BMS | Embedded BMS-based digital twin | Builds a digital twin directly around the battery management system for real-time state estimation without added hardware. |
| [5] | EV motor | Design and control review | Surveys design and control challenges across PMSM, induction, and switched reluctance traction motor topologies. |
| [6] | Digital twin, concept | Industrial case study | Formalizes the digital twin definition around bidirectional data exchange between the physical and virtual representations. |
| [7] | Digital twin, concept | Conceptual model | Introduces the original digital twin concept as a means of mitigating unpredictable emergent behaviours in complex systems. |
| [8] | EV powertrain, general | Literature review | Reviews digital twin applications across the power source, power electronics, and electric motor subsystems of the EV powertrain. |
| [10,11] | EV motor simulation | Open-source toolbox (GEM) | Provides standardised, reinforcement-learning-compatible simulation environments for electric drive systems. |
| [12] | Autonomous vehicles | Safety and security framework | Proposes a digital twin framework for real-time safety and security evaluation of autonomous vehicles. |
| [13] | EV battery modelling | PyBaMM comparative study | Compares electrochemical model fidelity and computational cost across the Single Particle, Single Particle with Electrolyte, and DFN models. |
Table 3.
Pearson correlation matrix of key simulated EV parameters.
| Speed | Mot. Spd | Mot. Trq | SoC | Power | Dist. | Batt. T | Mot. T | |
|---|---|---|---|---|---|---|---|---|
| Speed (m/s) | 1.00 | 1.00 | -0.39 | -0.41 | 0.00 | 0.34 | 0.82 | 0.95 |
| Motor speed (rpm) | 1.00 | 1.00 | -0.39 | -0.41 | 0.00 | 0.34 | 0.82 | 0.95 |
| Motor torque (Nm) | -0.39 | -0.39 | 1.00 | 0.20 | 0.83 | 0.18 | 0.27 | 0.32 |
| Battery SoC (%) | -0.41 | -0.41 | 0.20 | 1.00 | 0.03 | 0.16 | 0.16 | -0.33 |
| Power demand (kW) | 0.00 | 0.00 | 0.83 | 0.03 | 1.00 | 0.03 | 0.08 | 0.04 |
| Distance (m) | 0.34 | 0.34 | 0.18 | 0.16 | 0.03 | 1.00 | 0.09 | 0.26 |
| Battery temp (°C) | 0.82 | 0.82 | 0.27 | 0.16 | 0.08 | 0.09 | 1.00 | 0.91 |
| Motor temp (°C) | 0.95 | 0.95 | 0.32 | -0.33 | 0.04 | 0.26 | 0.91 | 1.00 |
Disclaimer/Publisher’s Note: The statements, opinions and data contained in all publications are solely those of the individual author(s) and contributor(s) and not of MDPI and/or the editor(s). MDPI and/or the editor(s) disclaim responsibility for any injury to people or property resulting from any ideas, methods, instructions or products referred to in the content. |
© 2026 by the authors. Licensee MDPI, Basel, Switzerland. This article is an open access article distributed under the terms and conditions of the Creative Commons Attribution (CC BY) license (http://creativecommons.org/licenses/by/4.0/).
Copyright: This open access article is published under a Creative Commons CC BY 4.0 license, which permit the free download, distribution, and reuse, provided that the author and preprint are cited in any reuse.