

Submitted:
20 August 2026
Posted:
21 August 2026
You are already at the latest version
Abstract
Recent years have witnessed a significant increase in the number of Internet of Things (IoT) connected devices, producing many functionally similar services that differ in non-functional attributes such as Quality of Service (QoS). Evaluating QoS reliably is complicated by IoTʹs multilayer architecture and inherent uncertainty in consumer preferences, and selecting services on preference alone risks overqualification and inefficient resource use. This study proposes an integrated assessment and selection model. First, a two-stage fuzzy logic method evaluates the QoS of registered IoT services across all architectural layers. Second, candidate services are filtered according to both user preference and task purpose, then ranked using the Analytical Hierarchy Process (AHP). Experiments on a 200-service dataset showed that the assessment model successfully estimated QoS for every service. In a critical-purpose scenario, the model automatically selected 67 high-quality candidate services; in a normal-purpose, low-QoS scenario, it identified 21 low-quality services. The two-stage approach also reduced service-ranking execution time relative to an AHP-TOPSIS (Technique for Order of Preference by Similarity to Ideal Solution) baseline. By incorporating task purpose alongside user preference, the proposed model mitigates service overqualification, improves ranking efficiency, and gives IoT service providers a practical tool for matching services to end-user requirements.
Keywords:
assessment
; AHP
; evaluation
; Internet of Things
; service
; QoS
1. Introduction
In recent years, information technology has seen tremendous progress, as evidenced by the emergence of a new technology known as the Internet of Things (IoT). IoT is regarded as one of the most spectacular developments in information technology in the last decade. Unlike traditional networks, which were mostly used to connect specific end-user devices such as desktops, laptops, and smartphones [1], IoT outperforms traditional networks by allowing everything to be connected, including household appliances, medical equipment, traffic lights, vehicles, among other things.
According to [2], there were over 18 billion Internet of Things devices linked globally in 2024. However, there is disagreement over how many IoT devices will be available in the future [3]. It has been predicted that there would be nearly 41 billion devices by 2030 [4], whereas another study [5] predicted that there would be nearly 32 billion devices by the same year.
Despite the variations in these estimates on the number of IoT devices in the future, all of the organization's reports confirmed that the number of IoT devices will expand significantly in the future. This reported large growth in the number of devices indicates the vast number of IoT services that will be available, and it supports the estimate of a major increase in the number of IoT services in the near future.
It is evident that service is a critical component of any IoT platform, as it is at the core of both providers and consumers [6]. This is due to the fact that it is the source from which both parties have the potential to benefit. In general, the concept of services as defined by is the commercial transaction between two parties in which one party allows another to access specific resources [7]. The IoT market has experienced substantial growth in recent years, which has resulted in a rapid increase in the number of IoT services. This consequential growth in IoT market motivates huge number of consumers to adopt IoT service, especially in developed countries, it is evident that there is a general trend among huge number of consumers in these countries to adopt and to take advantage of IoT technology by utilizing the huge number of services generated by a large number of IoT connected devices [8]. Adoption of IoT services is not limited to wealthy countries; several developing countries use IoT technology to handle some community concerns and activities. IoT technology has increased the efficiency and efficacy of current processes in underdeveloped countries. Farmers, for example, use remote sensors to monitor soil moisture levels and field conditions to avoid crop loss [9]. Similar sensors are used to remotely regulate water pumps in Rwanda and micro-irrigation pumps in India, boosting functioning and shortening repair times [10]. In Haiti, medical staff is implementing "smart" thermometers to better control vaccine administration and storage [11]. The ITU/UNESCO Broadband Commission for Sustainable Development reports that Nexleaf Analytics in Haiti has created a method for detecting refrigerator temperatures to keep an eye on the "cold chain" supply of vaccines. When temperatures exceed or fall below the restricted range of acceptable storage conditions, their ColdTrace system sends SMS alarm messages as a precaution. These real-time updates ensure the effectiveness of the roughly 200,000 vaccine refrigerators used alone in developing countries. Governments can use the system's data to quickly fix power supply problems and reroute vaccination deliveries away from malfunctioning freezers [12].
The increase in global spending on IoT technology is another factor pointing to the widespread use of IoT services. According to [13] in 2023, almost 805 billion US dollars were spent on IoT technologies worldwide. Despite a rise over the previous year, 2023 spending expanded slower than expected due to the global coronavirus epidemic. As of 2019, the global spending on IoT was predicted to be 1.1 trillion US dollars by 2023 [14].
With significant increase and growing demand of IoT services, IoT practitioners have begun to develop convenient models, however, there are many challenges that make developing IoT models a difficult task. For example, one of the big challenges is how to develop models that allow the IoT services consumers to find services that meet their specific requirements [15,16]. One of the most important requirements that the majority of IoT services consumers are concerned about is the Quality of Services (QoS). Despite the fact that numerous studies have been conducted to address the QoS issue in IoT, still assessment and selecting services based on QoS remains a difficult task and a hot topic due to the rapid increase in IoT services [17,18,19]. In addition to that, there are many different ways to choose services based on their quality, they all have flaws and are not universally accepted. In certain cases, the user's wishes are the primary focus, whereas in others, the importance of service quality is the only thing that is emphasized.
IoT services have dramatically increased over the past few years, leading to an enormous number of services with same functionality but varying levels of quality. On the other hand, there are various IoT service consumers, and each of them has unique preferences for QoS. This situation makes it difficult for both service providers and consumers to select services that meet their preferred levels of quality of service. The problem has many aspects, first, there is no comprehensive and reliable approach for assessing QoS in an IoT environment. There are a number of reasons why creating an assessment method for QoS in IoT is a rather difficult task, this including: The architecture of IoT platforms is initially composed of numerous layers, each of which has a noticeable effect on the QoS. As a result, we assume that assessing the QoS for one layer while ignoring the other layers will produce a result that does not accurately represent the QoS for all IoT platforms, and that calculating the QoS for all layers while handling each layer's results separately will also have an impact on the final QoS for IoT platforms result. In addition, non-functional qualities (QoS metrics) are expressed as numerical values, although people think inexactly and use language concepts like short/tall, close/far, and hot/cold. Thus, we believe that QoS metrics representation greatly affects evaluation and selection results.
The second aspect of the issue involves selecting services that match the precise QoS user’s request. In this situation, it is assumed that relying solely on user preferences may lead to service with a level of quality that is incompatible with the goal of the task for which the service is requested. Moreover, this could result in issues like overqualification services and mismanagement of IoT resources allocation, most of which have limited power and computation capabilities [20]. To elaborate, a study conducted by [21], stated that, some IoT sensors that use specific type of battery are overqualified and too expensive, thus, are not suitable to be used with some IoT applications. This indicates that overqualification is one of the IoT challenges that some earlier research has attempted to address.
For instance, consider a smart agriculture deployment where a consumer requests a soil-moisture reading service. If selection depends only on consumer preference, the ESP may repeatedly provide a high-quality service even for a routine, non-critical check, wasting the limited power of field sensors. During a drought period, however, the same request becomes critical, and a low-quality service may fail to detect the problem in time to prevent crop loss. This illustrates why the purpose of the task, and not preference alone, should determine the level of quality assigned to a service.
This research therefore addresses all of these issues and proposes new integrated solution that evaluate the quality of service (QoS) in the Internet of Things using fuzzy logic technique and also develop a selection model that enables users to find the services that they want, not only based on their preferences but also based on the purpose of the task for which services are being requested.
The main objective of this research is to develop a convenient model that allows services providers to provide consumers of IoT ecosystems with services that meet their specific requirements and match their actual needs. Subsequently, the proposed model is expected to achieve some sub objectives such as: evaluates the Quality of IoT services across all layers, classifies the services based on the level of quality., reduces the time of ranking services, hence enhancing overall system responsiveness and user satisfaction, enables users to find the services they need, based not only on their preferences but also on the purpose of the task for which the services are being requested, allows users to search for services using linguistic terms instead of numerical values, optimize the management of IoT resources and helps the services providers to take the right decision and provide the consumers with the best service among huge number of services that have same level of quality.
2. Related Works
In a large scale IoT there are many services doing the same function but with different quality. One of the challenges that many practitioners face is how to select the most appropriate services that meet the user’s requirements. However, before going to the phase of selecting services it is important to find a way to evaluate the QoS. Recently, there were many research have been done by many scholars some of them focus on developing mechanisms to evaluate QoS in IoT, whereas the other focus on how to develop convenient models that allow consumers to select the best services that meet requirements. Therefore, in this section we will review in the first part the most recent previous efforts achieved that aimed to develop assess models for IoT services based on QoS parameters. The second part will cover the most recent previous studies that addressed the challenges of selecting the best services in IoT environment based on QoS.
2.1. Services Assessment
A new framework for adaptive Machine Learning as a Service (MLaaS) composition in IoT environments, is introduced by [22]. The goal of this mode is to tackle the challenge of evolving data distributions and resource dynamics. Their system continuously monitors the performance of deployed ML services and, when signs of underperformance emerge, employs a contextual multi-armed bandit algorithm to dynamically select optimal replacements. This hybrid design, with a service assessment model to spot QoS degradation and a candidate selection mechanism to suggest better alternatives, ensures smooth, incremental adaptation rather than costly full redeployment. Tested on real-world datasets, the approach-maintained service-level QoS while significantly reducing recomposition overhead. By combining continuous feedback, lightweight optimization, and service renewal in an integrated pipeline, this work pushes QoS-aware service composition towards real-time adaptability in IoT scenarios.
A novel IoT data quality assessment framework based on an adaptive weighted estimation method is proposed by [23]. The framework uses multiple data quality metrics—such as accuracy, completeness, and timeliness—into a unified score. The model continuously estimates weights based on sensor reliability and operational context to accommodate varying data behaviors. As a result, it can dynamically adapt quality scoring across heterogeneous IoT platforms, offering a more accurate and robust assessment of service-level QoS characteristics.
As QoS parameters are essential part in any IoT platform, therefore, all scholars paid more attention to them. A study conducted by [24], surveyed the actual necessity of evaluating the quality in IoT. The study concluded that traditional assessment methods are not adequate. Therefore, more research is needed to deal with these challenges. To deal with challenges, [25] developed a QoS assessment model based on fuzzy logic, the goal of this study is to fill the gap of the traditional assessment techniques that have failed to deal effectively with QoS metrics. The new model successfully provides a good measure of QoS with ambiguous linguistic criteria. [26] investigated the problem of smart parking and identified 25 parameters that play a vital role in identifying the QoS in smart parking. Authors in [27] examined the most appropriate QoS criteria for the optimal service selection problem in composition and categorized them into the negative and positive categories.
An Analysis Architecture Quality Security Model (AAQSM) is developed by [28]. The model systematically evaluates IoT architectural models against defined quality and security attributes. Built upon the ISO/IEC 30141 reference architecture, AAQSM assigns quantitative scores based on standardized metrics, enabling fair and transparent comparison across architectural frameworks. The model harmonizes QoS and security evaluation by incorporating parameters like scalability, reliability, confidentiality, and integrity, offering a unified scoring methodology. Through a comparative analysis of several real-world IoT architecture designs, the study demonstrated how AAQSM can highlight trade-offs and performance gaps in architecture choices, supporting more informed system design decisions.
2.2. Services Selection
A hybrid optimization framework for QoS-aware service discovery in IoT environments is proposed by [29]. The new model is based on combining whale optimization with genetic algorithms. Their approach starts by filtering unsuitable candidate services using a hierarchical decision tree, which significantly reduces the search space. Then the optimized services are ranked via a genetic algorithm to find the best service combination based on QoS metrics like response time, energy consumption, and cost. Simulations demonstrate that this integrated method outperforms traditional optimization techniques by reducing data access latency, improving energy efficiency, and optimizing cost-effectiveness across different IoT scenarios. This solution stands out for its balanced architecture that both narrows down candidates early and ensures high-quality selection via evolutionary computation.
To select the right IoT service provider, [30] proposed a MCDM methodology for selecting the best IoT service provider under different sustainable criteria. An integrated model composes of Multi-Objective Optimization Ratio Analysis (MOORA and a Type2 Neutrosophic model is applied to six criteria and 13 alternatives. The results obtained showed that alternative 3 is the best and alternative 5 is the wors. To ensure the stability of the model, a sensitive analysis was performed under seven cases, the results show that the rank of alternatives was stable under different cases.
A model based on whale optimization and genetic algorithms is developed by [31] to streamline decision-making processes in IoT service selection. The model method minimizes data access time, optimizes energy usage, and improves cost-effectiveness during services selection.
A novel deep learning-based framework for local IoT service selection is proposed by [32], the model aims to improve service composition by translating global Quality of Service (QoS) requirements into localized constraints. Their model bypasses the scalability limitations of traditional candidate-based global selection methods. Instead, it dynamically guides the composition process at runtime by generating local QoS indicators for each service node. This local decision-making process allows for better adaptability in highly dynamic and heterogeneous IoT environments. The evaluation, conducted using realistic benchmarks, showed significant improvements in accuracy and efficiency compared to traditional global selection strategies.
The difficulties that IoT users face in selecting the best IoT service based on their requirement and expected quality of service, QoS, is discussed by [33]. The researchers proposed a new multi-criteria group decision-making (MCGDM) framework. The goal of this framework is to rank the IoT services using QoS metrics that are related to major IoT components, i.e., communication, computing, and things. The framework assists IoT consumers in perceiving the diverse quality metrics associated with an IoT application, which will motivate IoT service providers to provide superior services and enter the market.
A new algorithm is investigated by [34] to improve new methods for selecting IoT service based on QoS. The researcher used a combined method which combines the subjective and objective weight of QoS. The combined method is used to calculate the weight of each attribute and ranking the services. To evaluate the model QWS and DWS_DREAM data set are used in experiments. The results of ranking services which are done by combined methods are compared with AHP and Correlation Coefficient methods. The result indicated that combined methods have the same characteristics of the two methods. Moreover, the results of ranking services of combined methods almost matches the ranking of the AHP and correlation coefficient methods.
To select the best IoT services provider, [35] developed a new Multi-Criteria Decision Making (MCDM) framework. The proposed model is combination of two known models which are: Analytic Hierarchy Process (AHP) and Technique for Order Preference by Similarity to Ideal Solution (TOPSIS). The developed model is built based on IoT architecture that composes of three layers which are: things, Communication and computing. The selection of the IoT service provider is based on the QoS metrics that identified in all three layers. The proposed model composes two main phases: in the first phase the QoS metrics are weighted by using AHP, in the second the phase the services are ranked by using TOPSIS. For experiment, the researchers make a comparison between two service providers (SP1 and SP2) that provide the ECG healthcare service. They used eight QoS attributes. To evaluate the model, they compare the result that obtained by proposed model (AHP-TOPSIS) and the result that obtained by exciting model (AHP–AHP), they found both models select the SP1 as the best. However, the execution time of AHP-TOPSIS is less than the AHP–AHP. The study achieved great success; however, the fuzziness has not been handled.
A new model based on end user feedback is developed by [36] to improve the processes of selecting and composing services that match user requirement in IoT environment. The goal of this research is to enhance the services mechanism of services by improving performance, increasing the response time, and reducing costs. The authors used the Likert scale measurements (Strongly Agree, Agree, Neither Disagree, and Strongly Disagree) to rank the services in terms of reputation. Then the services will be classified based on the assessment of reputation. To improve the searching methods, Practical Swarm Optimization (PSO) algorithms is used with Likert Scale measurement. Swarm Optimization (PSO) algorithm is popular algorithm developed [37], it is technique based on mimicking the behavior of a fish or birds swarm when searching for food. To evaluate the model, the author compares the execution time of proposed approach with Swarm Optimization (PSO) algorithm and an Improved Practical Swarm Optimization algorithm (Improved-PSO). The obtained result showed that Likert Scale with PSO takes less time compared with PSO and Improved-PSO. Thought the good result, the new customer selects the services as usual because the selecting service is based on your historical assessment of services only, hence the search will take time.
A QoS framework which consists of 33 metrics is developed by [38] which aim to assess a smart parking service. Moreover, the model enables the consumers to find the best service provider by utilizing the multi criteria decision making (MCDM) approach according to QoS parameters. To evaluate the approach the researcher considered four service providers which provide smart parking service. The service providers are SP1, SP2, SP3, and SP4. Due to the difficulty of collecting data for all 33 metrics, only 8 metrics are considered in case study. The result of experiments that obtained exhibited that SP2 is the best service provider.
An IoT service selection model based on Genetic-Algorithm-Based QoS Global Optimization and Dynamic Replanning web service selection algorithm (GODRP) is developed by [39] with goal of contribute solution to the problem of calculating the QoS and selecting the optimum service that meet uses needs. The parameters that used assess the QoS are execution time (T), cost (C), reputation (Rep), and reliability (R). the QoS values are identified based on feedback from consumers of IoT services. To choose the best service, the researchers used the concept of evolutionary theory which always tends to select chromosomes with higher quality to participate in subsequent genetic operations. The objective function of each individual (service) is calculated in order to identify the flintiness value of each service; hence, the probability of each service being selected is calculated in order to identify the ranking score value. In addition to the ranking service, the researcher investigated the execution time of GODRP algorithm. The results that obtained showed that selected service almost meets the consumer’s needs.
A QoS-driven service selection model based on the enhanced Genetic algorithm (EGS~QoS) is developed by [40]. The goal of this model is to select candidate services with height QoS and composite them in abstract services that meet user needs. The QoS model is developed based on many positive and negative parameters such as reliability, reputation, security, cost, and response time. The selection of the services is based on the QoS and the weight of the parameters which are identified by the users. The simulation results show that the speed of proposed algorithm is better than another compared algorithm. Moreover, the proposed algorithms showed high efficiency in finding the optimal composite service
A QoS-constrained service selection framework for networked microservices targeting IoT applications, published in IEEE Access is introduced by [41]. Their approach integrates a multi-constraint optimization model, where each microservice is evaluated based on real-time QoS parameters such as latency, throughput, and reliability. The selection engine computes a composite QoS score using a weighted similarity metric that measures the match between service offerings and user requirements. Through extensive experimental evaluation, the method demonstrated superior performance in selecting optimal service candidates under varying network conditions compared to baseline models. This work showcases how tailored QoS-driven selection algorithms can effectively improve service discovery accuracy in complex IoT microservices ecosystems.
The study presented the researchers in [42] proposes a hybrid SNN–fuzzy logic framework that enhances QoS and QoE through context-aware user association in 6G IoT networks, demonstrating notable gains in latency and energy efficiency. However, its focus is limited to network-level optimization and does not address multi-criteria IoT service selection, highlighting the need for more structured and interpretable fuzzy-based models for QoS-driven service assessment.
In [43], the authors presented an IoT-based irrigation system utilizing fuzzy logic and cloud computing to optimize water usage through real-time environmental monitoring and rule-based decision-making. The work, while effectively demonstrates the adaptability of fuzzy logic in handling uncertainty and improving resource efficiency, its focus is confined to application-specific control, which is irrigation management, rather than generalized IoT service evaluation and selection. Additionally, the decision process relies on predefined rules without incorporating a comprehensive multi-criteria QoS assessment framework. Consequently, there remains a need for more systematic, scalable, and QoS-oriented fuzzy models capable of evaluating and selecting services across diverse IoT environments, which is addressed in the proposed study.
3. Proposed Model
The proposed solution is an extension to our previously published research [44]. The assessment model is integrated with a new selection model in order to build a fully integrated model for assessing and selecting services in IoT domain as shown in the Figure 1. The integrated model consists of three stages: the Publishing stage, the Assessment stage and the Selection stage.
3.1. Publishing Stage
This stage represents the upper layer in the proposed model. in this stage the model is developed based on the concept of the Sensing as a Service model [39]. The idea of Sensing as a Service has been driven by the phrase "Everything as a Service" from cloud computing.
Users can access services created by IoT devices owned by third parties with the help of Sensing as a Service middleware. The quantity of sensor data used is billed to the consumer [45]. Therefore, this model has been adopted by many researchers that aim to work in services discovery and selection in IoT environment.
In the proposed model this stage comprises three components:
- Sensors and Sensor Owners: The sensor is the source of the services, according to the IoT service profile [44]. Moreover, the sensors are keys components that are used to identify the QoS. Thus, this layer is very important in the proposed model. To access the services that are provided by specific sensors, the Service Providers (SP) have to communicate with owners of the sensors. These sensors may belong to private citizens, businesses, or the government. Consequently, the sensor owner must register with an SP if he wishes to broadcast the sensors he owns.
- Service Providers (SPs): This layer consists of Service providers (SP). The main responsibility of the SP is to detect available IoT sensors, communicate with the owners of the sensors and obtain permission to publish the service in the cloud.
- Extended service providers (ESPs). In this approach, the Extended Service Providers (ESP) primary job is to give value added services to services that are generated by specific sensors. For example, ESP can use the assessment tools in the proposed model to calculate the QoS for all the services that are found in registry. As a result, service can be selected based on customer’s requirements (i.e. QoS) [46]. In addition to offering value-added services to the IoT services, ESPs also act as the consumer's representative when interacting with numerous SPs about the acquisition of services that are provided by different sensors. This model also enables service consumers with limited technical capabilities and expertise to acquire specific services that meet their actual need and are compatible with their tasks.
The above clarification shows that the Sensor as Service Model is compatible with the proposed model because the proposed model aims to provide the consumers with services that meet their specific requirements such as QoS. As Sensing as a Service model supports the requirements of QoS through the ESP layer. The adoption of this model in this research is compatible with the proposed model in terms of business model and architecture.
3.2. Assessment Stage
This is an important stage as the whole model processes rely on it. In this stage after the ESP gets access to all the services that are provided by the sensors offered by SP, the ESP immediately begins to evaluate the QoS for each service in registry. QoS is an important factor in any IoT service platform as the consumers of IoT service are usually concerned about the QoS service.
It is known that IoT architecture is composed of multiple layers, such as three layers, five layers, six layers. However, in this research the proposed model based on three-layers IoT architecture as shown in Figure 1. The three layers architecture is used in this research for a variety of reasons: First, because there is no generalized design stated for IoT, and IoT architecture can differ from application to application. Moreover, all reviewed previous studies revealed that the QoS metrics for these additional layers had not been identified. This is clearly seen in the research undertaken by [47], which attempted to survey and discover quality of service metrics in IoT. In this study, when describing the five-layer architecture, they were unable to define QoS metrics for new layers such as the processing layer, thus they combined it with the application layer. Furthermore, the heterogeneity of IoT system characteristics makes it difficult to unify QoS metrics [48]. As a result, [49] claimed that identifying QoS metrics in IoT is a major challenge that requires attention from IoT academics and professionals.
Based on Figure 1, the assessment model consists of three layers which are: perception layer (sensor layer), network layer and application layer. in each layer there are n metrics that are used to calculate the QoS in the specific layer Table 1
The assessing of QoS performed through two main stages:
In the first stage we have three Fuzzy Logic Systems (FLSs) which assess the QoS in perception layer, network layer and application layer. The metrics of each layer represent the inputs of the FLS, Figure 1. The result of this stage is three outputs named Perc_QoS, Nw_QoS and App_QoS , which represent the QoS of perception layer, network layer and application layer respectively.
In the second stage the Perc_QoS, Nw_QoS and App_QoS which result from first stage will be inputs of the FLS of second stage. The result of this stage is the QoS. The methodology that is used to perform the two mentioned stages is Fuzzy Logic System, Figure 2.
The development of FLS in each stage based on the following steps:
3.2.1. Fuzzification: The Goal of This Step Is to Determine the Following
The inputs- for stage one of the model- two metrics are chosen randomly to represent the inputs from the list of QoS parameters that identified in for each layer in Table 1. This selection is arbitrary, as no standardized ranking of QoS metric importance exists in the literature; the remaining metrics in Table 1 are left for future extensions of the model.
Identify the fuzzy sets for each input and its universe of discourse. Most of the fuzzy set of input and output are identified as (low, medium and high).
Design the chart of membership function that can accurately represent the distribution of information within the system. The design used in this research is triangular and trapezoidal, Figure 3 and Figure 4. The membership function is calculated in this step by using the equations (1 and 2.) for triangles and trapezoids shapes respectively.
oid fuzzy shape.
3.2.2. Inference Mechanism
In this step, fuzzy rules will be developed, the controller decided the fuzzy logic output. The number of the needed control rules will be based on the equation (3) below:
where n = the number of fuzzy sets and m = the number of inputs.
By applying the above rule, the number of control rules obtained is = = 9 rules (for each FCS), as shown in Table 17, Table 18 and Table 19.
And when we apply the above rule to stage two in the proposed model, as we have 3 inputs and 3 fuzzy sets for each input, and referring to equation (3), the number of the rules will be = = 27 rules.
3.2.3. Defuzzification
This concludes the process by attempting to ascertain a single, precise numeric value that most accurately reflects the inferred imprecise values inferred linguistic output variable. Mean of Maximum (MOM) method is used as a defuzzification for both stages of this model to obtain the result of quality of services for each IoT service, Figure 5.
3.3. Service Selection Stage
This is the second part of the proposed model which talks in detail about the proposed mechanisms that will be developed to improve the service selection in IoT based on the classification that performed in previous stage as the result of assessing QoS process. The selection will be done into two stages which are: Filtering Stage and ranking stage, as shown in Figure 1.
3.3.1. Service filtering Process
This is the initial stage in the process. The selection processes start when the consumer contacts the ESP and requests a service. Then many steps will be performed sequentially:
The consumers have to determine firstly the type of application. As we know there are several types of IoT applications such as smart city, smart home, smart agriculture, environment, smart parking ...etc. In an IoT service platform, the purpose of the requested service plays a vital role in determining the QoS level suitable for the consumer. This determines the required QoS level, as formalized below.
Table 2 formalizes the mapping between declared task purpose and required QoS level. Tasks classified as critical are automatically restricted to High-QoS candidates; non-critical tasks allow the consumer to select a preferred tier.
For instance, a consumer requesting frequent, high-precision temperature readings for environmental research falls under Critical, so the model restricts candidates to High-QoS automatically.
3.3.2. Ranking Services Process
After the level of QoS is determined in the above stage either automatically by system or by consumers, list of candidate services will be selected, all have the same level of quality. Since the consumer requires only a single service, an effective decision-making approach is needed to evaluate and rank the available alternatives. There are many tools that can be used to deal with such problems. Among which is the Analytical Hierarchy Process (AHP) which is adopted in this research due to its robustness and suitability for structured service selection.
Analytical Hierarchy Process (AHP) is a powerful tool that was developed by Saaty in 1980 [50]. AHP is widely used by researchers for managing qualitative and quantitative multi-criteria elements involved in decision-making. AHP logically deals with problems in three parts as shown in Figure 1. The first component focuses on defining the problem to be solved, the second addresses the set of available alternative solutions, and the third—considered the most critical—comprises the criteria used to evaluate these alternatives. Based on this hierarchical structure, solving a problem using AHP typically involves three main steps:
- Constructing the problem hierarchy.
- Developing pairwise comparison matrices.
- Calculating priorities and checking consistency.
As mentioned earlier, once the required QoS level is determined, a list of candidate services with the same quality level is obtained. These candidate services are then evaluated based on three main criteria, namely (Perc_QoS, Nw_QoS, and App_QoS), as explained in the assessment process illustrated in the proposed model (Figure 1). Based on this, a decision hierarchy is developed to support the service selection process. In this research, AHP is used to structure the problem into a hierarchical model that simplifies the analysis and decision-making. The hierarchy decision for selecting the IoT service consists of three main levels.
- A.
- Goal
This represents the first level of the hierarchy, which defines the main goal of the research. In this study, the objective is to select the optimal service from the available alternatives, which are represented in the third level.
- B.
- Criteria
This represents the second level of the hierarchy, which is considered the most important part of the model, as the evaluation and ranking of the alternatives in Level 3 are based on the criteria defined at this level. In the proposed model, three criteria are considered: Perc_QoS, Nw_ QoS and App_ QoS. However, the evaluation of the alternatives in level 3 does not depend only on the criteria themselves, but also on the weight of the criteria as well. As known, when IoT services are requested, these criteria are not always equally important and may vary depending on the context. For instance, if greater importance is given to the quality of the devices providing the IoT service, then higher weight is assigned to the perception layer (Perc_QoS). On the other hand, if more concern is given to the quality of medium communication that use to deliver IoT services to the end user such as WiFi network, this means more attention should be paid to the network layer which represents by Nw_QoS. In some cases, the priority may be on the quality of the system that enables interaction between consumers and service providers. Therefore, weighting is a critical factor in the evaluation and ranking process. Generally, the scale of weigh will be between (0 and 1) and the summation of weigh for all criteria must be equal 1 as shown in the equation (4) and (5)
(1 =< i =< n) , where n represents the number of criteria.
In the proposed model n = 3 as we have three criteria which are: Perc_QoS, Nw_ QoS and App_ QoS.
To determine the weigh in AHP we need to create a comparison matrix of the criteria and perform many rounds of pairwise comparison as follows:
- Pairwise Comparison Scale
To perform comparisons, it is necessary to define a numerical scale that reflects the relative importance or dominance of one element over another with respect to a given criterion. In this research, Saaty pairwise comparison scale is adopted as shown in Table 3 [51].
- Deriving Priorities (Weights) for the Criteria
After the scale of number identified in previous step, we need to identify the priorities (weights) for all the criteria that are used in the research. As previously stated, these criteria are not equally important, their significance may vary depending on the context. As a result, the purpose of this stage in the AHP process is to determine the relative priorities (weights) for each criterion. The term “relative” indicates that the priority of each criterion is evaluated in comparison with the others, as will be explained in the following section.
As mentioned earlier, the three criteria used to assess the QoS in IoT environment are: Perc_QoS, Nw_QoS and App_QoS. Based on this, we need to develop pairwise comparisons matrix to show the relative priority of each criterion with respect to each of the others using a numerical scale for comparison developed by Saaty scale shown in Table 3.
The table below shows the first round of comparison matrix that is developed in order to perform the pairwise comparison and to identify the weight of each criterion.
Based on the Table 4 below, Perc_QoS is extremely important than Nw_QoS, whereas Nw_QoS is considered very strongly more important than App_QoS.
To make the pairwise comparison we need to create a comparison matrix of the criteria involved in the decision, as shown in Table 4. Each Cell in comparison matrices will have a value from the numeric scale shown in Table 3 to reflect our relative preference (also called intensity judgment or simply judgment) in each of the compared pairs. To explain more, according to the scale of judgment in Table 3 the Perc_QoS, Nw_QoS and App_QoS are given 8,7 and 5 respectively. Therefore, initially, the cells that represent the intersection between the same criteria are all filled by 1 as equally important. To fill the other cells, we compare Perc_QoS and App_QoS, we notice that Perc_QoS is greater than App_QoS by 3, thus we fill the intersected cell by 3. Mathematically this means that the ratio of the importance of Perc_QoS versus the importance of AppQoS is 3. Because of this, the opposite comparison, the importance of App_QoS relative to the importance of Perc_QoS, will yield the reciprocal of this value (App_QoS/Perc_QoS = 1/3) as shown in the App_QoS-Perc_QoS cell in the comparison matrix in Table 5. We continue with same technique to fill all the other cells as shown in Table 5.
After the comparison matrix is developed, then we need to get the summation of each column as shown in Table 6
The column summation step described above is a crucial part of the normalization process, as it prepares the comparison matrix for further analysis. To complete the normalization, each element in the matrix is divided by the sum of its corresponding column, as shown in Table 6. The result of this step is the normalized matrix presented in Table 7.
From the normalized matrix, the final weights are then obtained, as shown in Table 8, by calculating the average value of each row. For example, for the App_QoS row, the weight is computed as (0.17 + 0.20 + 0.14)/3 = 0.17.
To verify the reliability of the pairwise comparisons in Table 4, the Consistency Ratio (CR) was calculated following Saaty's procedure [51]. The resulting values (λ_max = 3.015, CI = 0.008, CR = 0.013) are shown in Table 9. Since CR is well below the accepted threshold of 0.10, the pairwise judgments are consistent, confirming the reliability of the derived criteria weights.
After the weight of each criterion is specified, then the rank of each service will be determined as shown in judgement matrix below, Table 10:
Each weight vector is then multiplied by the corresponding column values, and the results are summed to obtain the total multiplication, as expressed in Equation (6).
represents ranking score of service i, represents the value of the QoS criterion of the service, and represents the weight assigned to the QoS criterion.
The obtained result indicates the rank of each service. The service with the highest rank is considered the optimal choice and will be selected and delivered to the consumer.
- C.
- Alternatives:
This represents the third level of the hierarchy; it includes the available alternatives from which the best option must be selected. In this research the alternative is a pool of IoT services which all of them have the same level of quality.
4. Implementation
As mentioned in the previous section the proposed solution based on two main parts. The first is the assessment model and second is the selection model. In this section explains the implementation of each part and the results that obtain form each one.
4.1. Implementation of Assessment Model (Stage One)
The Fuzzy Logic Designer in MATLAB is used to develop the proposed model. The purpose of this research is to assess the QoS of IoT service in all layers. As shown in Figure 1, the calculation of QoS will be performed in two stages:
In this stage, three FLSs are developed to assess the QoS in the three layers. Based on the structure of a fuzzy logic system, this process involves three main steps: fuzzification, rule base construction, and defuzzification.
4.1.1. Fuzzification
Triangular and trapezoidal membership functions are adopted for all input and output variables across the developed FLSs. Each system utilizes three linguistic terms (low, medium, high), and the corresponding Universe of Discourse is defined for both inputs and outputs in their respective tables.
- FLS for Application Layer:
To assess the QoS of the application layer, two metrics, reputation and price, are used as input variables (randomly selected, see Section 3.2). The output of this system is represented by QoS_app_layer, as illustrated in Figure 6.
- FLS for Network Layer
To assess the QoS of the network layer, two metrics, bandwidth and reliability, are used as input variables (randomly selected, see Section 3.2). The output of this system is represented by NW_QoS, as shown in Figure 7. The corresponding fuzzy sets and Universe of Discourse are defined in Table 13 and Table 14.
- FLS for Perception Layer
To assess the QoS of the perception layer, two metrics, accuracy and response time, are used as input variables for the FLS (randomly selected, see Section 3.2). The output of this system is represented by Perc_QoS in Figure 8. The fuzzy sets for accuracy are defined as low, medium, and high, while the response time is represented by fast, medium, and slow. The corresponding Universe of Discourse for the inputs and output is defined in Table 15 and Table 16.
4.1.2. The Rule Base
The inputs which identified in the fuzzification step are applied to a set of IF–THEN control rules in this stage. The outcomes of these rules are then combined to generate the corresponding fuzzy outputs. In the proposed model, each layer consists of two input variables, and each input is represented by three fuzzy sets, as shown in Table 17, Table 18 and Table 19. Accordingly, the number of required control rules is determined based on Equation (3) below:
Number of control rules = where n = the number of fuzzy sets and m = the number of inputs.
By applying the above rule,

Table 17.
The rules base of Application layer.
| NO | Price | Reputation | QoS_App_Layer |
| 1 | Cheap | Low | Low |
| 2 | Cheap | Medium | Low |
| 3 | Cheap | High | Medium |
| 4 | Medium | Low | Low |
| 5 | Medium | Medium | Medium |
| 6 | Medium | High | High |
| 7 | Expensive | Low | Medium |
| 8 | Expensive | Medium | High |
| 9 | Expensive | High | High |
Table 18.
The rules base for Network Layer.
| NO | Bandwidth | Reliability | QoS_NW_Layer |
| 1 | Low | Low | Low |
| 2 | Low | Medium | Low |
| 3 | Low | High | Medium |
| 4 | Medium | Low | Low |
| 5 | Medium | Medium | Medium |
| 6 | Medium | High | High |
| 7 | High | Low | Medium |
| 8 | High | Medium | High |
| 9 | High | High | High |
Table 19.
The rules base for perception layer.
| NO | Accuracy | Response Time | QoS |
| 1 | Low | Slow | Low |
| 2 | Low | Medium | Low |
| 3 | Low | Fast | Medium |
| 4 | Medium | Slow | Low |
| 5 | Medium | Medium | Medium |
| 6 | Medium | Fast | High |
| 7 | High | Slow | Medium |
| 8 | High | Medium | High |
| 9 | High | Fast | High |
4.1.3. Defuzzification
Due to the fuzziness and uncertainty of the outputs obtained in the previous step, a defuzzification process is required. This process converts the linguistic variables produced by the inference stage into numerical values, making the fuzzy outputs suitable for practical application [52]. In this study, the Mean of Maximum (MOM) defuzzification method is adopted to obtain effective results. As a result of this step, three numerical outputs are generated, representing the QoS of IoT services across the perception, network, and application layers, namely Perc_QoS, Nw_QoS, and App_QoS, respectively.
4.1.4. Results of Assessment (Stage One)
In MATLAB, the random function was used to generate a dataset comprising 200 services for the purpose of evaluating the proposed model. When applied at this stage, the model successfully computed the Quality of Service (QoS) across all 200 services within the perception, network, and application layers.
4.2. Implementation of Assessment Model (Stage Two)
The Fuzzy Logic System (FLS) in this stage is constructed based on the outputs generated from the FLSs in the first stage. As previously described, three outputs are obtained from Stage 1, namely App_QoS, Nw_QoS, and Perc_QoS. These outputs are used as input variables for the FLS in the current stage. Accordingly, the FLS for this stage is developed as illustrated in Figure 9.
4.2.1. Fuzzification
The fuzzy sets for the input variables (App_QoS, Nw_QoS, and Perc_QoS) are defined as low, medium, and high. Similarly, the output variable QoS is represented using the same three fuzzy sets. The corresponding Universe of Discourse for both inputs and output is defined in Table 20 and Table 21.
The outcome of this stage is a single output representing the overall Quality of Service (QoS). Since the objective of this research is to assess IoT service quality and classify it into three categories, high, medium, and low, the fuzzy output set is defined accordingly based on these categories, as presented in Table 21.
4.2.2. The Rule Base
As we have 3 inputs and 3 fuzzy set for each input, and referred to the equation (3), the number of the rules will be = = 27 rules.
4.2.3. Result of Stage Two
The result obtained from stage one has become the dataset for stage two. By applying the dataset in this stage, the model successfully calculates the QoS for all 200 services which are based on the three layers. Table 22 shows the sample of final results that obtained and represent QoS of some of the services that are available in dataset.
4.3. Implementation of Selection Model
To implement the proposed model, a MATLAB-based system is developed. Initially, the system prompts the user to specify the type of application. Once the application type is identified, the system asks whether the requested task is critical or non-critical. Then the system generates a list of candidate services with the same level of quality after determining the purpose of the task. To identify the best services, Extended Services Provider (ESP) assign weights to each criterion used to evaluate QoS services. The system then used the AHP technique to rank the services.
The implementation is based on the QoS results obtained from the assessment section (Table 22). The dataset contains 200 services, all of which fall under the environmental application. As a result, all the services have the same functionality, but each service has a different level of quality.
According to the proposed model, the final results were obtained through two stages, and two scenarios were implemented, yielding the following results:
4.3.1. Result of the First Scenario:
In the first scenario, the user identifies the purpose of service as normal, and the level of QoS is low. Based on those identifications, the system identified 21 services with a low level of quality. To select the best services, ESP has to assign weight for each criterion that is used in evaluating the QoS. In this research there are three criteria that are used to assess the QoS, which are: Perc_QoS, Nw_QoS, and App_QoS. Interestingly, the weight of each criterion was identified as shown in comparison matrix that was developed in assessment section, Table 8. Based on this table, weight that has assigned to Perc_QoS, Nw_QoS, and App_QoS are 0.44,0.39 and 0.17 respectively. Based on this identification the system automatically calculates the rank of all candidate services.
As a result, the system ranks all the 21 candidate services as shown in the Table 23.
According to the ranking results, the system selects service number 16 with a score of 2.2, as the optimal service. Accordingly, ESP delivers the selected service to the consumer who requested it.
4.3.2. Result of the Second Scenario:
In the second scenario, it is assumed that the user specifies the task as critical. Therefore, only high-quality services are considered, and the system automatically selects 67 candidate services that meet this requirement. To rank the services, the system used the same weights that identified in Table 8. Based on this table, weight that has assigned to Perc_QoS, Nw_QoS, and App_QoS are 0.44, 0.39 and 0.17 respectively. Based on this identification the system automatically calculates the rank of all candidate services.
As a result, the system ranks all 67 candidate services, as shown in Table 24.
Based on the ranking results, the system selected service number 59 as the best service, as it gets the high rank. Thus, this is the best service that ESP can deliver to the consumer that requested the service.
5. Results Discussion
5.1. Assessment Model Discussion
Through two stages, the proposed model calculates the QoS for 200 services. In the first stage the model evaluates the QoS of each service across the perception layer, network layer and application layer. In the second stage, the results obtained from the first stage are used to compute the overall QoS for all targeted services. Unlike existing approaches that either focus on selected layers or evaluate each layer independently, the proposed model assesses QoS across all three layers and integrates their results to produce a comprehensive QoS value for each service.
Based on the final results, the model successfully classifies all services into three categories: high-quality, medium-quality, and low-quality services. Specifically, 67 services are classified as high quality, 112 as medium quality, and 21 as low quality.
These findings demonstrate that the proposed model effectively evaluates QoS for all services in the dataset. Consequently, it can provide valuable support to service providers and ESPs by offering a reliable tool for accurate QoS assessment prior to service delivery to end users.
5.2. Selection Model Discussion
To validate the proposed model, a comparison is conducted with existing models. The evaluation focuses on three main aspects: ranking results, model performance, and robustness. To perform this comparison, simulation experiments are carried out using MATLAB 2016a on a 64-bit Windows operating system, running on an Intel Core i7 laptop. Each value reflects a single run rather than an average of repeated trials.
The proposed model is compared with the AHP-TOPSIS model developed by [35], which is selected due to its similar architecture. Both models are based on a three-layer structure, making the comparison more consistent and meaningful.
5.2.1. Model Performance
Firstly, because ranking services is an important stage in the new model, and the performance of the selection stage is largely dependent on it, the comparison is conducted in terms of execution time required to rank services in the registry. For this purpose, a dataset consisting of 500 services is randomly generated using a MATLAB function.
Based on the Figure 10, initially, when the number of services was 50, the new model and AHP-TOPSIS required about 0.5 and 0.6 seconds, respectively, to rank 50 services. When the number of services is extended to 100, the execution time of new model and AHP-TOPSIS is slightly increased to 0.636524s and 0.77057s, respectively. When the number of services was extended to 150 and then to 250, the new model pattern remained unchanged, and the execution time grew little as expected, taking just 0.681127 and 0.786085 seconds to rank 150 and 250 services, respectively. On the other hand, AHP-TOPSIS has seen a change in its pattern as its execution time for ranking 150 services climbs to 1.295656s and reached to 1.546571s when the number of services climbed to 250.
A remarkable increase in execution time of AHP-TOPSIS happened when the number of services reached 300, the execution time climbed to 2.178482 s. On the other side, the new model needed only a slight increase in execution time to rank the same number of services, it needs just 0.832447s to rank 300 services. To do more experiments, the number of services is increased to 400 and then 500. The results showed that, new model is still outperforming as it required less time to rank the mentioned number of services. It took 1.095535 s to rank the 400 services and the execution time increased slightly to 1.519276 when the number of services jumped to 500. On the other hand, AHP-TOPSIS execution time hit 2.629314 s and then climbed dramatically to 3.930185 s when the number of services reached 500. The findings demonstrated that the new model is still faster since it took less time to rank the specified number of services.
It is evident that New Model outperforms AHP-TOPSIS in terms of execution time. To elaborate, we discovered that as the number of services increases, the new model’s time to rank the services in the register increases gradually, whereas AHP-TOPSIS's time to rank the same number of services increases rapidly. Despite the fact that both models used a three-layer architecture, there are some reasons why the New Model outperformed the AHP-TOPSIS. To further illustrate this argument, it should be noted that metrics used to calculate the quality of service in an Internet of Things environment are those that represent the non-functional attributes of IoT services. In the AHP-TOPSIS model, for example, they employed 9 metrics to determine QoS. These metrics compute the QoS across all levels. Then all these metrics will be used to rank the services to select the best one based on the equation (7) below:
where m represents value of the specific metric and w represents the weight of the specific metric.
rank(s) = m1*w_m1+ m2*w_m2+ m3*w_m3+ m4*w_m4+ m5*w_m5+ m6*w_m6 + m7)*w_m7+ m8*w_m8+ m9*w_m9 ……
For the experimental comparison in this study, both models are evaluated on the same dataset and the same six underlying QoS metrics used by the New Model (bandwidth, reliability, reputation, price, accuracy, and response time), so that the two models are compared on ranking methodology rather than on differing input metrics.
Consequently, in this model, the ranking of the service takes longer because there are more calculation processes involved, and the execution time is anticipated to increase as the number of metrics or services increases.
In the New Model, this issue is given more consideration, and more attempts are being made to shorten the proposed model's execution time during the selection of the IoT services, hence enhancing the model's performance. Despite the fact that the New Model used a similar architecture to AHP-TOPSIS, the metrics that compute QoS in IoT environments in the New Model are only three. This is made possible by relying on the Two-Stage Assessment Model, which was created for the purpose of this study using a Fuzzy Logic System (Figure 1). Based on this assessment model, a number of metrics will be nominated in each layer to compute the QoS in each layer in the first step. Since the suggested model is built on a three-layer architecture, the results of stage one have three outputs. The metrics obtained by stage one will then be utilized to determine the QoS for all layers. These metrics are App_QoS, Nw_QoS, and Perc_QoS. The New Model then used these metrics to rank the IoT services in the registry using the equation below (8).
represents ranking score of service i, represents the weight of App_QoS criterion, represents the weight of Nw_QoS criterion, and represents the weight of the Perc_QoS criterion.
Based on this, we can deduce that the New Model used several metrics to compute QoS in each tier, and the number of metrics is subject to rise, just like the AHP-TOPSIS model. However, the difference between the New Model and the AHP-TOPSIS model is that, in the New Model, the number of metrics used in ranking services is fixed and is not affected by the changing number of metrics used to compute QoS of the layers. The proposed model's advantage emerges at this point since it can handle any number of criteria during the assessment of stage one and treat them at backend level. It's interesting to note that the ranking process does not employ the metrics that were used to calculate the quality of service in stage one; rather, it relies only on the three metrics that are obtained from the evaluation of stage one. As a result, in the New Model paradigm, the execution time of the ranking service is solely impacted by changes in the number of services, not the number of metrics used to calculate the QoS in stage one. In contrast, the AHP-TOPSIS model execution time is impacted by both the growth in the quantity of services and the number of metrics used to determine QoS. This explains why the execution time in AHP-TOPSIS increased quickly whereas the execution time in the New Model increased gradually.
5.2.2. Robustness of the Models: (Sensitivity Analysis)
Even though the New Model successfully ranked all the services as compared with AHP-TOPSIS as mentioned in previous section, it is important to validate these results and ensure the robustness of the proposed model.
It is well established that the assigned values reflecting the relative importance of each criterion, known as weights, have a considerable impact on the outcomes of MCDM approaches. A common technique for determining the impact of changing weights attached to each criterion on the final ranking of alternatives is sensitivity analysis. The model is said to be sensitive to those weights if changing the weights associated with a particular criterion ultimately produces a different ranking. In light of this, the stability of an MCDM model is established if the model's final ranking stays mostly unaffected by the change in weights throughout the sensitivity analysis.
Therefore, in this research, a sensitivity analysis is conducted to assess the robustness and validate the results of the proposed model. The analysis compares the proposed model with the AHP-TOPSIS model by examining how variations in the weights of different criteria affect the ranking of services in both models. The sensitivity analysis is applied to Table 23. The sensitivity analysis is performed based on five scenarios Figure 11 and Figure 12:
- A.
- The First Scenario:
In the first scenario the weight that is assigned to the different criteria in both models are generated with help of the pairwise comparison matrix in AHP technique. For New Model the 0.17, 0.39 and 0.44 are the weights that created by AHP and assigned to App_QoS, Nw_QoS and Perc_QoS criteria respectively.
For AHP-TOPSIS the 0.3, 0.23, 0.18, 0.13, 0.09 and 0.07 are the weights that created by AHP and assigned to accuracy, response time, bandwidth, reliability, price and reputation. The experimental results obtained for this scenario show that, in the proposed model, the highest rank is assigned to Service No. 16 with a score of 2.2. In contrast, the AHP-TOPSIS model assigns the highest rank to Service No. 20 with a score of 71.0, as illustrated in Figure 11 and Figure 12.
- B.
- The Second Scenario:
In the second scenario equal importance is given to all criteria in both models. For the New Model 0.33 the weight that assigned App_QoS, Nw_QoS and Perc_QoS equally. For AHP-TOPSIS model 0.17 is the weight that is assigned to accuracy, response time, bandwidth, reliability, price and reputation equally. The result of the experiment that obtained based on this scenario showed the that both models are not affected by the changing in weight as the New Model gave the service number 16 the high rank and AHP-TOPSIS gave the high rank to service number 20 as shown in Figure 11 and Figure 12. The ranks received by the New Model and AHP-TOPSIS are 2.0 and 43.08 respectively. Hence, service number 16 and 20 gain the high rank and again will be selected as best services.
- C.
- The (Third – Fifth) Scenario:
In these scenarios a dominant weight will be given to one criterion, and the rest of the criteria will be given equal weight.
- D.
- The Third Scenario:
In these scenarios a dominant weight will be given to one criterion and the rest of the criteria will be given an equal weight, for the New Model, 0.4 is assigned to Perc_QoS, as it has been chosen to gain the dominant weight in this scenario, and 0.3 assigned to App_QoS and Nw_QoS equally. For AHP-TOPSIS, 0.2 is assigned to accuracy as it has been chosen to gain the dominant weight in this scenario, and 0.16 is assigned to all the rest of criteria equally. The results that were obtained in this scenario showed that the pattern has not changed and both the models gave the service number 16 and number 20 the high rank as usual. the New Model gave the service number 16 score equal to 1.9, whereas AHP-TOPSIS gave the service number 20 score equal 44.39, Figure 11 and Figure 12.
- E.
- The Fourth Scenario:
In the fourth scenario a dominant weight is shifted to another criterion. For the New Model, 0.4 is assigned to Nw_QoS, as it has been chosen to gain the dominant weight in this scenario, and 0.3 assigned to App_QoS and Perc_QoS equally. For AHP-TOPSIS, 0.2 is assigned to response time as it has been chosen to gain the dominant weight in this scenario, and 0.16 is assigned to all the rest of criteria equally. The results that obtained in this scenario demonstrated that the New Model and AHP-TOPSIS are not affected by the change in weight as still gave the service number 16 and 20 the high rank, Figure 11 and Figure 12.
- F.
- The Fifth Scenario:
As in previous scenario, the dominant weight is also moved to another criterion. For example, in the New Model, 0.4 is assigned to App_QoS whereas 0.3 is assigned to the rest of the criteria on an equal basis. On the other side, in the AHP-TOPSIS, bandwidth is gained the dominant weight, thus, 0.2 is assigned to it, the rest of the criteria are given 0.16 on equal base. The results that were obtained from experiments showed that both models show significant stability as all of them are not affected by the change of weight. Consequently, the number 16 and 20 receive the high rank as usual, Figure 11 and Figure 12.
To sum up, the above scenarios demonstrated that both models are not affected by the change of the weight in all scenarios and the two models showed high grades of stability as are not affected by the change in weight according to the results of sensitivity analysis. From this result, it can be concluded that the sensitivity analysis result demonstrates the model's robustness of the New Model and AHP-TOPSIS models because the ranking is stable.
5.3. Applicability to Real-World IoT Deployment Scenarios
To ground the proposed model beyond the synthetic evaluation dataset, this section discusses its application in two representative IoT deployment contexts with markedly different operational profiles.
- A.
- Smart agriculture.
In a precision-irrigation deployment, perception-layer services correspond to soil moisture, temperature, and humidity sensors, typically connected over LPWAN links (e.g., LoRaWAN) characterized by long range but constrained bandwidth and duty-cycle limits. Under normal conditions, a routine soil-moisture check ahead of a scheduled irrigation cycle is non-critical: the proposed filtering stage permits selection of a lower-QoS service, reducing energy and bandwidth demand on constrained field sensors. During a drought-stress or early disease-outbreak window, the same request is reclassified as critical, and the model restricts selection to high-QoS services capable of frequent, high-accuracy readings, directly reducing the risk of a missed intervention window. This illustrates the overqualification problem the model targets: a static, preference-only selection policy would either over-provision every routine check (unnecessary energy cost on battery-powered field sensors) or under-provision critical readings (crop-loss risk); purpose-aware filtering avoids both.
- B.
- Smart factory.
In an industrial predictive-maintenance deployment, perception-layer services correspond to vibration, thermal, and acoustic sensors on production equipment, typically connected via industrial Ethernet or private 5G with strict latency and reliability requirements. A scheduled health check on non-critical auxiliary equipment is non-critical in the model's terms, permitting lower-QoS sensing services and freeing network capacity for time-sensitive traffic. When an anomaly indicator crosses a threshold on safety-critical machinery, the request is reclassified as critical, and the model restricts the candidate pool to high-QoS, high-frequency sensing services needed for reliable early-fault diagnosis — consistent with the low-latency, high-reliability expectations of Time-Sensitive Networking in industrial settings. Here, overqualification would manifest as continuously reserving high-QoS sensing bandwidth for routine checks across an entire production line, a real resource cost at factory scale; the proposed model avoids this by reserving high-QoS provisioning for the conditions that actually require it
6. Conclusion
Delivering a service that meets certain standards of quality demanded by end users in the realm of IoT has clearly piqued the interest of many academics. This research addressed this issue and developed an assessment and selection model that allows services providers to provide consumers of IoT ecosystems with services that meet their specific requirements and match their actual needs.
The model mainly consists of two parts: the assessment part and selection part. For the assessment part a two-stage assessment method based on fuzzy logic is developed to evaluate the quality of IoT services in registry across all specified layers. Based on the results obtained and reference to the range of fuzzy set of QoS parameters that we identified earlier in the FLS, the model has successfully evaluated all the services in the registry and classified them into three categories: high-quality services, medium quality services and low-quality services.
For the selection part, a Purpose-based and Analytical Hierarchy Process (AHP) for Filtering and Selecting Services (PAHP-FSS) model is developed as a new model to improve selection service based on QoS in IoT environment. In addition to user preferences, the model considers the task's purpose when filtering services and determining the level of QoS that meets the user's requirements. Then, the AHP-based decision hierarchy model is developed to rank and determine the best service and deliver it to the consumer. The results achieved showed that the selection model successfully ranks and selects the best services that can be delivered to the end user. In a nutshell, the proposed model accomplished the following objectives: handle the issue of overqualification services by selecting services based on the purpose of the task, thus, the service providers can effectively manage the IoT resources. Moreover, the model reduces the time spent on ranking the services. Additionally, since the model developed based on our published research that used fuzzy logic approach in assessing QoS in IoT ecosystem, thereby eliminating the problem of human uncertainty, allowing users to request services using linguistic expressions rather than numbers. Furthermore, the proposed model showed significant stability according to the sensitivity analysis experiments that carried out. Finally, the model helps the services providers to take the right decision and provides the consumers with the best service among huge number of services that have same level of quality.
In general, the model will give IoT service providers practical tools that they may integrate with other existing models to handle some issues that have not yet been addressed by prior studies.
In future work, we recommend using some supervised learning algorithm such as the K-nearest neighbors (KNN) algorithm as we expect it can improve the selection processes. Moreover, we recommend using a shortest path algorithm such as Dijkstra Algorithm, as we expect this algorithm will help the ESP to select the best service not only based on the result of ranking but also based on the location of the sensor. Furthermore, if the QoS dataset for the IoT domain is correctly developed and trustworthy, we recommend employing the Neural Fuzzy System to effectively deal with the uncertainty of the IoT environment.
Supplementary Materials
The following supporting information can be downloaded at the website of this paper posted on Preprints.org.
Author Contributions
Conceptualization, methodology: Dr. Mutasim Adam. and Aghabi Nabil Abosaif. Supervision, Conceptualization, Dr. Yasir Mohamed.; validation, Akbar Khanan.
Funding
This research received no external funding.
Institutional Review Board Statement
Not applicable.
Informed Consent Statement
Not applicable
Data Availability Statement
The datasets and MATLAB code used in this study are available as Supplementary Materials
Acknowledgments
Authors would like to thank Sudan University for Science and Technology, and A’Sharqiyah University.
Conflicts of Interest
The authors declare no conflicts of interest.
References
- Yalli, J.S.; Hasan, M.H.; Badawi, A. Internet of Things (IoT): Origin, Embedded Technologies, Smart Applications, and Its Growth in the Last Decade. IEEE Access 2024, 12. [Google Scholar] [CrossRef]
- Sinha, S. State of IoT 2025: Number of Connected IoT Devices Growing 14% to 21.1 Billion Globally. [PubMed]
- Abuserrieh, L.; Alalfi, M.H. A Survey on Verification of Security and Safety in IoT Systems. IEEE Access 2024, 12. [Google Scholar] [CrossRef]
- Choudhary, A. Internet of Things: A Comprehensive Overview, Architectures, Applications, Simulation Tools, Challenges and Future Directions. Discov. Internet Things 2024, 4. [Google Scholar] [CrossRef]
- Rana, V. A Comprehensive Review of the Internet of Things (IoT): Architecture, Application, Challenges and Future Directions. Int. J. Res. Appl. Sci. Eng. Technol. 2025, 13. [Google Scholar] [CrossRef]
- Nižetić, S.; Šolić, P.; López-de-Ipiña González-de-Artaza, D.; Patrono, L. Internet of Things (IoT): Opportunities, Issues and Challenges towards a Smart and Sustainable Future. J. Clean. Prod. 2020, 274. [Google Scholar] [CrossRef] [PubMed]
- Mansour, M.; Gamal, A.; Ahmed, A.I.; Said, L.A.; Elbaz, A.; Herencsar, N.; Soltan, A. Internet of Things: A Comprehensive Overview on Protocols, Architectures, Technologies, Simulation Tools, and Future Directions. Energies 2023, 16. [Google Scholar] [CrossRef]
- The Role of Internet of Things (IoT), Smart Devices, and Data Integration in Transforming Business Operations. Eur. Econ. Lett. 2025. [CrossRef]
- Sidik, A.R.; Tawakal, A.; Sumirat, G.S.; Narputro, P. Smart Irrigation Based on Soil Moisture Sensors with Photovoltaic Energy for Efficient Agricultural Water Management: A Systematic Literature Review †. Eng. Proc. 2025, 107. [Google Scholar] [CrossRef]
- Hassan, N.; Hasib Cheragee, S.; Ahammed, S.; Md. Touhidul; Islam, A.Z. Sensor Based Smart Irrigation System with Monitoring and Controlling Using Internet of Things. Int. J. Ambient Syst. Appl. 2021, 9. [Google Scholar] [CrossRef]
- Cavallaro, K.F.; Francois, J.; Jacques, R.; Mentor, D.; Yalcouye, I.; Wilkins, K.; Mueller, N.; Turner, R.; Wallace, A.; Tohme, R.A. Demonstration of the Use of Remote Temperature Monitoring Devices in Vaccine Refrigerators in Haiti. Public Health Rep. 2018, 133. [Google Scholar] [CrossRef] [PubMed]
- Jiang, S.; Jia, S.; Guo, H. Internet of Things (IoT)-Enabled Framework for a Sustainable Vaccine Cold Chain Management System. Heliyon 2024, 10. [Google Scholar] [CrossRef] [PubMed]
- Vailshery, L.S. Number of Internet of Things (IoT) Connections Worldwide from 2022 to 2023, with Forecasts from 2024 to 2034. Available online: https://www.statista.com/statistics/1183457/iot-connected-devices-worldwide/ (accessed on 9 August 2026).
- Torchia, M.; Shirer, M. IDC Forecasts Worldwide Spending on the Internet of Things to Reach $745 Billion in 2019. IDC Press 2019. [Google Scholar]
- Martens, C.D.P.; da Silva, L.F.; Silva, D.F.; Martens, M.L. Challenges in the Implementation of Internet of Things Projects and Actions to Overcome Them. Technovation 2022, 118. [Google Scholar] [CrossRef]
- Villa-Henriksen, A.; Edwards, G.T.C.; Pesonen, L.A.; Green, O.; Sørensen, C.A.G. Internet of Things in Arable Farming: Implementation, Applications, Challenges and Potential. Biosyst. Eng. 2020, 191. [Google Scholar] [CrossRef]
- White, G.; Nallur, V.; Clarke, S. Quality of Service Approaches in IoT: A Systematic Mapping. J. Syst. Softw. 2017, 132. [Google Scholar] [CrossRef]
- Et-Tousy, J.; Abourriche, S.; Zyane, A. Cost and QoS Analysis in IoT: An Optimization Approach Based on the OneM2M Standard †. Eng. Proc. 2025, 112. [Google Scholar] [CrossRef]
- Younas, M.I.; Iqbal, M.J.; Aziz, A.; Sodhro, A.H. Toward QoS Monitoring in IoT Edge Devices Driven Healthcare-A Systematic Literature Review. Sensors 2023, 23. [Google Scholar] [CrossRef] [PubMed]
- Suarez-Albela, M.; Fernandez-Carames, T.M.; Fraga-Lamas, P.; Castedo, L. A Practical Performance Comparison of ECC and RSA for Resource-Constrained IoT Devices. 2018 Global Internet of Things Summit, GIoTS 2018 2018. [Google Scholar] [CrossRef]
- Mohammadifar, M.; Choi, S. A Solid Phase Bacteria-Powered Biobattery for Low-Power, Low-Cost, Internet of Disposable Things. J. Power Sources 2019, 429, 105–110. [Google Scholar] [CrossRef]
- Kanneganti, D.; Mistry, S.; Fattah, S.M.M.; Krishna, A.; Bhuyan, M. Adaptive Composition of Machine Learning as a Service (MLaaS) for IoT Environments. 2025. [Google Scholar] [CrossRef]
- Byabazaire, J.; O’Hare, G.M.P.; Collier, R.; Delaney, D. IoT Data Quality Assessment Framework Using Adaptive Weighted Estimation Fusion. Sensors 2023, 23, 1–18. [Google Scholar] [CrossRef] [PubMed]
- Sgora, A.; Chatzimisios, P. Defining and Assessing Quality in IoT Environments: A Survey. IoT 2022, 3, 493–506. [Google Scholar] [CrossRef]
- Saddik, L.A.; Khalifa, B.A.; Fateh, B. Evaluation Quality of Service for Internet of Things Based on Fuzzy Logic: A Smart Home Case Study. Indones. J. Electr. Eng. Comput. Sci. 2022, 25, 825–839. [Google Scholar] [CrossRef]
- Singh, S.; Tiwari, R.K. Quality of Services in Assets of Smart Parking. Proceedings - 2018 3rd International Conference On Internet of Things: Smart Innovation and Usages, IoT-SIU 2018 2018; pp. 1–5. [Google Scholar] [CrossRef]
- Dongre, Y.; Ingle, R. An Investigation of QoS Criteria for Optimal Services Selection in Composition. 2nd International Conference on Innovative Mechanisms for Industry Applications, ICIMIA 2020 - Conference Proceedings; 2020; pp. 705–710. [Google Scholar] [CrossRef]
- Ameyed, D.; Jaafar, F.; Petrillo, F.; Cheriet, M. Quality and Security Frameworks for IoT-Architecture Models Evaluation. SN Comput. Sci. 2023, 4, 1–17. [Google Scholar] [CrossRef]
- Liu, X.; Deng, Y. A New QoS-Aware Service Discovery Technique in the Internet of Things Using Whale Optimization and Genetic Algorithms. J. Eng. Appl. Sci. 2024, 71, 1–18. [Google Scholar] [CrossRef]
- Alrashdi, I. An Intelligent Neutrosophic Type-II Model for Selecting Optimal Internet of Things (IoT) Service Provider: Analysis and Application. Neutrosophic Sets Syst. 2024, 66, 205–217. [Google Scholar] [CrossRef]
- Awanyo, Christson, and N.G. Leveraging Deep Learning-Based Approach for IoT Service Composition Through Local Service Selection. In Springer Nature; 2024; pp. 267–277.
- Baranwal, G.; Singh, M.; Vidyarthi, D.P. A Framework for IoT Service Selection; Springer US, 2020; Vol. 76, ISSN ISBN 0123456789. [Google Scholar]
- Li, L.; Li, S.; Zhao, S. QoS-Aware Scheduling of Services-Oriented Internet of Things. IEEE Trans. Ind. Inform. 2014, 10. [Google Scholar] [CrossRef]
- Tripathi1, M.S. · G.B.· A.K. QoS-Aware Selection of IoT-Based Service. Pdf. Arab. J. Sci. Eng. 2020, 45(12). [Google Scholar]
- Abu-safe, A.N.; Elrofai, S.E. QOS – Aware Meta-Heuristic Services Selection Algorithm and Likert Scale Measurement for IOT Environment. Int. J. Comput. Sci. Trends Technol. (IJCST) 2020, 8, 1–8. [Google Scholar]
- Liu, J.; Chen, Y.; Chen, X.; Ding, J.; Chowdhury, K.R.; Hu, Q.; Wang, S. Kooperativna Evolucija Za Kvalitetno Pružanje Usluga u Paradigmi Interneta Stvari. Automatika 2013, 54, 438–447. [Google Scholar] [CrossRef]
- Singh, S.; Tiwari, R.K. Quality of Service-Based Service Selection in Smart Parking. Int. J. Inf. Decis. Sci. 2020, 12, 154–175. [Google Scholar] [CrossRef]
- Charith Perera1, 2*, Arkady Zaslavsky2, P.C. and D.G. Sensing as a Service Model for Smart Cities Supported by Internet of Things. Trans. Emerg. Telecommun. Technol. 2013, 25, 81–93. [CrossRef]
- Zhang, X.; Geng, J.; Ma, J.; Liu, H.; Niu, S. A QoS-Driven Service Selection Optimization Algorithm for Internet of Things. Eur. PMC 2021, 2021, 1–13. [Google Scholar] [CrossRef]
- Ding, Z.; Wang, S.; Pan, M. QoS-Constrained Service Selection for Networked Microservices. IEEE Access 2020, 8, 39285–39299. [Google Scholar] [CrossRef]
- Alajmi, A.; Ghandoura, A.; Motwakel, A.; Fayaz, M. Learning Meets Logic: Fuzzy Logic Based Deep Matching for Intelligent User Association in 6G IoT Networks. IEEE Open J. Commun. Soc. 2025, 6. [Google Scholar] [CrossRef]
- Morchid, A.; Said, Z.; Abdelaziz, A.Y.; Siano, P.; Qjidaa, H. Fuzzy Logic-Based IoT System for Optimizing Irrigation with Cloud Computing: Enhancing Water Sustainability in Smart Agriculture. Smart Agric. Technol. 2025, 11. [Google Scholar] [CrossRef]
- Adam, M.E.; Hamid, Y.A.A. A Two-Stage Assessment Approach for QoS in Internet of Things Based on Fuzzy Logic. Int. J. Adv. Comput. Sci. Appl. 2022, 13, 689–696. [Google Scholar] [CrossRef]
- Alarbi, M.; Lutfiyya, H. Sensing as a Service Middleware Architecture. Proceedings - 2018 IEEE 6th International Conference on Future Internet of Things and Cloud, FiCloud 2018 2018; pp. 399–406. [Google Scholar] [CrossRef]
- Perera, C.; Zaslavsky, A.; Christen, P.; Georgakopoulos, D. CA4IOT: Context Awareness for Internet of Things. Proceedings-2012 IEEE Int. Conf. on Green Computing and Communications, GreenCom 2012, Conf. on Internet of Things, iThings 2012 and Conf. on Cyber, Physical and Social Computing CPSCom 2012 2012, 775–782. [CrossRef]
- Subash, K.; Janet Ramya, D.; Arockiam, L. Quality of Service in the Internet of Things (IoT)-A Survey. Res. Teach. Learn. Lett. (ReTeLL) 2019, 21. [Google Scholar]
- Samann, F.E.F.; Zeebaree, S.R.M.; Askar, S. IoT Provisioning QoS Based on Cloud and Fog Computing. J. Appl. Sci. Technol. Trends 2021, 2, 29–40. [Google Scholar] [CrossRef]
- Singh, M.; Baranwal, G. Quality of Service (QoS) in Internet of Things. Proceedings - 2018 3rd International Conference On Internet of Things: Smart Innovation and Usages, IoT-SIU 2018 2018; pp. 1–6. [Google Scholar] [CrossRef]
- Saaty, T.L.; Begicevic, N. The Analytic Hierarchy Process Applied to Complexity. Int. J. Econ. Bus. Res. 2012, 4, 266. [Google Scholar] [CrossRef]
- Saaty, R.W. The Analytic Hierarchy Process-What It Is and How It Is Used. Math. Model. 1987, 9. [Google Scholar] [CrossRef]
- Bai, Y.; Wang, D. Fundamentals of Fuzzy Logic Control — Fuzzy Sets, Fuzzy Rules and Defuzzifications. Adv. Ind. Control 2006, 17–36. [Google Scholar] [CrossRef]
MUTASIM ELSADIG ADAM (born 1973, Sudan), received the B.S. in Computer Science in 2001 from International University of Africa. In 2013, he received his M.S. degrees in Information Technology from the International Islamic University Malaysia (IIUM). In 2024 he received his Ph.D. degree in Computer Science from Sudan University of Science and Technology.
From 2001 to 2007, he was working as a system analyst at IT department in Ministry of social Development., then he was promoted to a director of IT department and he was working there from 2007 to 20017. From 2018 to 2020 he was working in telecommunication project as project manager. From 2020 to 2022 he was working a director of Information and Smart Government Center of Ministry of Health. Beyond the experience at industry, he has worked at many academic positions, his teaching journey spans institutions in Sudan and Saudi Arabia. He was working as a lecturer in Accurate Center for Computer Studies from 2014 to 2015, he also was working as a part time lecturer at Canadian Sudanese College (CSC) from 2022 to 2024. From 2023 to 2024 he had worked as a part time lecturer at Imam Mohammad Ibn Saud Islamic University. Currently he is appointed as a part time assistant professor at Canadian Sudanese College (CSC).
He has 7 published articles. His research interests’ focus on the intersection of sophisticated data analytics, intelligent systems, and the Internet of Things (IoT). He is focusing on how to analyze massive amounts of data produced by IoT devices in order to turn raw streams into useful insights for more intelligent decision-making. Obviously, he interested in dynamic, data-intensive situations like smart cities. In this case, statistical and machine learning models can be integrated with domain-specific insights like commuter behavior and environmental conditions to improve prediction accuracy and operational responsiveness.
YASIR ABDELGADIR MOHAMED (Senior Member, IEEE) received the B.Sc. degree in computer technology and the Master of Science (M.Sc.) degree in network and computer engineering from the University of Gezira, in 2001 and 2003, respectively, and the Ph.D. degree in information technology from esteemed Universiti Teknologi PETRONAS, in 2010. He has been a dedicated full-time Faculty Member of the Department of Management Information System, College of Business Administration, A’Sharqiyah University, Ibra, Oman. With a strong educational background and a wealth of experience in the field of information technology, he has made significant contributions to academia and research. His dedication to academic excellence is further demonstrated by his earlier academic achievements, including the B.Sc. and M.Sc. degrees. As an Assistant Professor and the Head of Information Systems with the Computer Networks Department and the Statistics Department, Karary University, from 2012 to 2021, where he played a pivotal role in shaping the educational landscape. He is also a Prolific Researcher and has published numerous articles in reputable journals. Furthermore, he has actively participated in various conferences, where he has shared his expertise in areas, such as network security, cloud computing, software-defined networking (SDN), and the Internet of Things (IoT).
AGHABI NABIL ABOSAIF (born in 1987, Sudan) received the B.E. degree in Information Technology and the M.E. degree in Software Engineering from the University of Khartoum, Sudan, in 2008 and 2013, respectively. She obtained the Ph.D. degree in Computer Science from Sudan University of Science and Technology, Khartoum, Sudan.
She has held various academic and research positions, including Research Assistant and Programmer at the Nile Center for Technology Research (NCTR), Sudan, and Teaching Assistant at the University of Khartoum. She previously served as Head of the Software Engineering Department for Electronic Systems, and as the Information Coordinator overseeing seven engineering departments at the University of Science and Technology, Omdurman, Sudan. She is currently a part-time Assistant Professor at both the Arab Academy for Science, Technology and Maritime Transport, and Sudan University of Science and Technology, where she teaches in the Department of Software Engineering. Dr. Abosaif's research interests span the areas of Internet of Things (IoT), service selection algorithms, smart healthcare systems, data science, data analytics, intelligent environments, and software engineering education. She is actively engaged in interdisciplinary research, academic leadership, and the advancement of emerging intelligent technologies.
AKBAR KHANAN (Senior Member, IEEE) received the master’s degree in computer science from Kohat University of Science and Technology, Kohat, Pakistan. He has been a dedicated full-time Faculty Member of the Department of Management Information System, College of Business Administration, A’Sharqiyah University, Ibra, Oman. His research interests include the IoT, connected vehicles, wireless communications, networking, security issues in wireless networks, big data, cloud computing, and smart cities. Over the years, he has guided numerous graduate and undergraduate students with the College of Business Administration. He has also taken an active role in organizing various workshops, seminars, and training sessions. In addition to his academic contributions, he has a keen interest in quality auditing (QA) and has actively participated in numerous QA initiatives, including self-review auditing. Notably, he has played a significant role in shaping the future of learning. He has been instrumental in creating new bachelor’s degrees in cybersecurity and internet and information technology, proposing an innovative program in data science and data analytics, and updating the Bachelor of Business Administration (Management Information System) Program.
Figure 1.
The proposed Assessment and Selection model.
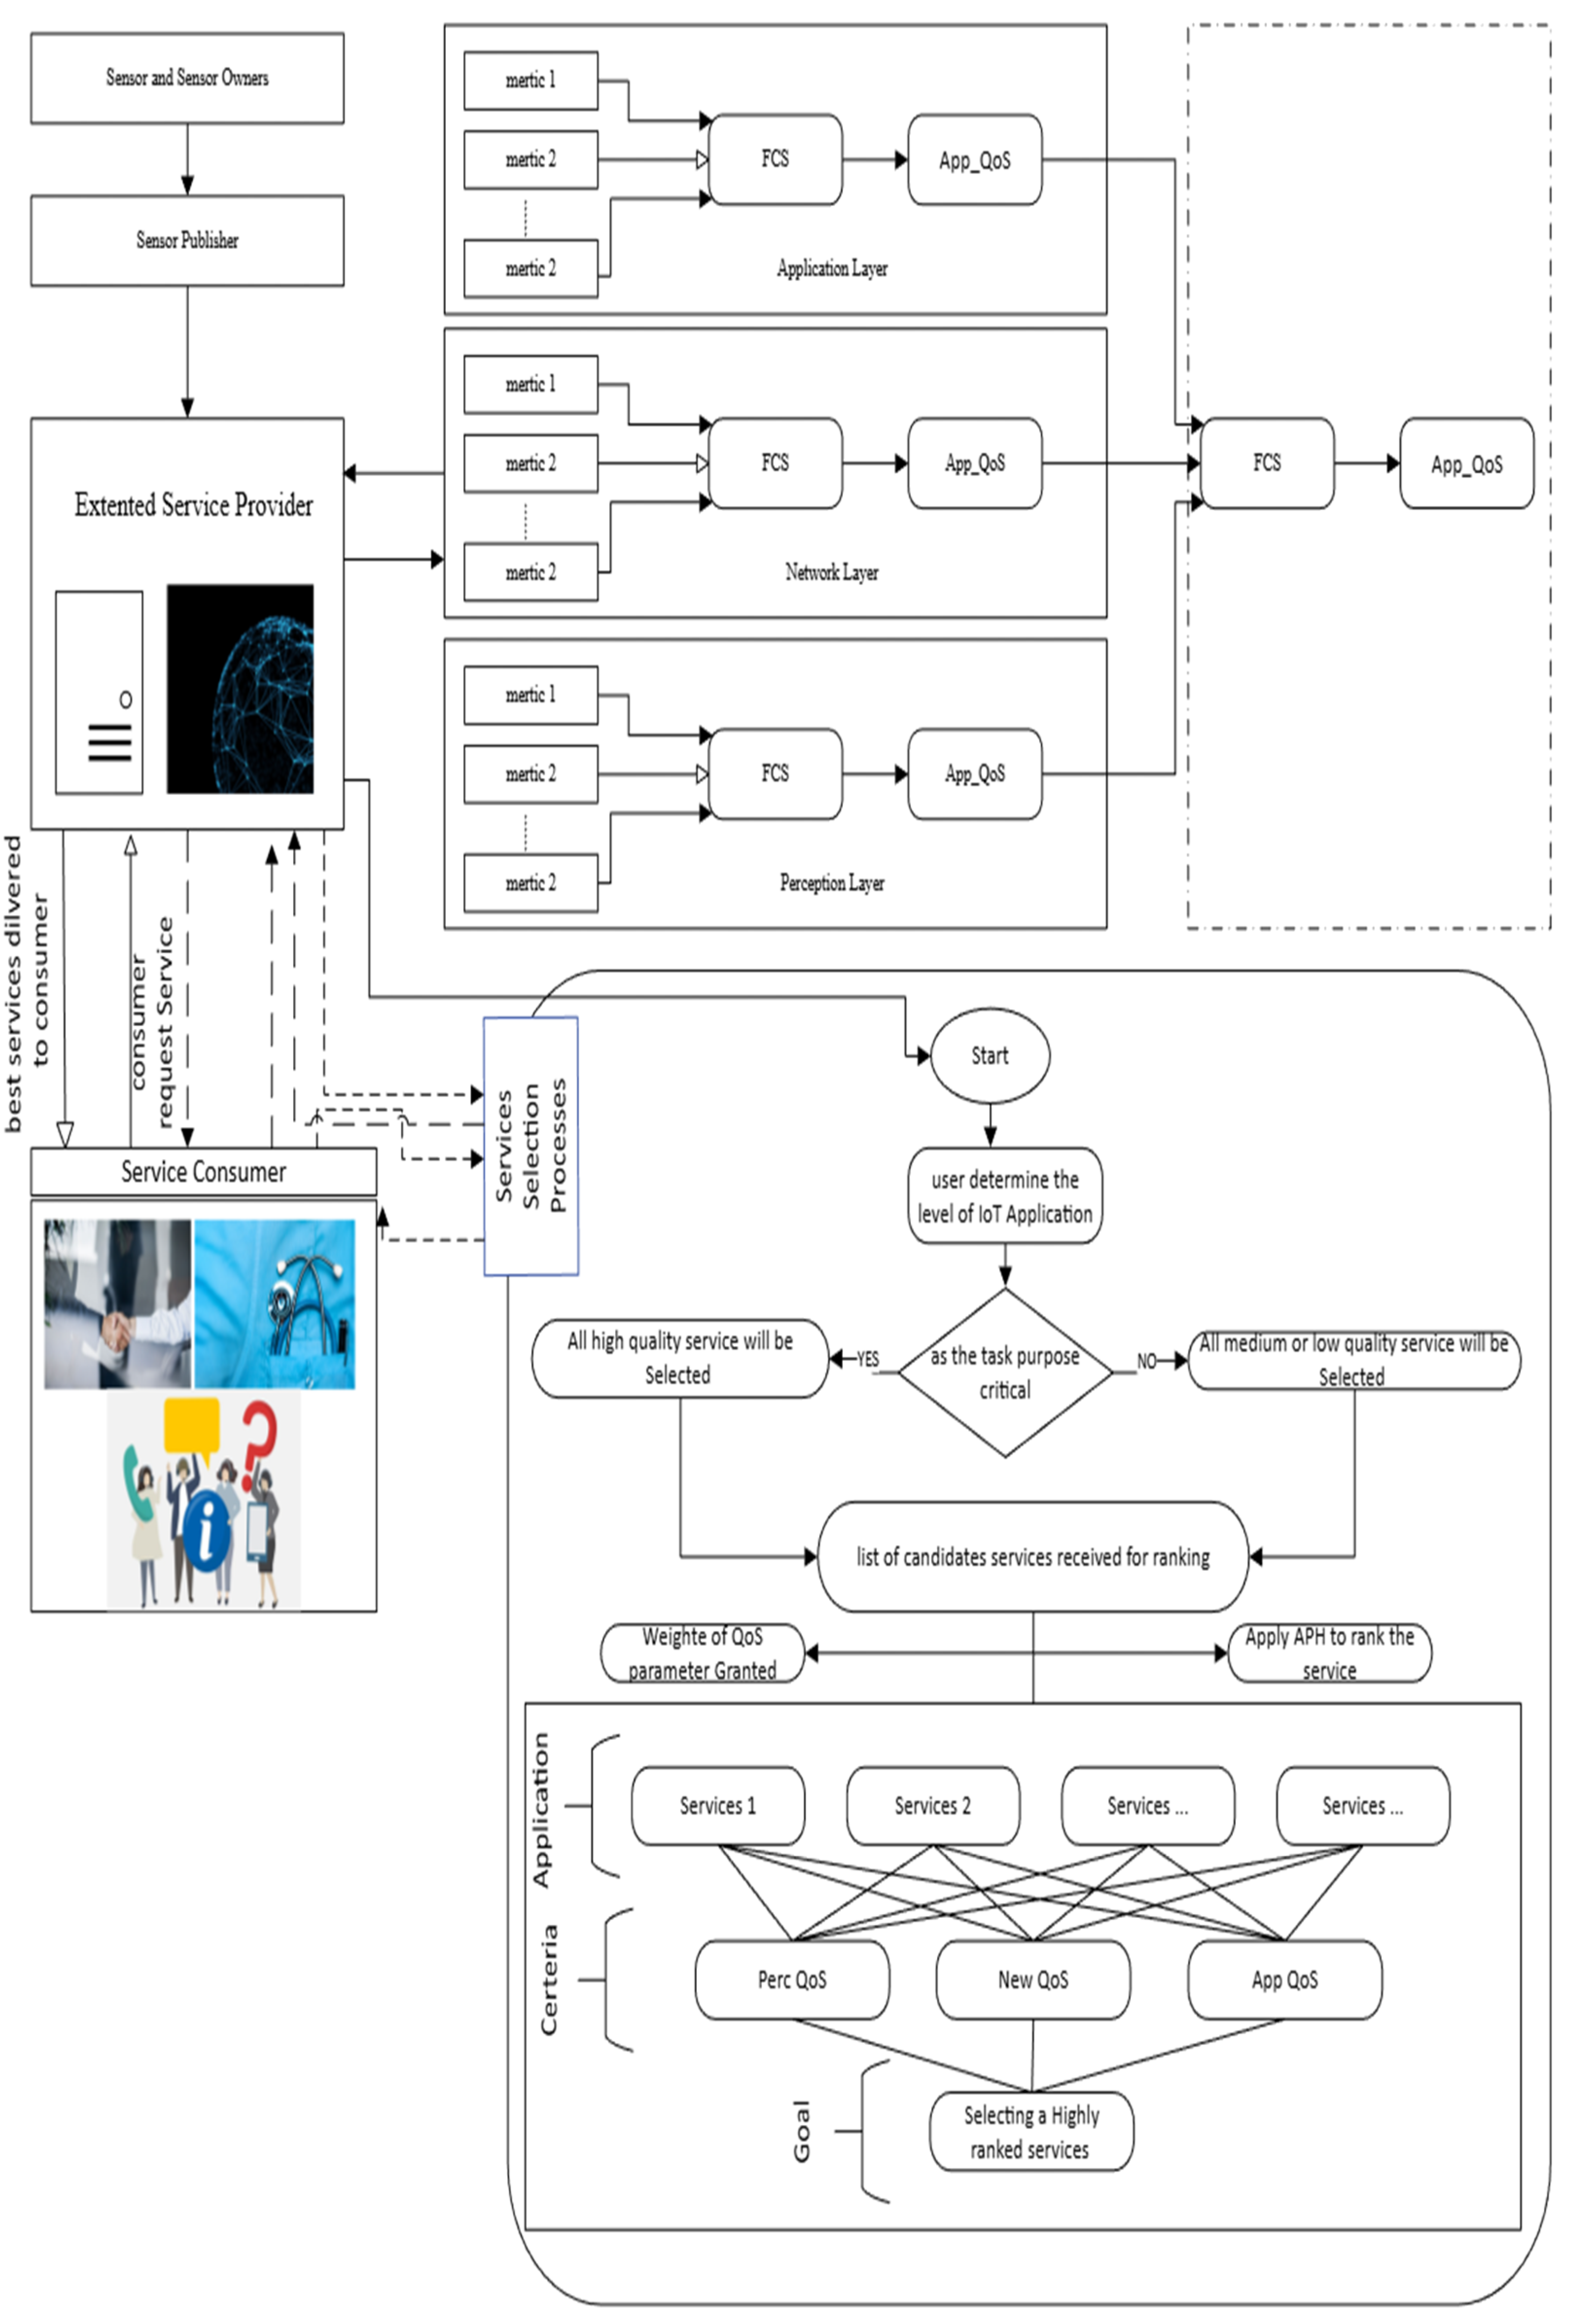
Figure 2.
The fuzzy logic control system architecture.
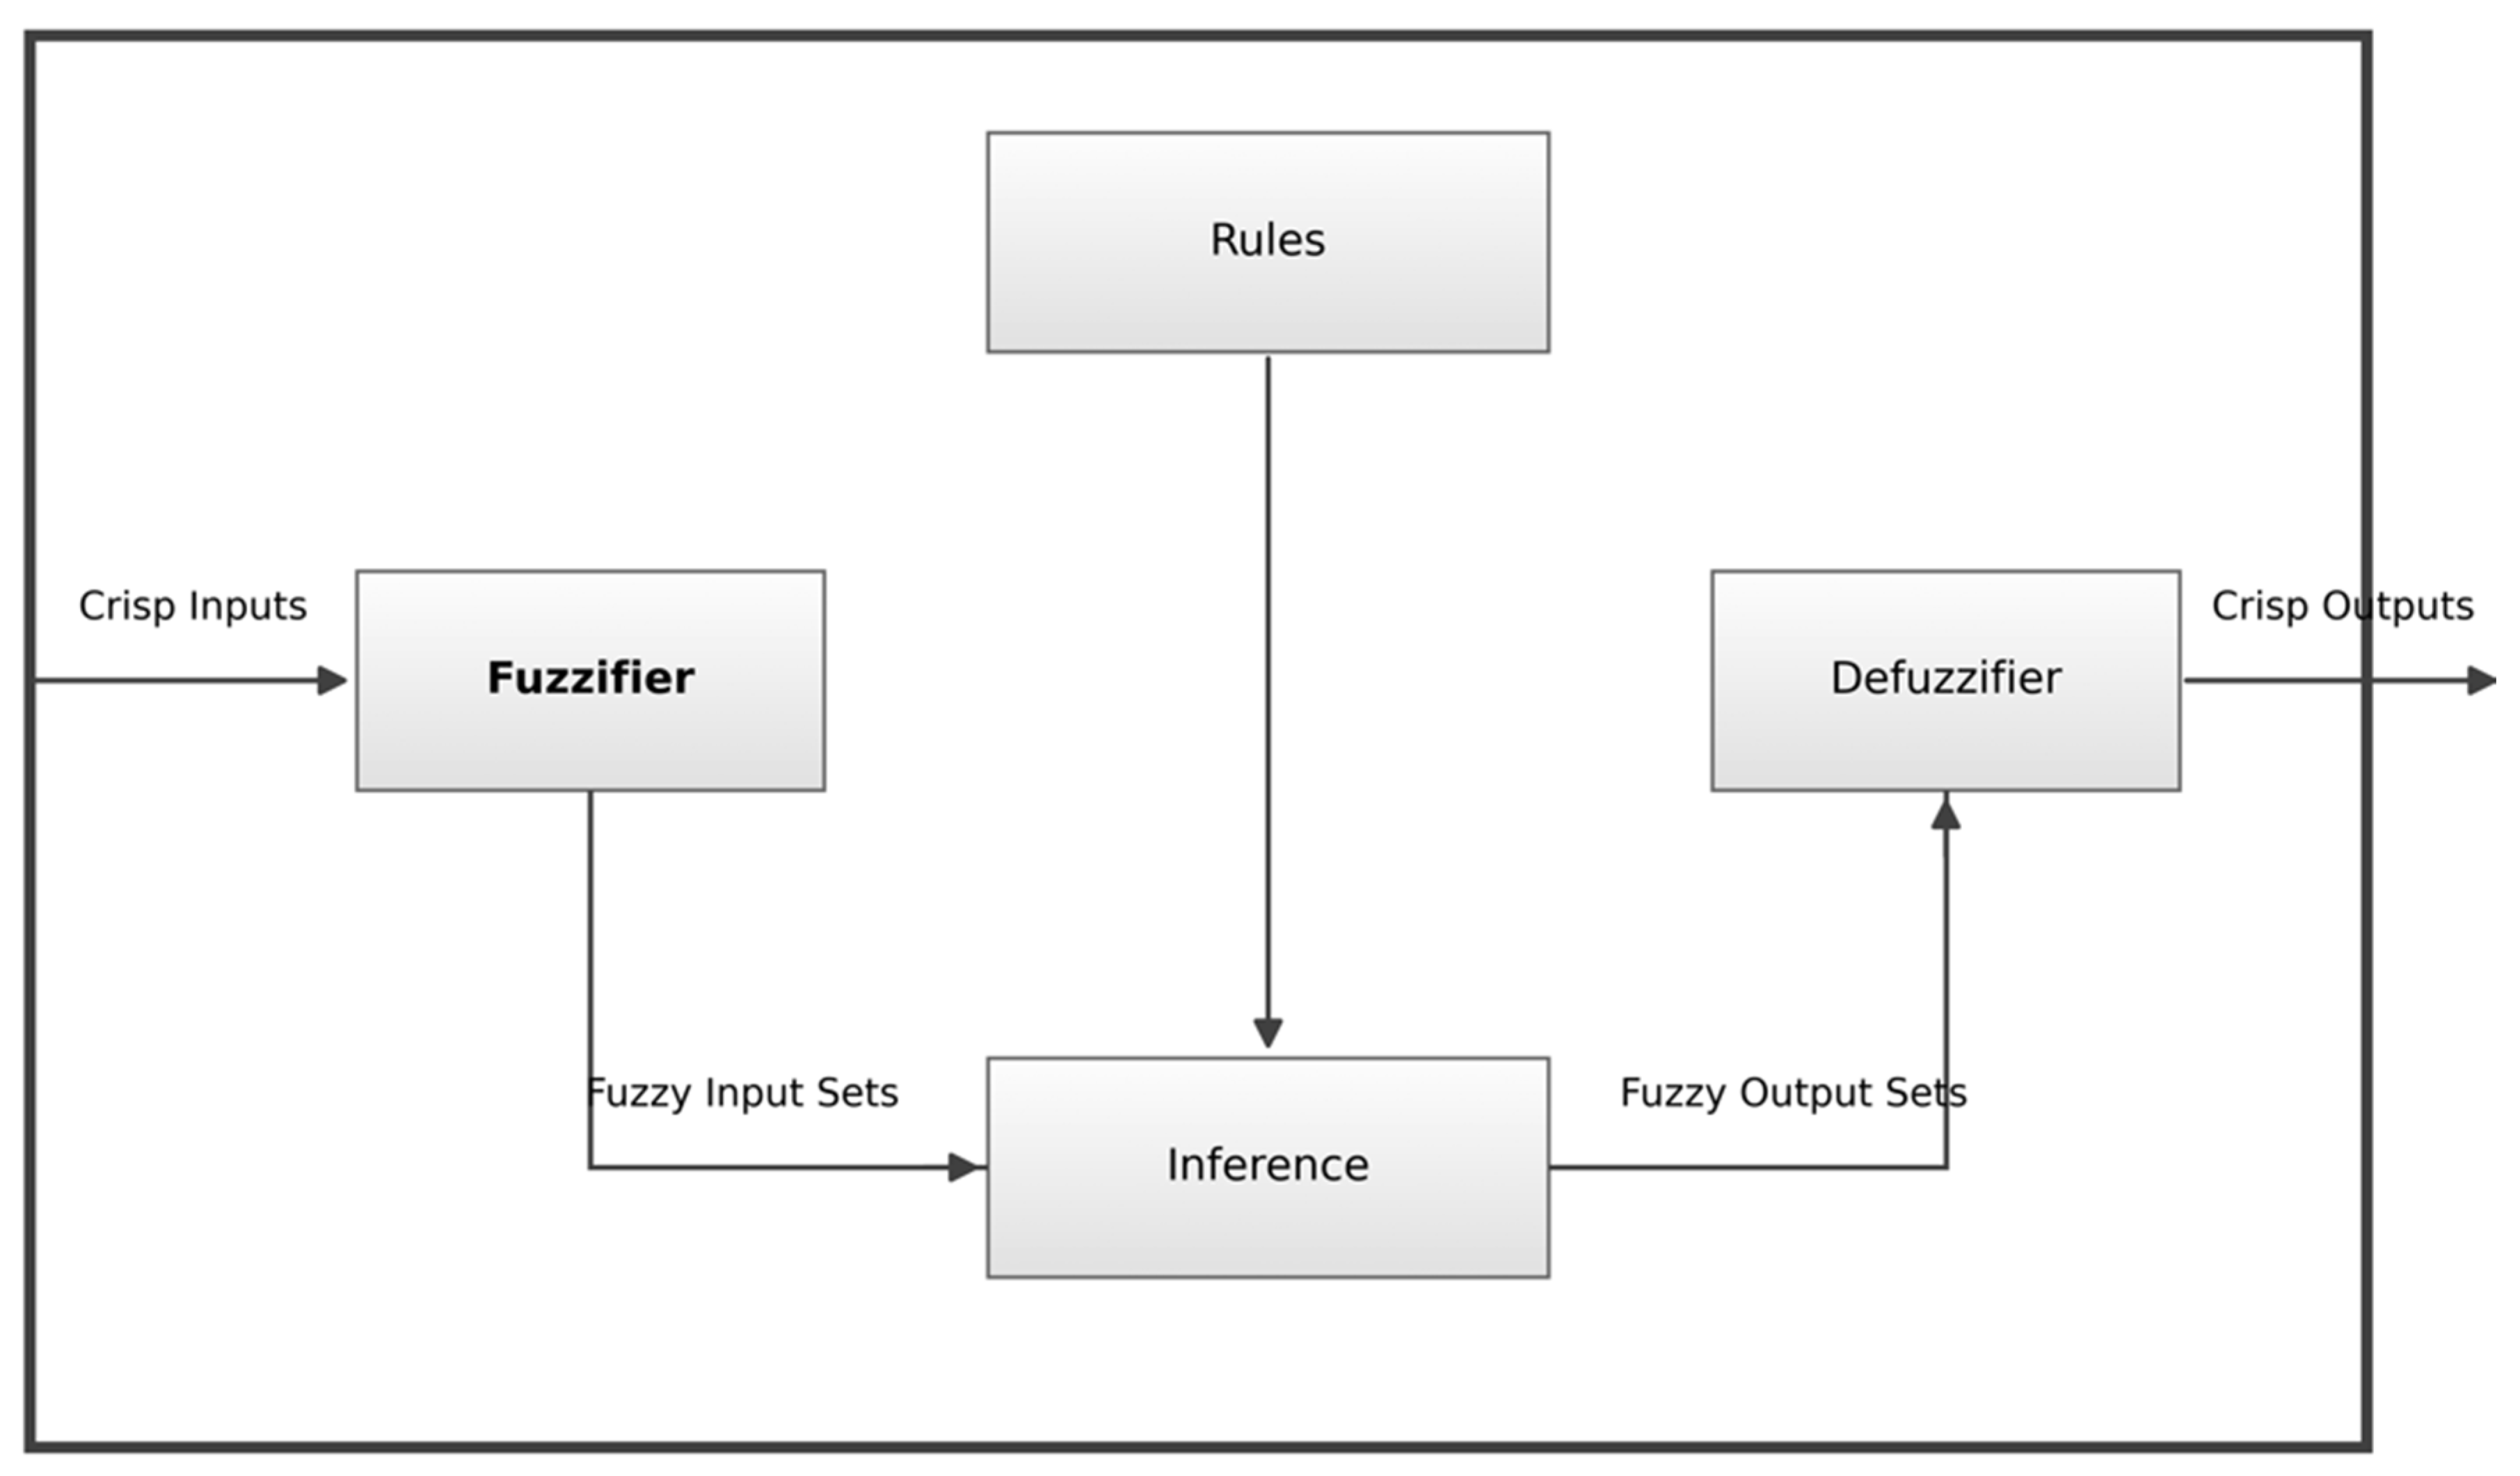
Figure 3.
The triangular fuzzy shape.
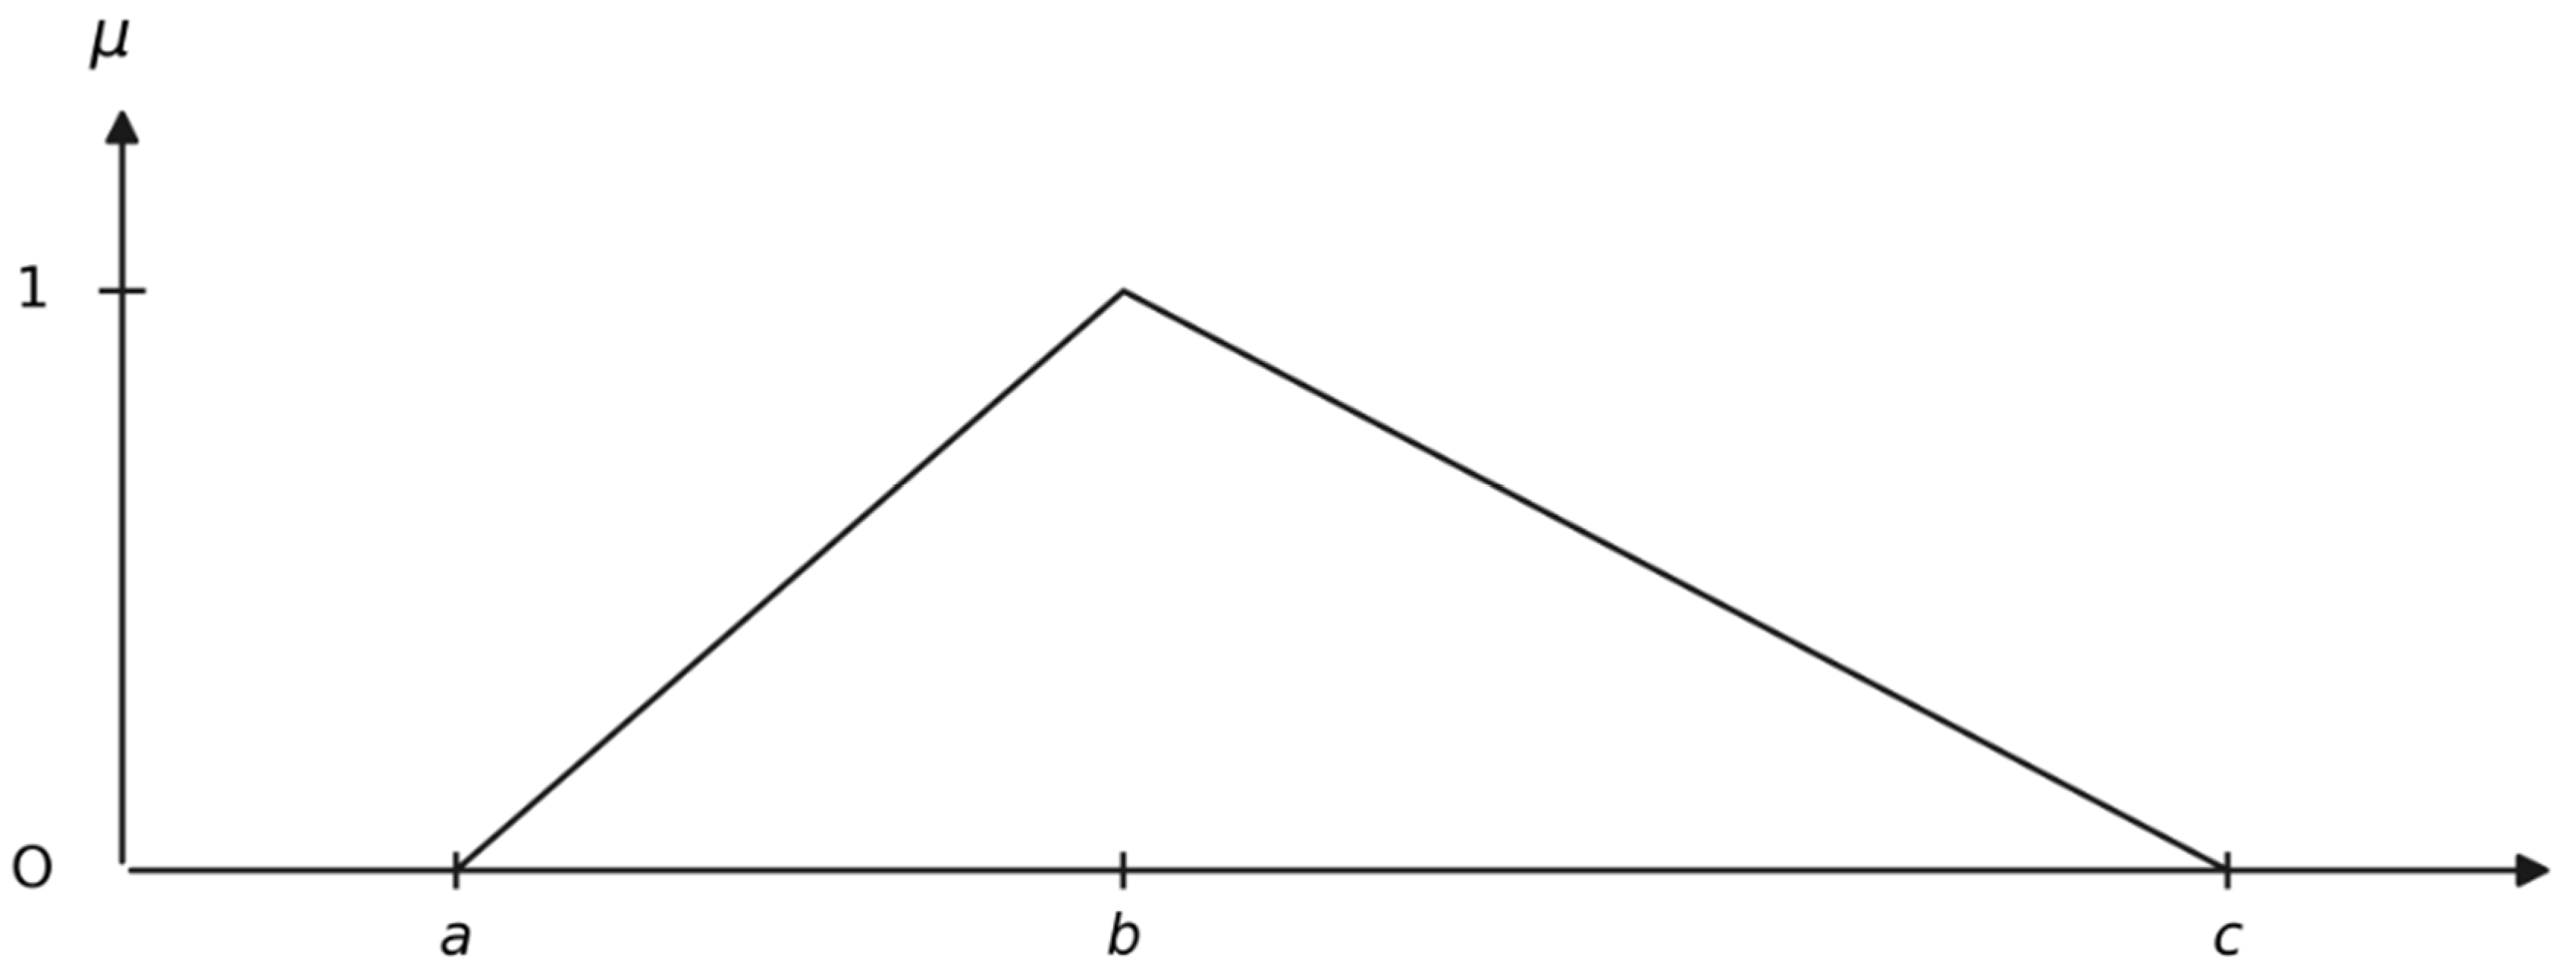
Figure 4.
The Trapez fuzzy shape.
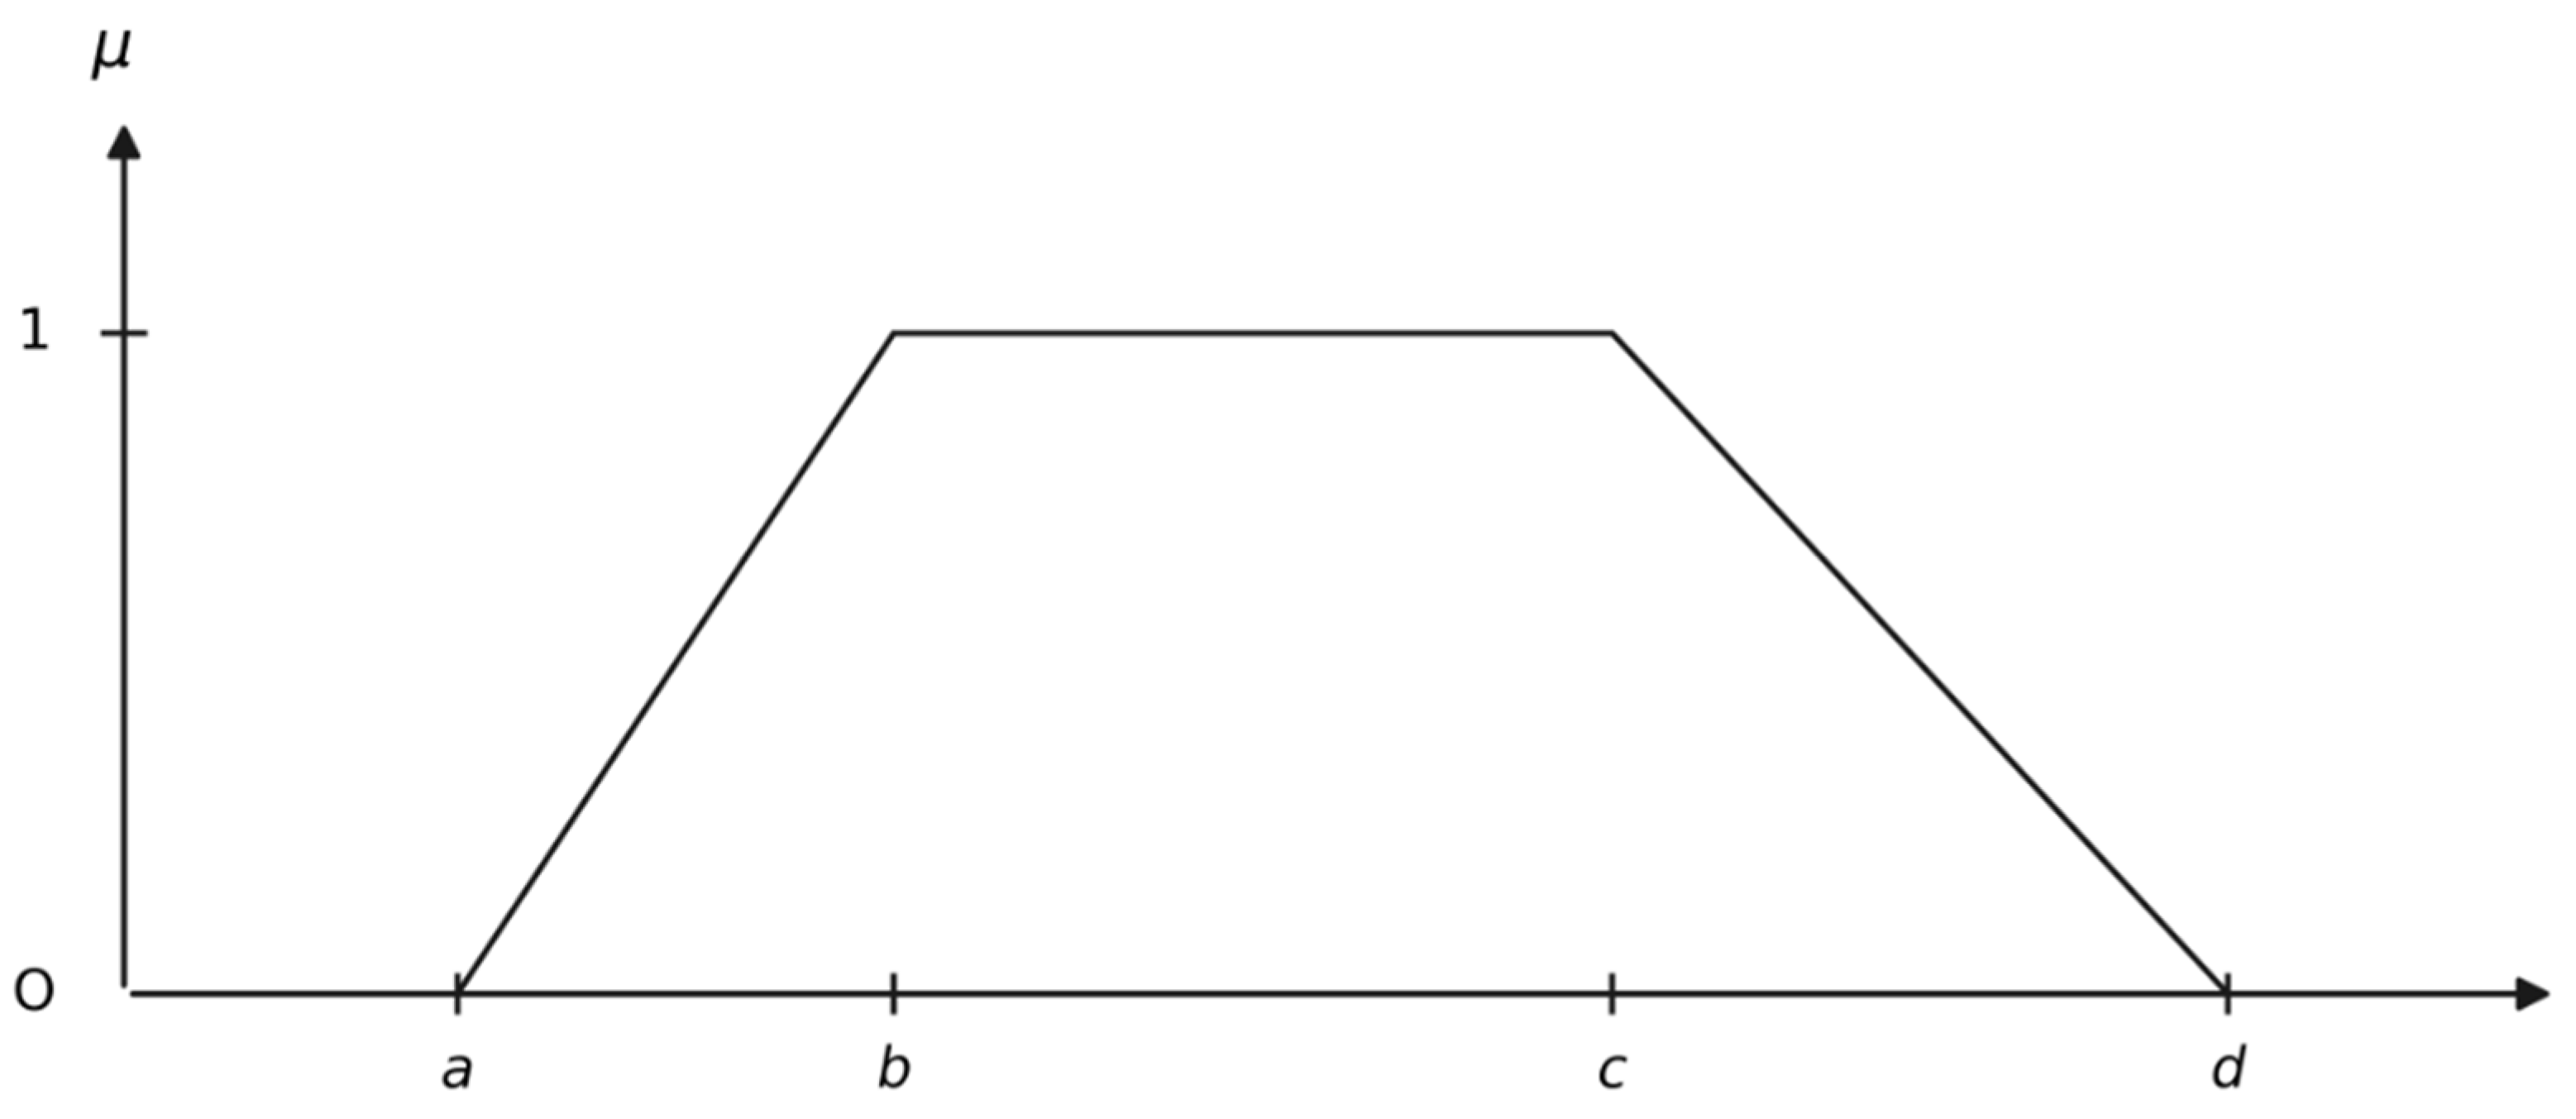
Figure 5.
The Mean of Maxima (MOM) Deffuzifier.
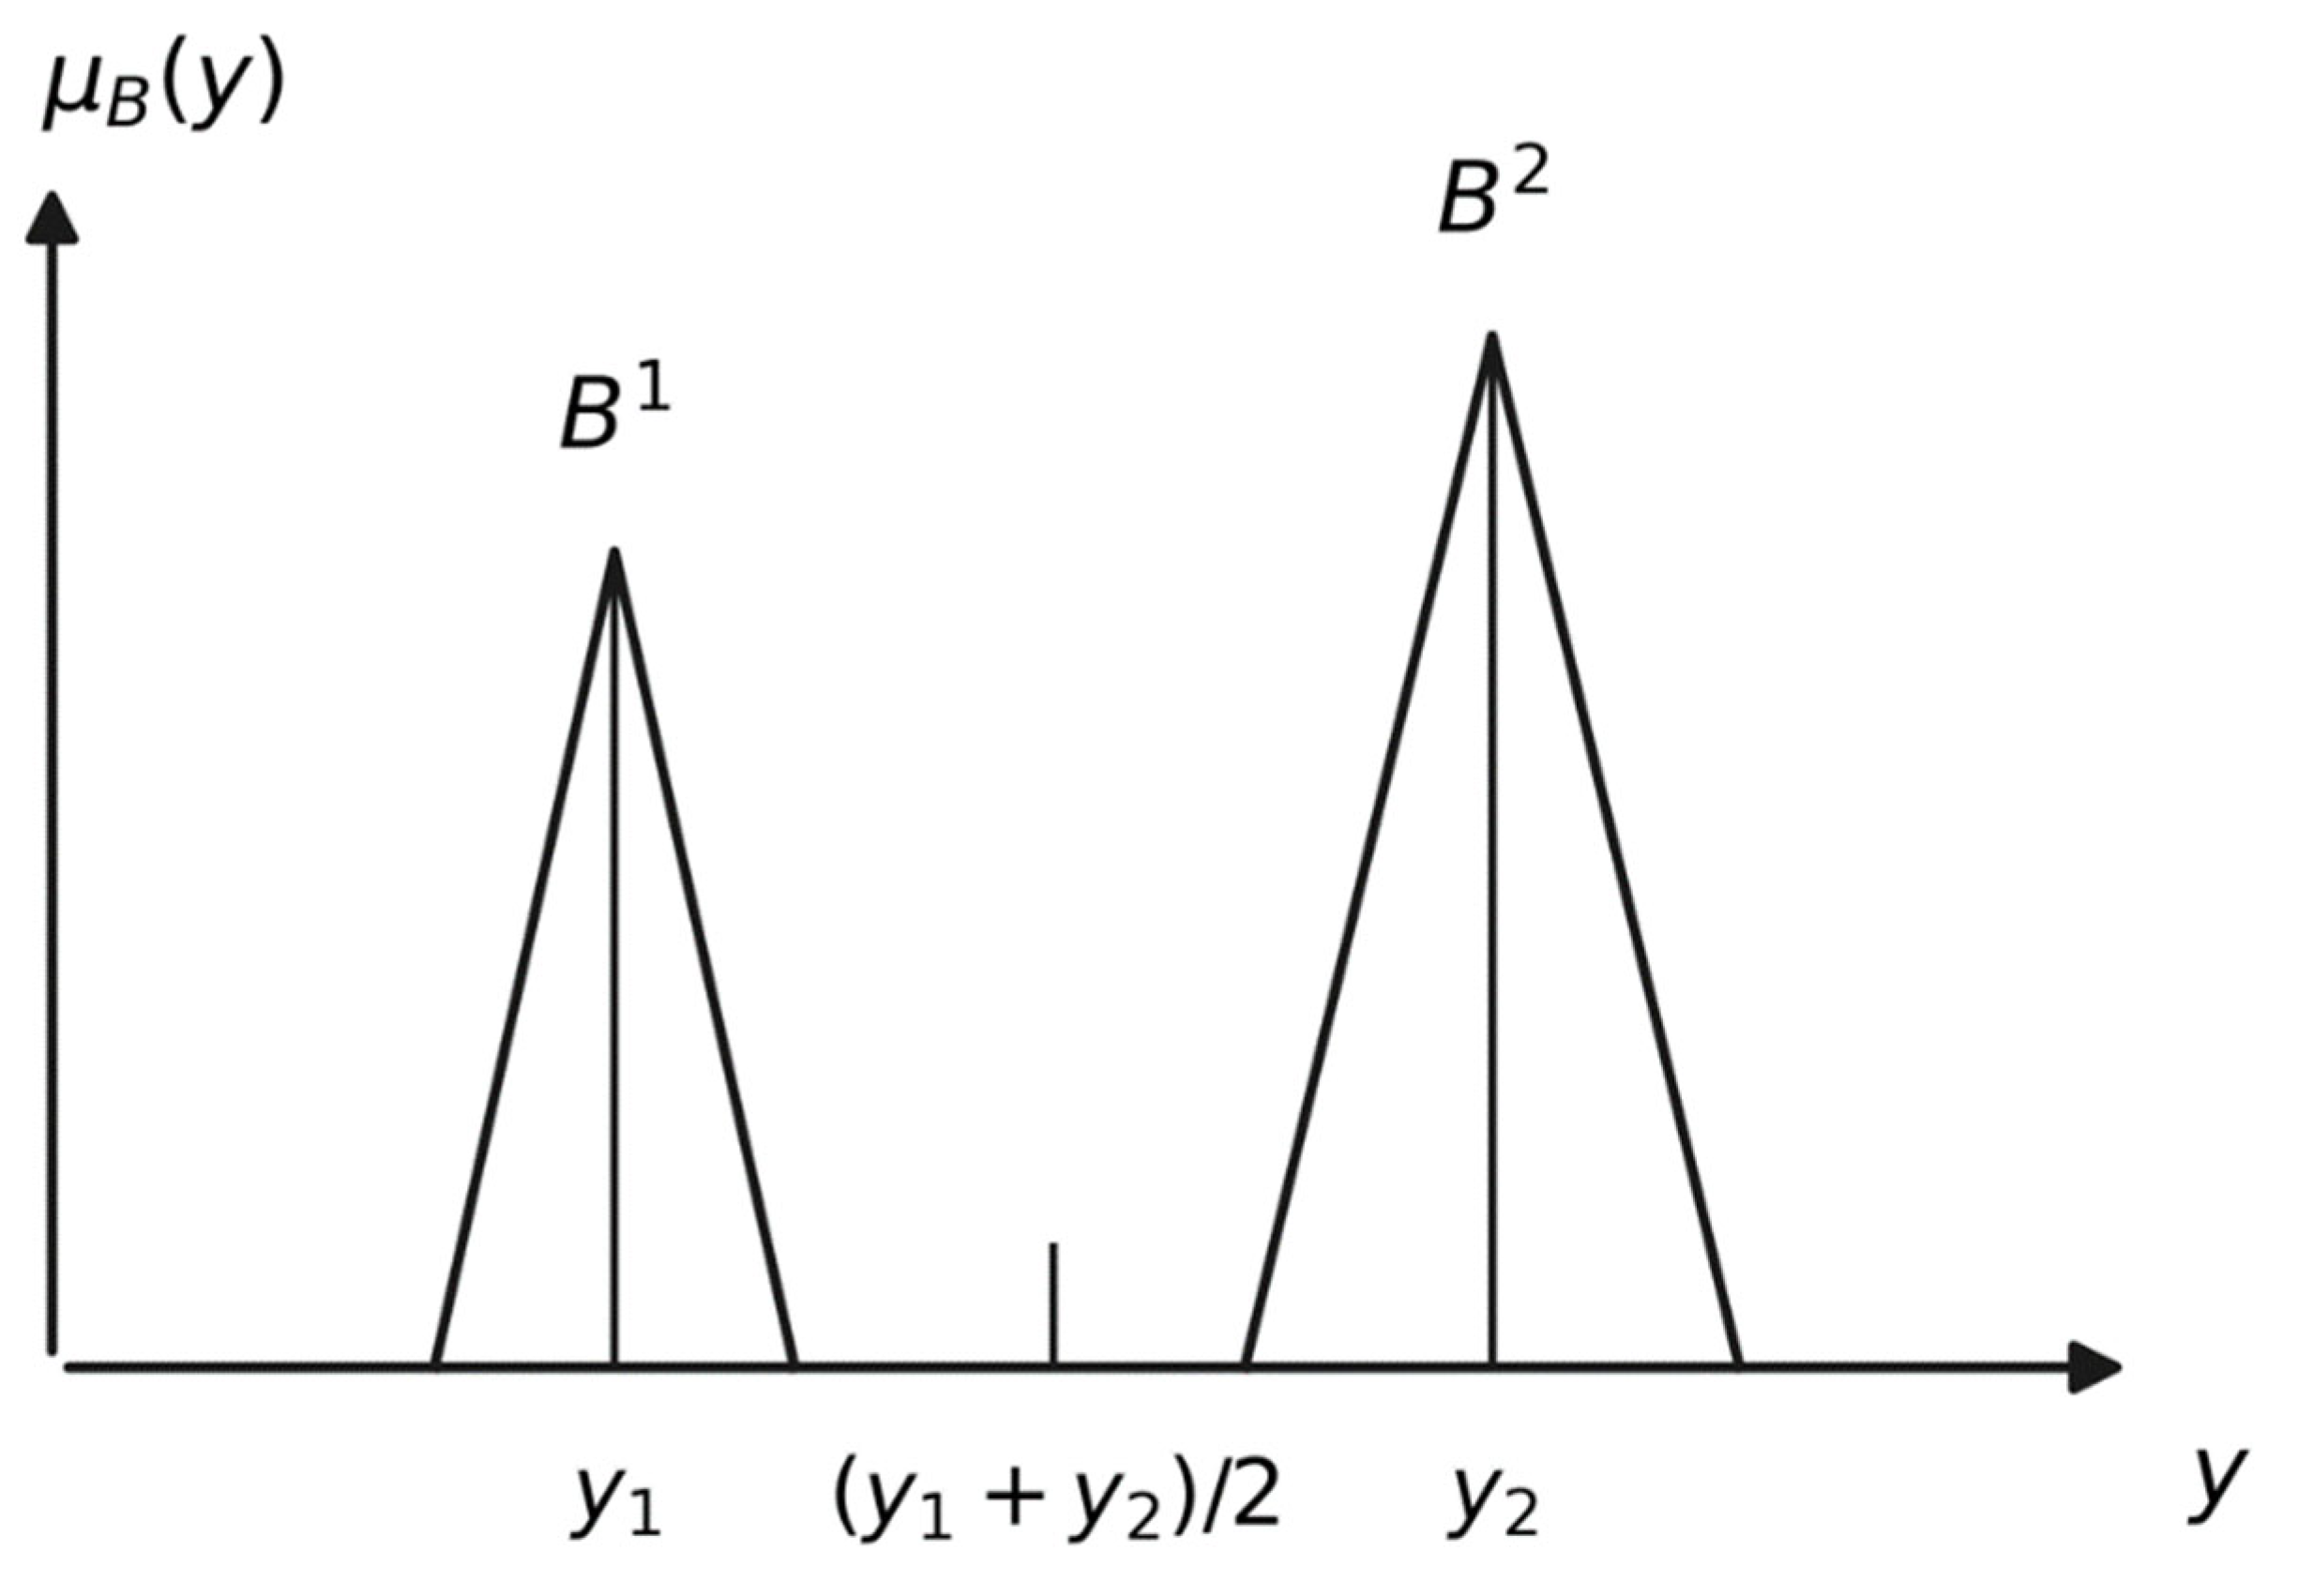
Figure 6.
The fuzzy Logic System of application layer.
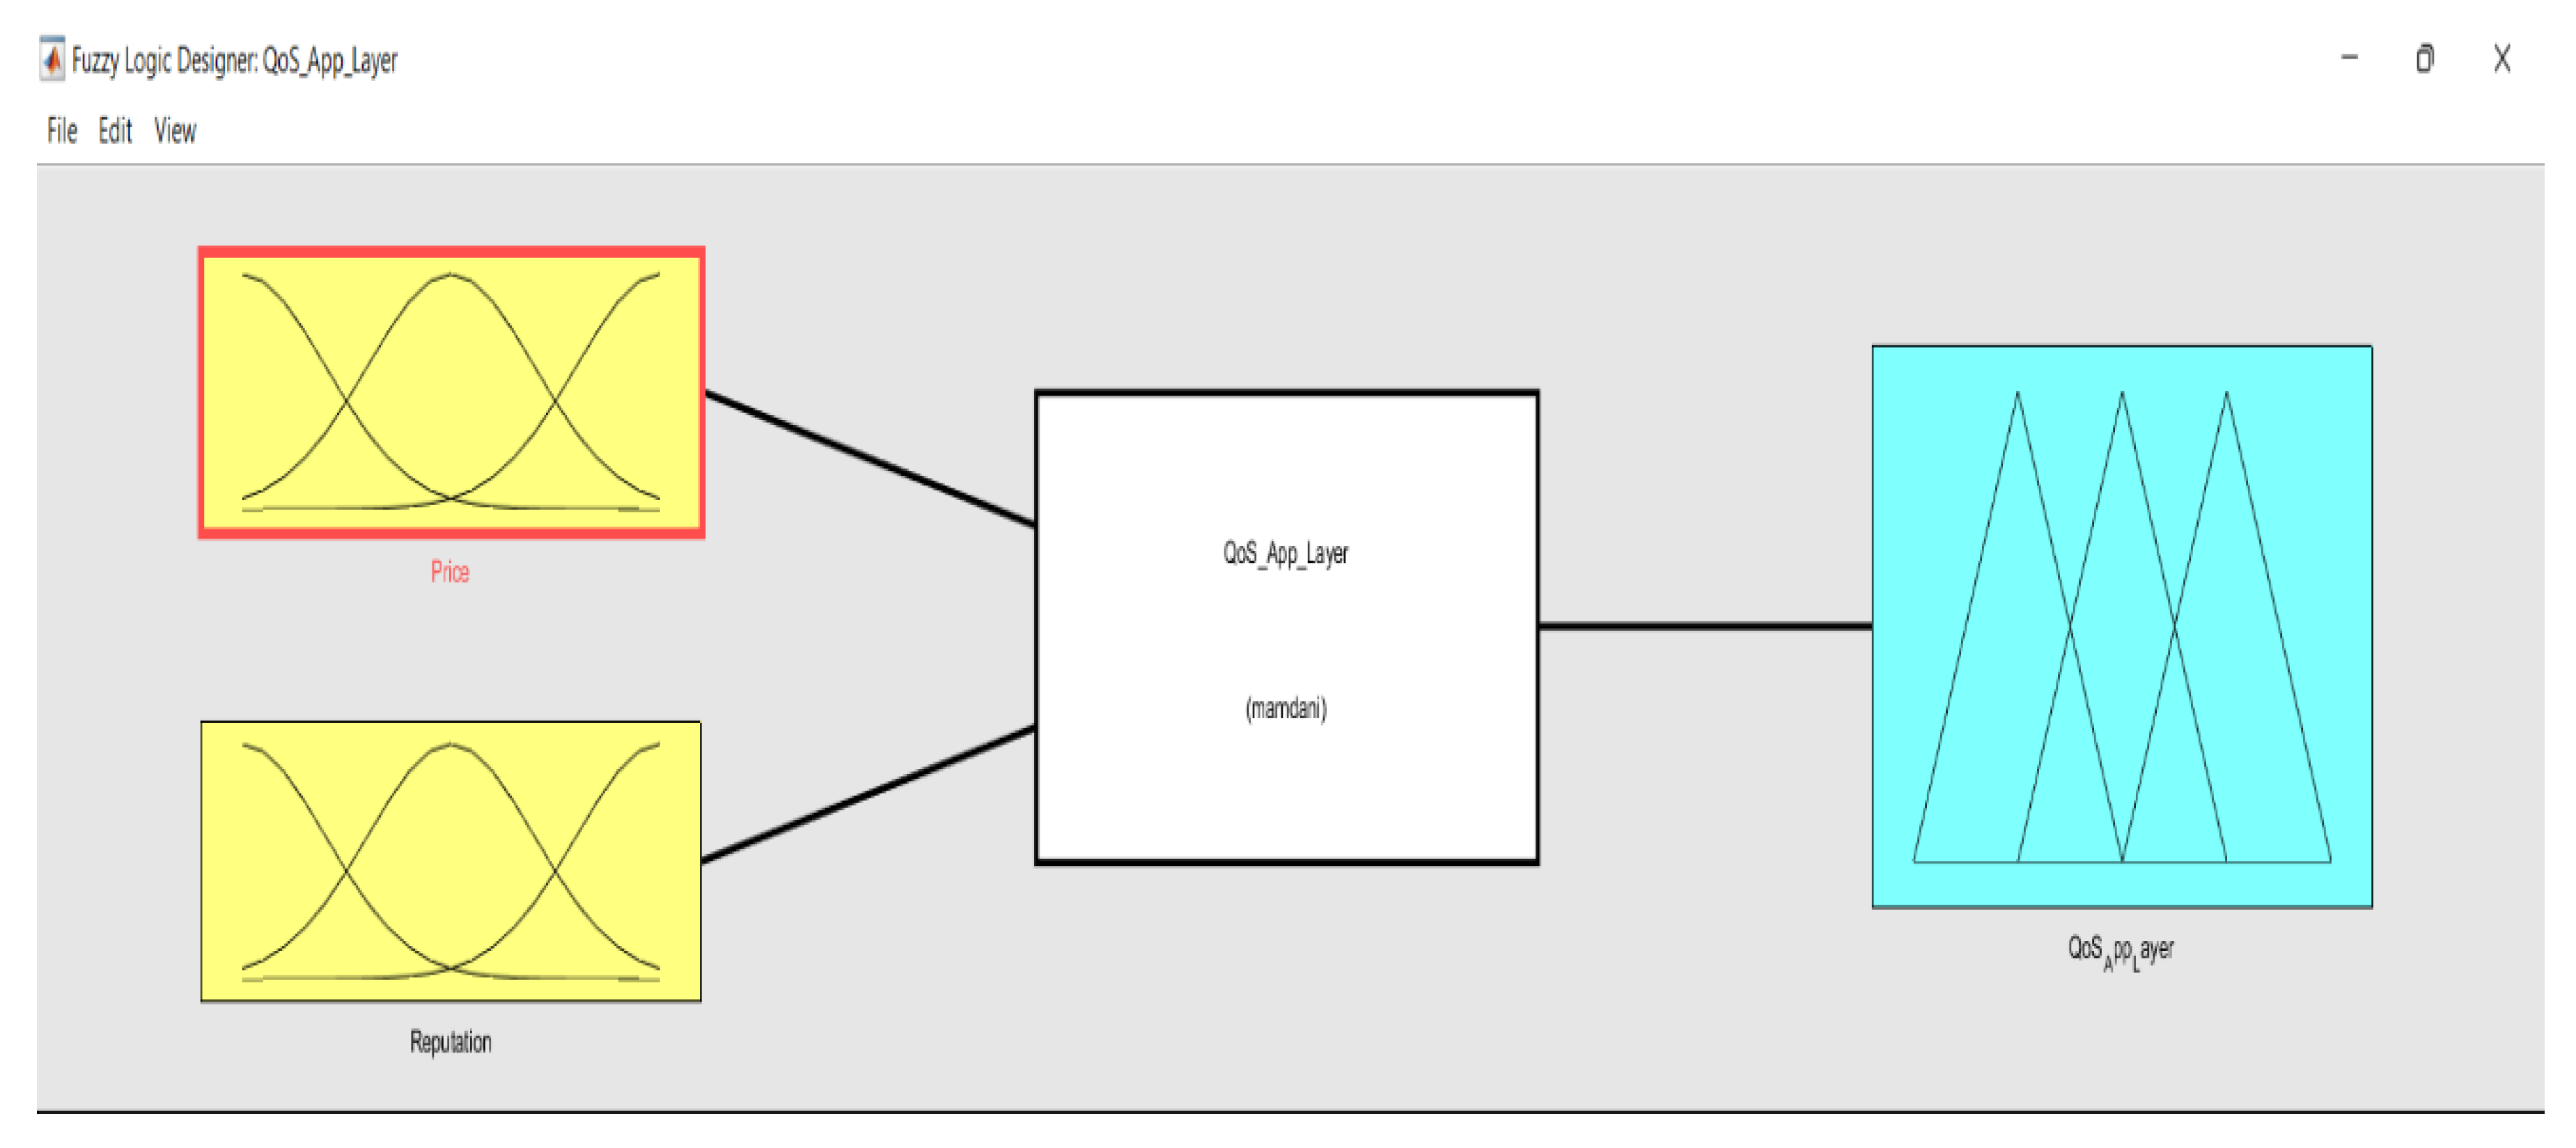
Figure 7.
The fuzzy Logic System of application layer.
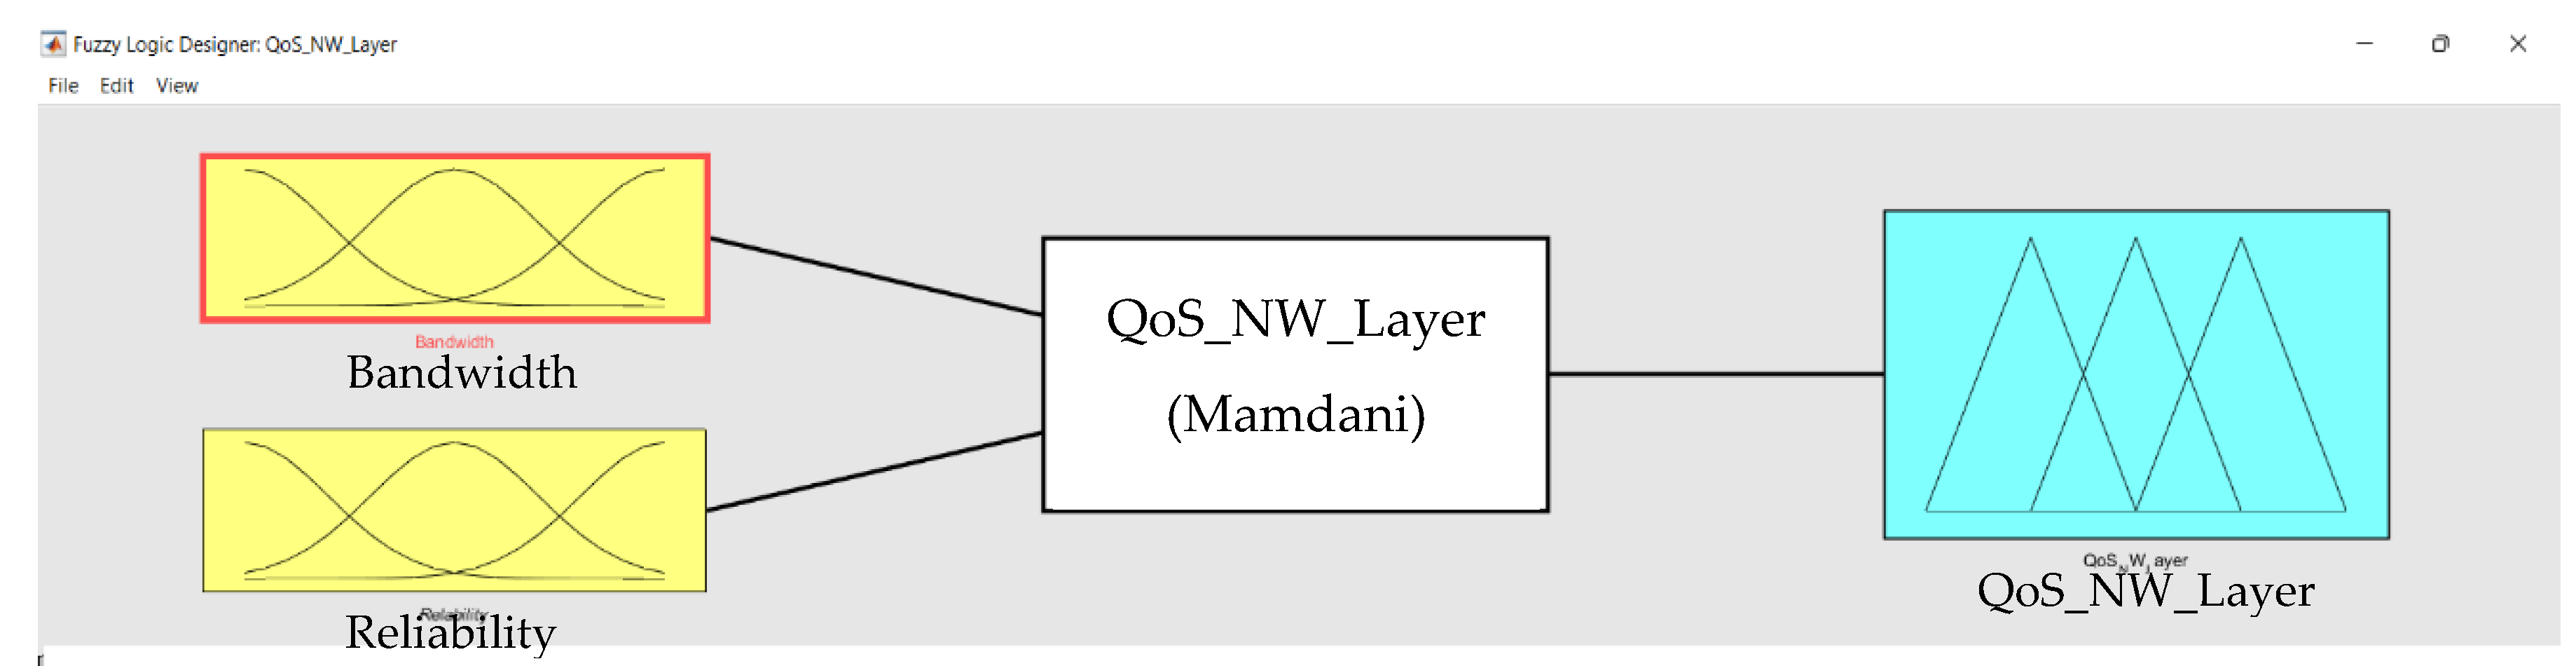
Figure 8.
The fuzzy Logic System of Perception layer.
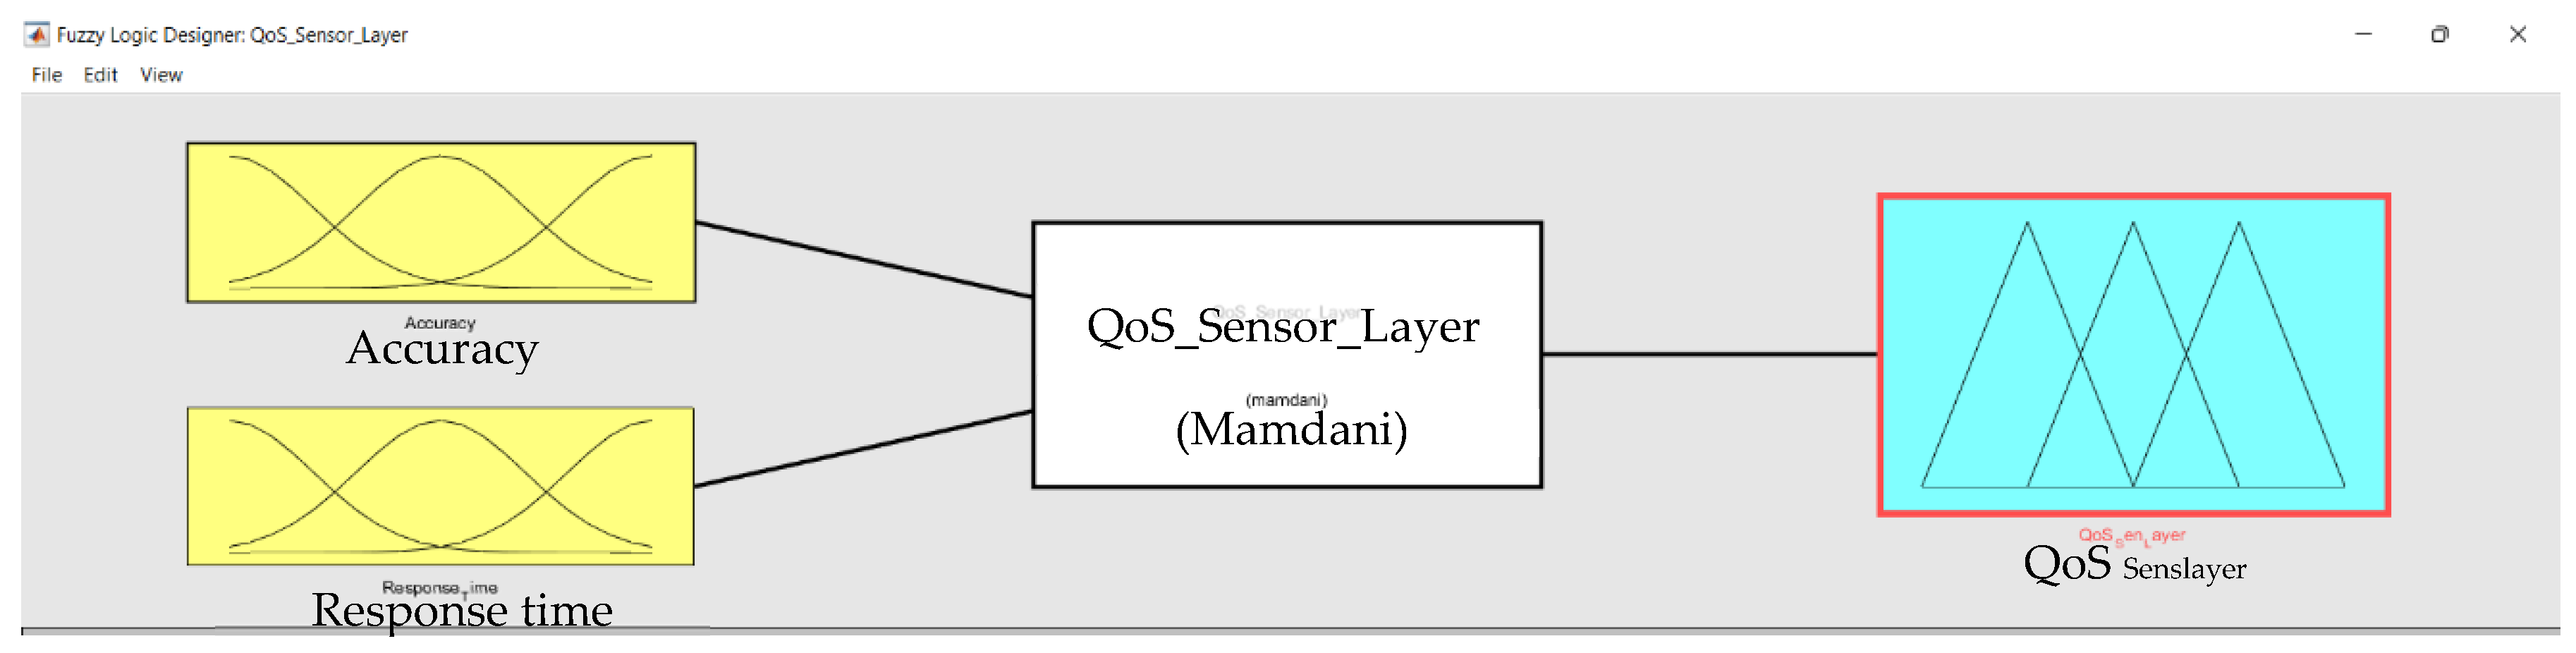
Figure 9.
The Fuzzy Logic Systems for the three layers.
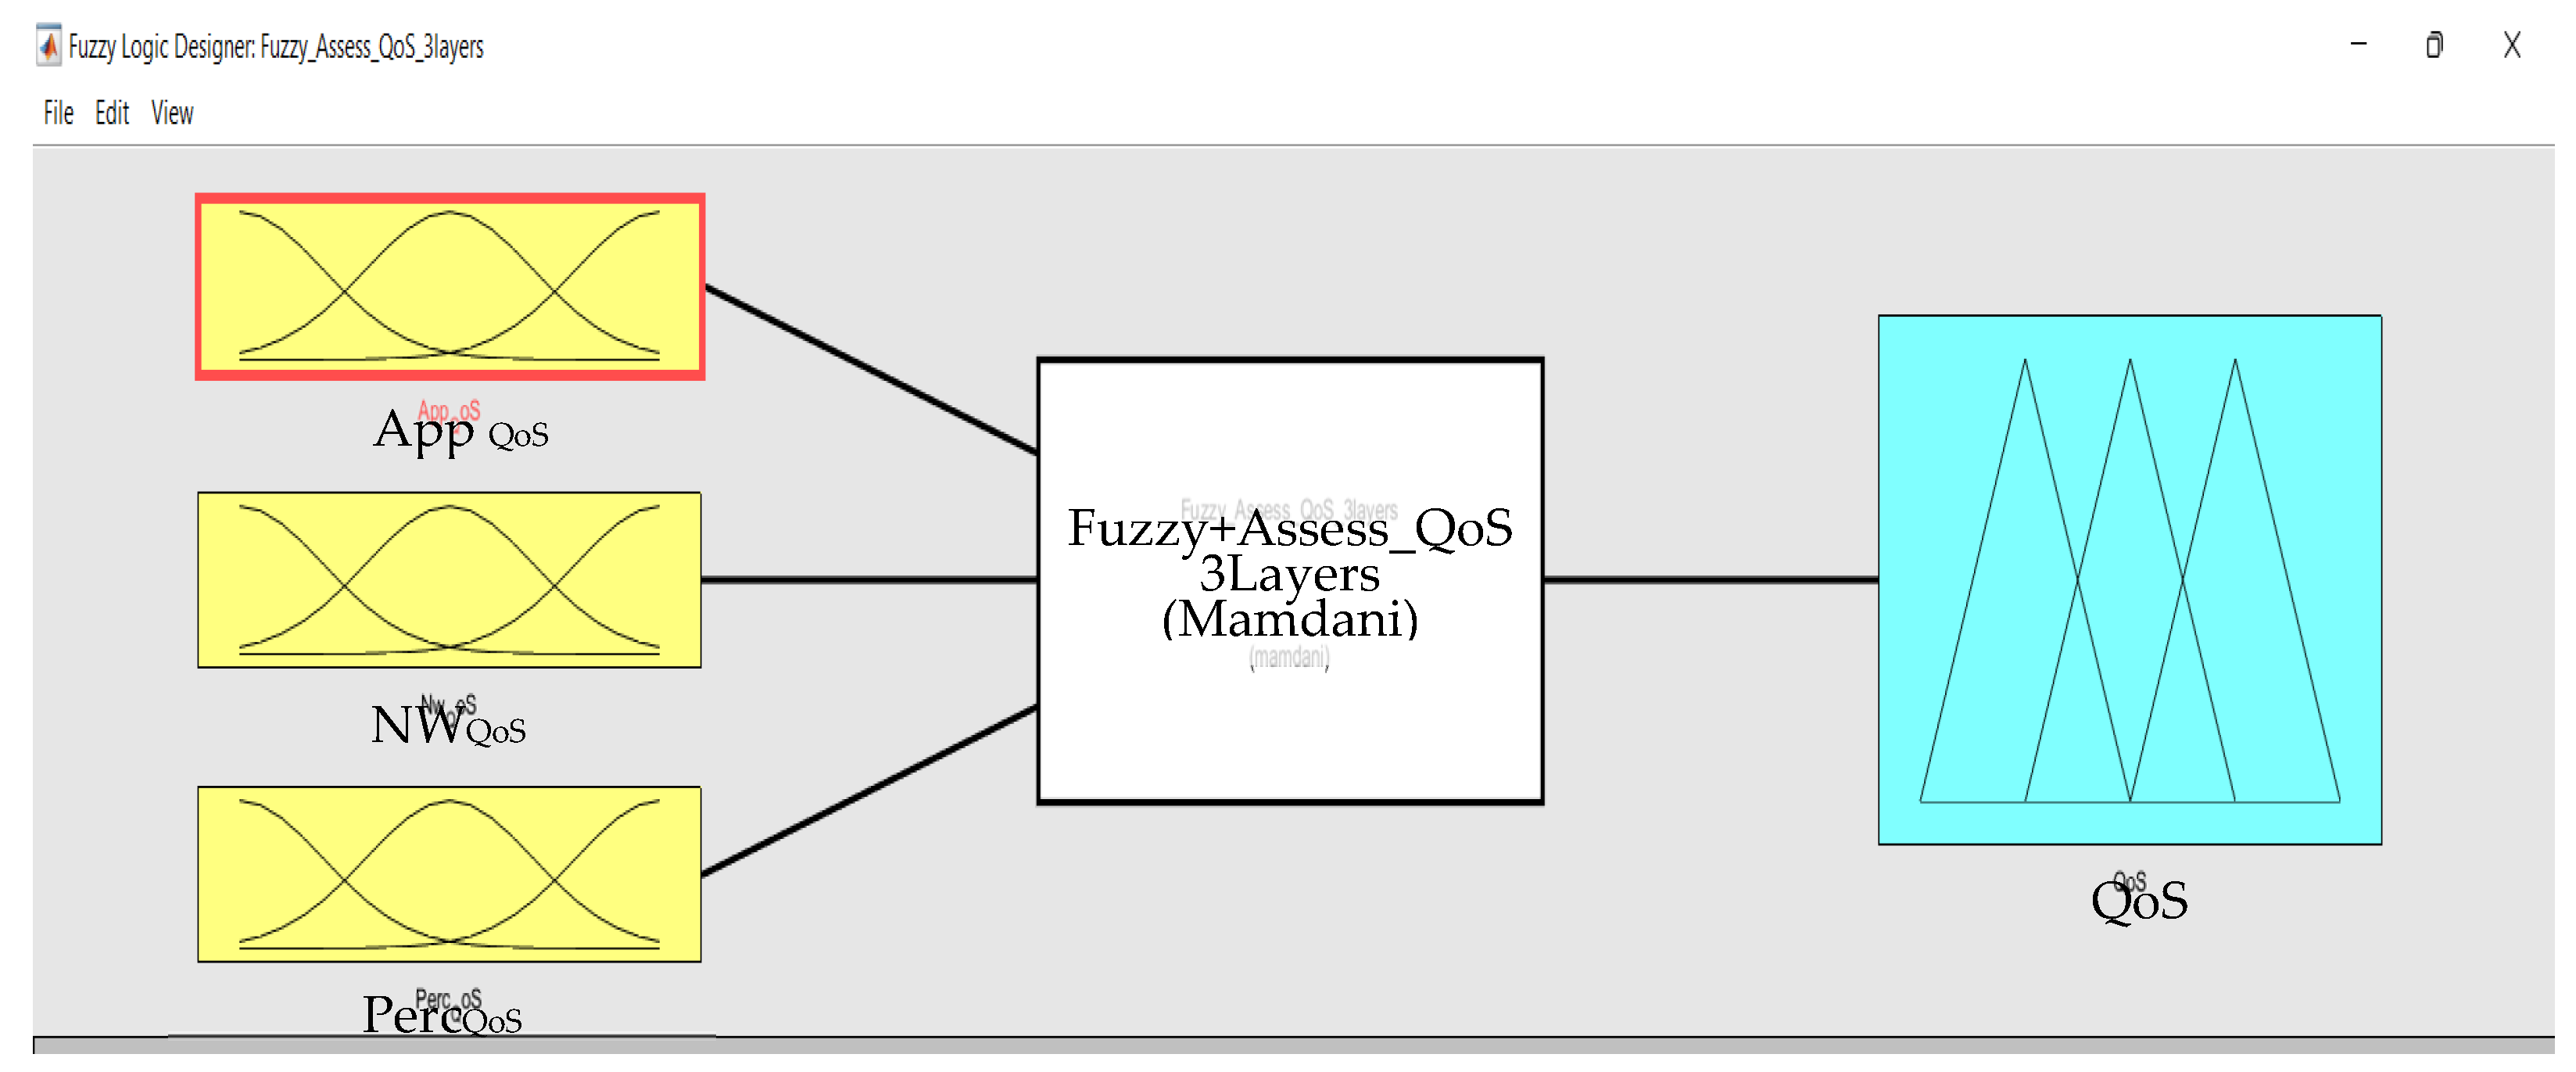
Figure 10.
The comparison of execution time between New Model and AHP-TOPSIS.
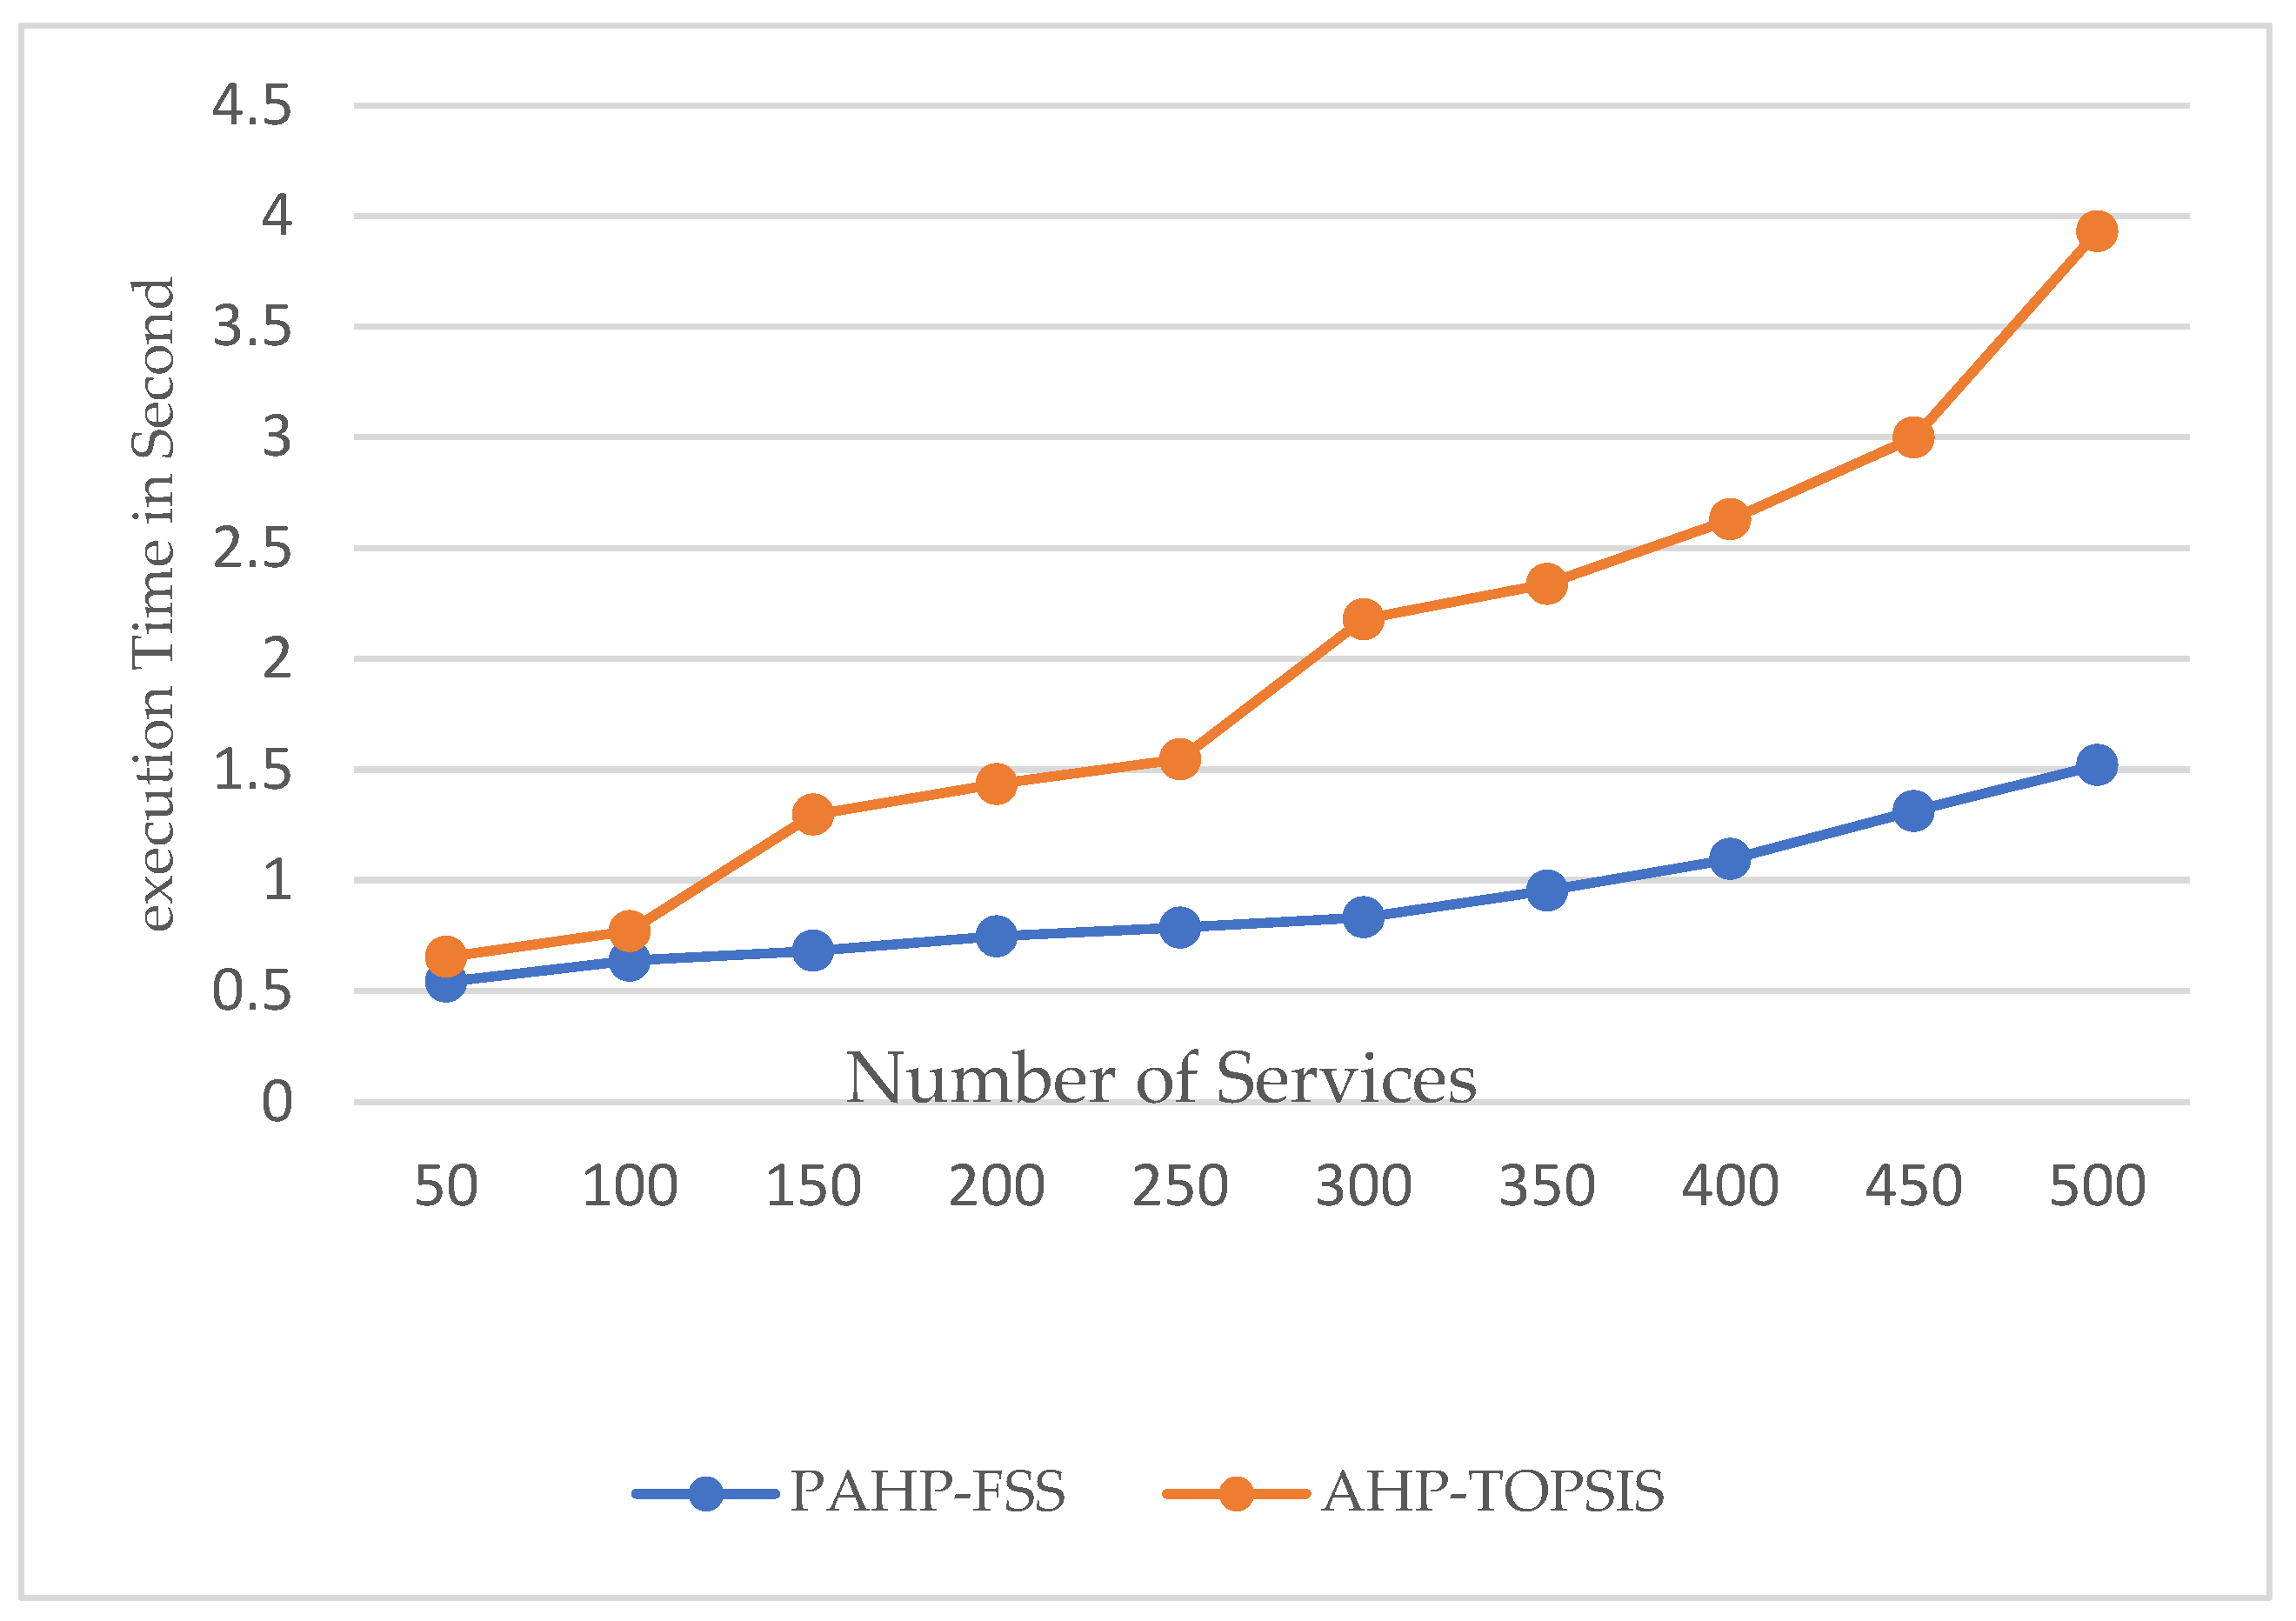
Figure 11.
Sensitivity analysis of the New Model.
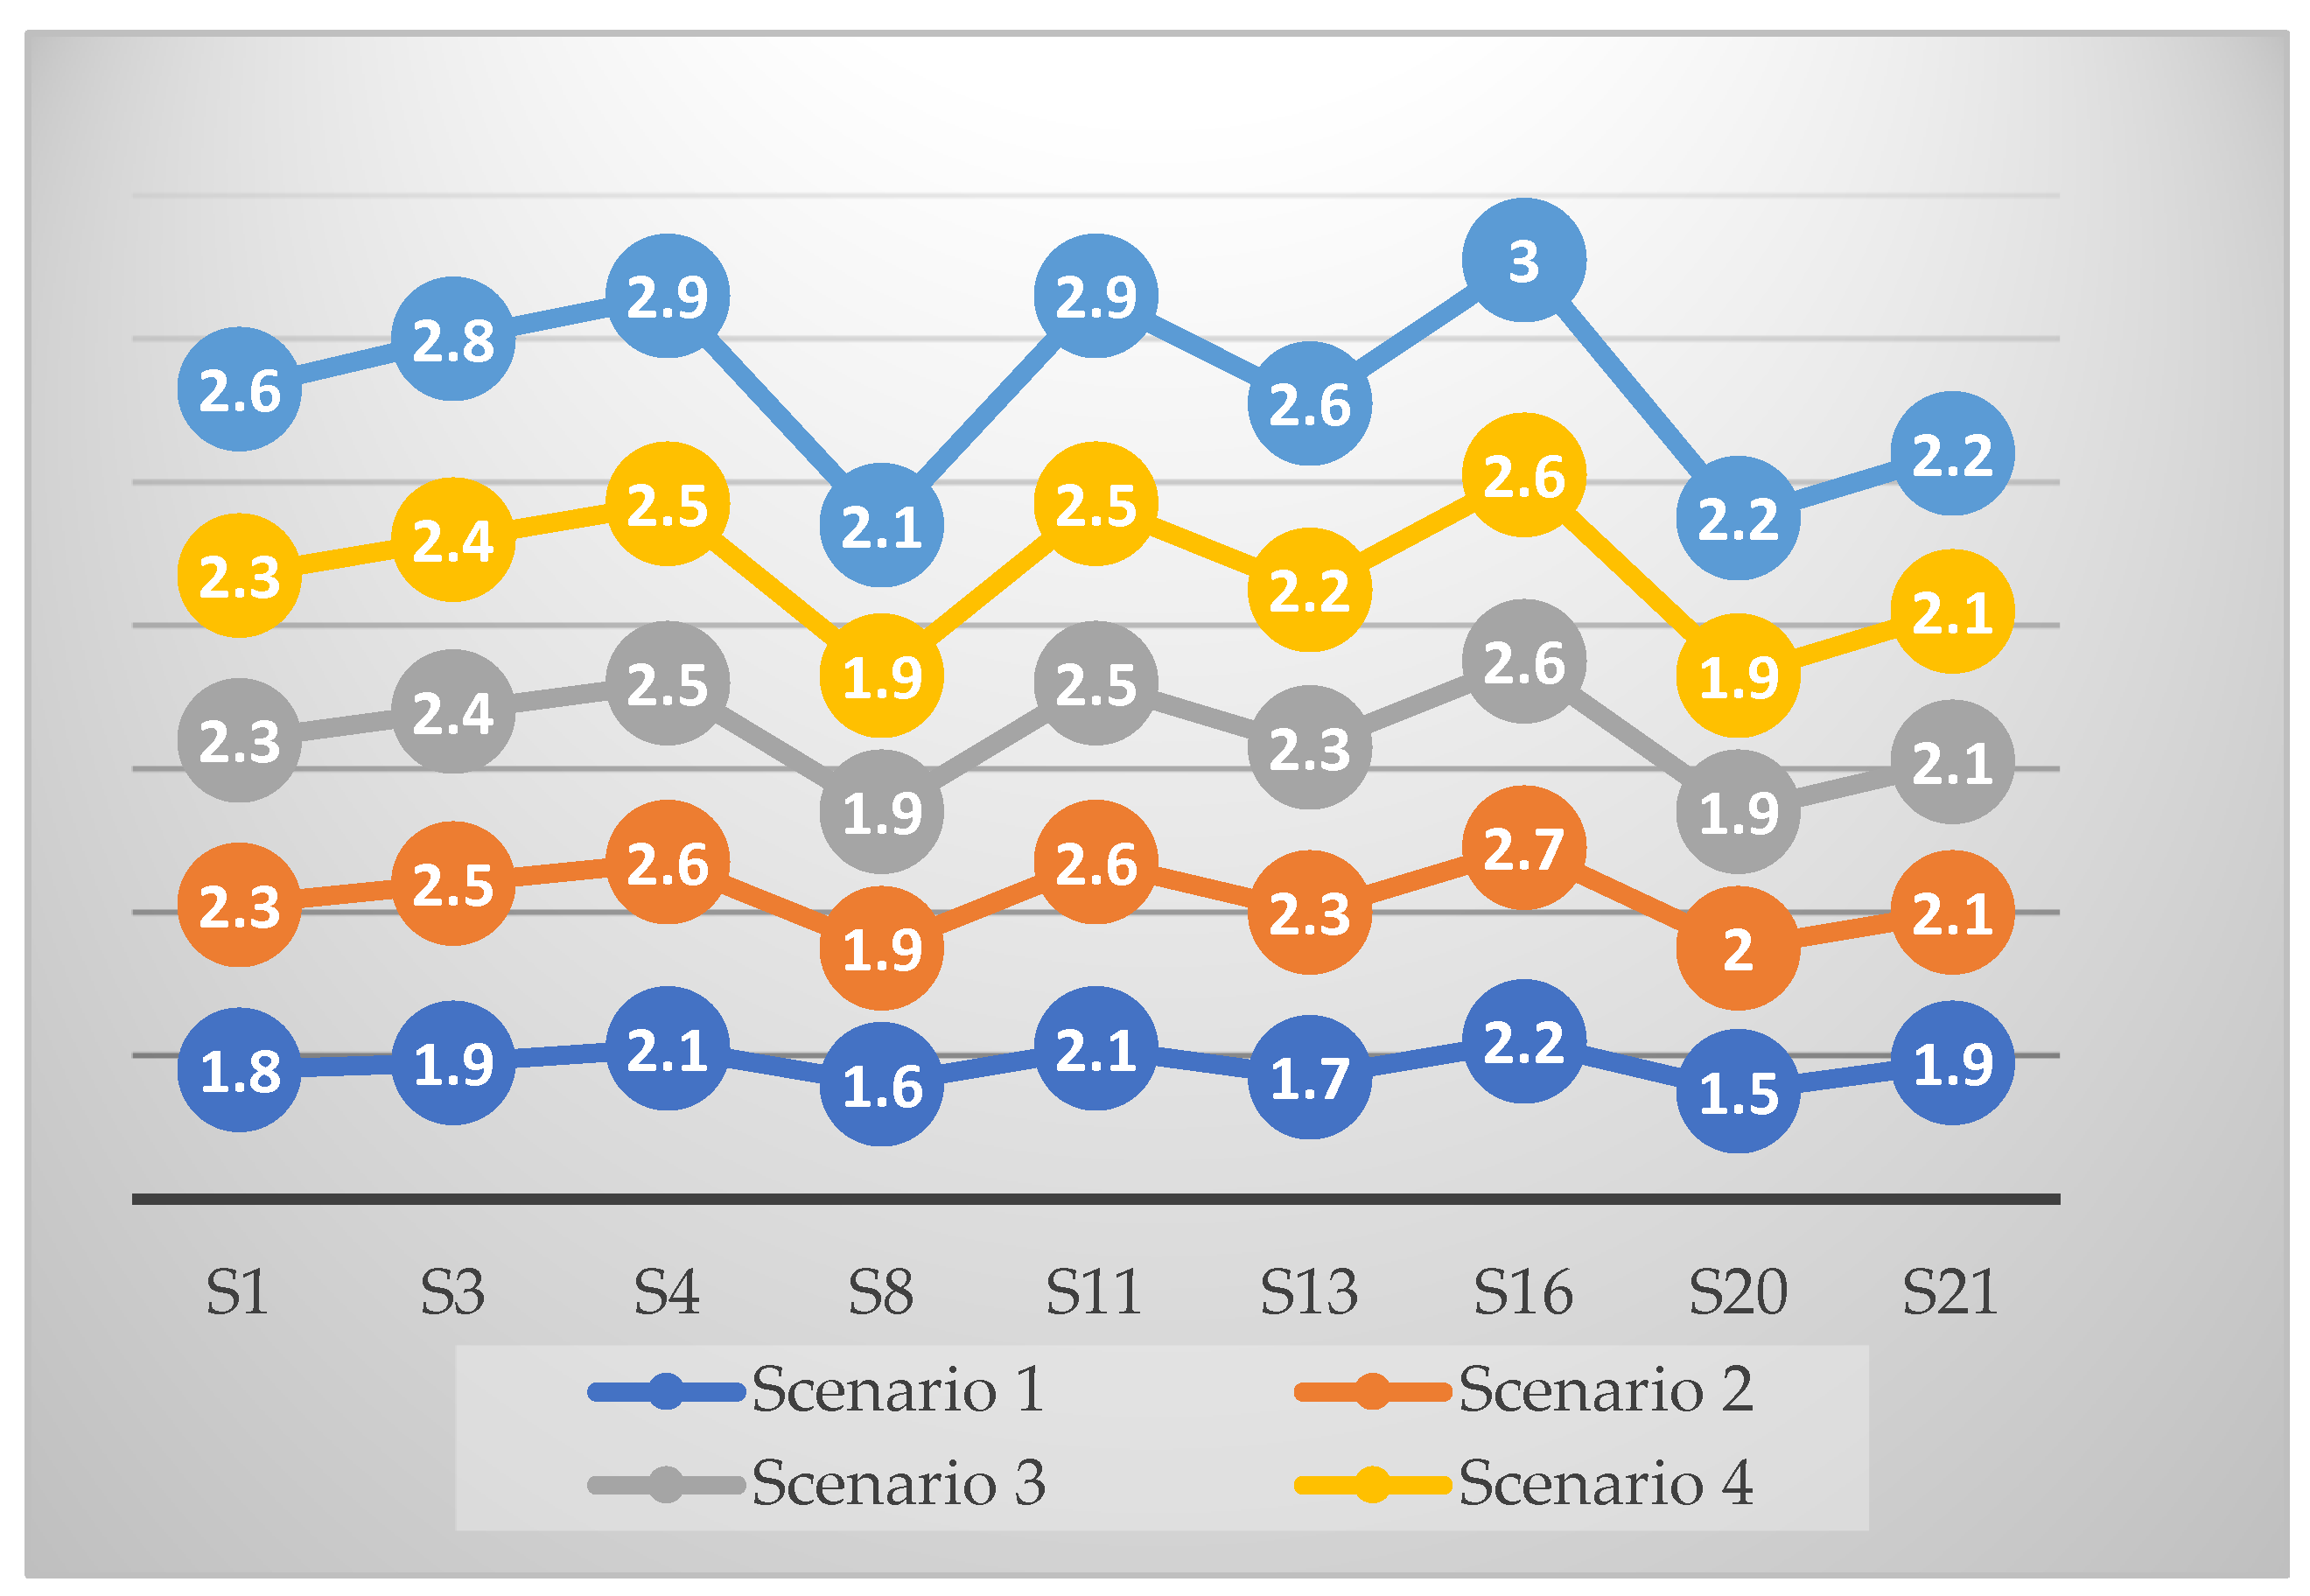
Figure 12.
Sensitivity analysis of the AHP-TOPSIS model.
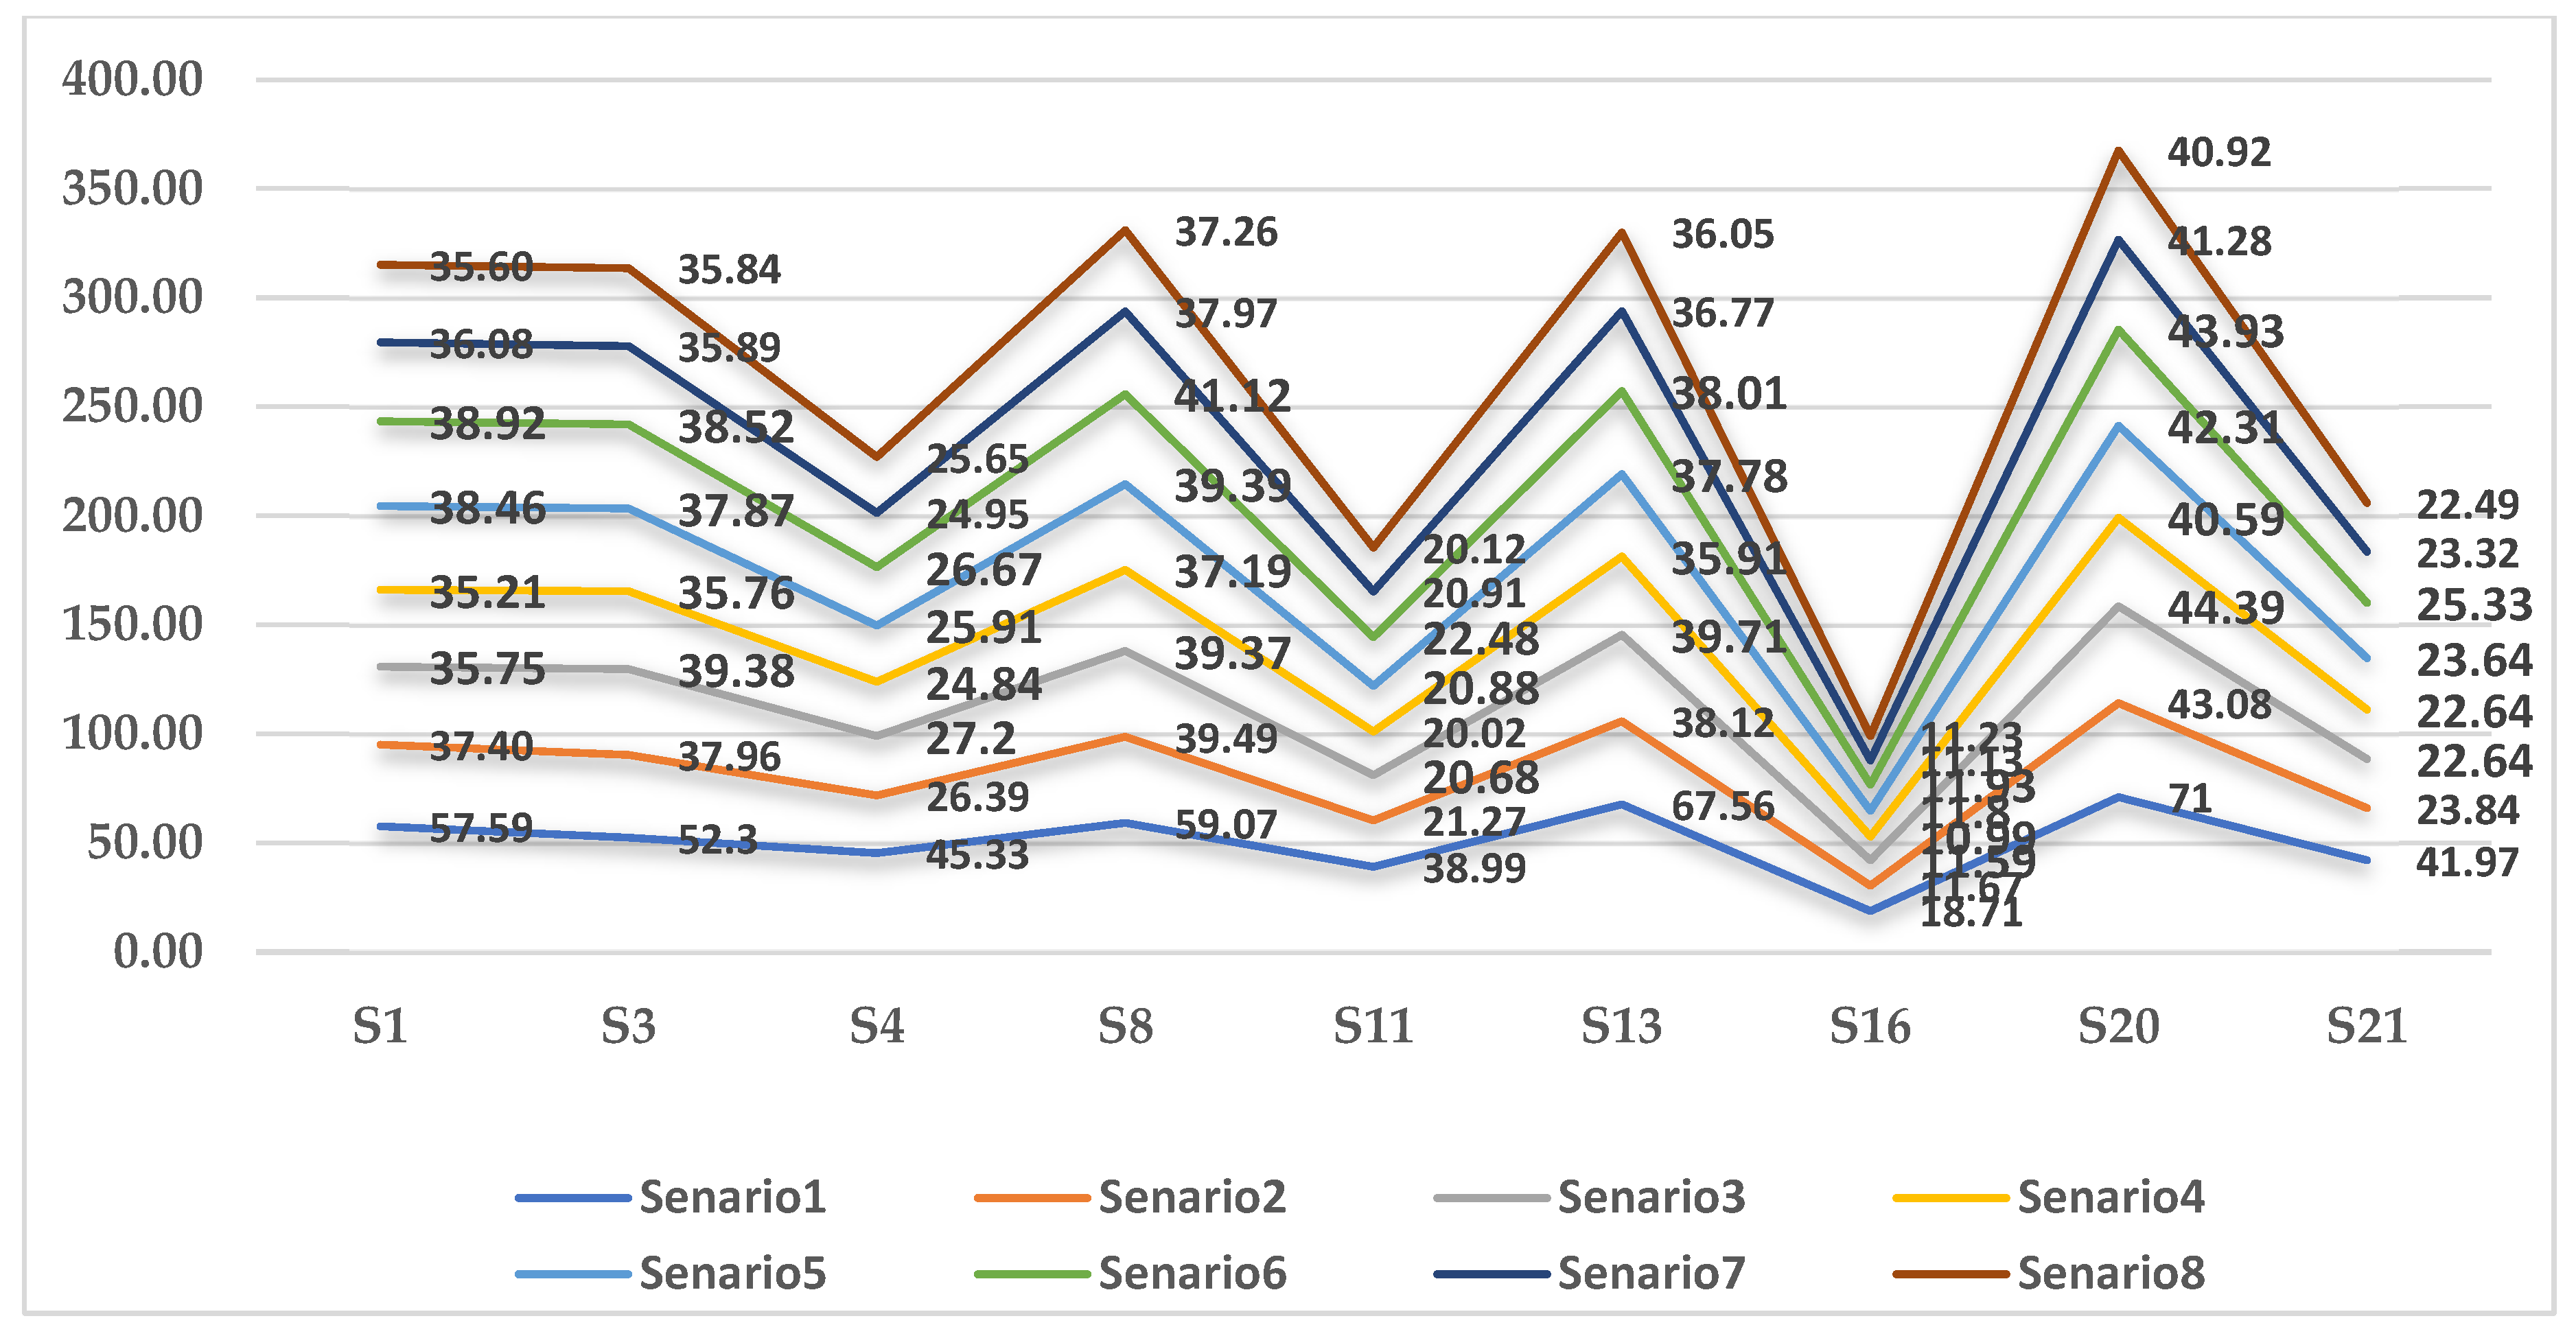
Table 1.
Shows some metrics of the layers.
| Application Layer | Network Layer | Perception Layer |
|---|---|---|
| Availability | Bandwidth | Accuracy |
| Price | Reliability | Price |
| Reputation | Availability | Response Time |
| Reliability | Security | Precision |
| Response Time Constant | ||
| Reliability |
Table 2.
Task-purpose classification rule for determining required QoS level.
| Criticality | Task Purpose Examples | Required QoS Level | Selection Behavior |
| Critical | Scientific/research monitoring; medical/life-safety; industrial safety-of-operation | High | Auto-restrict to High-QoS only |
| Non-critical | Personal/lifestyle convenience; general informational queries | User-selectable | Present all quality tiers |
Table 3.
The Saaty’s Pairwise Comparison Scale.
| Verbal judgment | Numerical |
| Extremely important | 9 |
| 8 | |
| Very Strongly more important | 7 |
| 6 | |
| Strongly more important | 5 |
| 4 | |
| Moderately more important | 3 |
| 2 | |
| Equally important | 1 |
Table 4.
The Pairwise comparison matrix of criteria for selecting IoT service.
| 1 | 3 | 5 | 7 | 8 | |
| Equally important | Moderately more important | Strongly more important | Very Strongly more important | Extremely important | |
| Criteria | App_QoS | Nw_QoS | Perc_QoS | ||
| App_QoS | √ | ||||
| Nw_QoS | √ | ||||
| Perc_QoS | √ |
Table 5.
The pairwise comparison matrix with intensity judgments.
| 5 | 7 | 8 | ||
| Selecting IoT Service | App_QoS | Nw_QoS | Perc_QoS | |
| 5 | App_QoS | 1.0 | 0.50 | 0.33 |
| 7 | Nw_QoS | 2.0 | 1.0 | 1.0 |
| 8 | Perc_QoS | 3.0 | 1.0 | 1.0 |
Table 6.
The column addition.
| criteria | App_QoS | Nw_QoS | Perc_QoS |
| App_QoS | 1.00 | 0.50 | 0.33 |
| Nw_QoS | 2.00 | 1.00 | 1.00 |
| Perc_QoS | 3.00 | 1.00 | 1.00 |
| Sum | 6.00 | 2.50 | 2.33 |
Table 7.
The normalized matrix.
| criteria | App_QoS | Nw_QoS | Perc_QoS | |
| App_QoS | 0.17 | 0.20 | 0.14 | |
| Nw_QoS | 0.33 | 0.40 | 0.43 | |
| Perc_QoS | 0.50 | 0.40 | 0.43 | |
Table 8.
The weight of criteria.
| Criteria | App_QoS | Nw_QoS | Perc_QoS | Weight |
| App_QoS | 0.17 | 0.20 | 0.14 | 0.17 |
| Nw_QoS | 0.33 | 0.40 | 0.43 | 0.39 |
| Perc_QoS | 0.50 | 0.40 | 0.43 | 0.44 |
Table 9.
Consistency Ratio for the criteria comparison matrix.
| QuantityValue | QuantityValue |
| λ_max | 3.015 |
| CI | 0.008 |
| RI (n = 3) | 0.58 |
| CR | 0.013 |
Table 10.
The judgement matrix for ranking IoT services.
| Alternatives | Criteria | ||||
| ………. | |||||
| ………. | |||||
| ………. | |||||
| ………. | |||||
| ………. | |||||
| . | . | . | . | ………. | . |
| . | . | . | . | ………. | . |
| . | . | . | . | ………. | . |
| ………. | |||||
Table 11.
The universe of discourse of inputs of application layer.
| Input Parameters | Fuzzy set | Universe of Discourse |
| Price | Cheap, Medium, Expensive | 0 – 15 |
| Reputation | Low, Medium, High | 0 – 100 |
Table 12.
The universe of discourse of output of application layer.
| Output Parameters | Fuzzy set | Universe of Discourse |
| App_QoS | Low, Medium, High | 0 -10 |
Table 13.
The universe of discourse of inputs of network layer.
| Input Parameters | Fuzzy set | Universe of Discourse |
| Bandwidth | Low, Medium, High | 0-100 |
| Reliability | Low, Medium, High | 0-100 |
Table 14.
The universe of discourse of output of network layer.
| Output Parameters | Fuzzy set | Universe of Discourse |
| QoS_NW | Low, Medium, High | 0 -10 |
Table 15.
The universe of discourse of inputs of perception layer.
| Input Parameters | Fuzzy set | Universe of Discourse |
| Accuracy | Low, Medium, High | 0-100 |
| Response time | Fast, Medium, Slow | 0-1 |
Table 16.
The universe of discourse of output of perception layer.
| Output Parameters | Fuzzy set | Universe of Discourse |
| Perc_QoS | Low, Medium, High | 0-10 |
Table 20.
Universe of Discourse for Inputs for stage two.
| Inputs Parameters | Fuzzy set | Universe of Discourse |
| App_QoS | Low, Medium, High | 0 –10 |
| Nw_QoS | Low, Medium, High | 0 –10 |
| Perc_QoS | Low, Medium, High | 0-10 |
Table 21.
Universe of Discourse for Output for stage two.
| Outputs Parameters | Fuzzy set | Universe of Discourse |
| QoS | Low, Medium, High | 0 –10 |
Table 22.
Sample of results of stage two.
| Service_ID | App _QoS | NW _QoS | Perc_QoS | QoS |
| 1 | 5 | 8.4 | 8.4 | 8.5 |
| 2 | 5 | 5 | 1.1 | 5 |
| 3 | 4.7 | 8.4 | 8.4 | 8.5 |
| 4 | 5 | 8.3 | 1.6 | 5 |
| 5 | 3.2 | 5 | 1.5 | 5 |
| 6 | 5 | 8.5 | 5.1 | 8.5 |
| 7 | 3.2 | 8.5 | 5.1 | 8.5 |
| 8 | 4.1 | 8.3 | 1.4 | 5 |
| 9 | 5 | 1.3 | 5 | 5 |
| 10 | 5 | 8.5 | 5 | 8.5 |
| 11 | 4.4 | 1.2 | 5.1 | 5 |
| 12 | 5 | 6.2 | 5.1 | 5 |
| 13 | 5 | 5.1 | 8.4 | 8.5 |
| 14 | 4.7 | 1.3 | 8.5 | 5 |
| 15 | 5 | 8.5 | 8.4 | 8.5 |
| 16 | 4.6 | 1.3 | 1.2 | 1.5 |
| 17 | 4.4 | 1.3 | 1.4 | 1.5 |
| 18 | 5 | 5 | 8.4 | 8.5 |
| 19 | 5 | 1.3 | 8.4 | 5 |
| 20 | 5 | 8.5 | 8.4 | 8.5 |
| 21 | 7.1 | 8.3 | 5.1 | 8.5 |
| 22 | 5 | 8.4 | 5 | 8.5 |
| 23 | 5 | 1.4 | 1.1 | 1.5 |
| 24 | 5 | 1.4 | 1.5 | 1.5 |
| 25 | 7.2 | 5.1 | 5.1 | 8.5 |
| 26 | 4.3 | 8.4 | 1 | 5 |
| 27 | 4 | 5 | 8.4 | 8.5 |
| 28 | 4.1 | 5 | 5.1 | 5 |
| 29 | 7.1 | 5 | 5.1 | 8.5 |
| 30 | 4.3 | 8.3 | 5.1 | 8.5 |
| 31 | 3.3 | 8.4 | 5.1 | 8.5 |
| 32 | 5 | 1.5 | 0.8 | 1.5 |
| 33 | 3.2 | 8.4 | 8.5 | 8.5 |
| 34 | 5 | 8.4 | 5 | 8.5 |
| 35 | 5 | 1.3 | 5.1 | 5 |
| 36 | 5 | 0.9 | 5.1 | 5 |
| 37 | 7 | 8.3 | 5 | 5 |
| 38 | 3.3 | 5 | 1.4 | 5 |
| 39 | 5 | 8.5 | 5.1 | 8.5 |
| 40 | 5 | 1.2 | 1.1 | 1.5 |
| 41 | 4.5 | 1 | 1.4 | 1.5 |
| 42 | 4 | 1.5 | 8.3 | 5 |
| 43 | 4.5 | 5.1 | 1.3 | 5 |
| 44 | 5 | 1.2 | 5.1 | 5 |
| 45 | 4.1 | 8.4 | 8.5 | 8.5 |
| 46 | 4.6 | 5 | 8.5 | 8.5 |
| 47 | 4.6 | 5.1 | 5.1 | 5 |
| 48 | 3.1 | 1.2 | 8.4 | 5 |
| 49 | 3.3 | 1.4 | 1.1 | 1.5 |
| 50 | 4.2 | 1.2 | 8.4 | 5 |
Table 23.
The results ranking of the low-quality services.
| Index | App_QoS | Nw_QoS | Perc_QoS | QoS | Ranking |
| 1 | 4.6 | 1.3 | 1.2 | 1.5 | 1.8 |
| 2 | 4.4 | 1.3 | 1.4 | 1.5 | 1.9 |
| 3 | 5 | 1.4 | 1.1 | 1.5 | 1.9 |
| 4 | 5 | 1.4 | 1.5 | 1.5 | 2.1 |
| 5 | 5 | 1.5 | 0.8 | 1.5 | 1.8 |
| 6 | 5 | 1.2 | 1.1 | 1.5 | 1.8 |
| 7 | 4.5 | 1 | 1.4 | 1.5 | 1.8 |
| 8 | 3.3 | 1.4 | 1.1 | 1.5 | 1.6 |
| 9 | 4.4 | 1.3 | 1.2 | 1.5 | 1.8 |
| 10 | 5 | 1.5 | 1.1 | 1.5 | 1.9 |
| 11 | 5 | 1.5 | 1.4 | 1.5 | 2.1 |
| 12 | 4.5 | 1.1 | 0.9 | 1.5 | 1.6 |
| 13 | 5 | 0.8 | 1.3 | 1.5 | 1.7 |
| 14 | 3.3 | 1.4 | 1.2 | 1.5 | 1.6 |
| 15 | 4.9 | 1.1 | 1.2 | 1.5 | 1.8 |
| 16 | 5 | 1.7 | 1.5 | 1.5 | 2.2 |
| 17 | 5 | 1.2 | 1.1 | 1.5 | 1.8 |
| 18 | 5 | 1.1 | 1.4 | 1.5 | 1.9 |
| 19 | 3.8 | 1.6 | 1.1 | 1.5 | 1.8 |
| 20 | 4.1 | 0.9 | 1.1 | 1.5 | 1.5 |
| 21 | 3.1 | 1.6 | 1.6 | 1.5 | 1.9 |
Table 24.
The results ranking of the high-quality services.
| Index | App_QoS | Nw_QoS | Perc_QoS | QoS | Ranking |
| 1 | 5 | 8.4 | 8.4 | 8.5 | 7.8 |
| 2 | 4.7 | 8.4 | 8.4 | 8.5 | 7.8 |
| 3 | 5 | 8.5 | 5.1 | 8.5 | 6.4 |
| 4 | 3.2 | 8.5 | 5.1 | 8.5 | 6.1 |
| 5 | 5 | 8.5 | 5 | 8.5 | 6.4 |
| 6 | 5 | 5.1 | 8.4 | 8.5 | 6.5 |
| 7 | 5 | 8.5 | 8.4 | 8.5 | 7.9 |
| 8 | 5 | 5 | 8.4 | 8.5 | 6.5 |
| 9 | 5 | 8.5 | 8.4 | 8.5 | 7.9 |
| 10 | 7.1 | 8.3 | 5.1 | 8.5 | 6.7 |
| 11 | 5 | 8.4 | 5 | 8.5 | 6.3 |
| 12 | 7.2 | 5.1 | 5.1 | 8.5 | 5.5 |
| 13 | 4 | 5 | 8.4 | 8.5 | 6.3 |
| 14 | 7.1 | 5 | 5.1 | 8.5 | 5.4 |
| 15 | 4.3 | 8.3 | 5.1 | 8.5 | 6.2 |
| 16 | 3.3 | 8.4 | 5.1 | 8.5 | 6.1 |
| 17 | 3.2 | 8.4 | 8.5 | 8.5 | 7.6 |
| 18 | 5 | 8.4 | 5 | 8.5 | 6.3 |
| 19 | 5 | 8.5 | 5.1 | 8.5 | 6.4 |
| 20 | 4.1 | 8.4 | 8.5 | 8.5 | 7.7 |
| 21 | 4.6 | 5 | 8.5 | 8.5 | 6.5 |
| 22 | 4.6 | 5 | 8.5 | 8.5 | 6.5 |
| 23 | 5 | 8.3 | 8.4 | 8.5 | 7.8 |
| 24 | 3.6 | 5 | 8.5 | 8.5 | 6.3 |
| 25 | 4.1 | 5 | 8.5 | 8.5 | 6.4 |
| 26 | 4.6 | 5 | 8.4 | 8.5 | 6.4 |
| 27 | 3.6 | 5.1 | 8.4 | 8.5 | 6.3 |
| 28 | 5 | 5 | 8.4 | 8.5 | 6.5 |
| 29 | 3.7 | 8.4 | 8.3 | 8.5 | 7.6 |
| 30 | 3.4 | 8.4 | 5.1 | 8.5 | 6.1 |
| 31 | 3.7 | 8.5 | 5.1 | 8.5 | 6.2 |
| 32 | 5 | 8.3 | 5.1 | 8.5 | 6.3 |
| 33 | 3.2 | 8.4 | 5.1 | 8.5 | 6.1 |
| 34 | 4 | 5 | 8.4 | 8.5 | 6.3 |
| 35 | 3.9 | 5 | 8.4 | 8.5 | 6.3 |
| 36 | 3.5 | 8.5 | 8.4 | 8.5 | 7.6 |
| 37 | 5 | 8.3 | 5.1 | 8.5 | 6.3 |
| 38 | 7.1 | 8.3 | 8.5 | 8.5 | 8.2 |
| 39 | 7.1 | 8.4 | 8.4 | 8.5 | 8.2 |
| 40 | 3.7 | 8.4 | 5.1 | 8.5 | 6.1 |
| 41 | 5 | 5.1 | 8.5 | 8.5 | 6.6 |
| 42 | 4.5 | 5 | 8.4 | 8.5 | 6.4 |
| 43 | 5 | 8.5 | 5.1 | 8.5 | 6.4 |
| 44 | 5 | 5.1 | 8.5 | 8.5 | 6.6 |
| 45 | 4.6 | 8.5 | 5.1 | 8.5 | 6.3 |
| 46 | 4.2 | 8.4 | 5.1 | 8.5 | 6.2 |
| 47 | 5 | 5 | 8.4 | 8.5 | 6.5 |
| 48 | 5 | 5 | 8.3 | 8.5 | 6.5 |
| 49 | 5 | 8.4 | 8.4 | 8.5 | 7.8 |
| 50 | 3.3 | 5.1 | 8.5 | 8.5 | 6.3 |
| 51 | 3.6 | 8.4 | 5 | 8.5 | 6.1 |
| 52 | 5 | 5 | 8.4 | 8.5 | 6.5 |
| 53 | 5 | 8.3 | 8.4 | 8.5 | 7.8 |
| 54 | 5 | 5 | 8.5 | 8.5 | 6.5 |
| 55 | 3.8 | 8.5 | 8.4 | 8.5 | 7.7 |
| 56 | 4.2 | 8.3 | 8.5 | 8.5 | 7.7 |
| 57 | 5 | 8.5 | 5 | 8.5 | 6.4 |
| 58 | 5 | 5 | 8.4 | 8.5 | 6.5 |
| 59 | 7.1 | 8.5 | 8.5 | 8.5 | 8.3 |
| 60 | 7.1 | 8.4 | 8.4 | 8.5 | 8.2 |
| 61 | 4.2 | 8.4 | 8.4 | 8.5 | 7.7 |
| 62 | 3.3 | 8.4 | 5.1 | 8.5 | 6.1 |
| 63 | 5 | 8.5 | 8.4 | 8.5 | 7.9 |
| 64 | 4.7 | 8.5 | 8.5 | 8.5 | 7.9 |
| 65 | 4.7 | 8.5 | 8.4 | 8.5 | 7.8 |
| 66 | 4.5 | 5 | 8.4 | 8.5 | 6.4 |
| 67 | 5 | 5 | 8.5 | 8.5 | 6.5 |
Disclaimer/Publisher’s Note: The statements, opinions and data contained in all publications are solely those of the individual author(s) and contributor(s) and not of MDPI and/or the editor(s). MDPI and/or the editor(s) disclaim responsibility for any injury to people or property resulting from any ideas, methods, instructions or products referred to in the content. |
© 2026 by the authors. Licensee MDPI, Basel, Switzerland. This article is an open access article distributed under the terms and conditions of the Creative Commons Attribution (CC BY) license (http://creativecommons.org/licenses/by/4.0/).
Copyright: This open access article is published under a Creative Commons CC BY 4.0 license, which permit the free download, distribution, and reuse, provided that the author and preprint are cited in any reuse.