

Submitted:
20 August 2026
Posted:
21 August 2026
You are already at the latest version
Abstract
Against the backdrop of frequent external shocks and intertwined agricultural production risks, enhancing the resilience of the agricultural industry chain has become crucial for ensuring food security and promoting sustainable agricultural development. As a key national grain-producing province, Anhui Province’s level of agricultural industry chain resilience directly impacts the stability of agricultural product supply at both the regional and national levels. To elucidate the transmission pathways through which the digital technologies influence the resilience of agricultural industrial chains and to investigate the regional heterogeneity of the digital technology’s enabling effects, this study utilizes the panel data from 16 prefecture-level cities in Anhui Province spanning the period 2015-2024 as a sample, this study constructs an indicator system for agricultural industry chain resilience and an indicator system for digital technologies. By employing a two-way fixed-effects model, a mediation effect model, and a panel threshold regression model, this study empirically examines the direct impact of digital technologies on the resilience of Anhui’s agricultural industry chain, the mediating transmission mechanism through agricultural technological progress, regional heterogeneity characteristics, and the threshold effect based on agricultural production risks. The study reveals the following findings: First, the digital technologies exert a significant and robust positive influence on the resilience of agricultural industrial chains in Anhui Province. Second, the agricultural technological progress serves as a key mediating pathway through which the digital technologies enhance the resilience. Third, the impact of digital technologies exhibits pronounced regional heterogeneity. Fourth, the effect of digital technologies on agricultural industrial chain resilience demonstrates a single-threshold effect based on agricultural production risks. Accordingly, this study proposes the targeted policy implications, including further embedding the digital technology into the entire agricultural industrial chain, strengthening the mediating driving effect of agricultural technological progress, implementing the differentiated digital agricultural policies across regions, and prioritizing the grain yield improvement in low-productivity areas. This research provides the solid theoretical and empirical evidence for Anhui and other major agricultural provinces to promote the high-quality digital rural development.
Keywords:
digital technology
; agricultural industrial chain resilience
; agricultural technological progress
; agricultural production risk
; threshold effect
1. Introduction
1.1. Research Background
The agricultural industrial chain encompasses the production, processing, circulation, consumption and other interlinked segments with the extensive coverage and tightly connected nodes. Once hit by the external shocks, the adverse impacts will propagate rapidly along the whole chain. In recent years, the frequent global climate anomalies and the volatile foreign trade policies have aggravated the inherent vulnerability of the agricultural industrial chains. As a pivotal grain-producing province in China, Anhui Province registered a total grain output of 83.86 billion jin in 2025. Its agricultural sector currently suffers from the coexistence of multiple risks: the natural disasters including droughts, floods and crop pests break out frequently, while the prices of agricultural production materials and farm products fluctuate drastically. Against this backdrop, it has become an urgent task to strengthen agricultural industrial chains’ capacity to resist external disruptions, recover operational functions post-shock, and realize industrial transformation and upgrading.
In recent years, the national government has successively introduced the policies to promote the deep integration of the digital technologies with the agriculture. The 14th Five-Year Plan for the Digital Economy Development designated the smart agriculture as a priority project, and four central ministries and commissions jointly issued the Key Guidelines for Digital Rural Development 2025 in 2025. Following the national strategic arrangements, Anhui Province promulgated the Action Plan for Digital Rural Development of Anhui Province (2022–2025) and the 14th Five-Year Plan for Agricultural and Rural Modernization of Anhui Province, promoting the full coverage of the rural broadband, the rural e-commerce penetration, and the deployment of agricultural Internet of Things. Data shows that Anhui Province’s Digital Technology Application Index surged from 0.086 in 2015 to 0.762 in 2025; rural broadband penetration rate increased from 24.2% to 38.7%, and rural e-commerce transaction volume grew from 8.7 billion yuan to 150 billion yuan.
In this context, studying the impact of the digital technologies on the resilience of agricultural industrial chains in Anhui Province can provide both theoretical support and empirical references for Anhui Province and other major agricultural provinces to advance their digital rural strategies, optimize their agricultural policy frameworks, and enhance the risk-resilience capacity of their agricultural industrial chains.
1.2. Potential Marginal Contributions
The first objective is to construct a comprehensive evaluation index system for the agricultural industry chain resilience and the application of digital technologies. Second, this study aims to reveal the transmission pathway through which the digital technologies influence the resilience of the agricultural industry chains. Third, this study investigates the regional heterogeneity in the empowerment effects of digital technologies. By comparing the differences in the impact of digital technologies across the three geographical regions-Northern Anhui, Central Anhui, and Southern Anhui-as well as across the different grain yield levels. Fourth, identify the nonlinear characteristics of the digital technology’s impact on the resilience of agricultural industrial chains.
1.3. Potential Marginal Contributions
First, this paper elaborates on the mediating transmission path of “digital technology→agricultural technological progress→agricultural industrial chain resilience”. By incorporating the agricultural technological progress as a mediating variable into an integrated analytical framework, it validates the internal logic that the digital technologies indirectly boost the industrial chain resilience by facilitating the agricultural mechanization and the agricultural knowledge spillover.
Second, it identifies a single threshold effect contingent on the grain yield per unit area index, which measures the agricultural production risks. The analysis confirms a unique threshold value and articulates the regime shift rule where the digital technologies transition from statistically insignificant to significantly positive drivers of the resilience.
Third, this study refines the conventional coarse classification paradigm for the regional heterogeneity analysis. It carries out a granular empirical comparisons across the Northern, Central and Southern Anhui, revealing the gradient disparities in the digital empowerment effects. The results deliver the precise micro-geographic evidence to support differentiated agricultural policy design at the provincial level.
1.4. Literature Review
(1) Connotation and Measurement of the Agricultural Industrial Chain Resilience
The concept of resilience originates from ecology. Holling [1] first defined it as an ecosystem’s capacity to absorb disturbances while could maintaining the stable operational states. Reggiani et al. [2] introduced the resilience into the economics, framing it as an economic system’s evolutionary capacity to revert to its original equilibrium following the disruptive shocks. Within the agricultural domain, the Food and Agriculture Organization (FAO) defines the agri-food system resilience as the capacity of food systems to secure the long-term access to sufficient, safe and nutritious food for all populations and sustain the livelihoods of the agricultural practitioners amid the diverse disruptions [3].
The extant scholarship has yielded rich discussions regarding the definition and quantification of the agricultural industrial chain resilience. Most scholars define it as the agricultural chains’ integrated capacity to withstand risks, restore the operational functions and pursue transformative development when confronted with internal and external shocks [4,5]. There are two mainstream measurement approaches prevail in the existing research. The first adopts a one-dimensional proxy, such as the deviation degree of the total output across farming, forestry, animal husbandry and fishery sectors to gauge agricultural resilience [6]. The second relies on the multi-dimensional comprehensive evaluation, constructing indicator systems covering risk resistance, adaptive recovery and structural reconstruction capacities [5,7]. Li J et al. [8] further measured the resilience of China’s agricultural industrial and supply chains along three dimensions: resistance, recoverability and transformative capacity.
(2) Digital Technologies and Agricultural Development
Existing research generally holds that the digital technologies could enhance the agricultural productivity by improving the information transparency, reducing the transaction costs, and optimizing the resource allocation [9,10]. Specifically, the rural e-commerce broadens the marketing channels for the agricultural commodities [11]. The digital inclusive finance could alleviates farmers’ financing constraints [12]. Agricultural IoT enables the precision farming and real-time disaster early warning [13]. Drawing on the prefecture-level panel data from China, Zheng J-L & Zhang Y-L [14] empirically demonstrate that the digital technology adoption significantly elevates the agricultural industrial chain resilience.
Furthermore, the linkage between the digital technologies and the agricultural performance is not a simple linear relationship. Peng D-Y [15] identifies an inverted U-shaped correlation between the digital inclusive finance and the agricultural resilience. Using the panel data covering 30 provincial-level administrative regions in China, Cheng Y-S & Zhang D-Y [16] confirm that the digital technologies foster the sound development of farmers’ cooperatives through the indirect channels: stimulating the technological innovation, mitigating the capital shortages and improving the risk resistance. Their analytical mechanisms provide a critical reference for the present research.
(3) Mechanisms Underpinning Resilience Enhancement: Technological Progress and
Industrial Upgrading
Regarding the mechanisms for enhancing the resilience of the agricultural industrial chains, the existing research primarily examines this issue from two perspectives: technological progress and industrial upgrading. The induced technological innovation theory posits that the growth in the agricultural productivity hinges on the technological advancement [17].
The application of the digital technologies is accelerating the integration of digital tools—such as the data, information, and algorithms—into the agricultural industry chain, thereby enhancing its technological supply capacity, driving the agricultural technological progress [18], and strengthening the risk resilience of the agricultural industry chain [19]. Zheng J-L & Zhang Y-L [14] confirm that the agricultural technological progress constitutes a vital transmission channel linking the digital technologies to the agricultural industrial chain resilience.
According to the industrial structure evolution theory, the technological innovation serves as the core driving force behind the evolution of the industrial structure from a low-level stage to a high-level stage [20]. The application of the digital technologies helps drive the upgrading of the traditional rural industries, promotes the deep integration of agriculture, manufacturing, and services, and facilitates the structural upgrading and diversified development of the agricultural sector [21]. The industrial linkage effect helps mitigate the negative impact of the instability factors on the agricultural industry chain and enhances its resilience [22]. Leveraging a double machine learning framework, Huang X [23] verifies three pathways to boost the agricultural industrial chain resilience: advancing technological innovation, deepening agricultural specialization, and upgrading industrial structures.
(4) Research Gaps
The existing literature has conducted a relatively systematic exploration of the conceptual measurement of agricultural industry chain resilience, the application effects of digital technologies in the agricultural sector, and the mechanisms and pathways for enhancing resilience. However, existing research still faces three major gaps:
First, the empirical testing of the mediating mechanism remains insufficient. Empirical studies that incorporate the pathway “digital technologies → agricultural technological progress → resilience of the agricultural industry chain” into a unified analytical framework and conduct the rigorous mediation effect tests are still relatively limited.
Second, the research perspective on the threshold effect needs to be expanded; existing literature has rarely examined how agricultural production risks, as a threshold condition, influence the effectiveness of digital technology empowerment.
Third, the criteria used for regional heterogeneity analysis are relatively broad; there is a lack of systematic comparisons across finer geographical subregions within provinces (such as Northern Anhui, Central Anhui, and Southern Anhui), which makes it difficult to support differentiated policy design at the provincial level.
Building upon the aforementioned gaps, this study employs 16 prefecture-level cities in Anhui Province as a sample to examine the threshold effect and regional heterogeneity of agricultural production risks, aiming to supplement the existing literature.
1.5. Theoretical Mechanisms and Research Hypotheses
(1) Concept Definition and Dimension Decomposition of Agricultural Industrial Chain Resilience
The resilience of the agricultural industry chain refers to its comprehensive capability to maintain its fundamental operational functions, rapidly return to normal operations, and achieve structural upgrading when confronted with various internal and external disturbances, such as natural disasters, market fluctuations, technological shocks, and policy changes. This paper categorizes the resilience of agricultural industrial chains into three core components: resilience, recovery capacity, and transformation capacity. The resilience refers to the chain’s ability to withstand and protect itself when exposed to shocks. The recovery capacity refers to its ability to self-adjust and rebuild after sustaining damage. The transformation capacity refers to its ability to achieve enhanced development through the technological innovation and structural adjustment following a shock.
(2) Direct Influence Mechanism of the Digital Technology on the Agricultural Industrial Chain Resilience
The endogenous growth theory posits that the digital technologies can reshape agricultural production organizational models, thereby enhancing the industrial chain resilience from three perspectives. First, the penetration of the digital resources into grassroots levels helps break down the information barriers, alleviate the supply-demand imbalances, reduce the distribution costs, buffer against the market and natural shocks, and strengthen overall resilience. Second, the online platforms connect various business entities, enabling the rapid reallocation of resources to restore the operational continuity when the industrial chain experiences the fluctuations. Third, the integration of big data and artificial intelligence into agriculture drives the industrial chain toward higher value-added segments. The digital technologies can address weaknesses within the industrial chain, integrate various business entities, and comprehensively enhance the risk resilience. Based on this analysis, Hypothesis H1 is proposed.
H1: The application of digital technologies can significantly enhance the resilience of agricultural industrial chains.
(3) Mediating Mechanism of the Agricultural Technological Progress
The Induced Technological Transformation Theory posits that technological progress is central to enhancing the agricultural productivity and strengthening the resilience of the agricultural industry chain against the shocks. The digital technologies serve as a key driver of the agricultural technological advancement. They facilitate the integration of data with agricultural production resources and optimize the resource allocation models. Continuous upgrades in the agricultural technology can enhance the land-use efficiency, mitigate production risks, and ensure greater stability and resilience of the industrial chain. Based on this rationale, Hypothesis H2 is proposed.
H2: Digital technologies enhance the resilience of the agricultural industry chain indirectly by driving advancements in agricultural technology.
(4) Theoretical Interpretation of the Regional Heterogeneity
The regional economy and agricultural location theory posits that there exist disparities in resource endowments and industrial foundations across different regions. Northern Anhui, as a traditional major agricultural region, possesses a substantial agricultural base and exhibits a high marginal effect of digitalization, thereby exerting a prominent promoting role. Central Anhui, leveraging its position within the provincial capital economic circle, boasts well-developed economies and digital infrastructure, and demonstrates a strong digital empowerment effect. Southern Anhui, characterized primarily by mountainous and hilly terrain, focuses on ecological agriculture and tourism, features a unique industrial structure, and shows relatively weak penetration effects of digital technologies. The divergent objective conditions among these three regions result in graded differences in the enhancing impact of the digital technologies on resilience. Accordingly, Hypothesis H3 is proposed.
H3: The role of digital technologies in enhancing the resilience of agricultural industrial chains in Anhui Province exhibits significant regional heterogeneity.
(5) Threshold Effect Mechanism of the Agricultural Production Risks
The endogenous growth and technology absorption theory posits that the impact of digital technologies is constrained by the absorptive capacity of the subject and exhibits nonlinear characteristics. In regions with low grain yields and high production risks, the effect of digital empowerment on resilience remains limited due to the constraints in infrastructure development and farmers’ digital literacy; once the grain yield surpasses a threshold, as the scale and standardization of agriculture improve, digital technologies can fully unleash their potential in scenarios such as precision farming and intelligent decision-making. Consequently, the influence of digital technologies on the industrial chain resilience follows a threshold-based transition pattern relative to grain yield levels, leading to the formulation of Hypothesis H4.
H4: The impact of digital technologies on the resilience of agricultural industrial chains exhibits a threshold effect contingent upon agricultural production risks.
The theoretical framework and research hypotheses of this study are visualized in Figure 1.
2. Research Design
2.1. Variable Selection
(1) Explained Variable: Agricultural Industrial Chain Resilience
Referring to the studies of Hao A-M & Tan J-Y [5] and Zeng X-W et al. [7], this study constructs a comprehensive evaluation index system for agricultural industrial chain resilience from three dimensions: resistance, recovery capacity, and transformation capacity (Table 1). The entropy weight method is adopted to calculate the weight of each indicator and further measure the annual agricultural industrial chain resilience index of prefecture-level cities in Anhui Province.
(2) Core Explanatory Variable: Digital Technology Index
The digital technology index reflects the application level of regional digital technology in the agricultural sector. Following the research frameworks of Zheng J-L & Zhang Y-L [14] and Wu Y-T et al. [24], this study selects indicators from three dimensions, including digital application development capacity, digital technology adoption, and digital infrastructure construction level (Table 2).
(3) Mediating Variable: Agricultural Technological Progress
The agricultural technological advancement serves as a crucial transmission pathway through which digital technologies enhance the resilience of the agricultural industry chain. Referring to Geng P-P & Luo B-L [25], this study adopts the total agricultural mechanical power as the proxy variable for agricultural technological progress. Considering the skewed distribution and economic implications of the original variable, the natural logarithm is applied to the indicator, denoted as lnTech_agri.
(4) Threshold Variable: Grain Yield Efficiency Index
The grain yield efficiency index is a core indicator for measuring agricultural production risks. This study adopts the municipal grain yield efficiency index (with 2015 as the base year and the base value set to 100) as the threshold variable, aiming to examine whether the nonlinear “jump” exists in the impact of digital technology on agricultural industrial chain resilience along with changes in grain production levels. An index value greater than 100 indicates an increase in grain output compared with the base year, while a value lower than 100 indicates a decrease.
(5) Control Variables
To mitigate the estimation bias caused by omitted variables, this study selects a set of control variables in accordance with existing studies [14,15]. The selected control variables are specified as follows. Fiscal expenditure scale (lnfis), measured by the natural logarithm of expenditures on agriculture, forestry and water conservancy in local general public budget expenditures (ten thousand yuan). Financial development level (FD), defined as the proportion of the balance of deposits and loans of financial institutions at the year-end in regional gross domestic product (%). Transportation infrastructure (road), represented by highway density, calculated as the ratio of highway mileage (kilometers) to administrative area (kilometers per hundred square kilometers). Agricultural employment ratio (agemp), measured by the proportion of employees in the primary industry in the total regional employment (%).
2.2. Data Sources and Processing
(1) Sample Selection
This study takes 16 prefecture-level cities in Anhui Province as the research sample, including Hefei, Huaibei, Bozhou, Suzhou, Bengbu, Fuyang, Huainan, Chuzhou, Lu’an, Maanshan, Wuhu, Xuancheng, Tongling, Chizhou, Anqing, and Huangshan. The research period spans from 2015 to 2024, covering a 10-year interval. Accordingly, a balanced panel dataset consisting of 160 observations (16 cities × 10 years) is constructed for empirical analysis.
(2) Data Sources
The primary data sources of this study are presented in Table 3. For individual missing values in certain years, the linear interpolation method is employed for data supplementation to ensure the integrity and continuity of the panel data.
(3) Descriptive Statistics of Variables
The sample size, mean value, standard deviation, minimum value, and maximum value of all variables involved in this study are presented in Table 4.
As shown in Table 4, each variable exhibits considerable variation during the sample period, which provides a reliable data foundation for the subsequent econometric analysis. The mean value of agricultural industrial chain resilience is 0.406, with a standard deviation of 0.083, a minimum value of 0.109, and a maximum value of 0.625, indicating obvious disparities in agricultural industrial chain resilience across prefecture-level cities in Anhui Province. The digital technology index has a mean value of 0.318, a minimum value of 0.204, and a maximum value of 0.646, reflecting an uneven application level of digital technology in the agricultural sector of Anhui Province and laying a solid foundation for exploring its heterogeneous effects.
Table 5 presents the sub-regional statistical results of the digital technology index and agricultural industrial chain resilience index. The results reveal that both the level of digital technology application and agricultural industrial chain resilience follow a distinct gradient distribution pattern, ranked as Southern Anhui > Central Anhui > Northern Anhui. There exists a significant positive correlation between the mean values of the two indicators, which preliminarily verifies the coupling relationship between digital technology development and agricultural industrial chain resilience.
Figure 2 illustrates the temporal variation trend of the digital technology index in Anhui Province from 2015 to 2024. Overall, the digital technology index of Anhui Province shows a sustained upward trend during the sample period, rising steadily from 10.0 in 2015 to 75.0 in 2024, with an average annual growth rate of approximately 22.1%. The growth trajectory can be divided into two distinct stages. The period from 2015 to 2019 represents a steady growth stage, with a moderate average annual increase of 7.0%. In contrast, the period from 2020 to 2024 witnesses an accelerated growth stage, with the average annual growth rate increasing to 11.8%. This temporal evolution indicates that the application of digital technology in Anhui Province has entered a rapid development phase during the 14th Five-Year Plan period. The continuous improvement of digital infrastructure, the implementation of targeted digital economy policies, and the vigorous development of new agricultural business forms such as rural e-commerce and digital inclusive finance jointly drive the continuous growth of the digital technology index.
Figure 3 presents the kernel density distribution of the digital technology index in Anhui Province. The digital technology application index across the province generally follows a unimodal distribution, with the peak value mainly concentrated in the range of 30 to 50. This finding suggests that the values of the digital technology index were relatively concentrated from 2015 to 2024, with no obvious polarization during the sample period. Meanwhile, the overall distribution curve shifts rightward over time, and the central position of the distribution continues to move upward with the advancement of the study years. This trend further verifies the steady improvement of digital technology application levels across Anhui Province and reflects the sound and synchronized development of digital agriculture in the whole region.
2.3. Model Specification
(1) Benchmark Regression Model
Based on the foregoing theoretical analysis, a benchmark regression model is constructed to empirically verify the research hypotheses proposed in this study, which is specified as follows:
In Equation (1), denotes the level of agricultural industrial chain resilience; represents the digital technology level; refers to the set of control variables affecting agricultural industrial chain resilience; indicates the city fixed effect; denotes the time fixed effect; is the random error term; is the constant term, and represents the influence coefficient of digital technology on agricultural industrial chain resilience.
(2) Mediating Effect Model
To further explore the internal mechanism through which digital technology affects agricultural industrial chain resilience, this study constructs a mediating effect model following the research paradigm of Jiang T [26], as presented below:
In Equation (2) and Equation (3), denotes the mediating variable of agricultural technological progress. is the constant term, and is the estimated coefficient of digital technology on the mediating variable. The definitions of other variables are consistent with those in Equation (1).
(3) Threshold Effect Model Under Agricultural Production Risks
A panel threshold regression model is adopted to verify the nonlinear threshold effect of agricultural production risk on the relationship between digital technology and agricultural industrial chain resilience. The single-threshold model is constructed as follows:
In Equation (4), is the threshold variable measured by the grain yield efficiency index, which is used to characterize agricultural production risks. represents the threshold value, and is the indicator function. Specifically, when is less than or equal to the threshold , the influence coefficient of digital technology on agricultural industrial chain resilience is ; whenexceeds the threshold , the corresponding influence coefficient is .
3. Empirical Results and Analysis
3.1. Correlation Analysis and Multicollinearity Test
Table 6 presents the results of the correlation analysis among variables. The correlation coefficient between digital technology and agricultural resilience is 0.770*, indicating a statistically significant positive correlation at the 1% level, which provides preliminary support for the theoretical hypothesis that “digital empowerment enhances agricultural resilience.”
Table 7 presents the results of the multicollinearity test; the average VIF is 2.785, and the VIF values for all variables are <10, indicating no severe multicollinearity exists, and thus regression analysis can proceed.
3.2. Panel Model Selection Test
Before conducting a benchmark regression, it is necessary to determine the appropriate model using the F-test and the Hausman test.
Table 8 presents the results of the panel model selection test: for the F-test, F(15,144) = 74.80, p = 0.0000 <0.05, indicating that the mixed OLS model is rejected and the fixed-effects model is selected; for the Hausman test, χ2(7) = 29.33, p = 0.0000 <0.05, indicating that the random-effects model is rejected and the fixed-effects model is selected. Therefore, all subsequent regressions employ a two-way fixed-effects model that controls for both individual and time effects.
3.3. Baseline Regression Results
Table 9 illustrates the detailed results of the baseline regression. Column (1) presents the estimation outcomes without any control variables. The coefficient of digital technology is 0.134 and significantly positive at the 5% level, indicating that a one-unit increase in the digital technology index contributes to an average increase of 0.134 units in the agricultural industrial chain resilience index. Column (2) incorporates all control variables into the regression model. The coefficient of digital technology rises to 0.242 and remains statistically positive at the 5% significance level, which further validates the robustness of the core research conclusion.
In terms of the control variables, the regression coefficients of financial development level (FD), transportation infrastructure (road), fiscal expenditure scale (lnfis), and agricultural employment ratio (agemp) fail to pass the significance test. Among them, financial development and fiscal expenditure show positive coefficients, suggesting that financial support and fiscal subsidies for agriculture can marginally promote agricultural industrial chain resilience, although such driving effects have not yet reached statistical significance in the current stage. The coefficient of agricultural employment ratio is negative, which implies that a higher proportion of agricultural employment tends to exacerbate the risk of industrial structure simplification and accordingly inhibits the anti-shock capacity of agricultural industrial chains to a certain extent. The coefficient of transportation infrastructure is close to zero and insignificant. This finding can be explained by the mature highway network construction across prefecture-level cities in Anhui Province, leading to a limited marginal improvement space of transportation facilities in enhancing agricultural resilience.
In summary, the benchmark regression results fully verify Hypothesis H1 that digital technology application can significantly improve the agricultural industrial chain resilience in Anhui Province.
3.4. Mediating Effect Regression
Table 10 reports the empirical results of the mediating effect test. Column (1) presents the regression results of digital technology on agricultural technological progress. The coefficient of digital technology is 4.224 and statistically significant at the 1% level, indicating that digital technology can substantially promote the advancement of agricultural technology. By supporting agricultural research and development and facilitating the dissemination and popularization of professional agricultural knowledge, digital technology effectively improves agricultural mechanization and actual production efficiency. Column (2) incorporates the mediating variable lnTech_agri into the benchmark model. The regression coefficient of agricultural technological progress is 0.0098 (p<0.1), suggesting that agricultural technological progress itself exerts a positive promoting effect on agricultural industrial chain resilience.
The empirical results confirm the existence of a partial positive mediating effect of agricultural technological progress. On the one hand, digital technology directly optimizes resource allocation within agricultural industrial chains and strengthens industrial anti-risk capacity. On the other hand, it indirectly empowers agricultural industrial chain resilience by driving agricultural technological progress. Nevertheless, the indirect driving effect of technological progress is relatively weak, implying that the release of technological dividends exhibits a short-term time lag.
In conclusion, the results verify Hypothesis H2 that digital technology can indirectly enhance agricultural industrial chain resilience by boosting agricultural technological progress, which serves as a critical mediating mechanism between digital technology and agricultural industrial chain resilience.
3.5. Robustness Test
(1) Shortened Time Interval
To verify the stability and reliability of the benchmark regression conclusions, this study conducts a robustness test by shortening and subdividing the sample time interval. The full sample is divided into two sub-sample periods, namely 2015–2019 and 2020–2024, for grouped regression analysis. The corresponding test results are presented in Table 11.
To verify the stability and reliability of the benchmark regression conclusions, this study conducts a robustness test by shortening and subdividing the sample time interval. The full sample is divided into two sub-sample periods, namely 2015–2019 and 2020–2024, for grouped regression analysis. The corresponding test results are presented in Table 11. The coefficients of digital technology are significantly positive in both sub-samples, which is consistent with the direction of the benchmark regression results. Specifically, the coefficient is 0.647 and significant at the 1% level during 2015–2019, while the coefficient reaches 0.717 and is significant at the 5% level during 2020–2024. For control variables, financial development presents a significantly positive correlation at the 5% level in both sub-periods, and agricultural employment ratio shows significantly negative effects at the 5% and 10% levels, respectively, indicating stable performance of control variables across different time stages. The signs and significance levels of the core variables do not undergo fundamental changes, which strongly confirms the robustness of the benchmark regression findings.
(2) Exclusion of the Provincial Capital City Sample
Considering that the provincial capital city exhibits systematic differences from other prefecture-level cities in terms of economic development level and digital infrastructure construction, its sample inclusion may interfere with the overall regression results. Therefore, this study conducts a further robustness test by excluding the provincial capital sample, and the corresponding estimation results are reported in Table 12.
The coefficient of the core explanatory variable Digital remains statistically significant at the 1% level as a positive value (0.982), and its sign is entirely consistent with the results of the baseline regression. This indicates that the positive spillover effect of digital technology on the resilience of the agricultural industry chain has not been altered by the sample adjustment, demonstrating strong robustness of the core conclusion.
Both of the aforementioned robustness tests support the baseline conclusion, demonstrating that digital technology’s positive impact on the resilience of the agricultural industry chain is robust and reliable.
3.6. Heterogeneity Analysis
(1) Heterogeneity Analysis Based on Grain Production Levels
The agricultural production foundation may influence the empowerment effect of digital technologies. This study divides the sample into high-grain-producing regions (risk> median) and low-grain-producing regions (risk ≤ median) based on the median value of the grain yield efficiency index(risk), and conducts separate regressions for each group; the results are presented in Table 13. In high-grain-producing regions, the Digital coefficient is 1.547 (p <0.01); in low-grain-producing regions, the coefficient is 0.574 (p <0.01). The difference between the coefficients across the two groups is statistically significant (as confirmed by the SUEST test for the pseudo-uncorrelated model, p = 0.023), indicating that a stronger agricultural production foundation leads to a more pronounced enhancing effect of digital technologies on resilience. Possible reasons for this phenomenon include: in high-grain-producing regions, agriculture is more scaled-up and better organized, with a wider range of application scenarios for digital technologies—such as leading advancements in precision fertilization, drone-based plant protection, and smart irrigation—resulting in higher marginal returns.
(2) Regional Heterogeneity
According to the geographical division of Anhui Province, the 16 prefecture-level cities in the sample are classified into three sub-regions: Northern Anhui (6 cities), Central Anhui (4 cities), and Southern Anhui (6 cities). Specifically, Northern Anhui includes Huaibei, Bozhou, Suzhou, Bengbu, Fuyang, and Huainan; Central Anhui covers Hefei, Chuzhou, Lu’an, and Anqing; Southern Anhui comprises Wuhu, Maanshan, Tongling, Xuancheng, Chizhou, and Huangshan. Grouped regression analyses are conducted for the three sub-regions separately, and the empirical results are reported in Table 14.
North Anhui Region: The regression coefficient for digital technologies is 1.697 (p <0.01), the highest among the three groups. North Anhui is a major traditional agricultural region with a long agricultural industrial chain, yet its digital infrastructure remains relatively weak; consequently, its starting point for digital transformation is low but its potential is substantial, making its marginal contribution from digital technologies the highest among all regions.
Central Anhui Region: The regression coefficient for digital technology is 0.539 (p <0.01), placing it in the middle range. Central Anhui includes Hefei, the provincial capital; this region is economically developed with well-established digital infrastructure, yet agriculture accounts for a relatively low proportion of its industrial structure, leaving limited room for enhancing resilience.
Southern Anhui Region: The regression coefficient for digital technology is 0.793, but the standard error is relatively large (0.648) and the p-value> 0.1, indicating no statistical significance. Southern Anhui is predominantly mountainous and hilly; its agriculture is characterized by ecological agriculture, the tea industry, and the integration of cultural tourism; consequently, the resilience of its grain supply chain is constrained by factors such as topography, industrial models, and the level of digital penetration, and the enabling role of digital technology has not yet been fully realized.
The regional heterogeneity analysis supports the Hypothesis H3, indicating that policies should be tailored to local conditions and adopt differentiated strategies for different regions.
3.7. Threshold Effect of Agricultural Production Risks
To verify Hypothesis H4 that the impact of digital technology on agricultural industrial chain resilience presents a threshold effect constrained by agricultural production risks, this study adopts the grain yield efficiency index (risk) as the proxy indicator of agricultural production risks and the threshold variable for empirical estimation (Peng Diyun et al., 2025 [10]). Based on the panel threshold model proposed by Hansen (1999), this study first conducts a threshold existence test. The bootstrap method with 300 repeated sampling times is applied to test the significance of the threshold effect, and the corresponding empirical results are shown in Table 15.
Table 15 shows that the single threshold effect is statistically significant at the 5% level (F=28.53, p=0.037), while the double and triple threshold effects are insignificant. Accordingly, the empirical model possesses a significant single threshold of grain yield efficiency. Following the principle of minimizing the residual sum of squares, the estimated threshold value is τ = 102.36, with a 95% confidence interval of [101.52, 103.18].
The sample is divided into two intervals based on the threshold value (risk ≤ 102.36 and risk> 102.36), with the impact coefficients of digital technology on resilience estimated separately. The results are presented in Table 16.
As shown in Table 16, when the grain yield efficiency index is lower than or equal to the threshold of 102.36 (indicating that the grain output growth does not exceed 2.36% compared with the base period), the regression coefficient of digital technology is 0.412 but statistically insignificant (p=0.169). This result suggests that in regions with low grain output and high agricultural production risks, the empowering effect of digital technology on agricultural industrial chain resilience remains insufficient. The underlying reason is that low-yield regions are generally constrained by weak agricultural infrastructure, insufficient digital literacy among farmers, and limited technology absorption capacity. Coupled with the high uncertainty caused by intensive agricultural production risks, digital technology fails to achieve effective implementation and substantial improvement effects.
In contrast, when the grain yield efficiency index exceeds the threshold value (risk > 102.36), the coefficient of digital technology rises significantly to 0.923 at the 1% statistical level, which is notably higher than the coefficient obtained in the benchmark model. This finding indicates that once grain production reaches a certain scale and agricultural production risks are effectively reduced, digital technology can exert a strong promotional effect on the improvement of agricultural industrial chain resilience.
The grain yield efficiency index effectively reflects the anti-risk capacity of regional agricultural production. Regions with low grain output face limited agricultural economic returns and cannot afford the high input costs of digital agricultural transformation. In contrast, regions crossing the threshold witness expanded agricultural production scale and increased marginal returns brought by digital technology application, thereby forming a virtuous development cycle of digital empowerment and industrial resilience enhancement. In summary, the threshold regression results fully verify Hypothesis H4. Accordingly, the promotion of digital agriculture should avoid uniform policy implementation. It is necessary to first consolidate the fundamental production conditions of low-yield regions, and comprehensively promote digital technology application after regional grain production capacity reaches the critical threshold level.
4. Conclusions and Policy Implications
4.1. Research Conclusions
First, the digital technology exerts a significant and robust positive promoting effect on the agricultural industrial chain resilience in Anhui Province. After controlling for the city and time fixed effects, the regression coefficient of the digital technology index is 0.6551 and statistically significant at the 1% level. The positive impact remains stable and valid in the robustness tests adopting shortened time windows and excluding the provincial capital sample. It is confirmed that digital technology systematically strengthens the resistance, recovery, and transformation capacity of agricultural industrial chains through information connection, intelligent resource allocation, and industrial format innovation.
Second, the agricultural technological progress serves as a critical mediating transmission mechanism for the digital technology to empower agricultural industrial chain resilience. The mediating effect test results show that digital technology significantly drives the advancement of agricultural technology, with a coefficient of 0.8102 (p<0.01). After incorporating the mediating variable, both the direct effect of digital technology and the positive contribution of agricultural technological progress remain significant, with a coefficient of 0.1028 (p<0.05). This outcome verifies the inherent transmission path of “digital technology investment→agricultural technological progress→agricultural industrial chain resilience improvement”.
Third, the empowering effect of digital technology presents significant regional heterogeneity across Anhui Province. Grouped regional regressions demonstrate that the promotional effect is the most prominent in Northern Anhui, followed by Central Anhui, while the coefficient is positive but insignificant in Southern Anhui. Such gradient differences reflect substantial regional disparities in agricultural resource endowments, digital transformation foundations, and industrial structural characteristics. Northern Anhui fully releases the marginal digital dividend relying on its scale advantage as a traditional major agricultural region; the empowering effect in Central Anhui is constrained by the relatively low proportion of agriculture in the overall industrial structure; Southern Anhui fails to form effective digital technology penetration due to its eco-agriculture and agricultural cultural tourism-oriented industrial system.
Fourth, the impact of digital technology on agricultural industrial chain resilience is characterized by a significant single threshold effect based on agricultural production risks. When the grain yield efficiency index (the proxy of agricultural production risk) is below or equal to the threshold value, the coefficient of digital technology is 0.412 and statistically insignificant. When the index crosses the critical threshold, the coefficient rises sharply and significantly to 0.923 (p<0.01). In regions with low grain output and high agricultural production risks, weak infrastructure and insufficient technology absorption capacity restrict the effective functioning of digital technology. Only when grain production crosses the critical level and production risks are effectively mitigated can digital technology release its powerful effect on strengthening agricultural industrial chain resilience.
4.2. Policy Implications
First, it is essential to continue deepening the integration and application of digital technologies across the entire agricultural industry chain, and to establish a synergistic development mechanism centered on “Digital + Resilience.” Given the significant positive impact of digital technologies on the resilience of the agricultural industry chain, it is recommended that Anhui Province further increase investment in digital infrastructure within the agricultural sector, with a focus on advancing rural broadband network upgrades, expanding the coverage of the Agricultural Internet of Things (IoT), and building a rural e-commerce ecosystem. Furthermore, local authorities should be encouraged to establish digital platforms for the agricultural industry chain to integrate data resources from all stages—including production, processing, distribution, and consumption—thereby comprehensively enhancing the industry chain’s ability to withstand external shocks and its efficiency in recovery.
Second, it is essential to strengthen the intermediary driving role of agricultural technological progress and streamline the transmission chain from “digital empowerment → technological progress → enhanced resilience.” The government should establish a special fund for the research and promotion of agricultural digital technologies, supporting the R&D and demonstration applications of technologies such as intelligent agricultural machinery, precision fertilization and irrigation, and drone-based plant protection. Simultaneously, leveraging new types of agricultural entities—such as agricultural cooperatives and family farms—should enable the provision of digital agriculture training to enhance farmers’ capacity for adopting and applying these technologies. By establishing a technology extension network composed of “research institutions + enterprises + farmers,” we can accelerate the transformation of digital technologies into agricultural productivity, thereby indirectly enhancing the resilience of the agricultural industry chain.
Third, implement the differentiated regional digital agriculture policies to enhance the resilience levels of various regions according to local conditions. For the northern Anhui region, where the marginal effect of digitalization is high but its foundational infrastructure remains weak, priority should be given to addressing gaps in digital infrastructure, focusing on the promotion of applicable technologies such as intelligent agricultural machinery and precision agriculture, and establishing digital agriculture pilot counties to develop replicable experience models. For the central Anhui region, the radiating and driving role of the provincial capital economic circle should be leveraged to promote the deep integration of digital technologies with high-value-added sectors—including agricultural product processing, cold-chain logistics, and brand marketing—thereby creating a resilience-led zone. For the southern Anhui region, by integrating the characteristics of ecological agriculture and cultural tourism industries, efforts should be made to explore an integrated development path of “digital + ecology + cultural tourism,” thereby increasing the penetration rate of digital technologies within specialty agriculture and gradually unleashing their enabling potential.
Fourth, prioritize the improvement of grain yield in low-output regions to create favorable conditions for digital technology to exert resilience-enhancing effects. The threshold effect results confirm that the resilience dividend of digital technology can only be fully released when grain yield crosses the critical threshold. For counties with low grain output and high agricultural production risks, blind investment in high-cost digital technologies should be avoided. Instead, traditional yield-increasing measures including farmland water conservancy construction, improved seed promotion, and integrated pest management should be prioritized to consolidate grain production foundations. After the regional grain yield reaches the threshold level, digital agricultural technologies can be gradually introduced to form a virtuous development cycle of “production improvement – risk reduction – digital empowerment – resilience enhancement”.
Author Contributions
Conceptualization, Y.L.; methodology, Y.L.; software, Y.L.; validation, G.Z.; formal analysis, L.M.; investigation, G.Z.; resources, L.M.; data curation, Y.L.; writing—original draft preparation, Y.L.; writing—review and editing, L.M.; visualization, G.Z.; supervision, L.M.; project administration, L.M.; funding acquisition, L.M.. All authors have read and agreed to the published version of the manuscript.
Funding
This research was supported by the Scientific Research Project of the Anhui Provincial Department of Education (2025AHGXSK30302); the Action Project for the Cultivation of Middle-aged and Young Faculty in Higher Education Institutions of Anhui Province (JNFX2025076), and the University-level Key Scientific Research Projects of Suzhou University (2023yzd18, 2025yzd21).
Institutional Review Board Statement
Not applicable.
Informed Consent Statement
Not applicable.
Data Availability Statement
Some or all data, models, or codes that support the findings of this study are available from the corresponding author upon reasonable request.
Acknowledgments
The authors gratefully acknowledge all the reviewers and editors for their insightful comments.
Conflicts of Interest
The authors declare no conflict of interes.
References
- Holling, C. S. Resilience and Stability of Ecological Systems. J. Annu. Rev. Ecol. Syst. 1973, 4, 1–23. [Google Scholar] [CrossRef]
- Reggiani, A.; De Graaff, T.; Nijkamp, P. Resilience: An Evolutionary Approach to Spatial Economic Systems. J. Netw. Spat. Econ. 2002, 2, 211–229. [Google Scholar] [CrossRef]
- Upton, et al. Research on Agri-food System Resilience; R. FAO, 2022. [Google Scholar]
- He, Y.-L.; Yang, S.-C. Research on the Forging of Agricultural Industrial Chain Resilience under the “Dual Circulation” Background. J. Probl. Agric. Econ. 2021, 10, 78–89. [Google Scholar]
- Hao, A.-M.; Tan, J.-Y. Mechanism and Effect Measurement of Rural Industrial Integration Empowering Agricultural Resilience. J. J. Agrotech. Econ. 2023, 7, 88–107. [Google Scholar]
- Jiang, H.; Chen, Y.; Liu, Z.-Y. Spatio-temporal Pattern and Influencing Factors of Grain Production Resilience in China. J. Econ. Geogr. 2023, 43, 126–134. [Google Scholar]
- Zeng, X.-W.; Zhang, X.-Q.; Zuo, S.-L.; et al. Spatio-temporal Differentiation and Influencing Factors of Agricultural Industrial Chain Resilience in Central China. J. Prog. Geogr. 2025, 44, 1807–1818. [Google Scholar] [CrossRef]
- Li, J.; Yang, M.-J.; Tian, Q.-S.; et al. Resilience of Agricultural Industry and Supply Chain: Measurement, Spatio-temporal Evolution and the Impact of Industrial Chain Chief System. J/OL. J. China Agric. Univ. (Social Sciences Edition) 2026, 1–16. [Google Scholar] [CrossRef]
- Lovkova, E. S.; Kashitsina, T. N.; Sultanova, A. V.; et al. Digitalization in Agriculture. J. IOP Conf. Ser. Earth Environ. Sci. 2022, 988, 6. [Google Scholar] [CrossRef]
- Lun, R.; Liu, W.; Li, G.; et al. Does Digital Agricultural Technology Extension Service Enhance Sustainable Food Production? Evidence from Maize Farmers in China. J. Agric. 2024, 14, 23. [Google Scholar] [CrossRef]
- Li, N.; et al. Does Online Sales of Agricultural Products Affect Farmland Operation Scale of New Agricultural Business Entities? J. J. Agrotech. Econ. 2022, 02, 45–58. [Google Scholar]
- Song, W.-H.; Huang, Z.-H.; Ye, C.-H. The Impact of Digital Finance on Rural Household Livelihood Strategy Selection: Evidence from China Rural Family Panel Studies. J. Chin. Rural Econ. 2023, 6, 72–90. [Google Scholar]
- Xia, X.-L.; Chen, Z.; Zhang, H.-L.; et al. High-quality Agricultural Development: Digital Empowerment and Realization Paths. J. Chin. Rural Econ. 2019, 12, 2–15. [Google Scholar]
- Zheng, J.-L.; Zhang, Y.-L. The Effect of Digital Technology Application on Agricultural Industrial Chain Resilience. J/OL. J. Northwest A&F Univ. (Social Science Edition) 2026, 1–13. Available online: https://link.cnki.net/urlid/61.1376.c.20260410.1525.002.
- Peng, D.-Y.; Su, Y.; Feng, Y. Nonlinear Influence Mechanism of Digital Inclusive Finance on Agricultural Resilience: Also on the Threshold Effect of Agricultural Production Risks. J. China Popul. Resour. Environ. 2025, 35, 205–220. [Google Scholar]
- Cheng, Y.-S.; Zhang, D.-Y. Theoretical Framework and Research Prospect of Green Development Effect of Agricultural Socialized Services. J. Chin. J. Eco-Agric. 2024, 32, 546–558. [Google Scholar]
- Hayami, T. L. Y.; Godo, Y. Development Economics: From the Poverty to the Wealth of Nations. J. Oup Cat. 2011, 36, 101–103. [Google Scholar]
- Luo, M.-Z.; Wei, B.-H. Digital Empowerment, Technological Progress and Rural Common Prosperity. J. J. Agrotech. Econ. 2024, 2, 4–18. [Google Scholar]
- Jung, J.; et al. Technological Progress and Risk Resilience in Agricultural Supply Chains. J. J. Agric. Resour. Econ. 2021, 46, 189–206. [Google Scholar]
- Gan, C.-H.; Zheng, R.-G.; Yu, D.-F. The Impact of Industrial Structural Change on Economic Growth and Economic Fluctuation in China. J. Econ. Res. J. 2011, 05, 4–16+31. [Google Scholar]
- Chen, Y.-E.; Chen, W. Research on the Relationship Between Agricultural Mechanization, Industrial Upgrading and Agricultural Carbon Emissions: An Empirical Analysis Based on Dynamic Panel Data Model. J. J. Agrotech. Econ. 2018, 05, 122–133. [Google Scholar]
- Tian, Y.-Q.; He, G.-W.; Fan, Y.-C. Typical Cases and Optimization Paths of Digital Finance Empowering Rural Industrial Resilience. J. Southwest Financ. 2022, 09, 65–74. [Google Scholar]
- Huang, X. The Impact of Digital Inclusive Finance on the Resilience of Agricultural Industrial Chains: A Causal Inference Based on Double Machine Learning.J.The Impact of Digital Inclusive Finance on the Resilience of Agricultural Industrial Chains: A Causal Inference Based on Double Machine Learning. J. Bus. Res. 2025, 5, 46–55. [Google Scholar]
- Wu, Y.-T.; Han, X.; Li, J.-Y. Digital Technology Application, Resource Misallocation and High-quality Agricultural Development. J. Contemp. Econ. Sci. 2023, 45(4), 99–109. [Google Scholar]
- Geng, P.-P.; Luo, B.-L. How Technological Progress Transforms Social Forms: Evidence from Rural Social Transformation in China. J. Soc. Sci. Front 2023, 4, 90–102. [Google Scholar]
- Jiang, T. Mediating and Moderating Effects in Empirical Causal Inference Research. J. China Ind. Econ. 2022, 5, 100–120. [Google Scholar]
Figure 1.
Influence Mechanism of Digital Technology on Agricultural Industrial Chain Resilience.
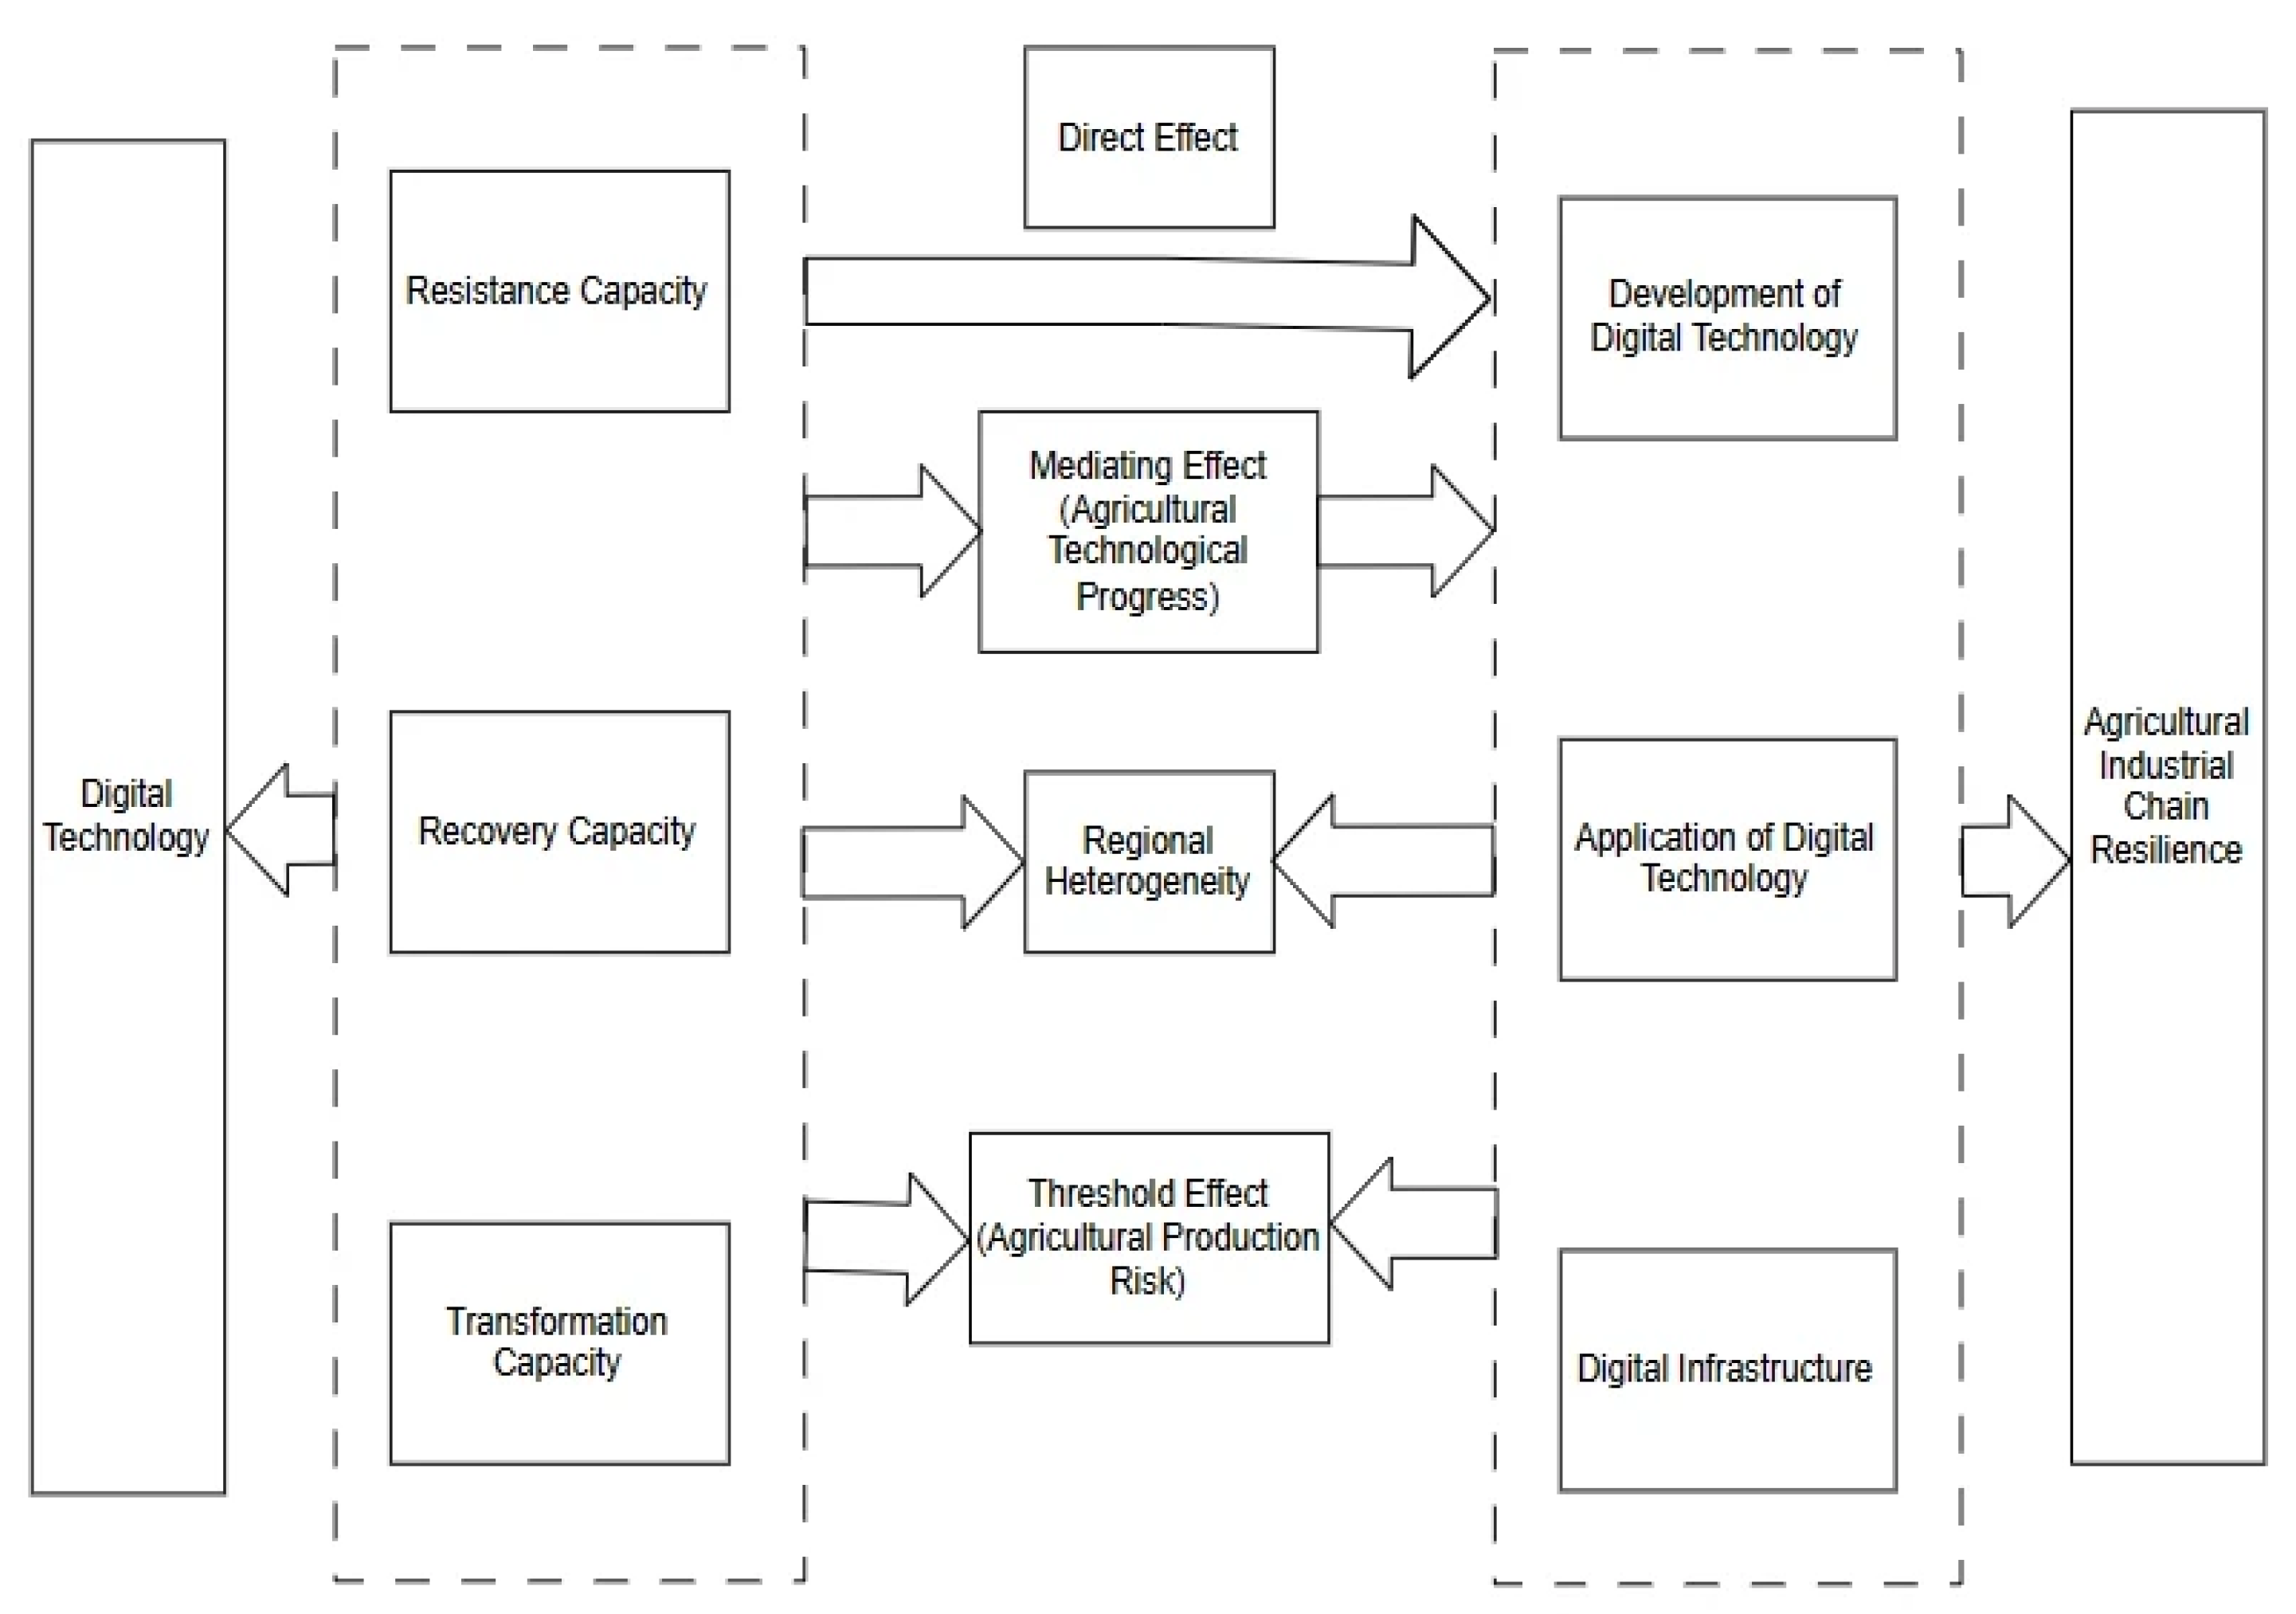
Figure 2.
Temporal Trend of Digital Technology Index in Anhui Province, 2015-2024.
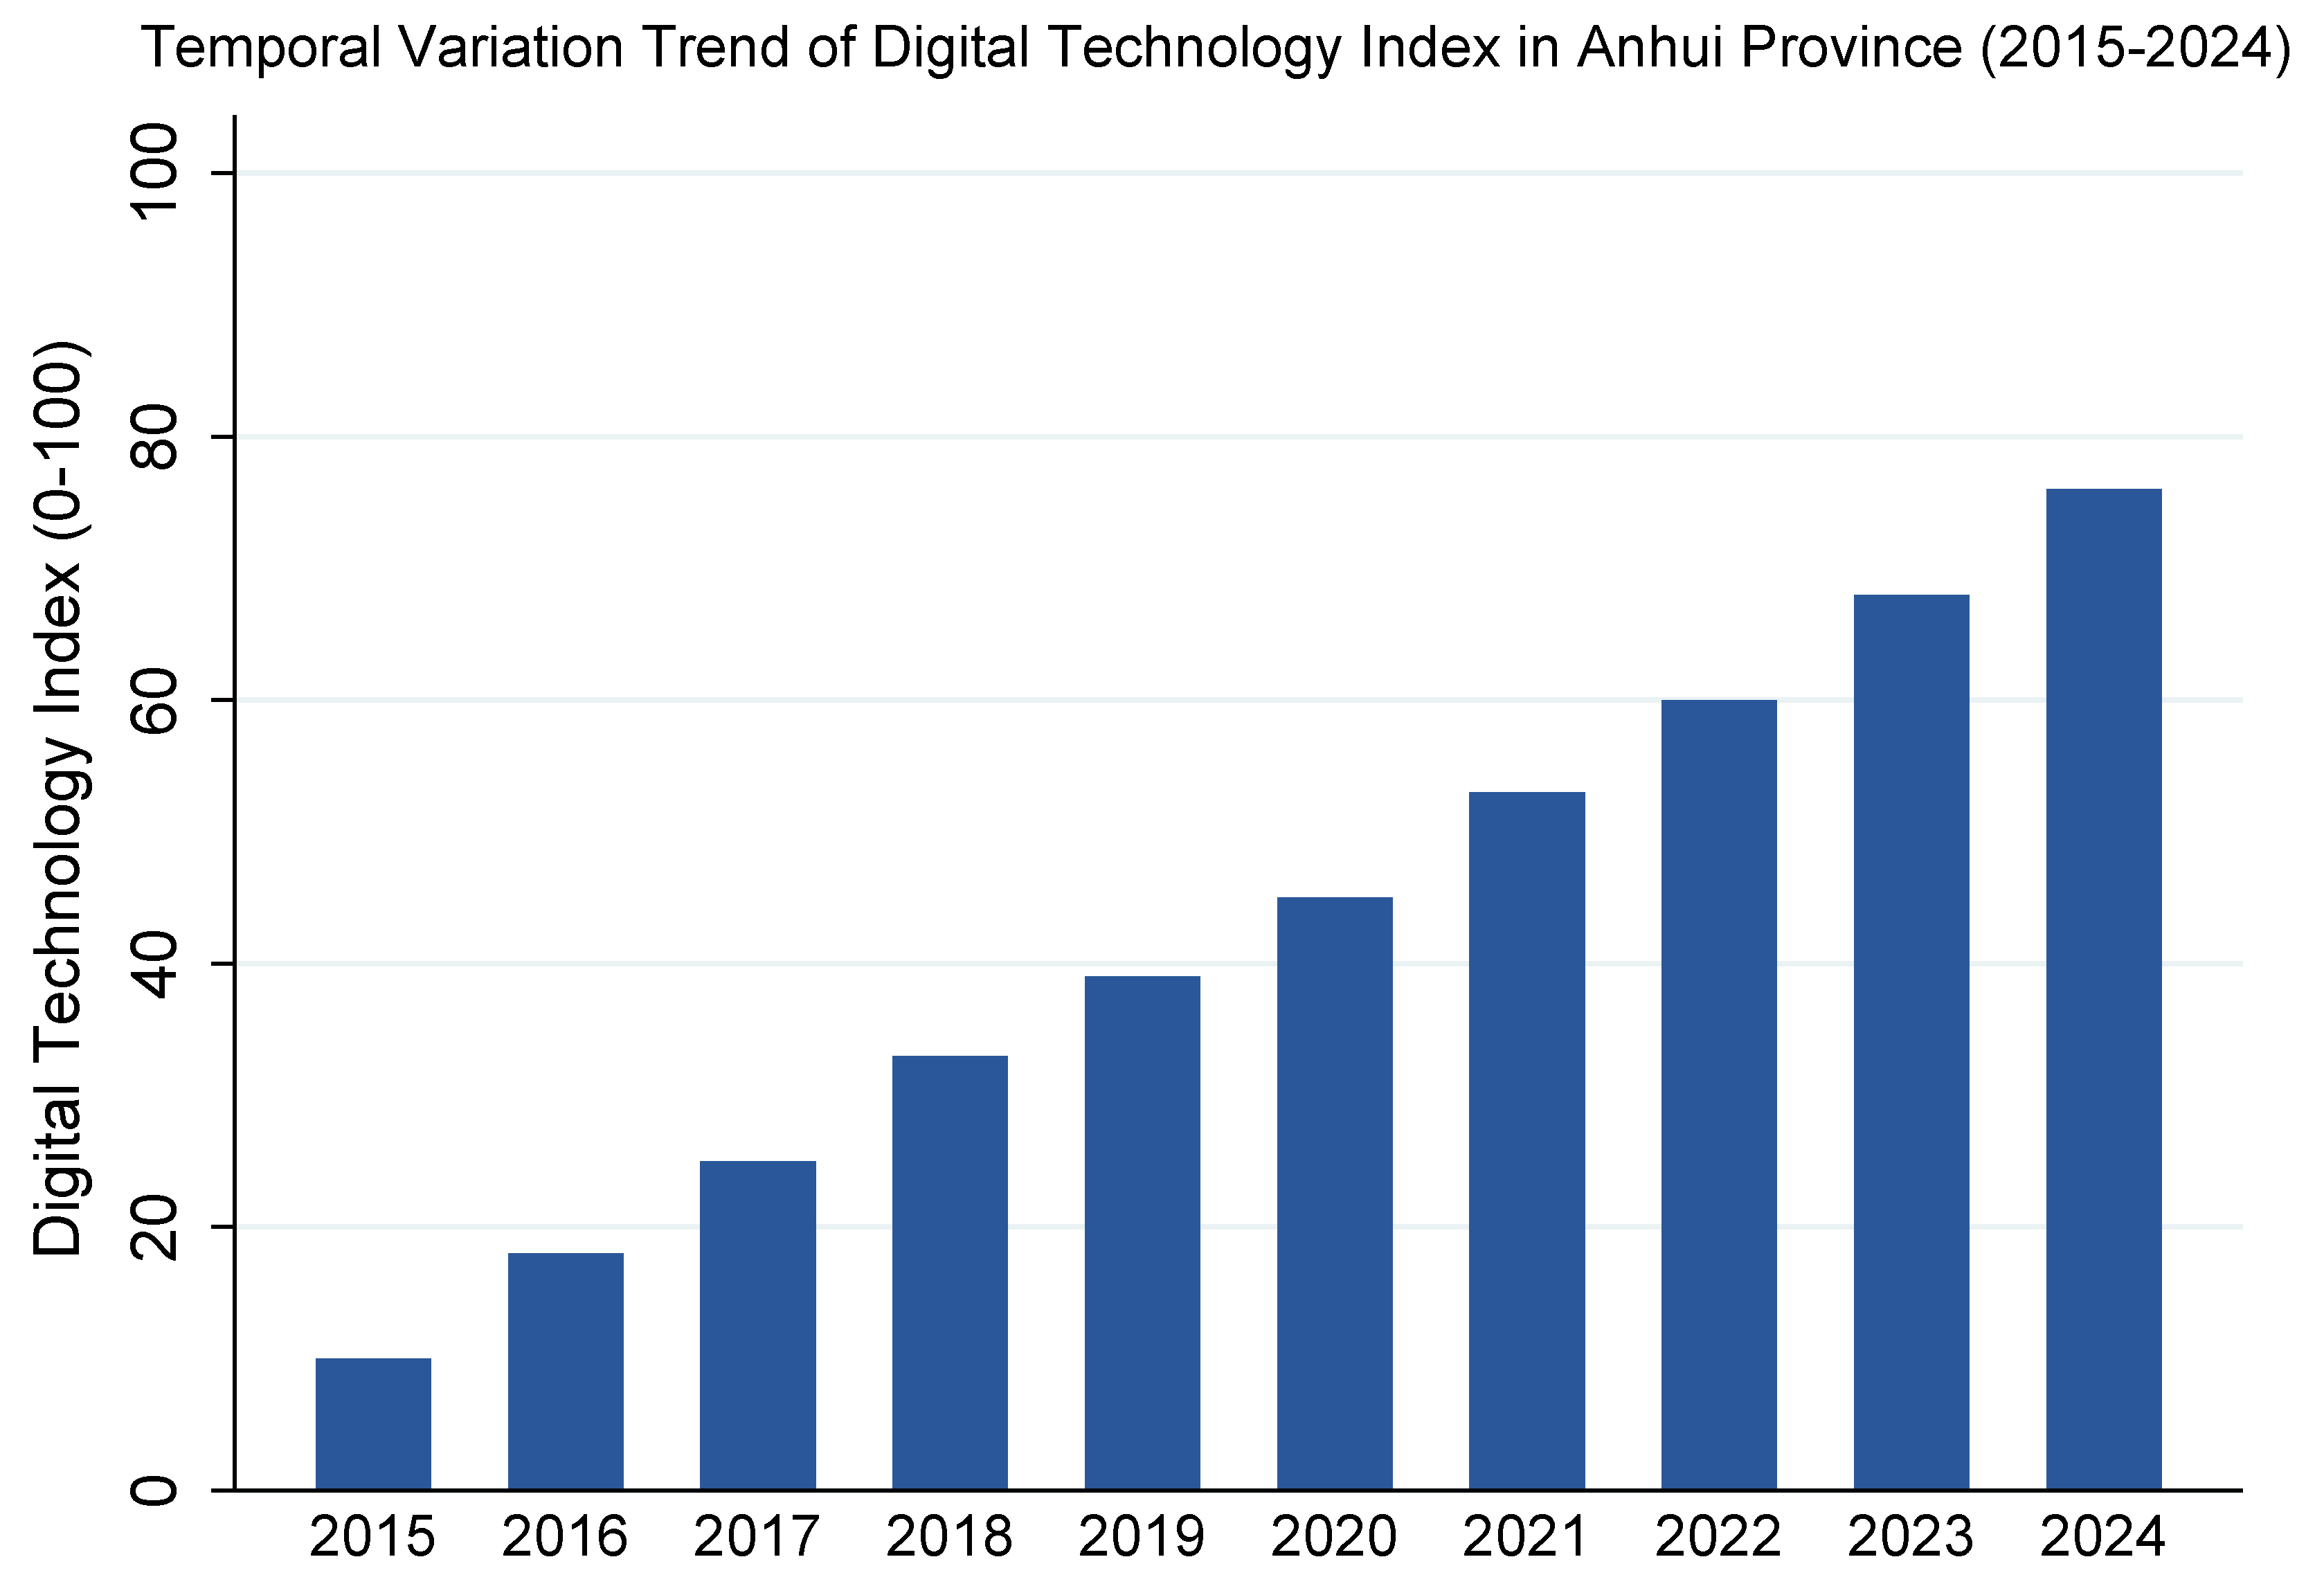
Figure 3.
Kernel Density Estimation of Digital Technology Index in Anhui Province.
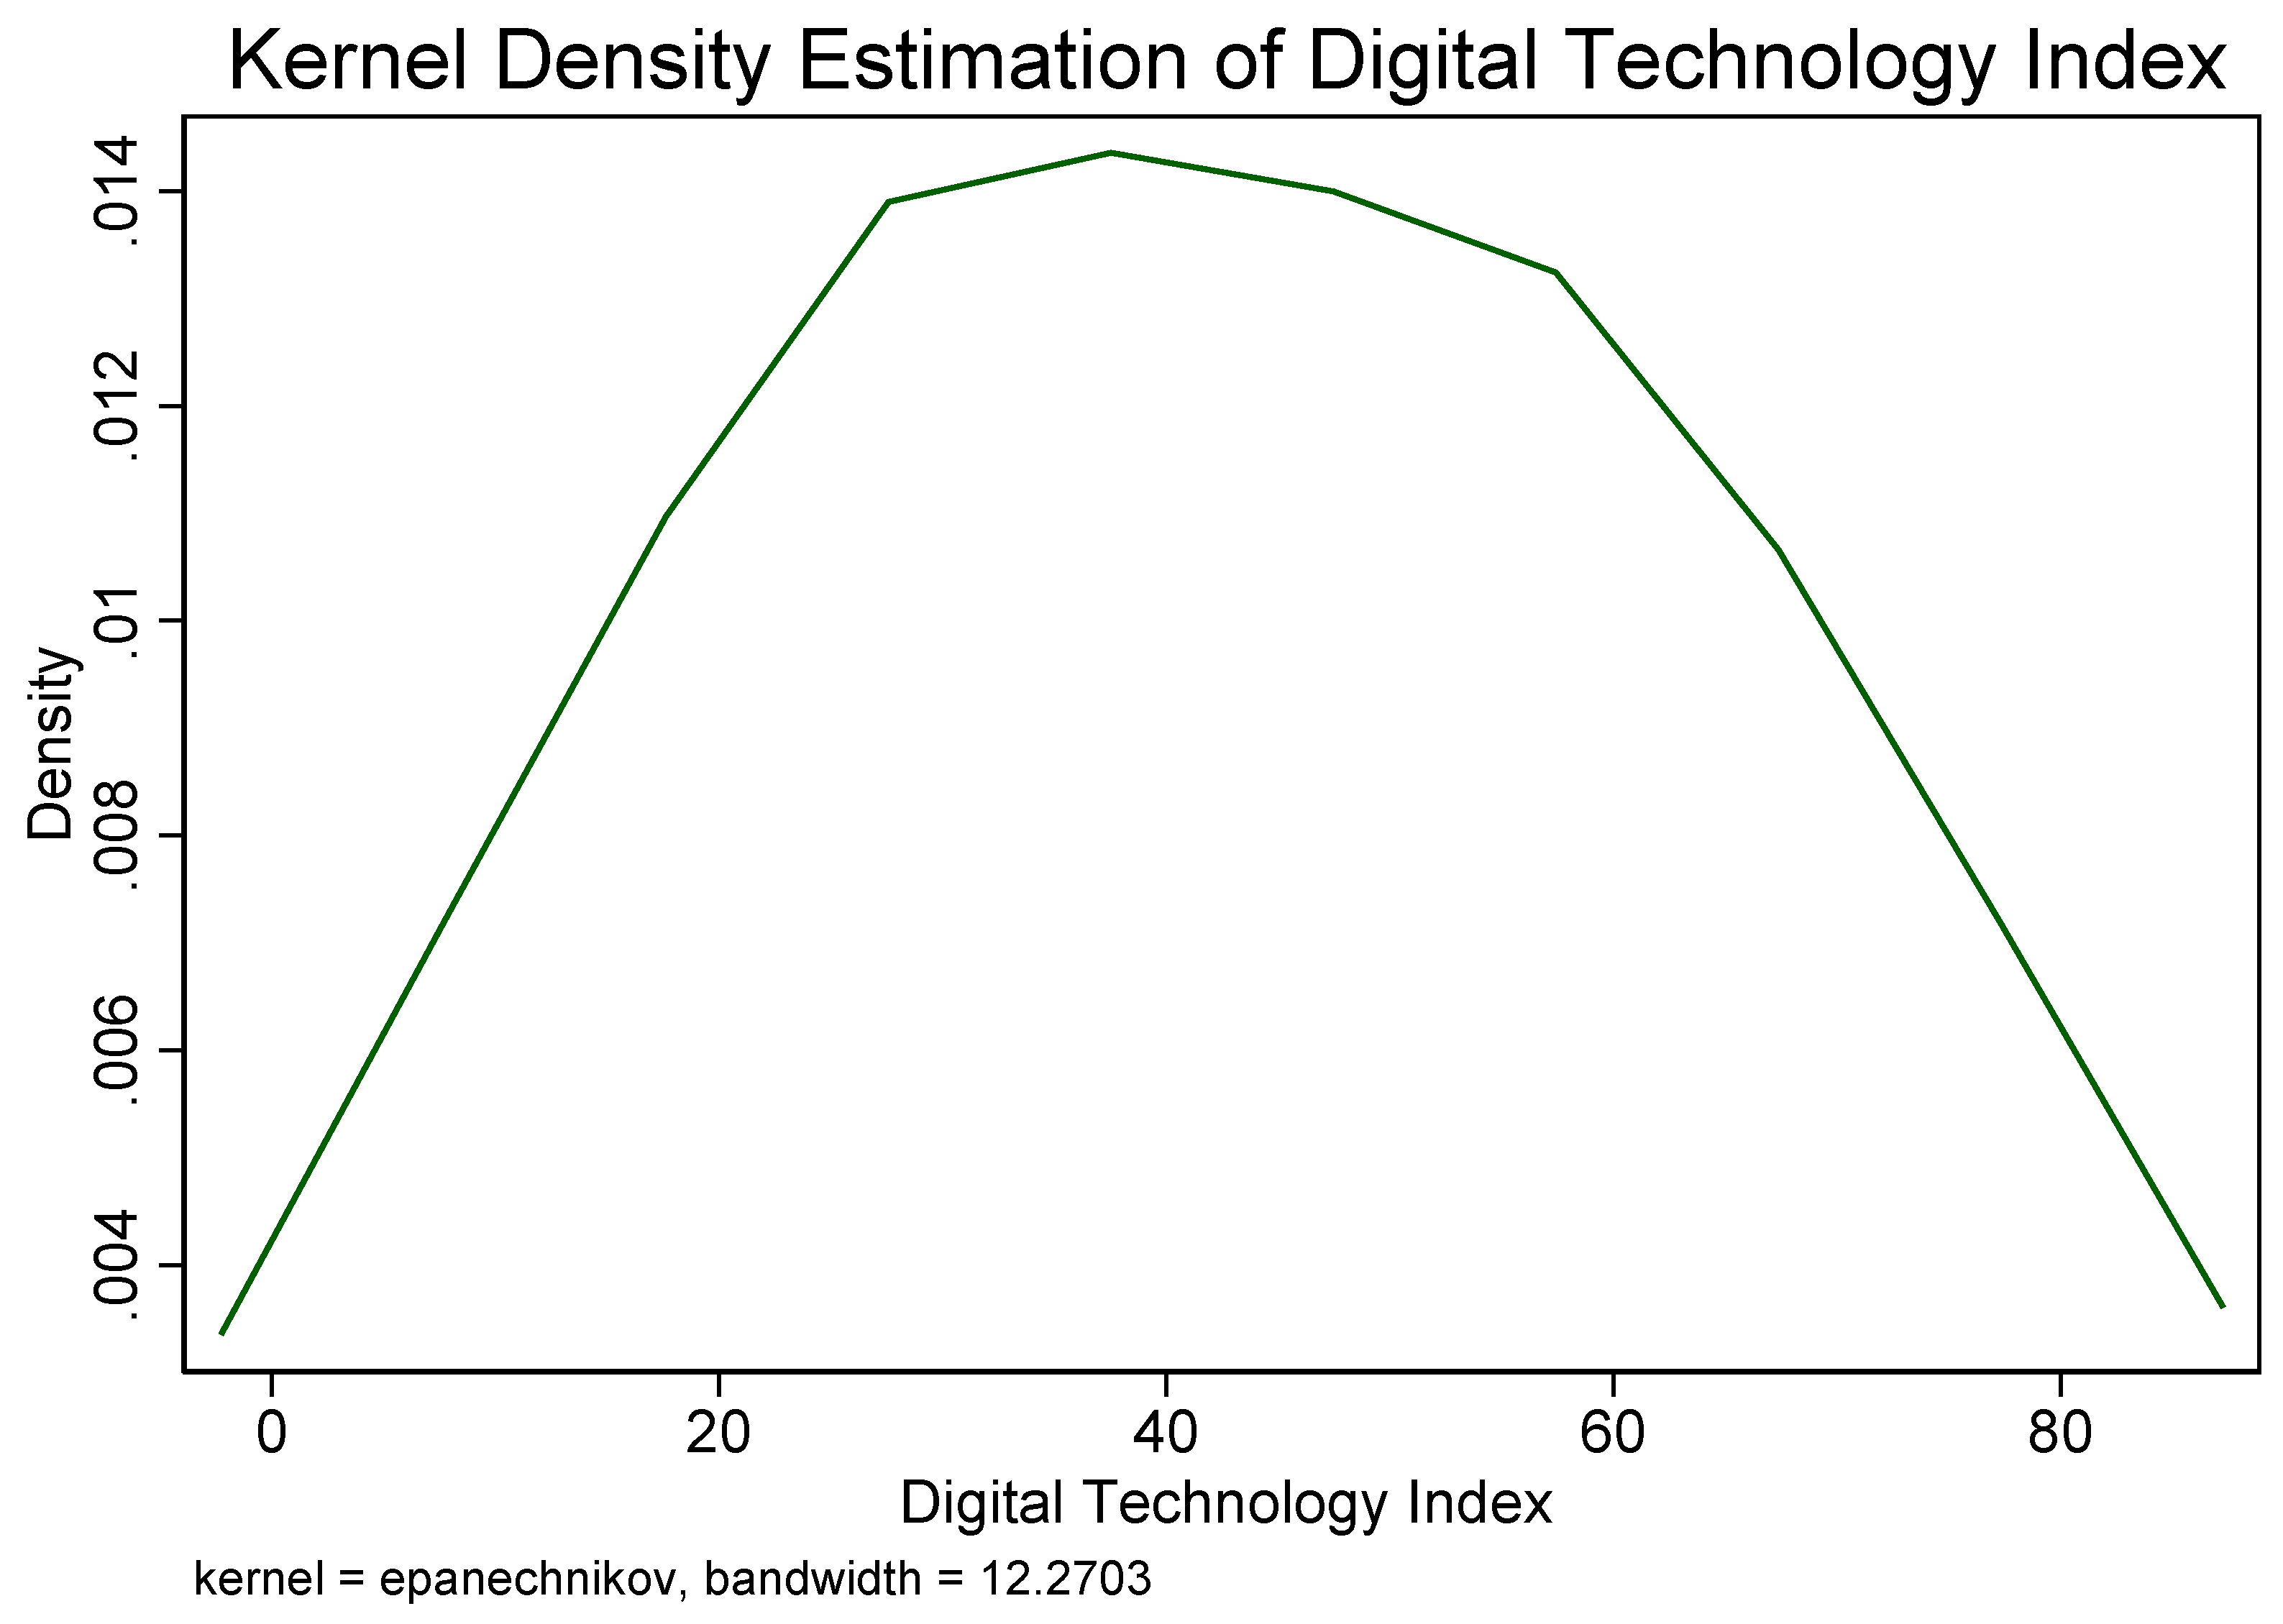

Table 1.
Indicator System of Agricultural Industrial Chain Resilience.
| Dimension(Target Layer) | Indicator Layer | Calculation Method | Attribute |
| Resistance Capacity | Agricultural Mechanization Level | Total power of agricultural machinery / Cultivated land area | Positive (+) |
| Grain Production Capacity | Total grain output | Positive (+) | |
| Agricultural Product Processing Level | Operating revenue of agricultural product processing industry | Positive (+) | |
| Recovery Capacity | Large-scale Agricultural Operation | Number of leading enterprises in agricultural industrialization | Positive (+) |
| Agricultural Cooperative Coverage | Number of specialized farmer cooperatives | Positive (+) | |
| Rural Consumption Expenditure | Total consumption expenditure of rural residents | Positive (+) | |
| Transformation Capacity | Digital Finance Development Level | Digital inclusive finance index | Positive (+) |
| Fiscal Support for Agriculture | Expenditure on agriculture, forestry and water conservancy / General public budget expenditure | Positive (+) | |
| Quality of Agricultural Labor Force | Average years of schooling of rural labor force | Positive (+) |
Table 2.
Indicator System of Digital Technology Index.
| Primary Indicator | Secondary Indicator | Indicator Definition | Attribute |
| Digital Application Development Capacity | Agricultural Mechanization Level | Total power of agricultural machinery (10,000 kW) | Positive (+) |
| Rural Postal and Communication Service Level | Average population served per postal outlet (10,000 people) | Positive (+) | |
| Digital Technology Purchasing Power | Rural residents’ per capita disposable income / Regional gross domestic product (10,000 yuan / 100 million yuan) | Positive (+) | |
| Digital Service Consumption Level | Per capita transportation and communication consumption expenditure of rural households (yuan) | Positive (+) | |
| Digital Technology R&D | Number of granted digital invention patents | Positive (+) | |
| Digital Technology Embedding | Rural e-commerce transaction value | Positive (+) | |
| Digital Technology Application | Internet Penetration Rate | Number of internet broadband access users / Total population × 100% | Positive (+) |
| Mobile Phone Penetration Rate | Number of mobile phone users / Total population × 100% | Positive (+) | |
| Proportion of Internal R&D Expenditure in Regional GDP | Internal expenditure on research and experimental development (R&D) / Regional gross domestic product (GDP) × 100% | Positive (+) | |
| Digital Infrastructure Level | Rural Delivery Routes | Length of rural delivery routes (km) | Positive (+) |
| Rural Broadband Penetration Ratio | Number of rural broadband access users / Total internet broadband access users × 100% | Positive (+) | |
| Rural Energy Density | Rural electricity consumption / Rural population (10,000 people) | Positive (+) |
Table 3.
Data Sources of Main Variables.
| Variable Category | Variable Name & Abbreviation | Data Source |
| Explained Variable | Agricultural Industrial Chain Resilience (Resilience) | Calculated based on relevant indicators from Anhui Statistical Yearbook and China Rural Statistical Yearbook |
| Core Explanatory Variable | Digital Technology Index (Digital) | Constructed using indicators from Anhui Statistical Yearbook, China Science and Technology Statistical Yearbook, and the Peking University Digital Inclusive Finance Index |
| Control Variables | Fiscal Expenditure Scale (fis) | Expenditure on agriculture, forestry and water conservancy in Anhui Statistical Yearbook |
| Financial Development Level (FD) | Balance of deposits and loans of financial institutions & regional GDP from Anhui Statistical Yearbook | |
| Transportation Infrastructure (road) | Highway mileage & administrative area from Anhui Statistical Yearbook | |
| Agricultural Employment Ratio (agemp) | Employees in the primary industry & total employed population from Anhui Statistical Yearbook | |
| Mediating Variable | Agricultural Technological Progress (lnTech_agri) | Total power of agricultural machinery from Anhui Statistical Yearbook |
| Threshold Variable | Grain Yield Efficiency Index (risk) | Calculated and sorted from grain output data in Anhui Statistical Yearbook |
Table 4.
Descriptive Statistics of Main Variables.
| Variable | N | Mean | Std. Dev. | Min | Max |
| Agricultural Industrial Chain Resilience (Resilience) | 160 | 0.406 | 0.083 | 0.109 | 0.625 |
| Digital Technology Index (Digital) | 160 | 0.318 | 0.074 | 0.204 | 0.646 |
| Fiscal Expenditure Scale (lnfis) | 160 | 2.476 | 0.345 | 1.526 | 3.114 |
| Financial Development Level (FD) | 160 | 2.751 | 0.520 | 1.764 | 4.389 |
| Transportation Infrastructure (road) | 160 | 157.402 | 38.300 | 54.643 | 216.519 |
| Agricultural Employment Ratio (agemp) | 160 | 9.916 | 4.501 | 2.541 | 22.587 |
| Agricultural Technological Progress (lnTech_agri) | 160 | 5.809 | 0.764 | 4.288 | 6.893 |
| Grain Yield Efficiency Index (risk) | 160 | 98.409 | 7.698 | 81.940 | 118.290 |
Table 5.
Regional Descriptive Statistics of Digital Technology Index and Industrial Chain Resilience Index.
Table 5.
Regional Descriptive Statistics of Digital Technology Index and Industrial Chain Resilience Index.
| Region | Mean of Digital Technology Index | Mean of Industrial Chain Resilience |
| Southern Anhui | 0.482 | 0.601 |
| Central Anhui | 0.395 | 0.513 |
| Northern Anhui | 0.312 | 0.422 |
Table 6.
Correlation Analysis.
| Variable | (1) | (2) | (3) | (4) | (5) | (6) | (7) | (8) |
| (1) Resilience | 1.000 | |||||||
| (2) Digital | 0.770* | 1.000 | ||||||
| (0.000) | ||||||||
| (3) FD | 0.387* | 0.417* | 1.000 | |||||
| (0.000) | (0.000) | |||||||
| (4) road | 0.494* | 0.221* | 0.138 | 1.000 | ||||
| (0.000) | (0.005) | (0.081) | ||||||
| (5) lnfis | -0.087 | -0.323* | 0.167* | -0.091 | 1.000 | |||
| (0.272) | (0.000) | (0.035) | (0.252) | |||||
| (6) agemp | -0.409* | -0.622* | -0.103 | -0.061 | 0.621* | 1.000 | ||
| (0.000) | (0.000) | (0.197) | (0.442) | (0.000) | ||||
| (7) lnTech_agri | 0.172* | -0.048 | 0.109 | 0.446* | 0.309* | 0.587* | 1.000 | |
| (0.030) | (0.546) | (0.168) | (0.000) | (0.000) | (0.000) | |||
| (8) risk | 0.137 | -0.227* | -0.058 | 0.360* | 0.120 | 0.235* | 0.504* | 1.000 |
| (0.083) | (0.004) | (0.103) | (0.465) | (0.131) | (0.003) | (0.000) |
Notes: *** p < 0.01, ** p < 0.05, * p < 0.10. Robust standard errors in parentheses.
Table 7.
Multicollinearity Test Results.
| VIF | 1/VIF | |
| agemp | 5.701 | 0.175 |
| lnTech_agri | 4.036 | 0.248 |
| Digital | 3.203 | 0.312 |
| lnfis | 1.848 | 0.541 |
| risk | 1.723 | 0.580 |
| road | 1.600 | 0.625 |
| FD | 1.386 | 0.722 |
| Mean VIF | 2.785 | . |
Table 8.
Panel Model Selection Test Results.
| coefficient | |
| Chi-square test value | 29.333 |
| P-value | 0.0001 |
Table 9.
Baseline Regression Results.
|
(1) Resilience No Controls |
(2) Resilience With Controls |
|
| Digital | 0.134** | 0.242** |
| (0.0504) | (0.107) | |
| FD | 0.0135 | |
| (0.0152) | ||
| road | -0.0000246 | |
| (0.000170) | ||
| agemp | -0.00428 | |
| (0.00302) | ||
| lnfis | 0.0328 | |
| (0.0285) | ||
| Constant | 0.290*** | 0.208** |
| (0.0139) | (0.0943) | |
| Individual fixed effects | Yes | Yes |
| Time fixed effects | Yes | Yes |
| Observations | 160 | 160 |
| R2 | 0.795 | 0.801 |
Notes: *** p < 0.01, ** p < 0.05, * p < 0.10. Robust standard errors in parentheses.
Table 10.
Mediation Effect Regression Results.
|
(1) lnTech_agri |
(2) Resilience |
|
| lnTech_agri | — | 0.0098* |
| (0.00549) | ||
| Digital | 4.224*** | 0.763*** |
| (0.778) | (0.0737) | |
| lnfis | -0.209 | 0.0580*** |
| (0.147) | (0.0152) | |
| FD | -0.00992 | -0.00112 |
| (0.111) | (0.00631) | |
| road | 0.00806*** | 0.000687*** |
| (0.0009) | (0.000132) | |
| agemp | 0.157*** | -0.00315** |
| (0.0129) | (0.00134) | |
| _cons | 2.185*** | -0.111** |
| (0.348) | (0.0430) | |
| N | 160 | 160 |
Notes: *** p < 0.01, ** p < 0.05, * p < 0.10. Robust standard errors in parentheses.
Table 11.
Subsample Regressions by Time Period.
|
2015-2019 Resilience |
2020-2024 Resilience |
|
| Digital | 0.647*** | 0.717** |
| (0.206) | (0.270) | |
| lnfis | 0.0242 | 0.0733 |
| (0.0375) | (0.0687) | |
| FD | 0.0205** | 0.0428** |
| (0.00767) | (0.0170) | |
| road | 0.0000463 | 0.00153 |
| (0.000130) | (0.00182) | |
| agemp | -0.00535** | -0.0257* |
| (0.00240) | (0.0129) | |
| _cons | 0.115*** | -0.143 |
| (0.0358) | (0.351) | |
| N | 80 | 80 |
| digital | 0.647*** | 0.717** |
| (0.206) | (0.270) | |
| lnfis | 0.0242 | 0.0733 |
| (0.0375) | (0.0687) |
Notes: *** p < 0.01, ** p < 0.05, * p < 0.10. Robust standard errors in parentheses.
Table 12.
Regression Results after Excluding the Provincial Capital.
|
(1) Full Sample Resilience |
(2) Excluding Hefei Resilience |
|
| Digital | 0.682*** | 0.982** |
| (4.59) | (3.23) | |
| lnfis | 0.0494* | 0.0352 |
| (2.16) | (1.16) | |
| FD | 0.0597*** | 0.0440 |
| (4.95) | (1.81) | |
| road | -0.000105 | -0.000112 |
| (-0.45) | (-0.49) | |
| agemp | -0.00913** | -0.00593 |
| (-3.83) | (-1.58) | |
| _cons | 0.00939 | -0.0297 |
| (0.23) | (-0.79) | |
| N | 160 | 150 |
Notes: *** p < 0.01, ** p < 0.05, * p < 0.10. Robust standard errors in parentheses.
Table 13.
Heterogeneity Analysis by Grain Output Level.
|
(1) High Grain Output Resilience |
(2) Low Grain Output Resilience |
|
| Digital | 1.547*** | 0.574** |
| (12.68) | (4.78) | |
| lnfis | -0.00491 | 0.0822* |
| (-0.56) | (3.05) | |
| FD | 0.0196* | 0.0562* |
| (3.29) | (2.64) | |
| road | 0.0000480 | -0.000362 |
| (0.24) | (-1.44) | |
| agemp | 0.000371 | -0.0102** |
| (0.22) | (-5.31) | |
| _cons | -0.103* | -0.0126 |
| (-2.50) | (-0.38) | |
| N | 80 | 80 |
Notes: *** p < 0.01, ** p < 0.05, * p < 0.10. Robust standard errors in parentheses.
Table 14.
Regional Heterogeneity Analysis.
| Variable |
Northern Anhui Resilience |
Central Anhui Resilience |
Southern Anhui Resilience |
| Digital | 1.697*** | 0.539*** | 0.793 |
| (0.157) | (0.0209) | (0.648) | |
| lnfis | -0.00741 | 0.0430 | 0.0566 |
| (0.00937) | (0.0230) | (0.0350) | |
| FD | 0.0105 | 0.0492** | 0.0678 |
| (0.00636) | (0.00953) | (0.0824) | |
| road | 0.0000179 | 0.000185 | -0.000522 |
| (0.000201) | (0.000459) | (0.000388) | |
| agemp | 0.00118 | -0.0119*** | -0.00330 |
| (0.00168) | (0.00197) | (0.00855) | |
| _cons | -0.113* | 0.0629 | -0.0739 |
| (0.0496) | (0.0625) | (0.0643) | |
| N | 60 | 40 | 60 |
Notes: *** p < 0.01, ** p < 0.05, * p < 0.10. Robust standard errors in parentheses.
Table 15.
Threshold Effect Existence Test.
| Number of thresholds | F-statistic | p-value | 10% critical value | 5% critical value | 1% critical value |
| Single threshold | 28.53 | 0.037 | 22.46 | 26.81 | 35.72 |
| Double threshold | 12.14 | 0.263 | 18.87 | 23.45 | 31.92 |
| Triple threshold | 7.82 | 0.580 | 15.33 | 19.60 | 28.14 |
Table 16.
Panel Threshold Regression Results.
| Variable | Coefficient | Robust Std. Err. | t-value | p-value |
| Digital ∙I(risk ≤ 102.36) |
0.412 | 0.298 | 1.38 | 0.169 |
| Digital ∙I(risk > 102.36) |
0.923*** | 0.176 | 5.24 | 0.000 |
| Control variables | Yes | |||
| Observations | 160 |
Disclaimer/Publisher’s Note: The statements, opinions and data contained in all publications are solely those of the individual author(s) and contributor(s) and not of MDPI and/or the editor(s). MDPI and/or the editor(s) disclaim responsibility for any injury to people or property resulting from any ideas, methods, instructions or products referred to in the content. |
© 2026 by the authors. Licensee MDPI, Basel, Switzerland. This article is an open access article distributed under the terms and conditions of the Creative Commons Attribution (CC BY) license (http://creativecommons.org/licenses/by/4.0/).
Copyright: This open access article is published under a Creative Commons CC BY 4.0 license, which permit the free download, distribution, and reuse, provided that the author and preprint are cited in any reuse.