

Submitted:
20 August 2026
Posted:
21 August 2026
You are already at the latest version
Abstract
Percentile-based thresholds widely used in flash drought monitoring lack a clear physical basis, as the same percentile may correspond to substantially different soil moisture states under different soil and climatic conditions. This study constucted a framework based on the soil moisture loss rate function L(SM) to identify root-zone loss stages, estimate physically informed thresholds, and compare them with statistical percentile thresholds. Using ERA5-Land reanalysis data from 1950 to 2024, the framework combines non-parametric identification of L(SM) with piecewise linear fitting to characterize root-zone soil moisture loss stages and estimate physically informed thresholds in the Dongjiang River Basin, southeastern China. Two physically informed critical thresholds were identified: SMWT, representing the wet–transitional boundary, and SMTD, representing the transitional–dry boundary. Their relationships with statistical percentile thresholds and reference soil hydraulic parameters were then evaluated through spatial comparison and regression analysis. Results showed that root-zone L(SM) curves were overwhelmingly dominated by a wet–transitional–dry three-stage structure, accounting for 92.5% of all grid cells, while the gravitational drainage stage was absent at the root-zone scale. The basin-mean SMWT and SMTD were 0.36 and 0.27 m³/m⁻³, respectively, with mean bootstrap 95% confidence interval widths of 0.03 and 0.02 m³/m⁻³. The 40th and 20th percentile thresholds were fully nested between SMWT and SMTD, and their correlations with the physically informed thresholds reached 0.98–0.99. However, the statistical threshold window covered only approximately 55.6% of the physically informed transition zone, indicating weaker ability to characterize terminal drought severity than flash drought onset. The proposed framework provides physically informed reference thresholds for flash drought monitoring and supports regional adaptation of percentile-based methods.
Keywords:
soil moisture loss rate function
; physically informed threshold
; statistical percentile threshold
; flash drought monitoring
; Dongjiang River Basin
1. Introduction
Flash drought is an extreme drought type characterized by rapid soil moisture depletion. Its sudden onset and rapid intensification can severely affect agricultural production, water supply, and ecosystems within days to weeks [1,2,3]. Because of this abrupt development, conventional drought monitoring methods designed for slowly evolving events are difficult to apply directly to flash droughts. This highlights the need for monitoring thresholds that reflect the physical processes underlying rapid soil moisture depletion [4,5]. The most widely used approach is the percentile-based method derived from historical soil moisture records [6,7,8]. In many studies, a flash drought is identified when the soil moisture percentile drops rapidly from above the 40th percentile to below the 20th percentile within approximately two weeks [1,9,10]. This approach is simple, data-efficient, and has been widely applied across North America [12,13], Europe [9,14], and East Asia [11,15]. However, percentile thresholds are essentially statistical descriptors. Their numerical values may vary substantially depending on the reference period, data source, and spatial scale [12,13]. More importantly, such thresholds lack explicit physical meaning. The same percentile may correspond to very different soil moisture states under different soil textures, vegetation types, and climatic backgrounds. As a result, flash drought events identified using percentile thresholds may not be ecologically or hydrologically equivalent across regions, limiting the applicability of this method in cross-regional drought assessment [16,17]. Therefore, identifying physically informed thresholds for flash drought monitoring is a key step toward improving the reliability of flash drought identification across diverse soil and climatic conditions.
The coupling between evapotranspiration and soil water content provides a physical basis for addressing this challenge. Previous studies have shown that the soil moisture loss rate does not vary monotonically with soil water content but exhibits distinct stage-dependent behavior [18,19]. When soil water content is high, evapotranspiration is mainly controlled by atmospheric evaporative demand, and the loss rate remains nearly constant. This corresponds to an energy-limited stage. As soil gradually dries, soil hydraulic conductivity and plant stomatal conductance decline, and evapotranspiration becomes increasingly limited by water supply. In this water-limited stage, the loss rate decreases with decreasing soil water content. When soil moisture becomes extremely low, plant transpiration nearly ceases, and only weak residual soil evaporation remains [19]. This conceptual framework linking evapotranspiration and soil moisture loss has been validated across multiple climatic regions and is widely recognized as an important model for understanding soil–vegetation–atmosphere water exchange processes [20,21,22,23].
Three soil hydraulic parameters provide important physical references for this staged framework [18,22,23]. Field capacity represents the maximum water content retained after gravitational drainage and marks the transition from drainage-dominated behavior to energy-limited evaporation. Critical point water content represents the transition from the energy-limited stage to the water-limited stage and generally lies between field capacity and the wilting point. Permanent wilting point represents the transition from the water-limited stage to residual evaporation and is associated with permanent plant wilting. These parameters have clear soil physical meanings and are independent of reference-period selection or statistical threshold definitions [22,23]. They therefore provide a theoretical basis for developing physically informed thresholds for flash drought identification. However, a mature methodological framework for directly estimating these stage-transition water contents from observational or reanalysis data, especially over the entire root zone, is still lacking.
Sehgal et al. [24] proposed a non-parametric framework based on the soil moisture loss rate function to estimate stage-transition breakpoints from long-term soil moisture time series using piecewise linear fitting. Subsequent studies have further developed nonlinear soil moisture loss functions [25] and automated drydown parameter extraction methods based on change-point detection [26], confirming the feasibility of extracting stage-structure information from soil moisture drydown data. Nevertheless, most previous studies have focused on near-surface soil moisture. Whether the stage structure identified for surface soil moisture remains valid at the root-zone scale has not been systematically evaluated. For flash drought monitoring, root-zone soil moisture is particularly important because plant water stress is primarily determined by the moisture status of the entire root zone rather than by the instantaneous moisture state of a shallow surface layer [27,28]. Extending the soil moisture loss stage-analysis framework to the root-zone scale is therefore an important methodological advancement and a key step in linking land–atmosphere interaction mechanisms with flash drought monitoring practice.
Taking the Dongjiang River Basin in southeastern China as the study area, this study applies the soil moisture loss stage framework to root-zone soil moisture using ERA5-Land reanalysis data. The objectives are to: (1) identify the dominant morphology of root-zone soil moisture loss curves and their spatial patterns; (2) estimate the physically informed thresholds of root-zone soil moisture loss stage transitions and evaluate their robustness; and (3) compare the estimated physically informed thresholds with commonly used statistical percentile thresholds and reference soil hydraulic parameters. The results provide a physically informed basis for improving and regionally adapting percentile-based flash drought monitoring methods. The remainder of this paper is organized as follows. Section 2 describes the study area, datasets, and methods. Section 3 presents the results of curve morphology identification, threshold estimation, and threshold evaluation. Section 4 discusses the physical mechanisms, spatial controls, monitoring implications, and uncertainties. Section 5 summarizes the main conclusions.
2. Data and Methods
2.1. Study Area
The Dongjiang River is one of the major tributaries of the Pearl River system in southeastern China (Figure 1). It originates in Xunwu County, Jiangxi Province, and flows southward through Guangdong Province. The basin is a critical water source for major cities in the Guangdong–Hong Kong–Macao Greater Bay Area. The basin covers approximately 35,340 km² and has a terrain that generally descends from north to south. Mountainous areas dominate the northern and northeastern parts of the basin, hills and tablelands are widely distributed in the central region, and the southern part gradually transitions into the alluvial plains of the Pearl River Delta.
Soil types in the basin exhibit pronounced spatial heterogeneity due to differences in geological conditions and parent materials (Figure 1). According to the FAO-WRB classification system, soils in the basin are dominated by low-activity strongly acidic soils. Ferric low-activity strongly acidic soils (ACf) are mainly distributed in the northern mountainous area, while haplic low-activity strongly acidic soils (ACh) are concentrated in the central hilly zone and eastern part of the basin. Together, these soil types cover most of the basin. Anthrosols (ATc) dominate the southwestern plains and river valley areas; these soils generally have relatively good water-holding capacity but slow drainage. Leptosols (LP), characterized by shallow soil layers and limited water storage capacity, occur locally in northern mountainous areas. Cambisols (CMd, CMo, and CMu), Fluvisols (FLe), and Gleysols (GLe) are also scattered across the basin. In terms of soil texture, ACf and ACh soils in the mountainous and hilly regions are predominantly sandy loam to loam, with relatively coarse texture and high sand content, while ATc and FL soils in the southwestern plains and river valleys are generally finer-textured, ranging from silt loam to silty clay loam, with higher silt and clay fractions [29]. Differences in soil texture, pore structure, and unsaturated hydraulic conductivity among these soil types provide an important substrate basis for the spatial heterogeneity of root-zone soil moisture loss.
The Dongjiang River Basin has a typical subtropical monsoon climate, with a mean annual temperature of approximately 21 °C and mean annual precipitation of about 1500–2000 mm. Approximately 80% of annual precipitation occurs during the flood season from April to September [29,30]. During this period, high evaporative demand, abundant energy supply, and seasonal water deficits may jointly promote rapid soil moisture depletion [31]. In recent years, climate anomalies, land surface changes, and increasing water demand have contributed to increasing drought frequency and intensity in the basin, posing growing challenges to regional water supply security and ecosystem health [32,33]. The Dongjiang River Basin therefore provides a representative humid-region setting for investigating root-zone soil moisture loss stages and physically informed thresholds under flash drought conditions.
2.2. Data Sources
The soil moisture data used in this study were obtained from the ERA5-Land reanalysis dataset released by the European Centre for Medium-Range Weather Forecasts (ECMWF) [34]. ERA5-Land is the land component of the ERA5 global climate reanalysis system. It reconstructs global land surface processes at high spatial and temporal resolution and provides long-term land surface variables from 1950 to the present. The dataset has a spatial resolution of 0.1° × 0.1° and an original hourly temporal resolution. Previous work has validated ERA5-Land soil moisture against the Chinese Land Data Assimilation System (CLDAS-V2.0) in the Dongjiang River Basin, demonstrating its good applicability in this region [10,32]. ERA5-Land was selected for this study because its long temporal coverage (1950–2025) provides a sufficiently large sample of drying events, which is essential for robustly identifying the stage structure of the soil moisture loss function. This study extracted hourly volumetric soil water content data for the Dongjiang River Basin from 1950 to 2025 for three soil layers: 0–7 cm, 7–28 cm, and 28–100 cm. A thickness-weighted averaging method was used to integrate these layers into mean root-zone soil moisture for the 0–100 cm profile [33]. The 0–100 cm root zone is adopted here as it represents the standard root-zone depth used in land surface models and flash drought studies [27,28]. After masking by the basin boundary, 318 valid grid cells were retained for analysis (Figure 1). Each grid cell was analyzed independently in the subsequent workflow. All soil moisture data were aggregated to a 7-day time step to match the rapid evolution characteristics of flash droughts [1,9,10].
Reference soil hydraulic parameters were obtained from the China Soil Hydrological Dataset (CSHD) for Land Surface Process Models released by the Yellow River Data Center of China [35]. This dataset estimates soil hydraulic parameters for China using pedotransfer functions based on sand, silt, clay, organic matter, and bulk density. It has a spatial resolution of approximately 1 km (0.0083° × 0.0083°). Vertically, it includes seven soil layers: 0–4.5 cm, 4.5–9.1 cm, 9.1–16.6 cm, 16.6–28.9 cm, 28.9–49.3 cm, 49.3–82.9 cm, and 82.9–138.3 cm. From this dataset, two specific hydraulic parameters were extracted: field capacity (SMFC, corresponding to the water content at -33 kPa matric potential [35]) and wilting point water content (SMWP, corresponding to the water content at -1500 kPa matric potential [35]). These two parameters were selected because they represent the upper and lower bounds of plant-available water and serve as physically meaningful benchmarks for evaluating the estimated thresholds [22,23]. The extracted values were spatially aggregated to 0.1° × 0.1° to match the ERA5-Land grid. Because the seventh layer contains many missing values and contributes only approximately 17.1 cm within the 0–100 cm depth range, the top six layers (0–82.9 cm) were integrated using thickness-weighted averaging to approximate root-zone hydraulic parameters.
2.3. Construction of the Soil Moisture Loss Rate Function
The soil moisture loss rate function, L(SM), characterizes the relationship between the instantaneous soil water content and the rate at which moisture is lost from the soil profile [24,25]. It is formally defined as the conditional expectation of the soil moisture loss rate given a specific moisture state:
where E[·] denotes the mathematical expectation; ΔSM/Δt = SM(t) − SM(t + 1)represents the absolute soil moisture loss over one 7-day interval (m³/m³ per 7 days); and SM(t) and SM(t + 1) are the root-zone volumetric water contents at the t-th and (t + 1)-th 7-day time steps, respectively. By conditioning the loss rate on the current water content, this formulation expresses soil moisture loss as a function of moisture state, providing a theoretical basis for identifying stage-like variation in soil moisture loss [24,25].
To estimate the empirical L(SM) function for each grid cell, it is necessary to isolate net drying periods from the full soil moisture time series. This step excludes non-drying processes such as precipitation infiltration and lateral redistribution, which may obscure the loss-rate signal. For each grid cell, net drying time steps were identified from the 7-day root-zone soil moisture series according to the following criterion:
This condition ensures that only periods of net soil moisture depletion are included, regardless of whether the depletion occurs during flash droughts or slowly evolving droughts. Restricting samples to a specific drought type would strongly truncate the observable range of SM, making it difficult to identify stage transitions at both wet and dry ends. Therefore, this study adopted a full-period drying-step extraction strategy to maximize the dynamic coverage of the empirical L(SM) dataset. For each drying time step satisfying Equation (2), a paired observation {SM(t), ΔSM/Δt} was recorded, where SM(t) is the soil moisture content at the beginning of the drying process and ΔSM/Δt is the moisture loss rate during the subsequent 7-day interval. Aggregating all such paired observations produced the empirical L(SM) scatter dataset for each grid cell.
2.4. Non-Parametric Identification of L(SM) Curve Morphology
Conceptually, the L(SM) curve can be divided into four stages [20,21,24] (Figure 2). The first is the gravitational drainage stage (G), in which soil water content is near saturation, water loss is mainly driven by gravitational potential gradients, and the loss rate is high and relatively stable. The second is the wet stage (W), in which water content lies between field capacity and the critical point, evapotranspiration is controlled mainly by atmospheric evaporative demand, and the loss rate remains relatively steady. The third is the transitional stage (T), in which soil water content falls below the critical point, soil hydraulic conductivity and plant stomatal conductance decline, evapotranspiration becomes increasingly limited by water availability, and the loss rate decreases markedly with decreasing water content. The fourth is the dry stage (D), in which soil water content approaches or falls below the wilting point, plant transpiration nearly ceases, weak residual soil evaporation remains, and the loss rate tends to level off.
To identify the actual morphology of L(SM) curves for each grid cell in the Dongjiang River Basin, this study used a non-parametric approach based on conditional mean comparison. This method does not require a predefined functional form. Instead, it determines whether statistically significant differences in soil moisture loss rates exist among different moisture intervals. The procedure consisted of three steps.
- Step 1: Preliminary segmentation. For each grid cell, the range of SM values from drying time steps was divided into four quantile-based intervals with approximately equal probability mass, Q1, Q2, Q3, and Q4. These intervals were defined by the 25th, 50th, and 75th percentiles of the drying-step SM distribution:
where SM₂₅th, SM₅₀th, and SM₇₅th correspond to the 25th, 50th, and 75th percentiles of the drying-step SM distribution for a grid cell, respectively. This quantile-based partitioning method ensures that each interval contains approximately the same number of observations, regardless of the skewness of the SM distribution. Because soil texture and local climate vary considerably across the Dongjiang River Basin, the range and central tendency of the SM distribution exhibit pronounced spatial variability among grid cells [31,33]; employing adaptive quantile thresholds thus ensures that the morphological identification method maintains consistent statistical power across the entire basin.
- Step 2: Testing for differences between adjacent intervals. Welch's two-sample t-test [36] was used to compare the mean soil moisture loss rates between each pair of adjacent intervals. This method does not assume equal variances between samples and is therefore appropriate for the heteroscedasticity commonly present in L(SM) scatter data [24]. For each adjacent intervals pair (Qi, Qi+1), the null hypothesis is:
where μQi is the population mean of L(SM) within the i-th interval. If the null hypothesis was rejected (p < 0.05), a statistically significant stage transition was inferred at the boundary between the two intervals. If the result was not significant (p ≥ 0.05), the two adjacent intervals were considered to have similar water loss characteristics and were merged into the same morphological stage.
- Step 3: Morphological type classification. Based on the combination of significant and non-significant test results for the three adjacent interval pairs (Q₁–Q₂, Q₂–Q₃, Q₃–Q₄), each grid cell was assigned a morphological type (Table 1). The types were arranged according to the completeness of the piecewise structure, ranging from a full four-stage structure to a single monotonic trend. Grid cells whose test results did not conform to any canonical pattern were classified as indeterminate. Indeterminate and F-type grid cells were excluded from subsequent breakpoint threshold estimation.
2.5. Critical Threshold Estimation
According to the morphological type of each grid cell, a corresponding piecewise linear model was configured. For the complete FCFC type, the model contains three breakpoints: SMGW, representing the G–W boundary; SMWT, representing the W–T boundary; and SMTD, representing the T–D boundary. For simplified types lacking certain stages, the number of breakpoints was reduced accordingly. The functional form of each segment was determined according to its physical characteristics. For the W and D stages, where the loss rate is relatively stable, a constant function was fitted. For the G and T stages, where the loss rate varies monotonically with soil water content, a first-order linear function was fitted.
Breakpoint positions were estimated using an exhaustive grid search. The search range of each breakpoint was adaptively defined according to the soil moisture distribution of each grid cell to ensure physically reasonable and locally appropriate candidate ranges. The search step was set to 0.001 m³/m³. For a set of candidate breakpoints (b1, b2, b3), with b1 < b2 < b3, b1, corresponding to SMTD, was searched within the 5th–25th percentile range of the drying-step SM distribution. This range represents the dry end where wilting-related transition occurs. b2, corresponding to SMWT, was searched within the 25th–50th percentile range to capture the critical transition from wet to transitional conditions. b3, corresponding to SMGW, was searched within the 50th–95th percentile range near the wet end associated with field capacity. This adaptive strategy avoids unrealistic breakpoint positions that may occur when fixed search bounds are applied across different soil and climatic conditions. The objective function was the total sum of squared errors (SSE) across all segments:
where m is the number of segments, depending on the morphological type, and SSEₖis the sum of squared differences between observed and fitted values within the k-th segment, obtained through least-squares fitting [24,25]. The optimal breakpoint combination was defined as the one minimizing total SSE:
Because L(SM) scatter data are often heteroscedastic, a single point estimate cannot fully represent uncertainty in breakpoint estimation. Therefore, bootstrap resampling [37] with replacement was used to quantify confidence intervals. For each grid cell, 1000 bootstrap samples were generated from the original paired dataset {SM(t), ΔSM/Δt}, each with the same sample size as the original dataset. The full grid-search optimization procedure was then applied independently to each bootstrap sample, producing 1000 sets of breakpoint estimates. The median of the bootstrap distribution was used as the point estimate, while the 2.5th and 97.5th percentiles were used to construct the 95% confidence interval. A narrower confidence interval indicates a clearer L(SM) stage structure and a more reliable breakpoint estimate, whereas wider intervals generally indicate a limited soil moisture dynamic range or insufficient drying-step samples.
The complete methodological workflow, including root-zone soil moisture preprocessing, empirical L(SM) construction, non-parametric morphology identification, piecewise breakpoint estimation, and comparison with statistical percentile thresholds and hydraulic reference parameters, is summarized in Figure 3.
3. Results
3.1. Dominant L(SM) Curve Morphology and Its Spatial Pattern
Among the 318 grid cells in the Dongjiang River Basin, 294 grid cells (92.5%) were classified as the CFC type, corresponding to a W–T–D three-stage structure, while only 24 grid cells (7.5%) were classified as the F type, corresponding to a monotonic structure. As shown in Figure 4, the CFC type overwhelmingly dominates across the basin and exhibits a relatively uniform spatial distribution, with no strong regional clustering. This pattern is consistent with the subtropical monsoon climate background of the Dongjiang River Basin. Under such humid climatic conditions, annual precipitation is abundant, and root-zone soil moisture has a broad dynamic range that can cover water states from the wet energy-limited stage to the dry residual evaporation stage [38,39]. This allows the W–T–D three-stage structure to be clearly identified statistically. In contrast, F-type grid cells are primarily concentrated in two areas: the low-lying plains of the southern basin and the northwestern basin margin (Figure 4). The southern cluster is the most prominent and is strongly associated with intense urbanization in the Pearl River Delta, where high impervious surface coverage tends to homogenize surface water supply and consumption processes, weakening the nonlinear coupling between soil moisture supply and atmospheric evaporative demand during drying. A smaller cluster of F-type grid cells is also present in the northwestern basin, where localized land use and drainage conditions may similarly suppress stage-transition signals in the L(SM) scatter. As a result, neither cluster shows statistically significant stage-wise transitions, and both exhibit monotonic loss-rate behavior.
Figure 5 shows observed L(SM) curves for representative grid cells of the two morphological types. For the CFC-type grid cell (Figure 5a), the binned median curve exhibits a clear three-stage pattern. In the W stage (SM > SMWT), the curve is relatively flat. In the T stage (SMTD ≤ SM < SMWT), the loss rate decreases monotonically with decreasing soil moisture. In the D stage (SM < SMTD), the curve flattens again. By contrast, the F-type grid cell (Figure 5b) shows an approximately monotonic decreasing trend, close to a linear fit, with no statistically significant stage transition.
3.2. Estimated Critical Thresholds of the L(SM) Function
Based on the W–T–D three-stage framework of the L(SM) function, the W–T boundary threshold SMWT and the T–D boundary threshold SMTD were estimated for the 294 CFC-type grid cells. The remaining 24 F-type grid cells were excluded from threshold estimation because their L(SM) functions did not exhibit identifiable stage structures. As shown in Figure 6a, SMWT ranges from 0.30 to 0.45 m³/m³, with a basin mean of 0.36 m³/m³ and a standard deviation of 0.04 m³/m³. The mean width of the bootstrap 95% confidence interval is 0.02 m³/m³, indicating generally high stability of the estimates. Approximately 49.3% of grid cells have SMWT values concentrated in the 0.31–0.35 m³/m³ interval, with a modal value of approximately 0.33 m³/m³, accounting for 17.4% of grid cells. The distribution is right-skewed, with the high-value tail extending to 0.45 m³/m³. Figure 6b shows that SMTD ranges from 0.20 to 0.36 m³/m³, with a basin mean of 0.27 m³/m³ and a standard deviation of 0.04 m³/m³. The mean width of the bootstrap 95% confidence interval is 0.02 m³/m³, slightly lower than that of SMWT. The frequency distribution exhibits a distinct bimodal pattern, with the primary peak in the 0.22–0.24 m³/m³ interval, corresponding to a modal value of approximately 0.23 m³/m³, accounting for 15.7% of grid cells, and a secondary peak in the 0.32–0.34 m³/m³ interval. This bimodal distribution may be related to spatial heterogeneity in soil texture within the basin.
Spatially, high SMWT values (> 0.42 m³/m³) are mainly concentrated in the mountainous northwestern basin (Figure 7a). Medium-high values (0.36–0.42 m³/m³) extend toward the central-southern and southeastern parts, while the northeastern basin is dominated by values of 0.33–0.36 m³/m³. Low values (< 0.33 m³/m³) mainly occur in the central and southwestern basin. The spatial distribution of SMTD (Figure 7b) is highly consistent with that of SMWT. The northwestern mountainous region is characterized by high values (> 0.32 m³/m³), the central-southern and southeastern areas are dominated by medium-high values (0.26–0.29 m³/m³), and the central hilly region mainly shows low values (< 0.23 m³/m³).
3.3. Comparison of Different Thresholds
To evaluate the physical consistency of the estimated thresholds and clarify their relationship with commonly used statistical thresholds, the physically informed thresholds SMWT and SMTD were compared with the 40th and 20th percentile thresholds of the root-zone soil moisture time series (SM40th and SM20th), as well as reference soil hydraulic parameters SMFC and SMWP. The results are shown in Figure 8. Excluding the reference SMFC, the other five threshold types exhibit a clear descending hierarchy at the basin-mean level (Figure 8a): SMWT (0.36) > SM40th (0.35) > SM20th (0.30) > SMTD (0.27) > SMWP (0.22) with all values expressed in m³/m³. At the grid-cell scale, 98.6% of grid cells satisfy SMWT > SM40th, and 100% satisfy SMTD < SM20th. This hierarchical pattern indicates that the statistical thresholds are physically reasonable, with SM40th lying below the wet–transitional boundary and SM20th lying above the transitional–dry boundary. Consequently, the statistical percentile thresholds are fully nested within the physically informed thresholds defined by the L(SM) framework. Moreover, SMTD is systematically higher than SMWP, with a mean difference of +0.05 m³/m³, and 83.3% of grid cells satisfy SMTD > SMWP. This is consistent with the eco-physiological understanding that stomatal closure occurs before soil moisture reaches the permanent wilting point [27], further supporting the physical reasonableness of SMTD. It is also noteworthy that 41.1% of grid cells exhibit SMFC < SMWT, with a mean difference (SMFC - SMWT) of +0.02 m³/m³. A possible explanation is that water stored in deeper soil layers provides a continuous supply buffer, allowing evapotranspiration to remain relatively high even after root-zone mean soil moisture falls below the traditionally defined field capacity. This may shift the actual transition from energy-limited to water-limited conditions to a higher root-zone water content.
Despite these systematic differences, physically informed and statistical thresholds are strongly correlated (Figure 8b). For the upper threshold pair, the regression of SM40th against SMWT yielded a slope of 0.99 and an intercept of 0.01 m³/m³ (R² = 0.98), indicating an almost one-to-one spatial correspondence with a near-zero offset. For the lower pair, the regression of SM20th against SMTD yielded a slope of 0.96 and an intercept of 0.05 m³/m³ (R² = 0.97), also indicating strong spatial co-variation, with a small positive intercept consistent with the systematic offset of SM20th above SMTD. These results confirm that the two threshold systems respond consistently to common spatial controls, particularly soil texture heterogeneity across the basin, while maintaining the systematic nesting structure discussed above.
Overall, the statistical thresholds capture the central part of the active soil moisture depletion zone, corresponding to the core transition where evapotranspiration shifts from energy limitation to soil moisture limitation. This suggests that the percentile-based threshold method for flash drought identification has a reasonable physical basis in the Dongjiang River Basin. However, the comparison also reveals that the statistical thresholds do not fully cover the initial segment between SMWT and SM40th or the terminal segment between SM20th and SMTD. This indicates limitations in their ability to fully characterize the physical drying process, especially at the terminal stage of drought development.
4. Discussion
4.1. Formation Mechanisms of Root-Zone L(SM) Curve Morphology
This study found that the CFC type, corresponding to a W–T–D three-stage structure, dominates root-zone L(SM) curves in the Dongjiang River Basin, accounting for 92.5% of all grid cells. This differs from the four-stage structure reported for shallow soils [20,21,24], because the gravitational drainage stage is absent at the root-zone scale. The difference reflects the distinct physical mechanisms of soil moisture loss at different depths. In shallow soils, near-saturated water content can generate strong gravitational potential gradients, causing rapid downward drainage of free water and forming a high loss-rate plateau independent of evapotranspiration (Figure 2). At the root-zone scale, however, gravitational drainage mainly appears as vertical redistribution within the soil column rather than as net water loss from the entire 0–100 cm profile. It is therefore not directly observable in the root-zone total water balance. In addition, the physical meaning of the W stage differs between shallow and root-zone soil moisture. Even after shallow soil water content falls below field capacity, deeper soil layers may still store substantial plant-available water, allowing the overall root-zone moisture loss rate to remain stable across a relatively wide moisture range. This expands the wet-stage domain at the root-zone scale.
These findings extend the L(SM) morphological classification framework to the root-zone scale and reveal its strong depth dependence. This is consistent with the multi-climate zone evaluation reported by Paul et al. [22]. For flash drought monitoring, which relies primarily on root-zone soil moisture as a core variable, independently identifying L(SM) morphology and stage-transition thresholds at the root-zone scale is therefore necessary for linking physical mechanisms with monitoring practice.
Several uncertainties should be acknowledged. Root-zone L(SM) identification may be affected by uncertainties in ERA5-Land deep soil moisture simulations. The 28–100 cm layer contributes 72% of the root-zone weighting but is model-simulated rather than directly constrained by observations. During prolonged droughts, simulated deep soil moisture may respond slowly, potentially leading to systematic overestimation of SMWT. Furthermore, the uniform 0–100 cm root-zone assumption does not account for variations in rooting depth among different vegetation types, which may influence the estimated thresholds at specific locations. In addition, reference hydraulic parameters SMFC and SMWP were indirectly estimated using pedotransfer functions and spatial aggregation, which may introduce additional uncertainty. Future studies should incorporate in situ deep soil moisture observations, vegetation-specific rooting depth information, and high-resolution soil hydraulic parameters for independent validation and bias correction.
4.2. Controls on the Spatial Differentiation of Physically Informed Thresholds
SMWT and SMTD exhibit highly consistent spatial distribution patterns (Figure 7), with high values concentrated in the northwestern mountainous region and relatively low values in the central and eastern basin. This spatial coherence suggests that the factors controlling the two transition points overlap substantially. Soil texture is likely the primary control. Physically, SMWT represents the critical water content at which evapotranspiration shifts from energy-limited to soil moisture-limited conditions, whereas SMTD represents the lower boundary at which root-zone moisture depletion severely suppresses evapotranspiration. Soils with higher clay content generally have stronger capillary water-holding capacity and therefore higher water contents at both transition points. Sandy soils show the opposite tendency [19,40]. In the Dongjiang River Basin, the northwestern mountainous region is dominated by relatively fine-textured ACh soils, while the central and southern parts are mainly covered by ACf soils with relatively higher sand content (Figure 1). This soil texture pattern is broadly consistent with the spatial distributions of SMWT and SMTD.
It should be noted that this discussion focuses solely on soil texture, as it is the primary factor directly examined in this study. Other factors, such as topography and vegetation, were not explicitly incorporated in the analysis but may also contribute to the observed spatial heterogeneity. A quantitative attribution of the differences between the estimated thresholds and the reference hydraulic parameters to specific soil textural or land cover factors remains to be explored and represents an important direction for future work.
4.3. Implications for Flash Drought Monitoring
The comparison between physically informed and statistical thresholds demonstrates that the percentile-based method for flash drought identification has a physical basis in the Dongjiang River Basin. The statistical thresholds are fully nested within the physically informed transition zone defined by the L(SM) framework, and the two threshold systems co-vary strongly, with correlation coefficients of 0.98–0.99. This supports the reasonableness of percentile thresholds from a physical perspective. However, the statistical threshold window from SM40th to SM20th, with an average width of approximately 0.05 m³/m³, covers only about 55.6% of the physical transition zone from SMWT to SMTD, which has an average width of approximately 0.09 m³/m³. Monitoring blind spots therefore exist at both ends of the physical drying process. At the upper end, SM40th is systematically lower than SMWT, with a mean difference of 0.01 m³/m³, indicating that the initial stage of physical drying may be overlooked by the statistical method. At the lower end, SM20th is systematically higher than SMTD, with a mean difference of 0.03 m³/m³, implying that vegetation may not yet have entered severe water stress when the statistical drought threshold is triggered. The lower-end bias is approximately three times larger than the upper-end bias, suggesting that the percentile method is better at capturing flash drought onset than representing terminal drought severity.
From a regional management perspective, the pronounced spatial heterogeneity of physically informed thresholds has important implications. When a uniform percentile threshold is applied across the basin, the actual physical drying stage represented by that threshold may differ among grid cells. In areas with high SMWT, such as the northwestern mountainous region, the physical drying process may already have advanced further when the statistical warning is triggered, potentially compressing warning lead time. In lower-threshold areas of the central basin, the statistical threshold may be closer to the physically informed critical state. Therefore, physically informed thresholds could be used either as independent monitoring indicators or as correction benchmarks for regionally adapting statistical percentile thresholds. This would improve the precision and physical interpretability of flash drought monitoring.
5. Conclusion
Using ERA5-Land reanalysis data from 1950 to 2024, this study constructed root-zone (0–100 cm) soil moisture loss rate functions, L(SM), for the Dongjiang River Basin. A non-parametric morphological identification method combined with piecewise linear breakpoint estimation was used to identify dominant root-zone L(SM) curve morphologies, estimate physically informed critical thresholds, and compare them with statistical percentile thresholds and reference soil hydraulic parameters. The main conclusions are as follows.
(1) Root-zone L(SM) curves in the Dongjiang River Basin are overwhelmingly dominated by the W–T–D three-stage structure, corresponding to the CFC type. The gravitational drainage stage, commonly identified in shallow soils, is absent at the 0–100 cm root-zone scale. This indicates strong depth dependence in L(SM) curve morphology. At the root-zone scale, gravitational drainage mainly represents vertical redistribution within the soil column rather than net water loss, making the three-stage framework more appropriate for describing root-zone soil moisture dynamics.
(2) Physically informed thresholds of root-zone L(SM) show strong spatial heterogeneity across the basin, primarily controlled by soil texture. The basin-mean SMWT is 0.36 m³/m³, and the basin-mean SMTD is 0.27 m³/m³. The mean widths of the bootstrap 95% confidence intervals are 0.03 and 0.02 m³/m³, respectively, indicating relatively high stability of the breakpoint estimates. The spatial patterns of SMWT and SMTD are highly consistent, with high values mainly in the northwestern mountainous region and low values mainly in the central-eastern basin, matching the spatial distribution of soil texture.
(3) Statistical percentile thresholds are fully nested between the physically informed thresholds, and the two threshold systems co-vary strongly, with correlation coefficients of 0.98–0.99. This indicates that the percentile-based statistical threshold method has a reasonable physical basis in the Dongjiang River Basin.
(4) The statistical threshold window covers only about 55.6% of the physically informed transition zone and shows monitoring blind spots at both upper and lower ends. This indicates that the percentile method is better at capturing flash drought onset than at characterizing terminal drought severity, and reveals its limitations in fully representing the later stages of drought development.
This study extends the L(SM) morphological classification framework to the root-zone scale, reveals its depth dependence, and clarifies the physical basis and limitations of percentile-based statistical thresholds. The estimated physically informed thresholds provide physically interpretable reference benchmarks for flash drought monitoring in the Dongjiang River Basin and may support regional adaptation of statistical threshold methods.
Author Contributions
Conceptualization, Q.H.; methodology, Q.H. and L.K; software, S.Y.; validation, Q.H. and L.K.; formal analysis, Q.H.; investigation, Q.H. and X.L.; data curation, S.Y.; writing—original draft preparation, Q.H.; writing—review and editing, Q.H., L.K., and S.Y.; visualization, Q.H.; supervision, L.O.; project administration, Q.H.; funding acquisition, Q.H., L.K, S.Y., and L.O. All authors have read and agreed to the published version of the manuscript.
Funding
This research was funded by the Shenzhen Polytechnic University Scientific Research Supporting Project (No. 6022310035K), the Major Science and Technology Project of the Ministry of Water Resources of China (No. SKS-2025037), and the Annual School-Level Project of Shenzhen Polytechnic University (No. 6024310013K), the Natural Science Foundation of Guangdong Province, China (No. 2025A1515011110).
Data Availability Statement
The datasets generated and analyzed during the current study can be obtained from the corresponding author with a valid justification.
Acknowledgments
The authors gratefully acknowledge the reviewers and editors for their thorough assessment and invaluable guidance during the revision process.
Conflicts of Interest
The authors declare no conflicts of interest.
References
- Christian, J.I.; Basara, J.B.; Hunt, E.D.; Otkin, J.A.; Furtado, J.C.; Mishra, V.; Xiao, X.; Randall, R.M. Global distribution, trends, and drivers of flash drought occurrence. Nat. Commun. 2021, 12, 6330. [Google Scholar] [CrossRef] [PubMed]
- Yang, C.H.; Li, D.K.; Zhou, X.T.; Zhang, C.F.; Zheng, K.; Wang, Q. Rapid identification and evolution analysis of flash droughts in the eastern coast of China. J. Hydrol. 2025, 652, 132690. [Google Scholar] [CrossRef]
- Shi, R.G.; Liu, Y.; Zhu, Y.; Ren, L.L.; Liu, Y.; Zhang, X.Y.; Zhang, L.Q. Impact of flash droughts on global crop yields considering crop phenology and irrigation conditions. Agr. For. Meteorol. 2026, 373, 110763. [Google Scholar] [CrossRef]
- Ford, T.W.; Labosier, C.F. Meteorological conditions associated with flash drought onset in the eastern United States. Agric. For. Meteorol. 2017, 247, 414–423. [Google Scholar] [CrossRef]
- Goswami, P.; Gallant, A.J.E. Understanding drought onset: What makes flash droughts different from conventional droughts? Weather Clim. Extrem. 2025, 49, 100782. [Google Scholar] [CrossRef]
- Svoboda, M.; LeComte, D.; Hayes, M.; Heim, R.; Gleason, K.; Angel, J.; Rippey, B.; Tinker, R.; Palecki, M.; Stooksbury, D.; et al. The drought monitor. Bull. Am. Meteorol. Soc. 2002, 83, 1181–1190. [Google Scholar] [CrossRef]
- Mo, K.C.; Lettenmaier, D.P. Heat wave flash droughts in decline. Geophys. Res. Lett. 2015, 42, 2823–2829. [Google Scholar] [CrossRef]
- Otkin, J.A.; Svoboda, M.; Hunt, E.D.; Ford, T.W.; Anderson, M.C.; Hain, C.; Basara, J.B. Flash Droughts: A Review and Assessment of the Challenges Imposed by Rapid-Onset Droughts in the United States. Bull. Am. Meteorol. Soc. 2018, 99, 911–919. [Google Scholar] [CrossRef]
- Noguera, I.; Domínguez-Castro, F.; Vicente-Serrano, S.M. Characteristics and Trends of Flash Droughts in Spain, 1961–2018. Ann. N. Y. Acad. Sci. 2020, 1472, 155–172. [Google Scholar] [CrossRef] [PubMed]
- Zhang, L.; Liu, Y.; Ren, L.; Teuling, A.J.; Zhu, Y.; Wei, L.; Yin, H.; et al. Analysis of Flash Droughts in China Using Machine Learning. Hydrol. Earth Syst. Sci. 2022, 26, 3241–3261. [Google Scholar] [CrossRef]
- Yuan, X.; Wang, L.; Wu, P.; Ji, P.; Sheffield, J.; Zhang, M. Anthropogenic Shift towards Higher Risk of Flash Drought over China. Nat. Commun. 2019, 10, 4661. [Google Scholar] [CrossRef] [PubMed]
- Otkin, J.A.; Anderson, M.C.; Hain, C.; Svoboda, M.; Johnson, D.; Mueller, R.; Tadesse, T.; Wardlow, B.; Brown, J. Assessing the evolution of soil moisture and vegetation conditions during the 2012 United States flash drought. Agric. For. Meteorol. 2016, 218–219, 230–242. [Google Scholar] [CrossRef]
- Ford, T.W.; Otkin, J.A.; Quiring, S.M.; Lisonbee, J.; Woloszyn, M.; Wang, J.; Zhong, Y. Flash drought indicator intercomparison in the United States. J. Appl. Meteorol. Climatol. 2023, 62, 1713–1730. [Google Scholar] [CrossRef]
- Shah, J.; Hari, V.; Rakovec, O.; Markonis, Y.; Samaniego, L.; Mishra, V.; Kumar, R. Increasing footprint of climate warming on flash droughts occurrence in Europe. Environ. Res. Lett. 2022, 17, 064017. [Google Scholar] [CrossRef]
- Palagiri, H.; Pal, M. A Percentile-Based Dynamic Threshold Run Theory (pDTRT) for Characterizing Agricultural Drought Using ESACCI Soil Moisture. Water Resour. Manag. 2026, 40, 1–15. [Google Scholar] [CrossRef]
- Osman, M.; Zaitchik, B.F.; Badr, H.S.; Otkin, J.A.; Zhong, Y.; Lorenz, D.; Hain, C.; Holmes, T. Diagnostic classification of flash drought events reveals distinct classes of forcings and impacts. J. Hydrometeorol. 2022, 23, 275–293. [Google Scholar] [CrossRef]
- Feng, J.; Li, J.; Xu, C.-Y.; Wu, X.; Li, Y.; Jiang, Z. Viewing soil moisture flash drought onset mechanism and their changes through XAI lens: A case study in eastern China. Water Resour. Res. 2024, 60, e2023WR036297. [Google Scholar] [CrossRef]
- Koster, R.D.; Suarez, M.J. Soil moisture memory in climate models. J. Hydrometeorol. 2001, 2, 558–570. [Google Scholar] [CrossRef]
- Seneviratne, S.I.; Corti, T.; Davin, E.L.; Hirschi, M.; Jaeger, E.B.; Lehner, I.; Orlowsky, B.; Teuling, A.J. Investigating soil moisture–climate interactions in a changing climate: A review. Earth-Sci. Rev. 2010, 99, 125–161. [Google Scholar] [CrossRef]
- Akbar, R.; Short Gianotti, D.J.; McColl, K.A.; Haghighi, E.; Salvucci, G.D.; Entekhabi, D. Estimation of Landscape Soil Water Losses from Satellite Observations of Soil Moisture. J. Hydrometeorol. 2018, 19, 871–889. [Google Scholar] [CrossRef]
- Dong, J.; Akbar, R.; Feldman, A.F.; Gianotti, D.S.; Entekhabi, D. Land surfaces at the tipping-point for water and energy balance coupling. Water Resour. Res. 2023, 59, e2022WR032472. [Google Scholar] [CrossRef]
- Paul, S.; Feldman, A.F.; Karthikeyan, L. Global scale intercomparison of critical soil moisture estimation pathways and their influence on hydrological regime dynamics and land-atmosphere coupling. Earth's Future 2025, 13, e2025EF006194. [Google Scholar] [CrossRef]
- Xu, Y.; He, Q.; Lu, H.; Yang, K.; Entekhabi, D.; Short Gianotti, D.J. A global dataset of remote sensing-based soil critical point and permanent wilting point. Sci. Data 2025, 12, 722. [Google Scholar] [CrossRef] [PubMed]
- Sehgal, V.; Gaur, N.; Mohanty, B.P. Global surface soil moisture drydown patterns. Water Resour. Res. 2021, 57, e2020WR027588. [Google Scholar] [CrossRef]
- Araki, R.; Morgan, B.E.; McMillan, H.K.; Caylor, K.K. Nonlinear soil moisture loss function reveals vegetation responses to water availability. Geophys. Res. Lett. 2025, 52, e2024GL111403. [Google Scholar] [CrossRef]
- Gong, M.; Davies, J.; Killick, R.; Nemeth, C.; Liu, S.; Quinton, J.N. A changepoint approach to automated estimation of soil moisture drydown parameters from time series data. Sci. Rep. 2025, 15, 42970. [Google Scholar] [CrossRef] [PubMed]
- Fu, Z.; Ciais, P.; Wigneron, J.-P.; Gentine, P.; Feldman, A.F.; Makowski, D.; Viovy, N.; Kemanian, A.R.; Stoy, P.C.; Penning de Vries, F.; et al. Global critical soil moisture thresholds of plant water stress. Nat. Commun. 2024, 15, 4826. [Google Scholar] [CrossRef] [PubMed]
- Gupta, A.; Karthikeyan, L.; Mishra, A. Dominant role of soil moisture regulating vegetation water content during flash drought evolution. Geophys. Res. Lett. 2026, 53, e2025GL119366. [Google Scholar] [CrossRef]
- Zhu, K.; Qiu, X.; Luo, Y.; Dai, M.; Lu, X.; Zang, C.; Zhang, W.; Gan, X.; Zhula, W. Spatial and temporal dynamics of water resources in typical ecosystems of the Dongjiang River Basin, China. J. Hydrol. 2022, 614, 128617. [Google Scholar] [CrossRef]
- Liu, X.; Tan, X.; Wu, X.; Liu, Y.; Wang, D. Regional changes in precipitation concentration, seasonality and intermittency in China. J. Clim. 2025, 38, e70199. [Google Scholar]
- Huang, Q.; Luo, X.; Ouyang, L.; Yuan, S.; Li, P. Key driving factors of ecosystem resilience under drought stress in the Dongjiang River Basin, China. Water 2026, 18, 715. [Google Scholar] [CrossRef]
- Wu, J.F.; Yao, H.X.; Chen, X.H.; Wang, G.X.; Bai, X.Y.; Zhang, D.J. A framework for assessing compound drought events from a drought propagation perspective. J. Hydrol. 2022, 604, 127228. [Google Scholar] [CrossRef]
- Huang, Q.; Ouyang, L.; Wang, Z.; Lin, J. Spatiotemporal evolution, transition, and ecological impacts of flash and slowly evolving droughts in the Dongjiang River Basin, China. Water 2025, 17, 2925. [Google Scholar] [CrossRef]
- Muñoz-Sabater, J.; Dutra, E.; Agustí-Panareda, A.; Albergel, C.; Arduini, G.; Balsamo, G.; Boussetta, S.; Choulga, M.; Harrigan, S.; Hersbach, H.; Martens, B.; Miralles, D.G.; Piles, M.; Rodríguez-Fernández, N.J.; Zsoter, E.; Buontempo, C.; Thépaut, J.-N. ERA5-Land: A State-of-the-Art Global Reanalysis Dataset for Land Applications. Earth Syst. Sci. Data 2021, 13, 4349–4383. [Google Scholar] [CrossRef]
- Dai, Y.; Shangguan, W. A China soil hydraulic dataset for land surface process models. Yellow River Data Center. 2019. Available online: http://huanghe.ncdc.ac.cn.
- Welch, B.L. The generalisation of student's problems when several different population variances are involved. Biometrika 1947, 34, 28–35. [Google Scholar] [CrossRef]
- Efron, B. Bootstrap methods: Another look at the jackknife. Ann. Stat. 1979, 7, 1–26. [Google Scholar] [CrossRef]
- Wang, L.; Guo, S.; Hijri, M.; Farooq, M.; Rehman, A.; Ge, T.; Feng, S.; Wei, Z.; Zhang, J.; Zhao, C.; Kang, S.; Siddique, K.H.M. Enhancing Carbon Restoration and Ecosystem Resilience in Global Drylands via Water-to-Carbon Biotransformation Strategies. Commun. Earth Environ. 2025, 6, 916. [Google Scholar] [CrossRef]
- Wang, L.; Guo, S.; Ge, T.; Mancl, K.M.; Hijri, M.; Iseri, Y.; Lee, S.; Galdos, M.V.; Gan, Y. Plastic Mulch Productivity-Sustainability Tradeoffs and Pathways toward an Eco-Friendly Framework: Insights from a Global Meta-Analysis. Nat. Commun. 2026, 17, 1924. [Google Scholar] [CrossRef] [PubMed]
- Fu, Z.; Ciais, P.; Feldman, A.F.; Gentine, P.; Makowski, D.; Prentice, I.C.; Stoy, P.C.; Bastos, A.; Wigneron, J.P. Critical soil moisture thresholds of plant water stress in terrestrial ecosystems. Sci. Adv. 2022, 8, eabq7827. [Google Scholar] [CrossRef] [PubMed]
Figure 1.
Geographical location, topographic features, soil types, and distribution of study grids in the Dongjiang River Basin.
Figure 1.
Geographical location, topographic features, soil types, and distribution of study grids in the Dongjiang River Basin.
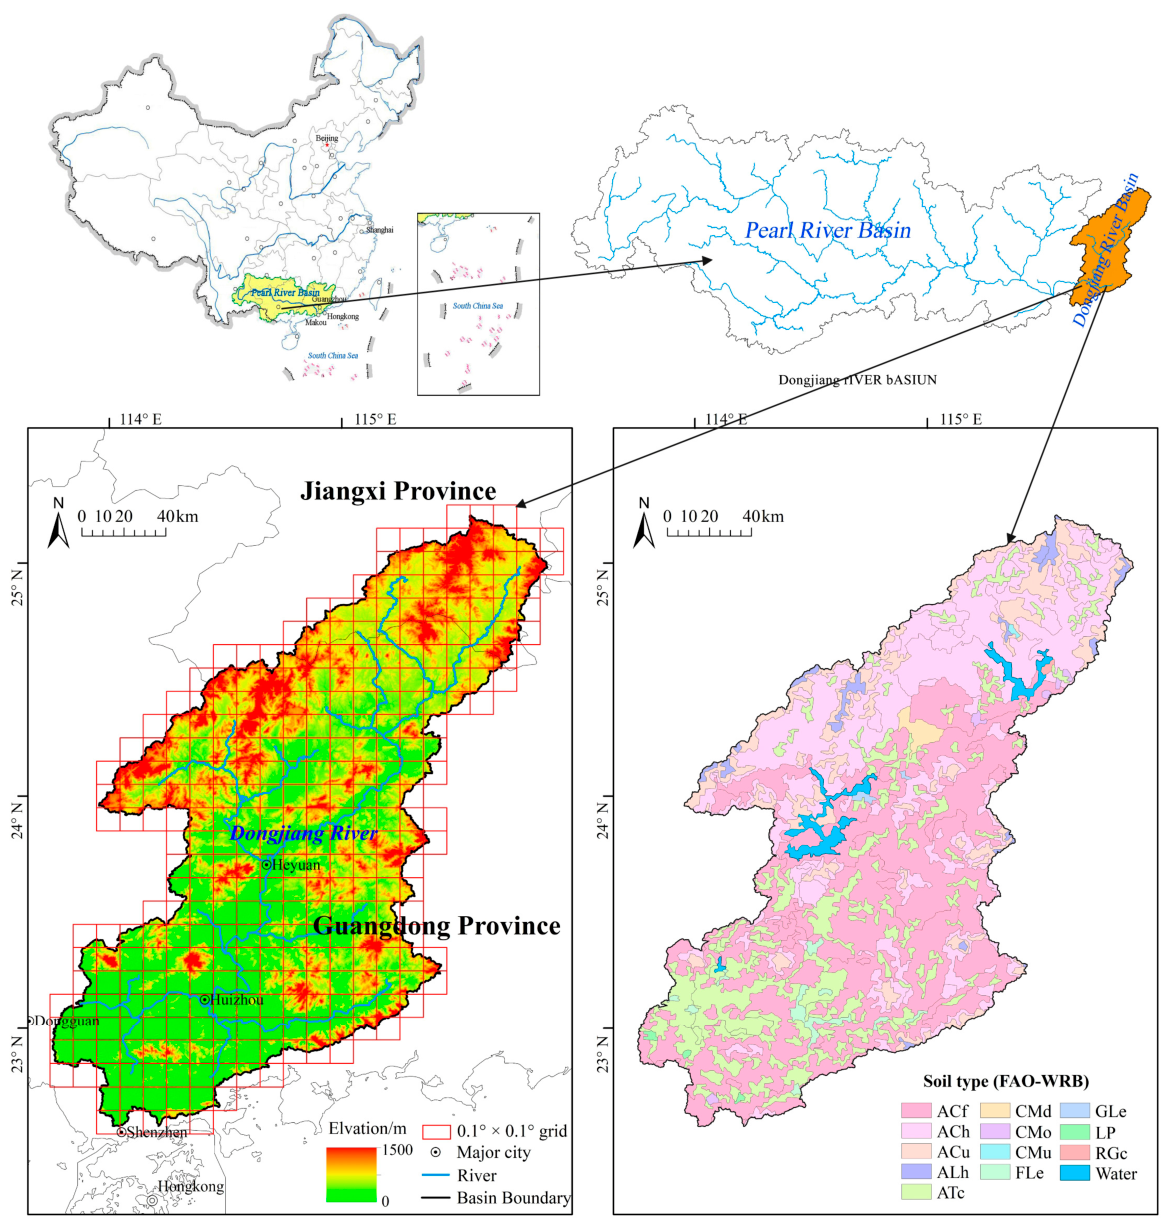
Figure 2.
Schematic diagram of the four-stage theoretical framework of the L(SM) function.
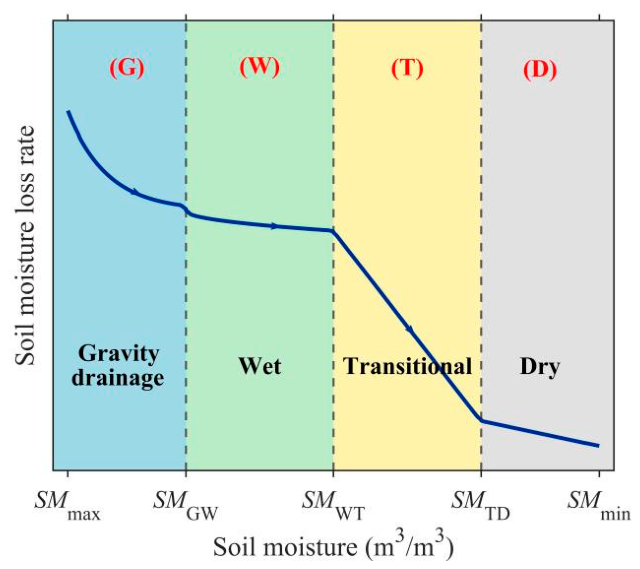
Figure 3.
Technical workflow for estimating physical critical thresholds of root-zone soil moisture loss stages.
Figure 3.
Technical workflow for estimating physical critical thresholds of root-zone soil moisture loss stages.
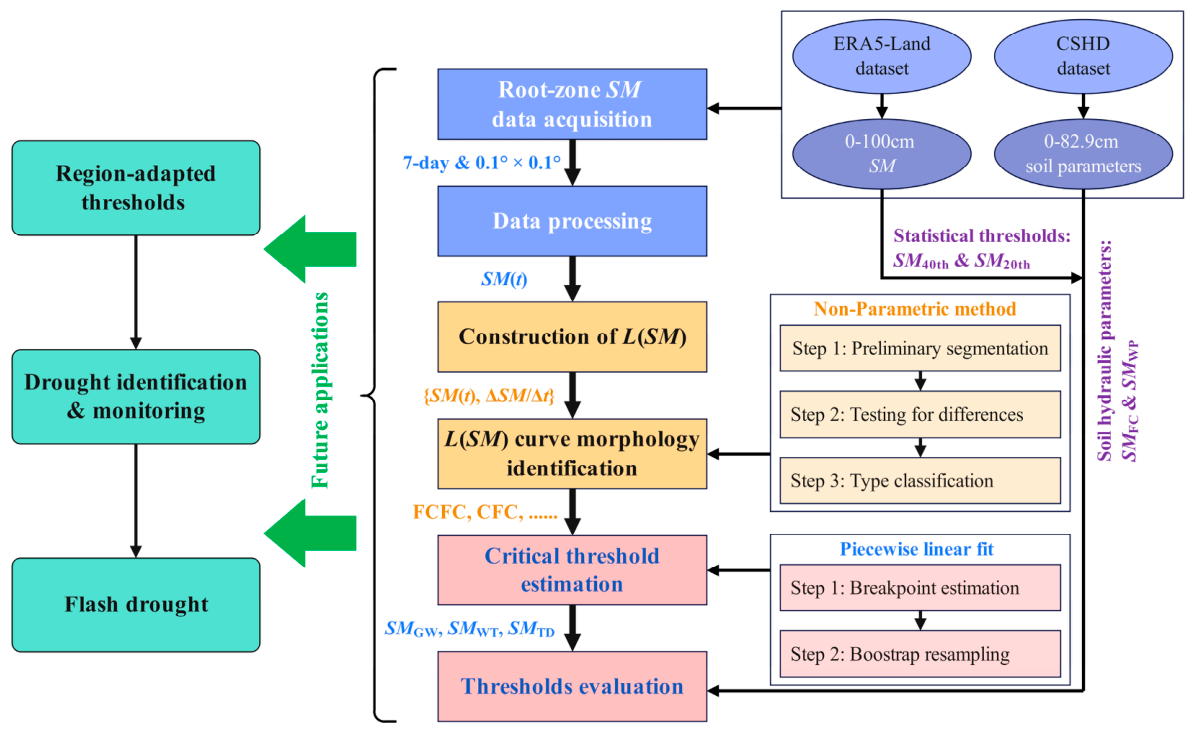
Figure 4.
Spatial distribution of L(SM) curve morphological types.
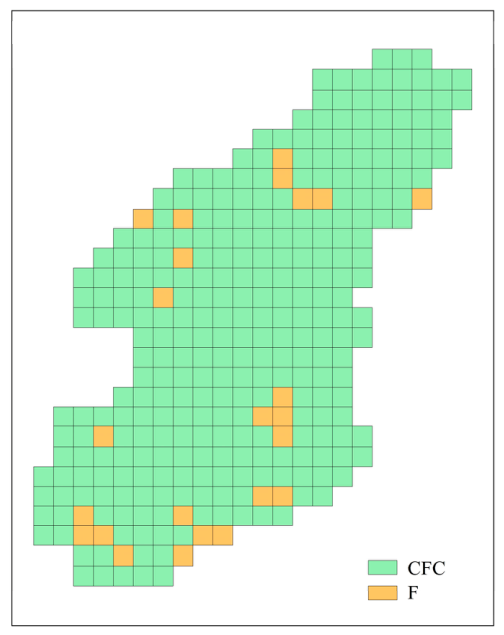
Figure 5.
Observed L(SM) curves for representative grid cells of the two morphological types: (a) CFC type; (b) F type. The light blue shaded band represents the interquartile range (IQR, 25th–75th percentiles) of the observed loss rates within each bin.
Figure 5.
Observed L(SM) curves for representative grid cells of the two morphological types: (a) CFC type; (b) F type. The light blue shaded band represents the interquartile range (IQR, 25th–75th percentiles) of the observed loss rates within each bin.
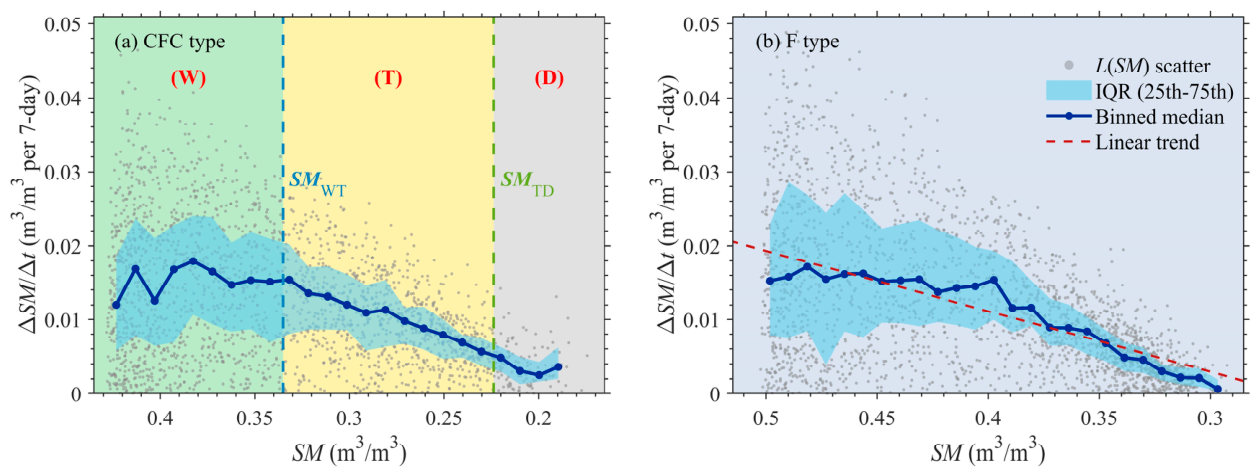
Figure 6.
Frequency distributions of the critical thresholds of the L(SM) function: (a) SMWT; (b) SMTD. CI denotes the Bootstrap 95% confidence interval.
Figure 6.
Frequency distributions of the critical thresholds of the L(SM) function: (a) SMWT; (b) SMTD. CI denotes the Bootstrap 95% confidence interval.
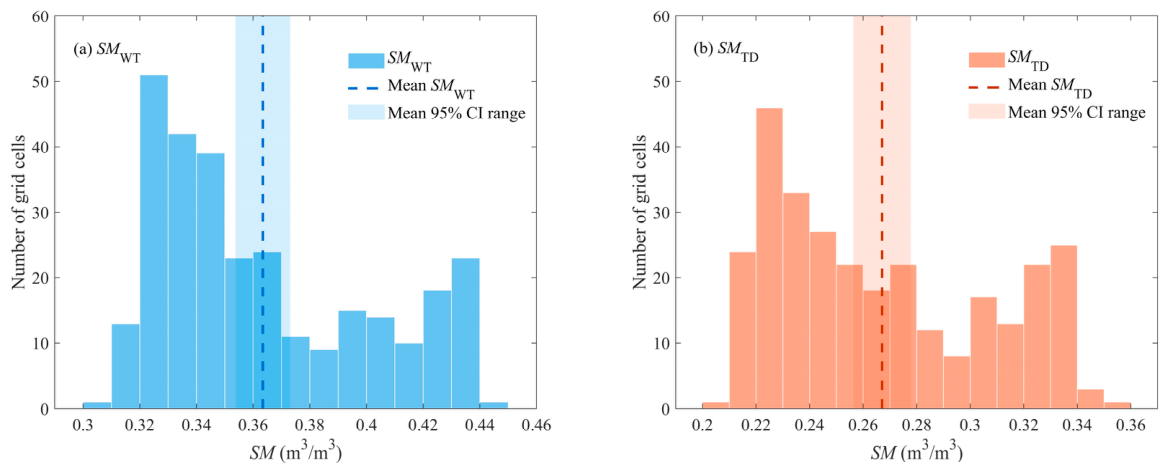
Figure 7.
patial distributions of critical thresholds of the L(SM) function: (a) SMWT; (b) SMTD.
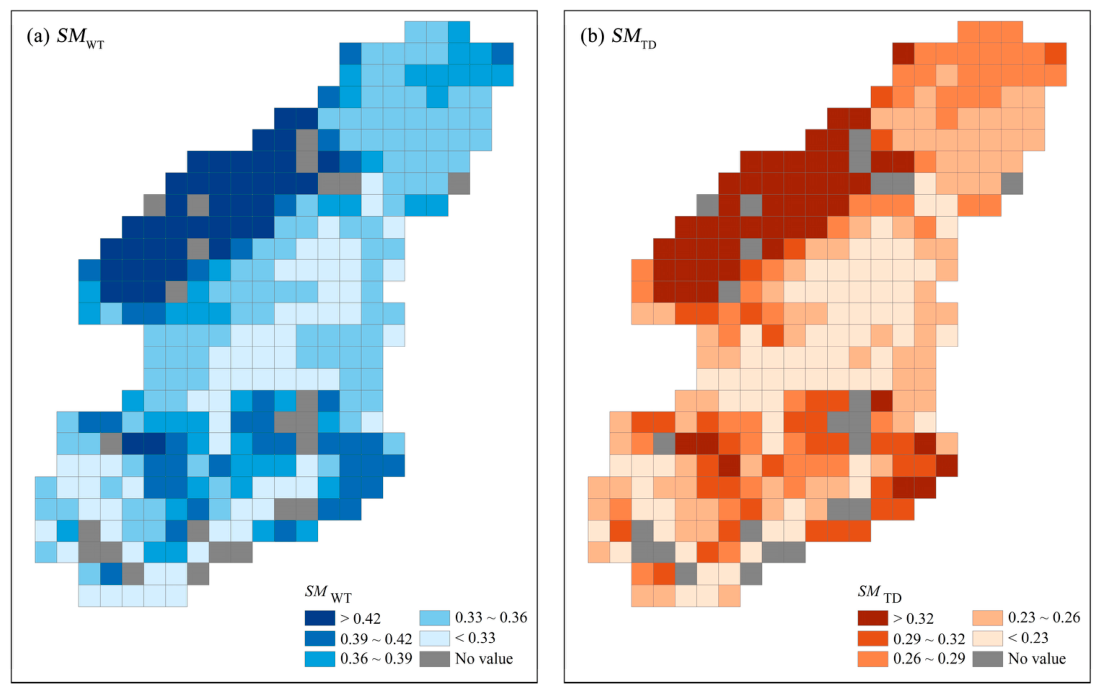
Figure 8.
Comparison of different thresholds: (a) distributions of the six threshold types; (b) linear correlations between physically informed and statistical thresholds.
Figure 8.
Comparison of different thresholds: (a) distributions of the six threshold types; (b) linear correlations between physically informed and statistical thresholds.
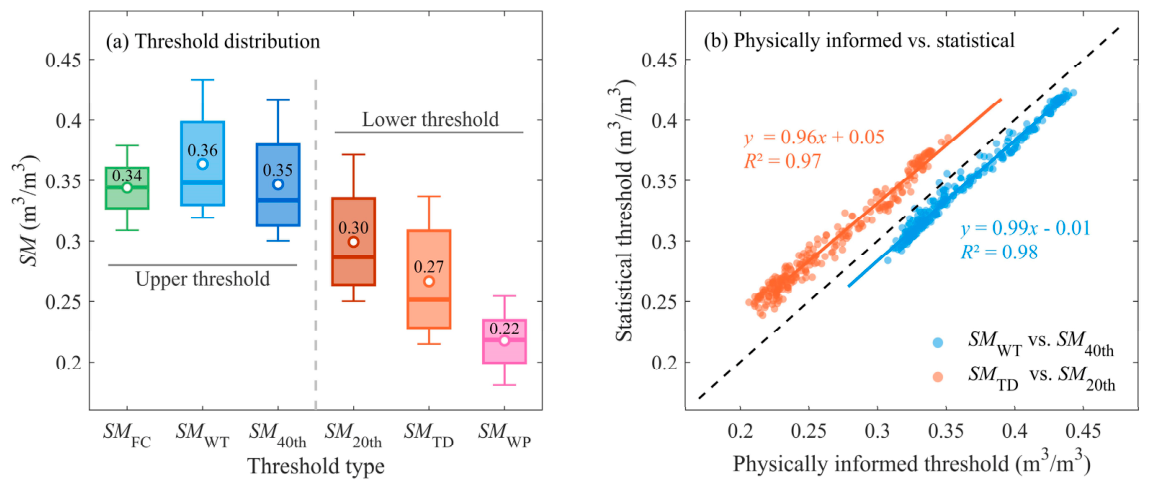

Table 1.
Classification criteria for L(SM) curve morphological types.
| Type | Curve structure | Physical interpretation |
| FCFC | G–W–T–D | All four stages are identifiable: gravitational drainage, energy-limited, water-limited, and residual evaporation. Soil moisture dynamics span a wide range. |
| CFC | W–T–D | No distinct gravitational drainage stage is identified. Soil water content is generally below field capacity, and drainage is mainly controlled by matric potential. |
| FCF | G–W–T | Soil water content rarely falls below the wilting point. The dry stage is absent, and water loss remains within the evapotranspiration-controlled range. |
| FC | G–W | Soil moisture remains persistently high. The transitional and dry stages are absent, and water loss is jointly affected by atmospheric evaporative demand and gravitational drainage. |
| CF | W–T | Soil water content remains at moderately low levels. Both gravitational drainage and dry stages are absent, and water-limited evapotranspiration dominates. |
| F | Single monotonic trend | Soil moisture loss rate changes monotonically with water content without clear stage characteristics, possibly due to homogeneous soil properties or strong anthropogenic disturbance. |
| Indeterminate | No canonical pattern | Reliable classification is precluded by data sparsity, noise, or complex local hydrological processes. |
Disclaimer/Publisher’s Note: The statements, opinions and data contained in all publications are solely those of the individual author(s) and contributor(s) and not of MDPI and/or the editor(s). MDPI and/or the editor(s) disclaim responsibility for any injury to people or property resulting from any ideas, methods, instructions or products referred to in the content. |
© 2026 by the authors. Licensee MDPI, Basel, Switzerland. This article is an open access article distributed under the terms and conditions of the Creative Commons Attribution (CC BY) license.
Copyright: This open access article is published under a Creative Commons CC BY 4.0 license, which permit the free download, distribution, and reuse, provided that the author and preprint are cited in any reuse.