

Submitted:
20 August 2026
Posted:
20 August 2026
You are already at the latest version
Abstract
In the data intelligence era, social media platforms have supplemented emergency decision-making with a wealth of timely data, offering new research paradigms for emergency response. It is crucial to identify and predict the emergency material demand for reducing secondary damage during emergencies. This study aims to fill the research gap in analysing the emergency material demand using real-time social media data. We propose a method for mining an emergency material demand index from social media that takes into account both sentiment intensity and social influence. Furthermore, a real-time material demand forecasting method combined the material demand indexes and Holter-Winter procedure is designed. Using this method, we analysed 3,323,151 tweets on the Weibo Public Opinion Datasets from Dec. 1, 2019, to Apr. 30, 2020, to monitor and forecast the masks demand during the early stages of COVID-19 outbreak. For our mining method, we compare its result with the Wuhan Red Cross Society’s mask distribution data during March 2020, and the index can capture changes in mask demand during certain periods. Our forecasting method outperforms the two baseline models, with a RMSE of 2.58% and a MAPE of 3.01%. Our study provides a tool for dynamically monitoring and forecasting emergency materials demand to ensures sufficient time for the production or distribution of emergency materials.
Keywords:
emergency decision-making
; social media analytics
; sentiment analysis
; Holter-Winter forecasting
1. Introduction
The work of emergency decision-making requires timely collection of relevant data before, during and after a disaster. The application of big data to disaster response is extremely important in accelerating the response speed of rescue operations and reducing disaster losses (Huang et al., 2025). However, the limited human resources available to deploy for field data collection is a persistent problem for emergency decision-making. The development of social media and mining technologies make it possible to collect massive data in real time during and after disasters. Therefore, in the era of big data, many agencies have started leveraging social media as a supplement data source and a new venue to engage with the crowds (Wan et al., 2021). The use of social media data brings both opportunities and challenges to emergency decision-making, which becomes a hot topic (Huang et al., 2025; Tamer et al., 2025).
Many analytics on social media data in the field of emergency management focused on the semantic research (Lamsal et al., 2024), they developed various NLP algorithms to do feature extraction (Jiang et al., 2025), text classification (Boonyarat et al., 2024; Walczak & Dinh, 2025), topic modelling (Li et al., 2025), and sentiment analysis (Win Myint et al., 2024). By harnessing social media data, researchers and policymakers can gain insights into public sentiment and immediate needs (Erokhin & Komendantova, 2024), then to improve the situational awareness (Aziz et al., 2024), crisis communication (London & Matthews, 2022), understanding residents’ response (Hou et al., 2025), evaluate community resilience and recovery (Liu & Mostafavi, 2025) in the face of emergencies. In the scenarios such as wildfire (Arvandi et al., 2025), snowstorm (He et al., 2024), typhoon (Wan et al., 2020), social media analytics is widely used. However, most studies focus on disaster loss or risk assessment in the situation of obtaining information related to emergency decision-making, with limited application to monitoring and predicting emergency material demand. In addition, most studies emphasize improving the accuracy of sentiment analysis algorithms in the realm of social media analytics but often neglect the impact of social attributes on the results of sentiment analysis.
1.1. Research Objective
Our research objectives mainly comprise of two aspects, both are data-driven intelligence emergency decision-making methods, and their raw information come from real-time generated social media data:
- (1)
- To extract emergency material demand dynamically from related social media data.
- (2)
- To forecast the emergency material demand within a time horizon in real time.
1.2. Contributions
To address the above challenges, we propose a real-time material demand forecasting method driven by social media data and apply it to the prediction of mask demand in public health emergency such as COVID-19. The main contributions of this paper are as follows:
- (1)
- A sentiment intensity index mining method based on sentiment analysis of social media data is proposed. This method can capture the emotional intensity of crowd’s emergency material demand, thereby judging changes in demand through variations in sentiment intensity. Existing prediction models primarily consider influencing factors of emergency material demand from objective perspectives, such as disaster conditions (e.g., affected area, number of victims, disaster intensity), basic living supply needs of affected populations, and operational material requirements for rescue personnel, and make predictions using Gray models or machine learning models. In comparison, due to the timeliness of social media data, the proposed prediction method in this paper can improve the speed of emergency response.
- (2)
- A social media data-driven real-time prediction method for emergency material demand is proposed. This method leverages unstructured data, crowd social media data, as raw information and processes it through sentiment analysis and time-series analysis techniques to achieve real-time forecasting of emergency material demand. Compared to traditional prediction models that rely on structured numerical data, the widespread availability of unstructured data—represented by crowd social media data—enriches the information sources for emergency decision-making. The proposed method helps broaden decision-makers' perspectives, thereby improving the accuracy of decisions.
- (3)
- Case studies demonstrate that the sentiment intensity index mined from social media data exhibits temporal trends. By applying time-series analysis to the extracted data, we can uncover temporal dependency features that traditional methods fail to fully exploit. The proposed method more effectively captures dynamic variations and trends within the data, thereby providing more precise support for emergency decision-making.
The paper is organized as follows: Section 2 presents a review of the related works. In Section 3, the research problem is clarified. In Section 4, a method for mining emergency material demand index from social media data and a real-time material demand forecasting method for emergency decision-making driven by social media data are proposed. The application of the proposed method and a comparative analysis are reported in Section 5. Finally, contributions, implications and future work of this study are discussed in Section 6.
2. Related Works
2.1. Emergency Decision-Making Based on Social Media Data
As for the application of social media data in emergency decision-making, relevant research mainly includes the following categories:
- (1)
- In terms of emergency related information acquisition, social media data is used to capture specific disaster situations (Qin et al., 2024) and disaster development trends (Tamer et al., 2025), such as to realize disaster early warning (Soomro et al., 2025), identify disaster sites (Guo et al., 2025), assess disaster losses (Zhou et al., 2025), etc.
- (2)
- In terms of information extraction from social media data, social media data is represented in various forms like text (Khan et al., 2025), image (Gao et al., 2025), video (Rehman et al., 2025), et al. In order to extract useful information from these multimodal data (Rehman et al., 2025), some natural language processing methods or machine learning methods have been improved and integrated into intelligent emergency decision-making methods (Guo et al., 2025; Zeng et al., 2023). Hanny et al. (Hanny & Resch, 2025) proposed a Joint Spatio-Temporal Topic-Sentiment model to identify disaster related themes and emotional clusters, and provide important geographic and temporal information. Soomro et al. (Soomro et al., 2025) used the BERT-BiLSTM-CRF model to extract heatwave data and the extracted heatwave points aligned with 86% of officially documented incidents.
- (3)
- In terms of specific disaster scenarios, social media data are often used in response to urban waterlogging (Boota et al., 2024), public health events (Zhu et al., 2023), earthquake (Tamer et al., 2025), fire (Wan et al., 2021) and other events. These types of emergency events are characterized by sudden occurrence, large number of affected people and wide range of influence and are often hot events on social media. In the process of emergency decision-making, social media data is used to find decision makers, determine their weights (Xu et al., 2024), and evaluate the quality of decisions (Zhu et al., 2023).
Although previous studies have used social media data to locate disaster site and assess post disaster loss, and few studies use social media data to make detailed material demand forecasting and evaluation. Once the emergencies such as urban flood, earthquake occur, the crowd, especially the affected people, will generate a large-scale number of social media data in real time. The released social media data contains the crowd's demand for specific emergency material. It is feasible to capture the social media data of relevant topics and capture the crowd's emotional changes to assess the crowd's real-time demand for emergency material demand (Ragini et al., 2018).
2.2. Material Demand Forecasting Method for Emergencies
Emergency material demand forecasting and prediction is a core of emergency decision-making (Liang et al., 2022). Emergency decision-making is a continuous, uncertain evolution process. Its time variability and uncertainty make the prediction of emergency material demand more complex. The existing methods for forecasting the material demand for emergency material mainly carried out from the following three aspects:
- (1)
- Emergency material demand forecasting based on the case-based reasoning methods. This type of method uses the historical experience and lessons learned from similar problems to solve the current problems. Therefore, to build the case database and find similar cases become the key problem to be solved in such methods. Due to the uncertainty and the time-varying scenario of emergencies, intuitionistic fuzzy sets were introduced to describe the similarities between cases in recently studies (Liang et al., 2022; Shao et al., 2021).
- (2)
- Emergency material demand forecasting based on the Gray prediction methods. This type of method is suitable for short-term prediction scenarios with few available data and no obvious internal relationship between various factors. However, due to less data, the prediction accuracy is generally lower than that of machine learning prediction method. GM(1,1), GM(1,N) and GM(0,N) constitute the classical model family with distinct functional characteristics among Gray prediction models. Yang et al. (Yang et al., 2025) enhanced the prediction accuracy of GM(1,1) model by incorporating the Gauss-Hermite integral. The proposed model was used to predict the population affected by natural disasters in China and then to complete the emergency material demand prediction. Wu et al. found that the hybrid models can improve the prediction accuracy and reduce the failure risks from model selection. They used the Gray correlation analysis and Choquet fuzzy integral to establish a nonlinear combined prediction model (Wu et al., 2024).
- (3)
- Emergency material demand forecasting based on machine learning algorithms. This type of method is based on a large number of training data to predict. Thus, the accuracy of training data and methods is the focus of such methods. To optimize the allocation of emergency resources, Biswas et al. (Biswas et al., 2024) Proposed an artificial intelligence based earthquake relief demand prediction framework, and used minimum angle regression and linear regression models to predict high-risk areas by training historical earthquake data and socio-economic information. Various deep neural network prediction models are applied to the emergency response process, and a log-driven residual time prediction method for the emergency response process is proposed (Cao et al., 2025).
The existing emergency material demand forecasting methods relies more on structured data such as numerical data, and research based on real-time social media data generated on the Internet as raw information to predict emergency material demand is rare.
2.3. Naïve Bayes Classification Model for Sentiment Analysis
There are various models available for the sentiment analysis classification, mainly including the following two categories: methodologies based on lexicons and methodologies based on machine learning techniques (Surya & Subbulakshmi, 2019). The Naive Bayesian classification represents a supervised learning method as well as a statistical method for classification (Parveen & Pandey, 2016). The classification is based on the prior and posterior probability. The reasons for employing Naive Bayes for sentiment analysis in this study are as follows: (1) It effectively handles sparse data, making it suitable for processing text data from social media. (2) It offers fast training and prediction speeds when dealing with large-scale datasets, which is advantageous in situations where time pressure for emergency decision-making is high. (3) It possesses strong scalability, allowing it to adapt to different forms of input data, thereby enhancing the flexibility of its application.
Let denote the ith review on social media, denote the class of positive reviews and denote the class of negative reviews. For a give review with n mutually independent features , the foundational probability P of classifying into the positive class is computed as follows:
where is the baseline probability of any sentence being positive, which is estimated from training data. is the joint probability of observing all features given the positive class under the Naïve Bayes independence assumption. = is the Normalizing constant ensuring probabilities sum to 1. Similarity, the probability of classifying into the negative class is computed as follows:
The flow diagram of sentiment analysis using Naïve Bayes classifier based on the social media data is shown in Figure 1.
2.4. Mann-Kendall Trend Test
The Mann-Kendall trend test is one of the widely used non-parametric tests for detecting trends in the time series. The null hypothesis for the Mann-Kendall trend test is that the data are independent and randomly ordered(Hamed & Ramachandra Rao, 1998). The reasons for adopting the Mann-Kendall (MK) trend test for trend detection based on the following rationale: (1) The MK test is a non-parametric method that does not require the data to conform to any specific distribution. Consequently, it eliminates the need for data transformation and is robust to non-normal distribution data. (2) The test remains statistically valid regardless of the time series' temporal span (short- or long-term), offering exceptional adaptability to datasets of varying scales without compromising analytical rigor. (3) The MK test minimizes the influence of extreme values (outliers) by utilizing median-based statistics rather than mean-dependent measures, ensuring stable trend detection even in noisy datasets.
For two sets of observations and , the statistic MK is calculated as follows:
where . After standardization, the standard statistics Z is calculated as follows:
The standard statistics Z follows a standard normal distribution; the MK trend test concludes that a significant trend exists in the time series when at a given significance level . Otherwise, the null hypothesis (no trend) cannot be rejected (Forthofer & Lehnen, 1981).
2.5. The Holt-Winters Forecasting Procedure
The Holt-Winters forecasting procedure is a simple widely projection method which can cope with trend and variation. There are two types of seasonal model: an additive version which assumes that the seasonal effects are of constant size and a multiplicative version which assumes that the seasonal effects are proportional in size to the local de-seasonalized mean level. In the multiplicative case, the updating formula are as follows:
In the additive case, the updating formula are as follows:
where denotes the baseline value of the series at time t, smoothed by coefficient ; captures the incremental change between periods, smoothed by coefficient ; encodes periodic fluctuations, smoothed by coefficient , where k denotes the seasonal frequency (Chatfield, 1978).
The paper adopts the Holt-Winters forecasting procedure for trend prediction based on the following advantages: (1) The Holt-Winters method supports real-time updates as new data becomes available, enabling dynamic adjustments to evolving patterns. This feature is critical for applications requiring responsive forecasting (e.g., emergency resource demand prediction). (2) Unlike machine learning models (e.g., LSTM, ARIMA), the Holt-Winters method performs effectively with limited historical data, making it ideal for short-term forecasting in scenarios where data availability is constrained. (3) By tuning its smoothing parameters, the Holt-Winters method can be customized to accommodate diverse time series structures. This adaptability allows it to handle heterogeneous datasets without imposing rigid assumptions.
2.6. Evaluation Metrics for Forecasting Accuracy
To evaluate the forecasting accuracy of the proposed social media big data-driven real-time emergency material demand forecasting method, we employ three widely adopted time series evaluation metrics: (1) Root Mean Square Error (RMSE): Measures the square root of the average squared differences between predicted and actual values, penalizing large errors more severely. (2) Mean Absolute Error (MAE): Computes the average absolute deviations, providing a linear-scale interpretation of error magnitude. (3) Mean Absolute Percentage Error (MAPE): Expresses errors as a percentage of actual values, facilitating cross-scale comparisons. These detailed calculation formulas are as follows:
Smaller metric values indicate higher prediction precision. RMSE is sensitive to outliers due to quadratic terms, while MAE offers robustness. MAPE is intuitive but undefined for zero-demand cases (Hyndman & Athanasopoulos, 2018).
3. Problem Description
When an emergency strikes, critical infrastructure damage and mass casualties create urgent, dynamic rescue demands. Traditional assessment methods (e.g., field surveys) are often slow or infeasible in large-scale disasters due to high time pressure and geographical complexity. Social media platforms emerge as a real-time information hub, where affected crowd post distress messages, on-the-ground conditions after the disaster, real-time images and videos from the disaster area, and other data on social media. This information can help emergency management departments make accurate decisions more quickly.
The emergency management department deploys real-time social media data monitoring systems to automatically crawl large amounts of social media information within hours after an emergency event. Using technologies such as natural language processing, the system analyses the posted messages and automatically identifies the demand for emergency supplies (such as food, water, medical supplies, etc.). Due to the lag in the distribution and delivery of emergency materials, we explore how emergency management departments can analyse real-time social media data to automatically identify and predict the demand for emergency material, thus providing a basis for decision-making of emergency material supply deployment.
4. Methods
4.1. A Method for Mining Emergency Material Demand Index from Social Media Data
The social media data is information spontaneously published, commented on and shared online by crowd, containing genuine needs, emotions, and viewpoints of the crowd. It is characterized by real-time relevance and authenticity. It is intuitively that the greater the influence of social media data containing information about emergency material demand, the broader the crowd's demand for that particular emergency material; similarly, the stronger the sentiment tendency reflected in the social media data regarding emergency material demand, the more intense the crowd's need for that emergency material. Based on this, we construct an emergency material demand index from two aspects: the social influence of social media data and its sentiment tendency. The influence of social media data is manifested through user interactions, typically realized through four core functions: posting, following, sharing, and commenting. These four functions represent the influence of social media data in terms of content providers, content consumers, and the breadth and depth of content dissemination. Therefore, combined with sentiment tendency, the emergence material demand index is constructed from four dimensions: the sentiment tendency of comment content, the number of likes, the number of shares, and the number of comments. The framework of the emergency material demand index is illustrated in Figure 2. Algorithm 1 outlines this method in more details.
Definition 1 Social influence index: For a specific review on social media, its social influence index can be constructed from three dimensions: the number of likes, the number of shares, and the number of comments, the formula is as follows:
where , , denote the number of likes, the number of shares, and the number of comments for review during time period t, respectively. The parameters , , represent the corresponding social influence weights for , , , respectively. Where and .
Property: Given that and , then the composite metric . Due to the monotonically increasing property of the natural logarithm function, when the weight coefficient remain constant, the value of increase as grow, which is a behaviour consistent with rea-world observation and realistic intuition.
Definition 2 Sentiment intensity index: For a specific review on social media, its sentiment intensity index is calculated by taking into account the social influence and its probability of positive sentiment. The formula is as follows:
where is the social influence index of the review , and is the probability of positive sentiment for review , calculated by using the Naïve Bayes classification model as shown in formula (1).
Property: Since , it follows that , resulting in . When remains constant, the value of increases as increases; when remains constant, the closer is to 1 or to 0 (indicating a stronger sentiment), the larger the value of , which aligns with practical expectations.
It is logical that the higher the sentiment intensity of the crowd towards a specific emergency material, the stronger the crowd’s demand for these materials. Therefore, based on the sentiment intensity index for a specific emergency material, we construct the emergency material demand index for period t, which in turn allows us to obtain time series data on the emergency material demand.
Definition 3 Emergency material demand index: For a specific review on social media on the period t, its emergency material demand index is calculated as follows:
where is the number of reviews within the decision period t.
Property: since , it follows that , resulting in . is a monotonically increasing function of , meaning its value increases as increases, which aligns with practical expectations.
| Algorithm 1. A method for mining emergency material demand index from social media data. |
|
Input:, and the corresponding time stamp t (the whole decision periods are divided as t=1,2,…,T) The values of parameters α, β, γ. Output:: the value of emergency material demand index at period t. |
|
Steps: # Mining emergency material demand index at period t # step1. Calculate the probability of positive sentiment for reviews according to formula (1) # step2. Calculate the value of social influence index for reviews according to formula (8) # step3. Calculate the value of sentiment intensity index for reviews according to formula (9) # step4. Calculate the value of emergency material demand index for reviews using formula (10) end end |
4.2. A Real-Time Material Demand Forecasting Method for Emergency Decision-Making Driven by Social Media Data
To detect whether the extracted emergency material demand index data with timestamps using algorithm 1 exhibits statistically significant trend characteristics, and to assess its efficacy in reflecting actual demand fluctuations for specific emergency materials, rigorous trend testing analysis must be conducted. This critical step serves as a prerequisite for subsequent prediction modelling—only data that passes the trend test can ensure temporal regularity, thereby supporting reliable demand forecasting.
The data that passes the trend test can not only accurately identify the dynamic changes in emergencies-affected crowd's demand for emergency materials across different periods, but more importantly, enables the prediction of emergency materials requirements in advance through the establishment of forecasting models. This facilitates a paradigm shift from passive response to proactive prevention. Such a forward-looking emergency material forecasting method significantly enhances the efficiency of emergency resource allocation and secures valuable time for emergency response.
Building upon this conceptual framework and extending from the emergency material demand index mining presented in section 4.1, we propose a real-time material demand forecasting method for emergency decision-making driven by social media. Algorithm 2 outlines this method in more detail.
| Algorithm 2. A real-time material demand forecasting method for emergency decision-making driven by social media. |
|
Input:, and the corresponding time stamp t (the whole decision periods are divided as t=1,2,…,T) The values of parameters α, β, γ. . Demand forecasting time horizon h. Output:: the value of emergency material demand index at period t+h. |
|
Steps: # step1. Mining emergency material demand index at period t # Calculate the probability of positive sentiment for reviewsaccording to formula (1) # Calculate the value of social influence index for reviewsaccording to formula (8) # Calculate the value of sentiment intensity index for reviewsaccording to formula (9) # Calculate the value of emergency material demand index for reviewsaccording to formula (10) end end # step2. Implementing Mann-Kendall trend detection on the previous extracted emergency material demand index data according to formula (3) and (4) if then else if then else end # step3. Judging whether the trend detection result is significant then # If the result is significant, do forecasting using formula (5) or (6) # Holt-Winters additive model forecasting and output the prediction accuracy (taking RMSE as an example) # Holt-Winters multiplicative model forecasting and output the prediction accuracy (taking RMSE as an example) # step4. Selecting the model with higher prediction accuracy to forecast if then else end else output “No significant trend in emergency material demand index data” end |
5. Application and Comparative Analysis
During the initial outbreak of the COVID-19 pandemic, the masks, as a key protective resource, its demand surged. However, due to production cycle and capacity limitations, there was a significant imbalance between supply and demand in the short term. Traditional emergency material forecasting methods rely on historical data and static models, making it difficult to respond to the dynamically evolving emergency material demand during the pandemic. Therefore, there is an urgent need to introduce real-time data-driven forecasting methods to optimize the production and allocation of emergency material masks.
The emergency management department utilized real-time crowd reviews from the social media platform Weibo to monitor and forecast the masks’ demand. The model proposed in section 4.2 constructed a mask demand monitoring and forecasting system to provide decision-making references for the production of masks. The emergency management department collected daily mask-related reviews under the COVID-19 topic through the Weibo API every day. This serves two critical purposed: (1) Real-time demand monitoring: continuously track current mask demand levels day by day. (2) Proactive production planning: As mask production cycles typically require 7-15 days, the collected data is used to forecast 15-day future demand, providing real-time guidance for ongoing production adjustments to meet anticipated demands.
According to the above actual requirement, the value of parameter h in algorithm 2 is set to 15 days. To demonstrate the operational workflow of algorithm 2, its application during the period from december1, 2019 to April 30, 2020, is showed as follows:
5.1. The Dataset
The row data comes from the Weibo-COV dataset (Hu et al., 2020), which contains more than 40 million posts ranging from december1, 2019 to April 30, 2020. We filtered the reviews of the posts that mentioned masks, including words masks (口罩), protective shields (防护罩), respirators (呼吸罩), and face shields(面罩), along with their numbers of likes, shares and comments. After a series of data preprocessing steps, a total of 3,323,151 pieces of reviews related to masks were obtained. A portion of these reviews are illustrated in Table 1, and the word cloud of the top 200 frequencies in the dataset is shown in Figure 3.
5.2. Mining Emergency Material Demand Index from Raw Data by Algorithm 1
Based on the timestamps of the reviews, the decision cycles were divided into one-day units. For each decision cycle, the algorithm 1 was used to obtain the emergency material demand index (with ). Since the original social media data showed in section 5.1 spanned from December 1, 2019, to April 30, 2020, the emergency material demand index showed in Figure 4 also fell within this timeframe, broken down on a daily basis.
For the emergency material demand index presented in Figure 4, we conducted a Mann-Kendall trend test based on equation (4). The test statistic Z is equal to -18.28, with a corresponding p-value far less than 5%. This indicates that, at the 5% significance level, the extracted material demand index for tasks shows a significant trend, allowing for predictions using time series analysis methods.
5.3. Implementing Trend Detection and Forecasting by Algorithm 2
According to Algorithm 1, the emergency management department can obtain the demand index for masks from the crowd's reviews on Weibo on a daily basis, allowing for real-time monitoring of mask demand in the disaster area. Do the obtained data show significant trends? Can they reflect the fluctuations in mask demand and predict the demand for masks in the future? To answer these questions, we will run algorithm 2 on the mask demand index mined from Figure 4, specifically applying Mann-Kendall trend detection and Holt-Winters forecasting with a significance level set as . For comparison of prediction accuracy, we choose the data from December 1, 2019, to march 17, 2020, as daily monitoring data. The forecast horizon is set to 15 days (h=15), based on the production cycle of masks. The predictions are made for the period from April 1 to April 30, 2020, to be compared with actual data from the same period. The forecast results are shown in Figure 5. The accuracy of the prediction results is detailed in the second column of Table 2.
5.4. Comparative Analysis
(1) Analysis of emergency material demand index performance
To verify that if the mined emergency supply demand index accurately reflects the actual demand for emergency supplies, we collected and organized data on the distribution of donated masks (both medical and non-medical) by the Wuhan COVID-19 Epidemic Prevention and Control Command from the Wuhan Red Cross Society’s official website, covering the period from March 1 to March 30, 2020. We compared the mask demand reflected by these two data sources. To eliminate the impact of different scales on the results, we applied min-max normalization to both the Wuhan Red Cross mask data and the emergency material demand index, mapping the data from both sources to the interval. The comparison results are shown in Figure 6.
From the results shown in Figure 6, it can be observed that the mask demand reflected by both data sources is largely consistent, especially during the period from March 12 to March 30. This indicates that the emergency material demand index based on social media data mining can, to some extent, reflect the real-time changes in the demand of the affected crowd. Consequently, it can provide valuable information to guide the allocation of emergency material by relief organizations.
(2) Comparison of forecasting results
To compare the accuracy of the proposed forecasting methods, we compare its results with the LSTM model and linear regression model. The key parameters for the LSTM model are as follows: the time window size is 10 days, the recursive forecast horizon is 15 days, the number of neurons is 50, and the loss function is mean squared error. The key parameter setting for the linear regression prediction are as follows: the initial linear regression model is fitted using the data from December 1, 2019, to March 17, 2020, to predict the mask demand index for 15 days later (April 1, 2020), with recursive regression predictions made until April 30, 2020. The forecasting results are shown in Figure 7 and Figure 8, respectively.
The forecasting accuracies of Holt-Winters multiplication, LSTM and Linear regression are presented in Table 2. The results show that under the dimensions of MAE and MAPE, the selected Holt-Winters multiplication model outperforms the other models. In terms of the RMSE metric, the linear regression model performs the best, followed by the Holt-Winters multiplication model.
6. Discussion and Implications
6.1. Theoretical Contributions
This study offers an innovative research method for data-driven emergency material demand forecasting and emergency management. By utilizing real-time social media data generated by the crowd, we can obtain timely information for emergency decision-making, better capturing crowd's material behaviour patterns and trends while reflecting specific material demand. Traditional methods for forecasting emergency material demand often rely on data collected through surveys and employ techniques such as case-based reasoning, Gray prediction, and machine learning, with limited consideration of the time pressure associated with emergency decision-making. The method proposed in this paper expands the sources of data, moving beyond conventional structured data to include unstructured data generated from social media in real-time. Additionally, by employing time series method such as the Holt-Winters forecasting procedure, for forecasting, our method facilitates more accurate capture and prediction of changes in emergency material demand.
6.2. Practical Implications
This study has direct implications for improving emergency management systems. The method for mining emergency material demand index from social media data, can be integrated into emergency response frameworks to enhance real-time monitoring and forecasting emergency material demand. Its ability to process large-scale social media data enables faster identification of affected crowd's emergency material demand, thereby optimizing resource allocation and rescue efforts.
Furthermore, the proposed real-time material demand forecasting method fully leverages the hidden material demand information in social media data to predict emergency material demand in advance, allowing sufficient time for the production and allocation of emergency material. This helps government agencies and emergency responders quickly identify emergency severity of rescue operations, improving both the speed and accuracy of emergency responses.
6.3. Discussion and Future Work
A real-time material demand forecasting method for emergency decision-making driven by social media data was proposed in this paper, the forecasting of masks during the early stages of COVID-19 outbreak verified its feasibility, and the comparative analysis result demonstrated its superior accuracy. The proposed method has the following advantages: (1) Social media data are first introduced to demonstrate the emergency material demand during the emergencies, which provides a real-time supplementary for decision information, and a new venue for emergency decision-making to engage with the crowd. (2) This study creatively captures the crowd's demand for emergency material by capturing the subtle changes in crowd's sentiment in social media data. Due to the real-time nature of social media data, it is possible to monitor the crowd's emergency material demand in real time. (3) In contrast to existing social media data analyses focus primarily on sentiment analysis, we take into account the social characteristics of social media by examining social interactions such as likes, shares and comments to adjust the sentiment intensity related to crowd's emergency material demand. The emergency material demand index constructed in this manner more accurately reflects the crowd's needs. (4) Due to the traits of Holt-Winters forecasting procedure integrated, the proposed forecasting method performs effectively with limited historical data, making it ideal for short-term forecasting in scenarios where data availability is constrained, and it suitable for the emergency decision scenarios. (5) the proposed forecasting method is superior to the other two compared methods under most accuracy metrics.
Some limitations exist in the proposed method. (1) The extracted and forecasted emergency material demand index only provides a trend assessment, but not a specific demand quantity. If we need to monitor and forecast a quantity, additional data or information about the emergency material from other sources are required. (2) Only the extracted emergency material demand index get through the trend detection, can it be used for material demand forecasting. Under this circumstance, not all social media data can be used to implement the proposed forecasting method.
In the future, we plan to supplement our information sources related to emergency response and study the extraction and forecasting methods of emergency material demand information under a multimodal data context, thereby providing more precise informational guidance for emergency decision-making and responses.
Acknowledgments
This work was supported by grants from the National Natural Science Foundation of China [12201650], the Research Foundation of Education Bureau of Hunan Province (Grant No. 23B0286), the Social Science Planning Fund project of Fujian Province (Grant No. FJ2024B107), and the Initiation Research Fund Project of Central South University of Forestry and Technology[2022YJ007].
References
- Arvandi, A., Al Marouf, A., Li, Q., Rokne, J., & Alhajj, R. (2025). Extracting information from reddit for emergency management—A case study on British Columbia wildfire. International Journal of Disaster Risk Reduction, 120, 105354. [CrossRef]
- Aziz, R. A., Agarwal, P., McGuinness, J., Karmaker, C. L., & Zhuang, J. (2024). Temporal patterns and life cycle dynamics of social media user activity during disasters: A data-driven approach for effective crisis communication. Expert Systems with Applications, 255, 124454. [CrossRef]
- Biswas, S., Kumar, D., Hajiaghaei-Keshteli, M., & Bera, U. K. (2024). An AI-based framework for earthquake relief demand forecasting: A case study in Türkiye. International Journal of Disaster Risk Reduction, 102, 104287. [CrossRef]
- Boonyarat, P., Liew, D. J., & Chang, Y.-C. (2024). Leveraging enhanced BERT models for detecting suicidal ideation in Thai social media content amidst COVID-19. Information Processing & Management, 61(4), 103706. [CrossRef]
- Boota, M. W., Soomro, S., Ahmad, M. I., Khan, S., Xia, H., Qin, Y., Yan, C., Xu, J., Yousaf, A., Boota, M. A., & Ahmed, B. (2024). Integrating social media and deep learning for real-time urban waterlogging monitoring. Journal of Hydrology: Regional Studies, 56, 102070. [CrossRef]
- Cao, R., Zeng, Q., Guo, S., Ni, W., Duan, H., & Guo, W. (2025). Log-driven predictive analysis of remaining time for emergency response processes. Expert Systems with Applications, 283, 127800. [CrossRef]
- Chatfield, C. (1978). The Holt-Winters forecasting procedure. Applied Statistics, 27(3), 264. [CrossRef]
- Erokhin, D., & Komendantova, N. (2024). Social media data for disaster risk management and research. International Journal of Disaster Risk Reduction, 114, 104980. [CrossRef]
- Forthofer, R. N., & Lehnen, R. G. (1981). Rank correlation methods. In Public Program Analysis: A New Categorical Data Approach (pp. 146–163). Springer US. [CrossRef]
- Gao, S., Yang, T., Xu, Y., Mou, N., Wang, X., & Huang, H. (2025). Enhancing disaster situation awareness through multimodal social media data: Evidence from Typhoon Haikui. Applied Sciences-Basel, 15(1), 465. [CrossRef]
- Guo, Q., Jiao, S., Yang, Y., Yu, Y., & Pan, Y. (2025). Assessment of urban flood disaster responses and causal analysis at different temporal scales based on social media data and machine learning algorithms. International Journal of Disaster Risk Reduction, 117, 105170. [CrossRef]
- Hamed, K. H., & Ramachandra Rao, A. (1998). A modified Mann-Kendall trend test for autocorrelated data. Journal of Hydrology, 204(1–4), 182–196. [CrossRef]
- Hanny, D., & Resch, B. (2025). Multimodal GeoAI: An integrated spatio-temporal topic-sentiment model for the analysis of geo-social media posts for disaster management. International Journal of Applied Earth Observation and Geoinformation, 139, 104540. [CrossRef]
- He, J., Duan, W., Zhou, Y., & Su, Y. (2024). Impact of media information on social response in disasters: A case study of the freezing-rain and snowstorm disasters in southern China in 2008. International Journal of Disaster Risk Science, 15(1), 73–87. [CrossRef]
- Hou, H., Zhao, P., Wu, C., Wang, B., & Li, F. (2025). Understanding residents’ responses towards disaster-related urban emergency management: A case study of typhoons in Shenzhen, China. International Journal of Disaster Risk Reduction, 124, 105533. [CrossRef]
- Hu, Y., Huang, H., Chen, A., & Mao, X.-L. (2020). Weibo-COV: A large-scale COVID-19 social media dataset from Weibo. In Proceedings of the 1st Workshop on NLP for COVID-19 (Part 2) at EMNLP 2020 (p. 34). Association for Computational Linguistics. [CrossRef]
- Huang, H., Li, X., He, J., & Liu, H. (2025). Analysis and application research on spatiotemporal characteristics of microblog information for rainstorm flood disasters emergency rescue based on text classification. International Journal of Disaster Risk Reduction, 117, 105085. [CrossRef]
- Hyndman, R. J., & Athanasopoulos, G. (2018). Forecasting: Principles and practice (2nd ed.). OTexts. https://otexts.com/fpp2/.
- Jiang, H., Chen, X., Miao, D., Zhang, H., Qin, X., Gu, X., Lu, P., & Li, X. (2025). Fpa-GCN: enhancing aspect sentiment triplet extraction with feature-rich prediction-aware graph convolutional networks. Applied Intelligence, 55(9), 740. [CrossRef]
- Khan, J., Ahmad, K., Jagatheesaperumal, S. K., & Sohn, K.-A. (2025). Textual variations in social media text processing applications: Challenges, solutions, and trends. Artificial Intelligence Review, 58(3), 89. [CrossRef]
- Lamsal, R., Read, M. R., & Karunasekera, S. (2024). CrisisTransformers: Pre-trained language models and sentence encoders for crisis-related social media texts. Knowledge-Based Systems, 296, 111916. [CrossRef]
- Li, W., Hua, Y., Zhou, P., Zhou, L., Xu, X., & Yang, J. (2025). Characterizing public sentiments and drug interactions in the COVID-19 pandemic using social media: Natural language processing and network analysis. Journal of Medical Internet Research, 27, 63755. [CrossRef]
- Liang, D., Fu, Y., & Xu, Z. (2022). Time-varying intuitionistic fuzzy integral for emergency materials demand prediction with case-based reasoning. IEEE Transactions on Fuzzy Systems, 30(9), 3617–3632. [CrossRef]
- Liu, C.-F., & Mostafavi, A. (2025). Network dynamics of community resilience and recovery: New frontier in disaster research. International Journal of Disaster Risk Reduction, 123, 105489. [CrossRef]
- London, J., Jr., & Matthews, K. (2022). Crisis communication on social media-lessons from Covid-19. Journal of Decision Systems, 31(1–2, SI), 150–170. [CrossRef]
- Parveen, H., & Pandey, S. (2016). Sentiment analysis on Twitter Data-set using Naive Bayes algorithm. In 2016 2nd International Conference on Applied and Theoretical Computing and Communication Technology (iCATccT), 416–419. IEEE. [CrossRef]
- Qin, J., Li, M., Wang, X., & Pedrycz, W. (2024). Collaborative emergency decision-making: A framework for deep learning with social media data. International Journal of Production Economics, 267, 109072. [CrossRef]
- Ragini, J. R., Anand, P. M. R., & Bhaskar, V. (2018). Big data analytics for disaster response and recovery through sentiment analysis. International Journal of Information Management, 42, 13–24. [CrossRef]
- Rehman, H. M. R. U., Saleem, M., Jhandir, M. Z., Alvarado, E. S., Garay, H., & Ashraf, I. (2025). Detecting hate in diversity: A survey of multilingual code-mixed image and video analysis. Journal of Big Data, 12(1), 109. [CrossRef]
- Shao, J., Liang, C., Liu, Y., Xu, J., & Zhao, S. (2021). Relief demand forecasting based on intuitionistic fuzzy case-based reasoning. Socio-Economic Planning Sciences, 74, 100932. [CrossRef]
- Soomro, S., Boota, M. W., Soomro, G.-Z., Soomro, M. H. A. A., Hu, C., Li, Y., Guo, J., & Wahid, J. A. (2025). Urban cities heatwaves vulnerability and societal responses towards hazard zoning: Social media real-time based heatwave detection using deep learning. Sustainable Cities and Society, 125, 106360. [CrossRef]
- Surya, P. P., & Subbulakshmi, B. (2019). Sentimental Analysis using Naive Bayes Classifier. In 2019 International Conference on Vision Towards Emerging Trends in Communication and Networking (ViTECoN), 1–5. IEEE. [CrossRef]
- Tamer, Z., Demir, G., Darıcı, S., & Pamučar, D. (2025). Understanding twitter in crisis: A roadmap for public sector decision makers with multi-criteria decision making. Environment, Development and Sustainability. Advance online publication. [CrossRef]
- Walczak, S., & Dinh, L. (2025). A text mining analytic approach for distinguishing between disaster and non-disaster zones from tweets. International Journal of Disaster Risk Reduction, 118, 105233. [CrossRef]
- Wan, Q., Xu, X., Chen, X., & Zhuang, J. (2020). A two-stage optimization model for large-scale group decision-making in disaster management: Minimizing group conflict and maximizing individual satisfaction. Group Decision and Negotiation, 29(5), 901–921. [CrossRef]
- Wan, Q., Xu, X., Zhuang, J., & Pan, B. (2021). A sentiment analysis-based expert weight determination method for large-scale group decision-making driven by social media data. Expert Systems with Applications, 185, 115629. [CrossRef]
- Win Myint, P. Y., Lo, S. L., & Zhang, Y. (2024). Unveiling the dynamics of crisis events: Sentiment and emotion analysis via multi-task learning with attention mechanism and subject-based intent prediction. Information Processing & Management, 61(4), 103695. [CrossRef]
- Wu, G., Hu, Y.-C., Chiu, Y., Jiang, P., & Chi, R. (2024). Forecast combination using grey relational analysis and Choquet fuzzy integral for container throughput forecasting. Expert Systems with Applications, 252, 124170. [CrossRef]
- Xu, X., Zheng, K., & Pan, B. (2024). A weighted information fusion method based on sentiment knowledge for emergency decision-making considering the public and experts. Group Decision and Negotiation, 33(2), 371–398. [CrossRef]
- Yang, W., Yi, L., & Chen, M. (2025). Gauss–Hermite metabolism GM(1,1) model to predict emergency material demand: A novel forecasting method. Grey Systems: Theory and Application, 15(3), 425–445. [CrossRef]
- Zeng, Z., Sun, S., & Li, Q. (2023). Multimodal negative sentiment recognition of online public opinion on public health emergencies based on graph convolutional networks and ensemble learning. Information Processing & Management, 60(4), 103378. [CrossRef]
- Zhou, W., An, L., Han, R., & Li, G. (2025). Classification and severity assessment of disaster losses based on multi-modal information in social media. Information Processing & Management, 62(5), 104179. [CrossRef]
- Zhu, Y., Xu, X., & Pan, B. (2023). A method for the dynamic collaboration of the public and experts in large-scale group emergency decision-making: Using social media data to evaluate the decision-making quality. Computers & Industrial Engineering, 176, 108943. [CrossRef]
Figure 1.
The flow diagram of sentiment analysis using Naïve Bayes classifier.
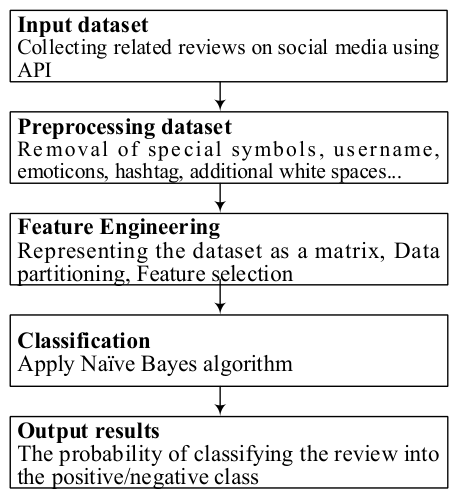
Figure 2.
The framework of the emergency material demand index from social media data.
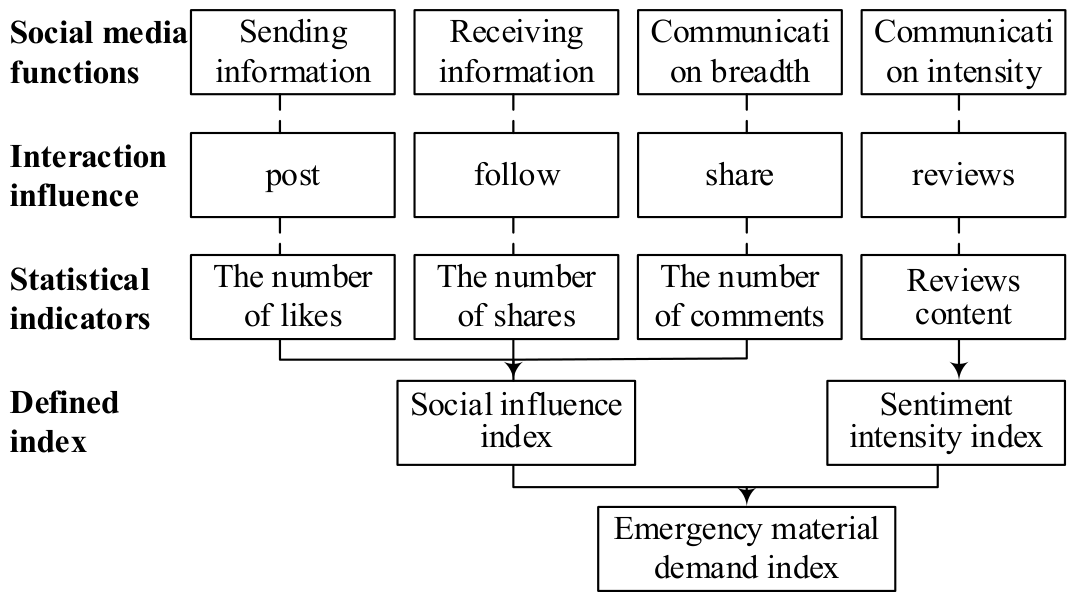
Figure 3.
A word cloud map for Mask themed reviews on Weibo (translated from Chinese).
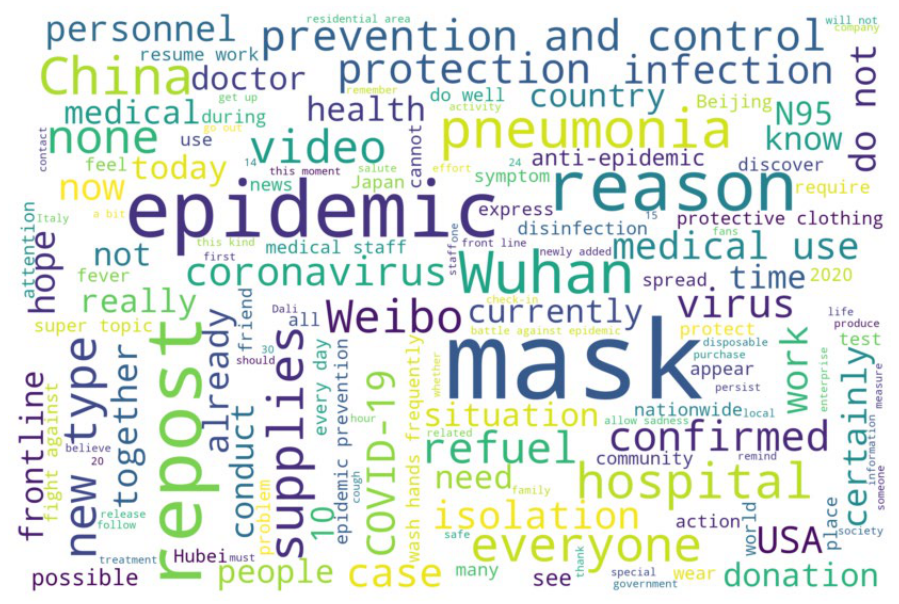
Figure 4.
Demand index for masks from December 1, 2019 to April 30, 2020.
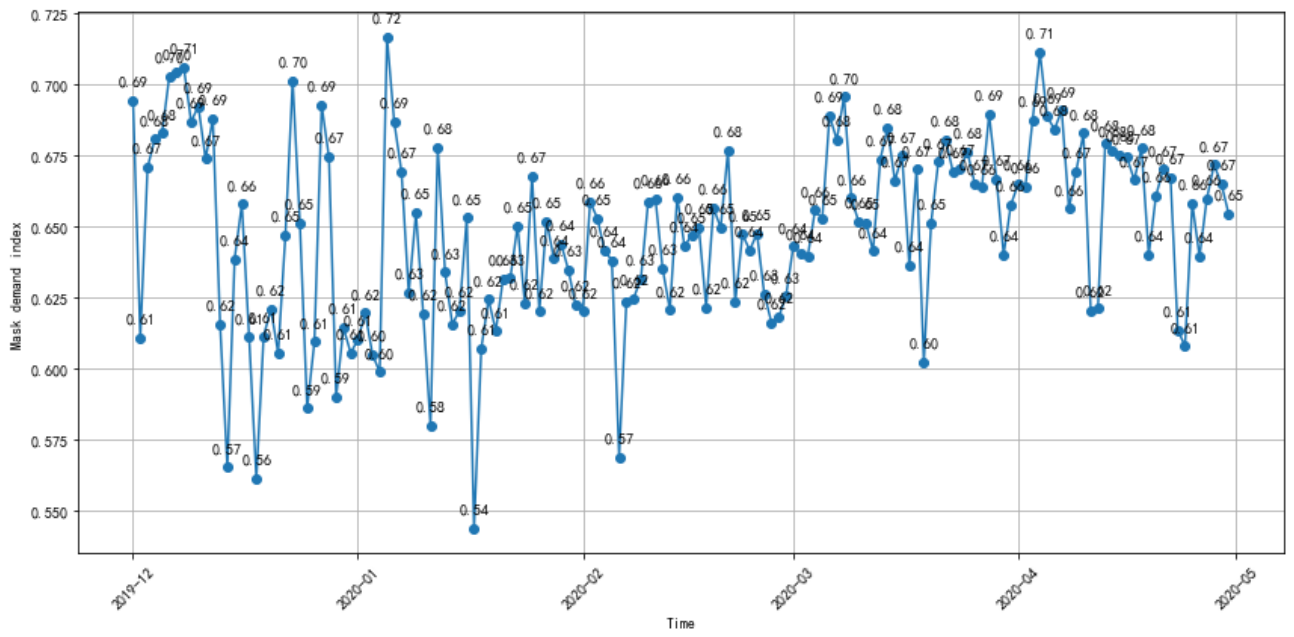
Figure 5.
Demand index of masks in April 2020 predicted by Holt-Winters multiplication model.
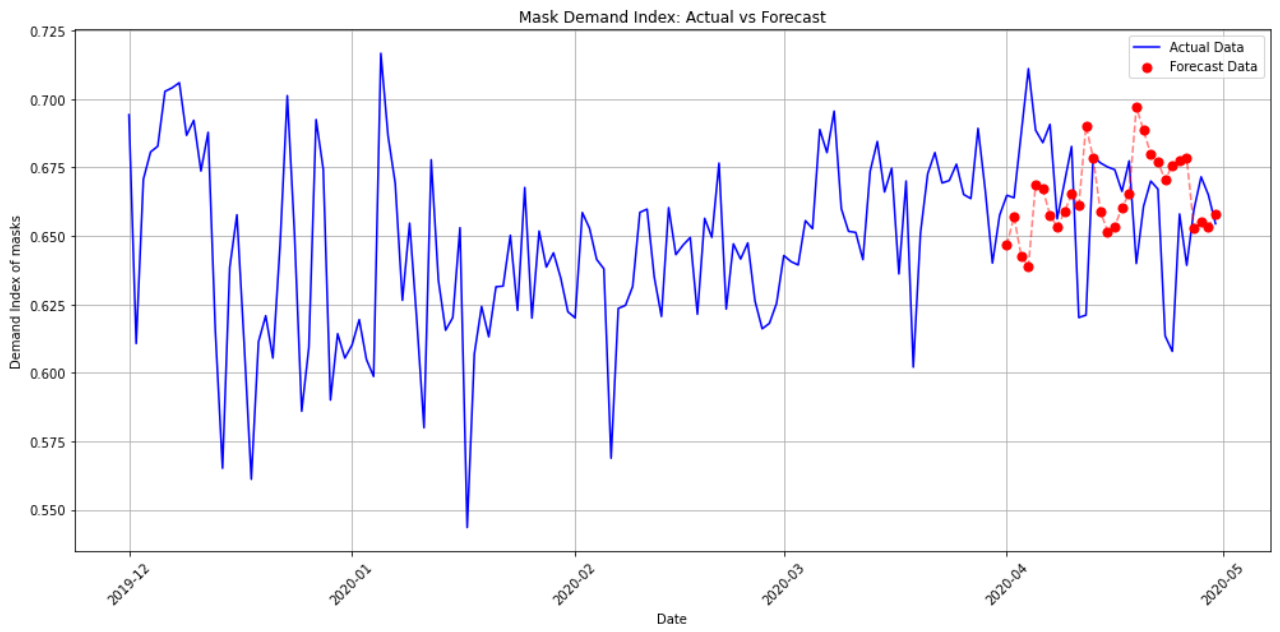
Figure 6.
Comparison of mask demand trends for March 1–30, 2020.
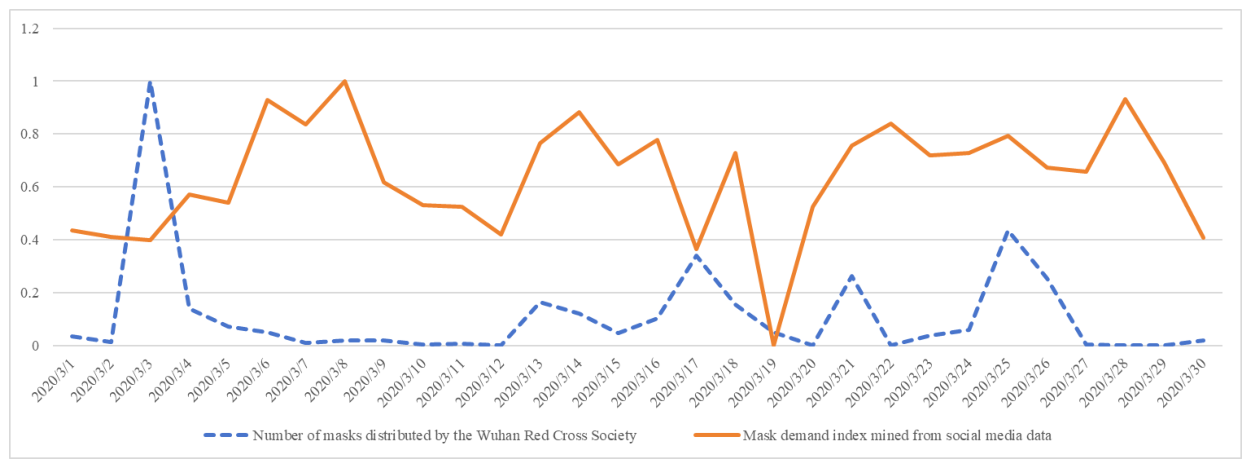
Figure 7.
Demand index of masks in April 2020 predicted by LSTM method.
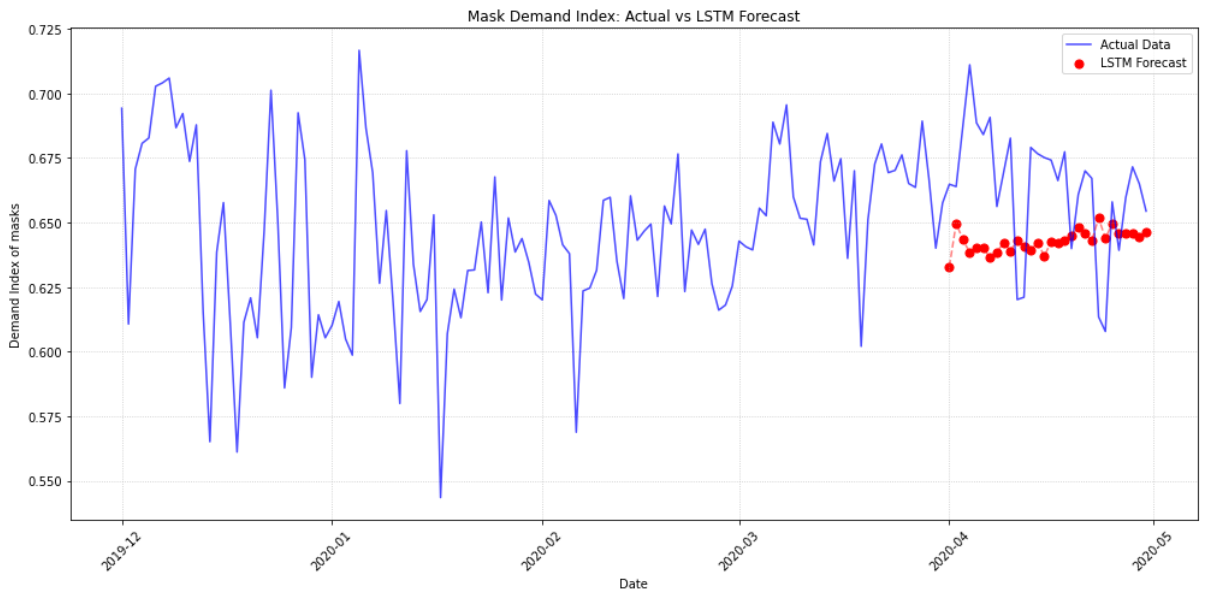
Figure 8.
Demand index of masks in April 2020 predicted by Linear regression model.
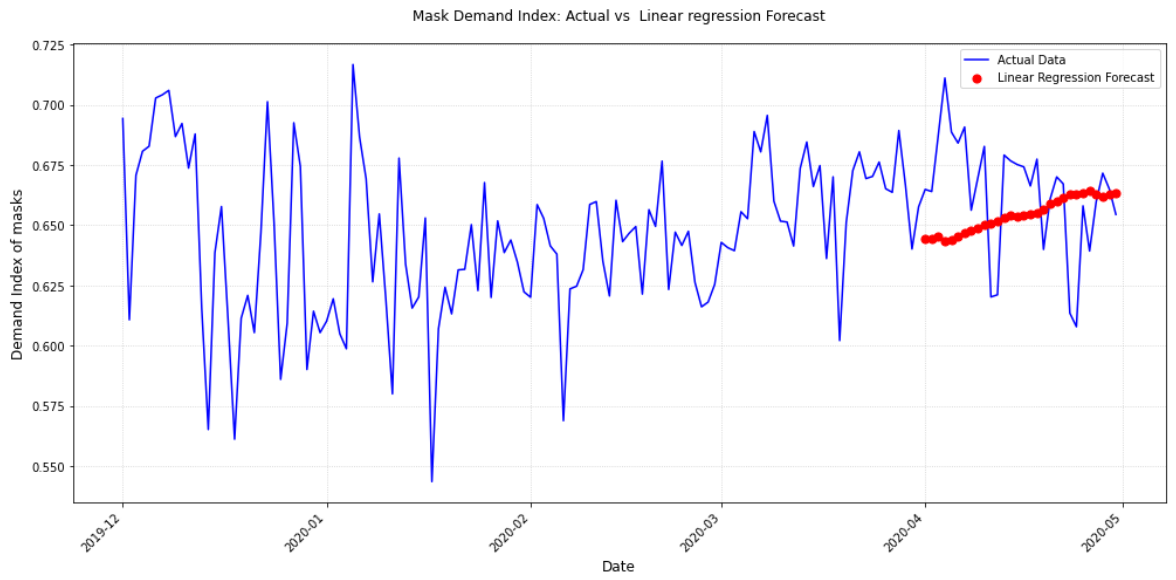

Table 1.
Examples of mask themed reviews on Weibo.
| Reviews (Original Chinese) | Publication Time | Number of Likes | Number of Shares | Number of Comments |
|---|---|---|---|---|
| On the last day of 2019, an unknown pneumonia was discovered in Wuhan, and in an instant, everyone put on masks. On the first day of 2020, I hope everyone stays health. (2019年的最后一天武汉发现了不明肺炎,一瞬间大家带上了口罩.2020年第一天希望所有的人平安.) | 2020-01-01 08:28 | 3 | 0 | 0 |
| How much of a psychological shadow has the vaccination left on my child? I caught a cold and wore a mask at home, which scared Simon so much that he cried loudly. [Confused] (打疫苗到底给这个孩子留下了多大额心里阴影,我感冒在家戴口罩,把西蒙吓得哇哇哭[费解]) | 2020-01-02 15:12 | 0 | 0 | 1 |
| It's not very accurate; it's too reasonable. Bye, and Happy New Year! [Not Simple] Now I don't even dare to go outside without wearing a mask. [Crying] (不太准,是太讲道理,掰掰,元旦快乐[并不简单]现在不戴口罩都不敢出门了[允悲]) | 2020-01-02 17:08 | 3 | 0 | 1 |
| As soon as I got in the car, I noticed that everyone was wearing masks without any prior agreement. 😷(一上车,发现大家不约而同带了口罩😷) | 2020-01-03 05:18 | 6 | 0 | 2 |
| In the cold wind, I forgot to wear a mask when I went out. Hahaha! (寒风里,出门忘了戴口罩,哈哈哈哈哈) | 2020-01-03 08:56 | 1 | 0 | 2 |
Table 2.
Comparison of three forecasting methods.
| Accuracy Metrics | Holt-Winters multiplication | LSTM | Linear Regression |
|---|---|---|---|
| RMSE | 0.0258 | 0.0265 | 0.0251 |
| MAE | 0.0198 | 0.0233 | 0.0205 |
| MAPE | 3.01% | 3.50% | 3.11% |
Disclaimer/Publisher’s Note: The statements, opinions and data contained in all publications are solely those of the individual author(s) and contributor(s) and not of MDPI and/or the editor(s). MDPI and/or the editor(s) disclaim responsibility for any injury to people or property resulting from any ideas, methods, instructions or products referred to in the content. |
© 2026 by the authors. Licensee MDPI, Basel, Switzerland. This article is an open access article distributed under the terms and conditions of the Creative Commons Attribution (CC BY) license (http://creativecommons.org/licenses/by/4.0/).
Copyright: This open access article is published under a Creative Commons CC BY 4.0 license, which permit the free download, distribution, and reuse, provided that the author and preprint are cited in any reuse.