

Submitted:
18 August 2026
Posted:
20 August 2026
You are already at the latest version
Abstract
Multi-rotor unmanned aerial vehicles (UAVs) used in post-disaster reconnaissance and target search face two challenges: limited prior information and the disruption of task chains when targets are discovered dynamically. Conventional coverage path planning (CPP) algorithms rely on fixed sweeping directions and static task allocation, which leads to high turning energy consumption, imbalanced workloads among vehicles, and an inability to respond to unexpected target discoveries. To address these issues, this paper proposes the Dynamic Adaptive Reallocation for Terrain Sweeping (DARTS) framework.First, a direction-adaptive sweeping mechanism is designed that generates boustrophedon (back-and-forth) sweep paths along horizontal, vertical, diagonal, and PCA-derived principal directions, and automatically selects the fewest-turn coverage pattern for each sub-region. Second, a two-level load-balanced allocation model is constructed: in the offline stage, a constrained 0-1 integer-programming model solved by a branch-and-bound constraint-programming search is employed to simultaneously optimize the load variance and regional clustering under hard battery-capacity constraints; in the online stage, when a UAV discovers a target it switches from a covering to a tracking role, and the released remaining sub-regions of the affected UAV are treated as regional task blocks that are migrated by a greedy heuristic with minimal overhead on the basis of a composite score combining the real-time load and spatial distance.Simulation results show that, compared with the conventional Divide Areas Algorithm for Optimal Multi-Robot Coverage Path Planning (DARP) with greedy allocation, DARTS reduces the coefficient of variation (CV) of multi-UAV path lengths from 0.111 to 0.082 (a relative reduction of 26.5%) and, at the per-region scan-path level, the average number of turns by up to 54.5% relative to the worst fixed sweeping pattern. Moreover, when a target-discovering UAV switches from covering to tracking the target, the event-triggered reallocation raises the target discovery rate from 68.3% to 100% and the coverage completion rate from 61.8% to 83.1%, at a transfer overhead of only 13.1% of the released path length, while the initial CP allocation solves in under 0.1 s at the scale of the main experiments. These results confirm the robustness and computational efficiency of the proposed algorithm in dynamic scenarios.
Keywords:
multi-UAV
; coverage path planning
; task reallocation
; load balancing
; direction-adaptive sweeping
; obstacle avoidance
1. Introduction
With the rapid development of UAV technology, multi-UAV cooperative coverage search has become increasingly important for emergency rescue, agricultural monitoring, and military reconnaissance [1,2]. Coverage path planning (CPP), as the core problem, aims to plan an optimal or near-optimal path for each UAV so that the designated region is fully traversed while constraints such as obstacle avoidance and endurance are satisfied [3,4].
Existing CPP methods can be broadly divided into two categories: exact coverage based on cellular decomposition and self-coverage based on spanning trees. The former, such as Boustrophedon decomposition [5], is suited to regular polygonal regions, whereas the latter, such as minimum-spanning-tree (MST)-based coverage [6], is suited to complex connected regions. In multi-UAV scenarios, region segmentation and task allocation are commonly performed with area-decomposition coverage algorithms or with market-based (auction) assignment mechanisms [7,8]. Recent CPP studies further integrate turn minimization and workload balancing into energy-efficient multi-robot coverage [23]. These methods nevertheless share several limitations. First, most of them adopt only a single fixed sweeping direction, such as horizontal or vertical boustrophedon sweeping, which produces numerous ineffective turns in regions with oblique obstacles or narrow elongated shapes and thereby increases flight energy consumption [9,10]. Second, the task allocation is static: once determined, it cannot be revised even when a UAV discovers a target (e.g., an inspection point or a survivor) during execution, so the remaining uncovered regions of that UAV cannot be transferred in time; its subsequent path is interrupted while other UAVs may remain idle or overloaded. Third, existing dynamic replanning approaches typically re-run the complete CPP algorithm, which is computationally expensive and difficult to satisfy real-time requirements [11,12].
To address the above problems, this paper proposes the DARTS framework, whose main contributions are as follows:
- 1.
- Direction-adaptive sweeping. Boustrophedon (back-and-forth) sweep paths along the horizontal, vertical, diagonal, and PCA-derived principal directions are generated for each sub-region, and the optimal direction is automatically selected according to turn-count statistics, which reduces the turning frequency at the scan-path level.
- 2.
- Two-level load balancing with regional clustering. In the offline stage, a constrained 0–1 integer-programming model solved by a branch-and-bound constraint-programming search is introduced to simultaneously optimize the maximum load and the intra-cluster compactness under battery constraints, thereby avoiding the assignment of overly scattered regions to the same UAV.
- 3.
- Event-triggered dynamic region reallocation. When a UAV discovers a target, it suspends its covering task to follow the target, and its remaining path is atomically decomposed at the granularity of sub-regions; each regional task block is then migrated to other active UAVs at minimal transfer cost according to a composite score combining the real-time load and spatial proximity, without global replanning.
- 4.
- Two-layer safe obstacle-avoidance A*. A two-layer A* search [13] first searches the inflated obstacle set and, only if needed, degrades to the core set, thereby returning a solvable path while preferring safer routes.
2. Problem Formulation
2.1. Environment and Map Model
Consider a two-dimensional grid map of size in which each cell is either free (traversable) or occupied by an obstacle. Obstacles are not restricted to rectangular footprints: let denote the set of occupied cells, and the corresponding safety-inflated set obtained by dilating by a radius d (in double-resolution cells). To improve path smoothness and to keep a safety margin, the map is executed at a double resolution of , with each original cell corresponding to a block of sub-cells.
2.2. UAV and Region Definitions
There are UAVs, each starting from with a maximum endurance distance (measured as the path length at double resolution). The region to be covered consists of M pairwise non-overlapping sub-regions that collectively span the region of interest. Each sub-region is specified either as an axis-aligned rectangle or as an arbitrary-shape irregular region defined by a Boolean occupancy array that marks the traversable cells to be covered. Figure 1 illustrates the irregular representation with irregular obstacles.
2.3. Optimization Objectives
Three objectives are pursued.
- Load balancing. Minimize the ratio between the maximum and the minimum actual path lengths among the UAVs,where denotes the actual path length of the i-th UAV.
- Turning cost. Minimize the total number of direction changes along the paths,where is the number of turns of the i-th UAV.
- Reallocation cost. Upon a dynamic event, keep the additional A* transfer path lengthinduced by task migration as small as possible.
These objectives are optimized separately in the offline allocation stage and the online reallocation stage.
2.4. Target Discovery Model
Each search target g occupies a single traversable cell of the map, and a UAV is said to discover a target when its current position coincides with the target’s cell during coverage. In a reconnaissance mission a discovered target must be continuously followed or monitored, so the discovering UAV switches from a covering role to a tracking role and releases its remaining covering tasks, which are then reallocated to the other active UAVs by the online reallocation module (Section 3.4). Targets are placed on the obstacle-free, non-dilated traversable cells inside the sub-regions, i.e., on the cells that the planned coverage paths actually visit; this placement guarantees that every target is reachable and that the discovering UAV is indeed executing a covering task when it encounters the target. In both reallocation experiments the target set is therefore drawn uniformly at random from these cells.
3. Methodology
Figure 2 presents an overview of the DARTS framework, which consists of four main modules: direction-adaptive coverage path generation, two-stage offline task allocation, two-layer obstacle-avoidance path refinement, and online dynamic region reallocation.
3.1. Direction-Adaptive Sweeping Coverage Generation
DARTS generates the coverage path of each sub-region by a direction-adaptive boustrophedon (back-and-forth) sweeping scheme rather than by spanning-tree traversal. In tree-traversal coverage the UAV must walk every edge of a spanning tree and is therefore forced into non-covering detours between the leaves, whereas a boustrophedon sweep visits every traversable cell exactly once, so that the number of turns of the resulting path is determined only by the number of sweep strips. To adapt the sweep direction to the shape of a sub-region, the principal axis of the traversable cells is first extracted by principal-component analysis (PCA), and the sweep direction is drawn from a candidate set that contains the horizontal (row-first), vertical (column-first), main-diagonal ( grouping), counter-diagonal ( grouping), and PCA-identified principal directions [5,14,15]. For each candidate direction m, a full sweep path is generated and its number of turns is counted; the direction with the fewest turns is then selected as the coverage path of the sub-region:
where p denotes the PCA-derived direction. For near-square regions, in which the two largest PCA eigenvalues are comparable and the principal direction is therefore degenerate, the PCA candidate degenerates to the horizontal sweep, so the selection degrades gracefully to the best of the four fixed directions. This guarantees the least-turning pattern per sub-region at the scan-path level (evaluated in Section 4.3).
3.2. Two-Stage Offline Task Allocation
Let be the set of sub-regions and the set of UAVs. The estimated coverage path length of sub-region is , where is its area and an area-to-path conversion factor (in this paper, ), which accounts for the fact that the double-resolution coverage path is approximately twice the area plus a margin for turns and detours.
3.2.1. Global Load-Balancing Model
The assignment is formulated as a constrained 0–1 integer-programming model [16,17], in which the binary decision variable indicates whether sub-region j is assigned to UAV i. The model is subject to the following constraints:
where B is the battery capacity. Constraint (5) assigns each sub-region exactly once, () bounds the total estimated path length of each UAV by its battery, and () linearizes the maximum load . The normalized objective trades off load balancing against spatial proximity:
where and are normalization terms. In the implementation the objective is converted to an integer-weighted form by scaling by ; if the solver exceeds a 15 s time limit or returns no feasible solution, the model falls back to the greedy composite-score rule introduced in Section 3.4.
3.2.2. Intra-Cluster Compactness Optimization
After the first model, a second model improves the spatial compactness of each UAV’s assignment while keeping the maximum load within a small tolerance of its optimal value :
where is the transfer cost from the current position of UAV d to sub-region and the distance between the centers of sub-regions a and b; the product penalizes assigning two distant sub-regions to the same UAV. Because the product terms are quadratic, when the number of quadratic variables exceeds 120,000 or , the model falls back to a local neighbor-swap heuristic.
3.3. Two-Layer Obstacle-Avoidance Path Refinement
For each generated base path, an A* search [13] is applied for safe refinement. The search is first performed on the inflated obstacle set ; if it fails, it degrades to the core obstacle set (the vehicle body only); if it still fails, it falls back to straight-line interpolation. This fallback chain returns a solvable path whenever one exists, while preferring the safer inflated corridor whenever a safe corridor is available.
3.4. Online Dynamic Region Reallocation
Because a target-discovering UAV must switch from covering to tracking (Section 2.4), its remaining coverage tasks are released and must be absorbed by the still-active UAVs. When a UAV d discovers a target during execution, the reallocation process is therefore triggered [18,19,20]. First, the affected UAV is suspended, its current position is marked, and its remaining path is truncated. The remaining path is then parsed into several “regional task blocks” according to the sub-region to which the path points belong, each block containing all uncovered points of that sub-region. For each pending region and each active UAV i, an acceptance score is computed as
where is the current total load of UAV i, is the average load, is the current position of UAV i, and . Each regional task block is assigned to the UAV with the lowest score, i.e., by a greedy composite-score rule, and only the A* transfer path from the current position of the receiver to the start point of the region is computed, reusing the already generated coverage path of that region without replanning it; this reuse keeps the computational overhead of a handover small.
Only UAVs with sufficient remaining battery to cover the block are considered receivers, and the blocks are assigned sequentially with the score recomputed after each assignment, so the resulting migration is load-aware. The same greedy composite-score rule also serves as the fallback assignment when the offline solver exceeds its time limit or returns no feasible solution (Section 3.2), which keeps the framework operational in degenerate cases. Because a receiver is required for every handover, the online reallocation assumes that the number of targets does not exceed the number of active UAVs; the applicable fleet size is therefore bounded by the target count.
4. Experiments and Analysis
4.1. Experimental Setup
Table 1 summarizes the simulation configuration. All experiments run on Ubuntu 20.04 with maps planned at double resolution (). Each map contains 20 square obstacles ( cells, ≈1.8% occupancy) and up to 12 non-overlapping rectangular sub-regions (18–30 cells per side) placed by rejection sampling [22]. Because the map admits at most about ten such rectangles, the sampler places 7–12 sub-regions per seed (mean ≈9.4); the nominal request of 12 is used throughout. The initial allocation uses the two-stage constrained 0–1 programming model (Section 3.2); the greedy composite score (Section 3.4) serves as its fallback and as the online reallocation rule. Fifteen random seeds (1–15) control map generation, region sampling, and target placement. In reallocation experiments, four targets are sampled uniformly from the obstacle-free cells inside the sub-regions, which guarantees reachability (Section 2.4). Irregular sub-regions and obstacles are evaluated alongside the rectangular setting in the corresponding subsections.
4.2. Load Balancing Performance
Table 2 compares load balancing under the greedy, auction, and proposed two-stage CP allocations over 15 seeds [21]. The proposed allocation reduced the CV of UAV path lengths from 0.111 to 0.082 (26.5%) and the maximum-to-minimum load ratio from 1.32 to 1.24. A paired Wilcoxon signed-rank test confirmed the CV gain is significant (). Figure 3 shows the improvement is consistent across seeds. An auction baseline, which assigns each sub-region to the UAV with the lowest marginal cost, yielded a CV of , worse than both alternatives. The load-balancing gain thus originates from the global two-stage optimization rather than from the assignment heuristic.
To check that the load-balancing gain is not an artifact of axis-aligned rectangles, we repeated the load experiment with irregular sub-regions and irregular obstacle blobs placed inside the regions. On 15 seeds the proposed allocation still improved the CV, from 0.118 (greedy) to 0.114, a modest reduction of 2.7% that was not statistically conclusive (better in 8 of 15 seeds). The pronounced gain of Table 2 (26.5%, ) is therefore specific to rectangular sub-regions with square obstacles.
4.3. Turn Count Optimization
The turn-reduction gain is evaluated on the per-region scan path generated by the adaptive scanner. Figure 4 reports the average number of turns of the four fixed modes, the PCA-derived direction, and the adaptive selection over 30 rectangular sub-regions, normalized to the horizontal mode. The adaptive mode achieved the fewest turns (raw mean 40.5 versus 44.5 for horizontal; normalized 91.0 versus 100.0), i.e., 9.0% fewer than horizontal and 54.5% fewer than the worst fixed pattern (the diagonal modes). A paired Wilcoxon signed-rank test confirmed the difference is significant (, ). Because the scanner is applied to every sub-region during planning, the reduction appears in the generated coverage paths themselves, not only in an isolated evaluation.
The turn-reduction gain is not limited to rectangular sub-regions. On 30 irregular regions the adaptive mode again selected the fewest-turn pattern (normalized 88.8 versus 100.0 for horizontal, i.e., 11.2% fewer turns and 31% fewer than the worst diagonal pattern; , ), confirming that the direction-adaptive scanner generalizes to arbitrary shapes.
4.4. Effectiveness of Dynamic Reallocation
Table 3 compares three reallocation policies over 15 seeds, with four targets placed as in Section 2.4. We distinguish the discovery rate, the fraction of targets found, from the coverage completion, the fraction of traversable cells covered by the final paths. In the proposed event-triggered reallocation, a UAV that discovers a target switches to tracking it and hands its remaining coverage tasks to still-active UAVs. The discovery rate reached 100% (4/4 targets in every seed) and the coverage completion , at a transfer overhead of only of the released path length. If a discovering UAV instead stops and drops its tasks (stop-and-drop), the discovery rate fell to 68.3% and the coverage completion to (, paired Wilcoxon, ). If it continues to cover its own region (continue-and-cover), the completion reached , the ideal upper bound. The gap between reallocation (83.1%) and this bound reflects the no-receiver boundary of Section 3.4: the last discovering UAV always lacks an active receiver, so its residual tasks are dropped. This boundary is the main limitation and is analyzed in Section 5.
The logged events confirm that the reallocation behaves as designed: three events occur per scene, one per target-discovering UAV. In a representative run (seed 7, targets in sub-regions 4, 0, 8, and 5), reallocation triggered at step 607, when UAV 1 released 1449 double-resolution cells re-assigned as two regional task blocks; UAV 3 then released 594 cells at step 1655, and UAV 2 released 775 cells at step 2496. Each handover reuses the released sub-region’s generated coverage path and adds only the A* transfer segment, so the transferred-to-released ratio stays at 13.1% (708 versus 5786 cells).
The reallocation also operates on arbitrary-shape sub-regions (Figure 5). Over 15 seeds the discovery rate again reached 100%, whereas without reallocation 2.67 of four targets were found (66.7%) and the coverage completion dropped to ; reallocation thus mainly restored coverage completion, subject to the same no-receiver bound as on rectangles. The transfer overhead on irregular sub-regions is of the released path length, well above the 13.1% on rectangles, because the smaller, more fragmented irregular extents make each handover comparatively expensive. This trade-off is an important boundary of the mechanism (Section 5).
4.5. Real-Time Analysis
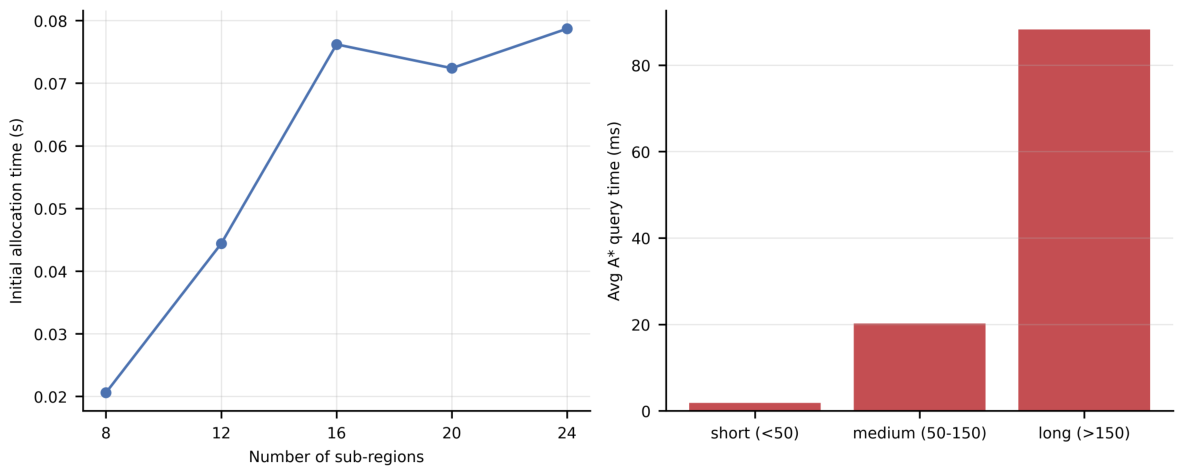
Table 4 breaks the allocation time into the initial (offline) allocation, the cumulative online reallocation, and their total, as a function of the requested number of sub-regions on the map (the sampler places 8–10 of the 18–30-cell rectangles, so 12–24 requests correspond to 9–10 actual sub-regions; actual counts appear in parentheses). The initial allocation takes 0.03–0.10 s; the online reallocation, comprising greedy scoring and a few short A* transfer segments per handover, adds 0.05–0.25 s. The total therefore stays between 0.1 s and 0.35 s across the operating range, well below the 5 s real-time budget (the offline solver keeps a 15 s limit only as a safety fallback). Short-range A* queries (distances below 50 cells) average 1.75 ms with a p95 of 4.08 ms (Table 5), satisfying near-real-time replanning. Behaviour at larger scales, up to roughly a thousand sub-regions and over a hundred UAVs on an map, is analysed in Section 4.9.
Figure 6.
CP solve time versus number of regions and A* transfer query times by start–goal distance.
Figure 6.
CP solve time versus number of regions and A* transfer query times by start–goal distance.
4.6. Ablation Study
Table 6 and Figure 7 isolate each module through leave-one-out ablation on the same 12-region, 4-UAV setting. Removing the CP allocation (falling back to greedy) raised the load CV from 0.082 to 0.112 (+37%), whereas removing the reallocation left the CV unchanged but cut the discovery rate from 100% to 68.3%. The CP allocation is therefore the decisive module for load balancing, and the reallocation drives target discovery and coverage completion; the two contributions are independent. The all-modules-off configuration (70.0%) slightly exceeds the no-reallocation one (68.3%) in discovery, a small sampling effect of where greedy places the targets.
4.7. Robustness Across Parameter Settings
Table 7, Table 8 and Table 9 and Figure 8 report the mean load CV under varying numbers of sub-regions, UAVs, and obstacles, with the same 15 seeds and scan configuration as Table 2, and with auction as an additional baseline. The CP allocation achieved a lower CV than both baselines in eight of nine parameter combinations; the sole exception is the eight-region map, where greedy and CP are nearly identical (0.070 versus 0.073). The load-balancing gain is thus broadly consistent across the operating range.
4.8. Baseline Comparisons: DARP and CBBA-Style Reallocation
Table 10 compares DARTS with a full end-to-end DARP implementation, which partitions the whole map by DARP cell decomposition and covers each partition with MST-based trajectories. Full-map DARP achieves a nominal load CV of 0.000 by construction, because its cell-based partition strictly equalizes the per-UAV area. The two frameworks cover different extents, however: the 12 sub-regions cover roughly 12% of the traversable map, whereas DARP partitions the entire map. The raw path lengths (9980 versus 2589 double-resolution cells) are therefore not an equal-coverage comparison and are not presented as such. Per covered cell, the two attain comparable coverage cost, indicating that the practical advantage of DARTS lies in its sub-region-based design (target discovery, reallocation, and on-demand load balancing). The nominal CV of full-map DARP reflects its equal-area partition rather than a better task allocation.
Table 11 compares the proposed load-aware reallocation with a simplified consensus-based bundle algorithm (CBBA-style, cost-only marginal gains). The load-aware score reduced the final load standard deviation by 32.8% (637.7 versus 948.9) at a transfer-cost increase of only 10.1% (93.7 versus 85.1), i.e., a substantially more balanced final workload at negligible extra cost.
Table 11 compares the proposed load-aware reallocation with a simplified consensus-based bundle algorithm (CBBA-style, cost-only marginal gains). The load-aware score reduced the final load standard deviation by 32.8% (637.7 versus 948.9) at a transfer-cost increase of only 10.1% (93.7 versus 85.1), i.e., a substantially more balanced final workload at negligible extra cost.
4.9. Scalability Analysis
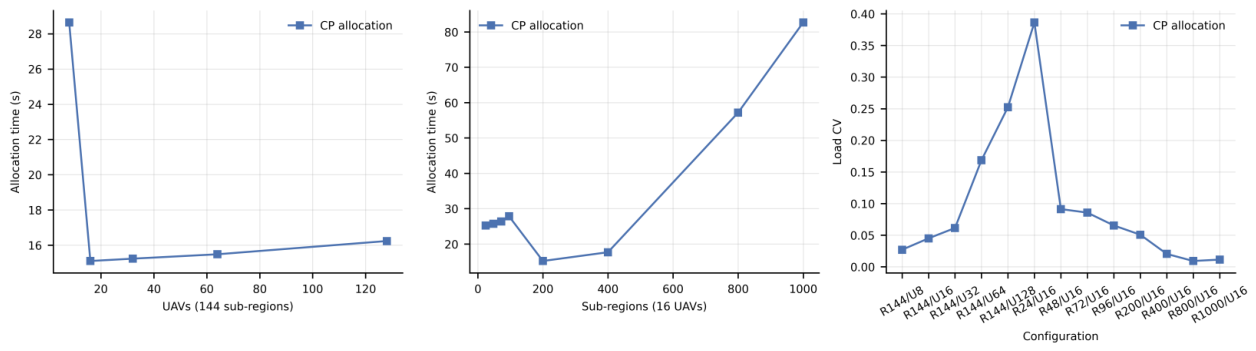
To assess how the proposed method scales, we evaluate the constrained 0–1 programming allocation and the direction-adaptive scanner on an map (planned at double resolution ) with small rectangular sub-regions (14–22 cells per side), so that the requested counts are actually placed. Two families are averaged over three seeds: (i) 144 sub-regions with 8–128 UAVs, so the fleet stays below the region count; and (ii) 24–1000 sub-regions with 16 UAVs, which stresses the task-block count up to a thousand.
Table 12 reports the offline allocation time and the resulting load CV. The CP allocation time was dominated by its configured limits: the first stage returned the best feasible incumbent at 15 s, and the second stage fell back to the neighbor-swap heuristic when the quadratic model exceeded the threshold of Section 3.2. The CP time stayed between 15 s and 83 s across all configurations, growing more slowly than the problem size; at 1000 requested sub-regions (962–975 actually placed) the CP-SAT model itself became the bottleneck and the time reached 82.7 s.
The load CV under the CP allocation remained low across the whole operating range. With 144 sub-regions, the CV rose from 0.0269 at 8 UAVs to 0.2524 at 128 UAVs, as the per-UAV workload shrank. In the region sweep with 16 UAVs, the CV decreased as the number of sub-regions grew, from 0.3864 at 24 regions to 0.0113 at 1000 regions, because each UAV then served more task blocks and the balancing freedom increased. The adaptive scanner retained its turn advantage on the larger sub-regions (4.15–9.65%, mean 7.5%). These results indicate that the CP allocation and the direction-adaptive scanner remain effective when the mission scale grows by up to two orders of magnitude.
Figure 9.
Offline allocation time of the CP allocation versus the number of UAVs (left) and the number of sub-regions (center), and the resulting load CV across configurations (right), on the map.
Figure 9.
Offline allocation time of the CP allocation versus the number of UAVs (left) and the number of sub-regions (center), and the resulting load CV across configurations (right), on the map.
5. Discussion
The DARTS framework combines direction-adaptive sweeping, a two-stage constrained 0–1 programming allocation with regional clustering, and event-triggered dynamic reallocation, and each module targets one of the three challenges identified in the Introduction. Turn-aware sweeping reduces the turning energy at the per-region scan-path level (9.0% fewer turns than horizontal sweeping and 54.5% fewer than the worst fixed pattern), the two-stage allocation balances the per-UAV workload (26.5% CV reduction, ), and the event-triggered reallocation restores the coverage completion when a target-discovering UAV switches to tracking (from 61.8% to 83.1%). All three gains are obtained on a single set of sub-regions that spans both rectangular and irregular shapes, and the ablation study confirms that the contributions are independent.
The framework relies on global communication and centralized decision making, which suits cooperative missions with reliable links. Because each handover requires a receiver, the online reallocation is naturally applied in scenarios where the number of targets does not exceed the number of active UAVs; this condition is typical of the reconnaissance missions considered here and keeps the reallocation lightweight. The transfer overhead grows on small, fragmented sub-regions, because each handover adds a comparatively long A* segment; the reallocation is therefore most beneficial when the released task blocks are large enough to amortize the transfer cost.
Future work will address three directions. First, a distributed, consensus-based variant of the reallocation will relax the reliance on global communication for large fleets. Second, the framework will be extended to heterogeneous fleets with different endurance and sensing capabilities, which requires incorporating per-UAV constraints into the load-balancing model. Third, for very large missions with thousands of sub-regions, the first-stage time limit dominates the offline allocation, so more efficient decomposition heuristics and warm-started solvers will be investigated.
6. Conclusions
This paper proposed the DARTS framework for multi-UAV coverage path planning, which combines direction-adaptive sweeping, a two-stage constrained 0–1 programming allocation with regional clustering, and event-triggered dynamic reallocation. In 15-seed experiments on maps with up to twelve sub-regions spanning both rectangular and irregular shapes and four UAVs, DARTS reduced the coefficient of variation of the path lengths from 0.111 to 0.082 (26.5%), lowered the average number of turns by up to 54.5% at the per-region scan-path level, and, through event-triggered reallocation, raised the target discovery rate from 68.3% to 100% and the coverage completion rate from 61.8% to 83.1% at a transfer overhead of only 13.1%. The initial CP allocation solves in under 0.1 s at the main scale; when scaled to roughly a thousand sub-regions and over a hundred UAVs, it remains solvable at 15–83 s, dominated by the configured time limits (Section 4.9).
Author Contributions
Y.L.: Conceptualization, Methodology, Investigation, Formal analysis, Software, Writing—original draft. B.L.: Conceptualization, Supervision, Writing—review and editing. C.Z.: Writing—review and editing, Investigation. All authors have read and agreed to the published version of the manuscript.
Data Availability Statement
The data presented in this study are available from the corresponding author upon reasonable request.
Conflicts of Interest
The authors declare no conflicts of interest.
References
- Cabreira, T.M.; Brisolara, L.B.; Ferreira, P.R. Survey on coverage path planning with unmanned aerial vehicles. Drones 2019, 3, 4. [Google Scholar] [CrossRef]
- Terwilliger, B.; Vincenzi, D.; Ison, D. Unmanned aerial systems: Collaborative innovation to support emergency response. J. Unmanned Veh. Syst. 2015, 3, 31–34. [Google Scholar] [CrossRef]
- Galceran, E.; Carreras, M. A survey on coverage path planning for robotics. Robot. Auton. Syst. 2013, 61, 1258–1276. [Google Scholar] [CrossRef]
- Kumar, K.; Kumar, N. Region coverage-aware path planning for unmanned aerial vehicles: A systematic review. Phys. Commun. 2023, 59, 102073. [Google Scholar] [CrossRef]
- Choset, H. Coverage of known spaces: The boustrophedon cellular decomposition. Auton. Robot. 2000, 9, 247–253. [Google Scholar] [CrossRef]
- Gabriely, R.; Rimon, E. Spanning-tree based coverage of continuous areas by a mobile robot. Ann. Math. Artif. Intell. 2001, 31, 77–98. [Google Scholar] [CrossRef]
- Athanasopoulou, E.; Xidias, E.; Azariadis, P. Divide areas algorithm for optimal multi-robot coverage path planning. In Proceedings of the 2013 16th International Conference on Advanced Robotics (ICAR), Montevideo, Uruguay, 25–29 November 2013; pp. 1–6. [Google Scholar]
- Dias, M.B.; Zlot, R.; Kalra, N.; Stentz, A. Market-based multirobot coordination: A survey and analysis. Proc. IEEE 2006, 94, 1257–1270. [Google Scholar] [CrossRef]
- Baras, N.; Dasygenis, M. UGV coverage path planning: An energy-efficient approach through turn reduction. Electronics 2023, 12, 2959. [Google Scholar] [CrossRef]
- Vasquez, J.I.; Merchán-Cruz, E.A. A divide and conquer strategy for sweeping coverage path planning. Energies 2022, 15, 7898. [Google Scholar] [CrossRef]
- Dogru, S.; Marques, L. ECO-CPP: Energy constrained online coverage path planning. Robot. Auton. Syst. 2022, 157, 104242. [Google Scholar] [CrossRef]
- Arif, M.U.; Haider, S. On-line task allocation for multi-robot teams under dynamic scenarios. Intell. Decis. Technol. 2024, 18, 1053–1076. [Google Scholar] [CrossRef]
- Hart, P.E.; Nilsson, N.J.; Raphael, B. A formal basis for the heuristic determination of minimum cost paths. IEEE Trans. Syst. Sci. Cybern. 1968, 4, 100–107. [Google Scholar] [CrossRef]
- Majeed, A.; Lee, S. A new coverage flight path planning algorithm based on footprint sweep fitting for unmanned aerial vehicle navigation in urban environments. Appl. Sci. 2019, 9, 1470. [Google Scholar] [CrossRef]
- Jayalakshmi, K.P.; Nair, V.G.; Sathish, D. MRSimEx-DSTC: A dynamic spanning tree coverage approach for multi-robot exploration and coverage path planning. IEEE Access 2025, 13, 163085–163102. [Google Scholar] [CrossRef]
- Matlekovic, L.; Schneider-Kamp, P. Constraint programming approach to coverage path planning for autonomous multi-UAV infrastructure inspection. Drones 2023, 7, 563. [Google Scholar] [CrossRef]
- Tang, J.; Ma, H. Mixed integer programming for time-optimal multi-robot coverage path planning with efficient heuristics. IEEE Robot. Autom. Lett. 2023, 8, 6491–6498. [Google Scholar] [CrossRef]
- Liu, H.; Shao, Z.; Zhou, Q.; Tu, J.; Zhu, S. Task allocation algorithm for heterogeneous UAV swarm with temporal task chains. Drones 2025, 9, 574. [Google Scholar] [CrossRef]
- Wang, G.; Lv, X.; Cui, L.; Yan, X. The methods of task pre-allocation and reallocation for multi-UAV cooperative reconnaissance mission. IET Collab. Intell. Manuf. 2023, 5, e12090. [Google Scholar] [CrossRef]
- Xu, J.; Qin, B.; Bai, H.; Li, K. Task allocation and path planning for multi-robot inspection in mines considering charging. Sci. Rep. 2026. [Google Scholar] [CrossRef]
- Kim, K.; Kim, J. Efficient graph-based area partitioning for balanced multi-robot coverage path planning. Robot. Auton. Syst. 2026, 201, 105445. [Google Scholar] [CrossRef]
- Li, Y.; Chen, W.; Fu, B.; Wu, Z.; Hao, L. A global coverage path planning method for multi-UAV maritime surveillance in complex obstacle environments. Drones 2024, 8, 764. [Google Scholar] [CrossRef]
- Sharma, H.; Tiwari, R.; Shukla, S.; Kumar, S. Energy-efficient multi-robot coverage path planning with workload balancing and turn minimization. Int. J. Intell. Robot. Appl. 2026. [Google Scholar] [CrossRef]
Figure 1.
Sub-region and obstacle model on the grid map: irregular sub-regions (ellipse, L-shape, star-like polygon, and rotated ellipse) with irregular obstacles, and UAV starting points placed inside the regions. Translucent colored areas are the sub-regions, black blobs are the obstacles, and the stars mark the UAV starting points.
Figure 1.
Sub-region and obstacle model on the grid map: irregular sub-regions (ellipse, L-shape, star-like polygon, and rotated ellipse) with irregular obstacles, and UAV starting points placed inside the regions. Translucent colored areas are the sub-regions, black blobs are the obstacles, and the stars mark the UAV starting points.
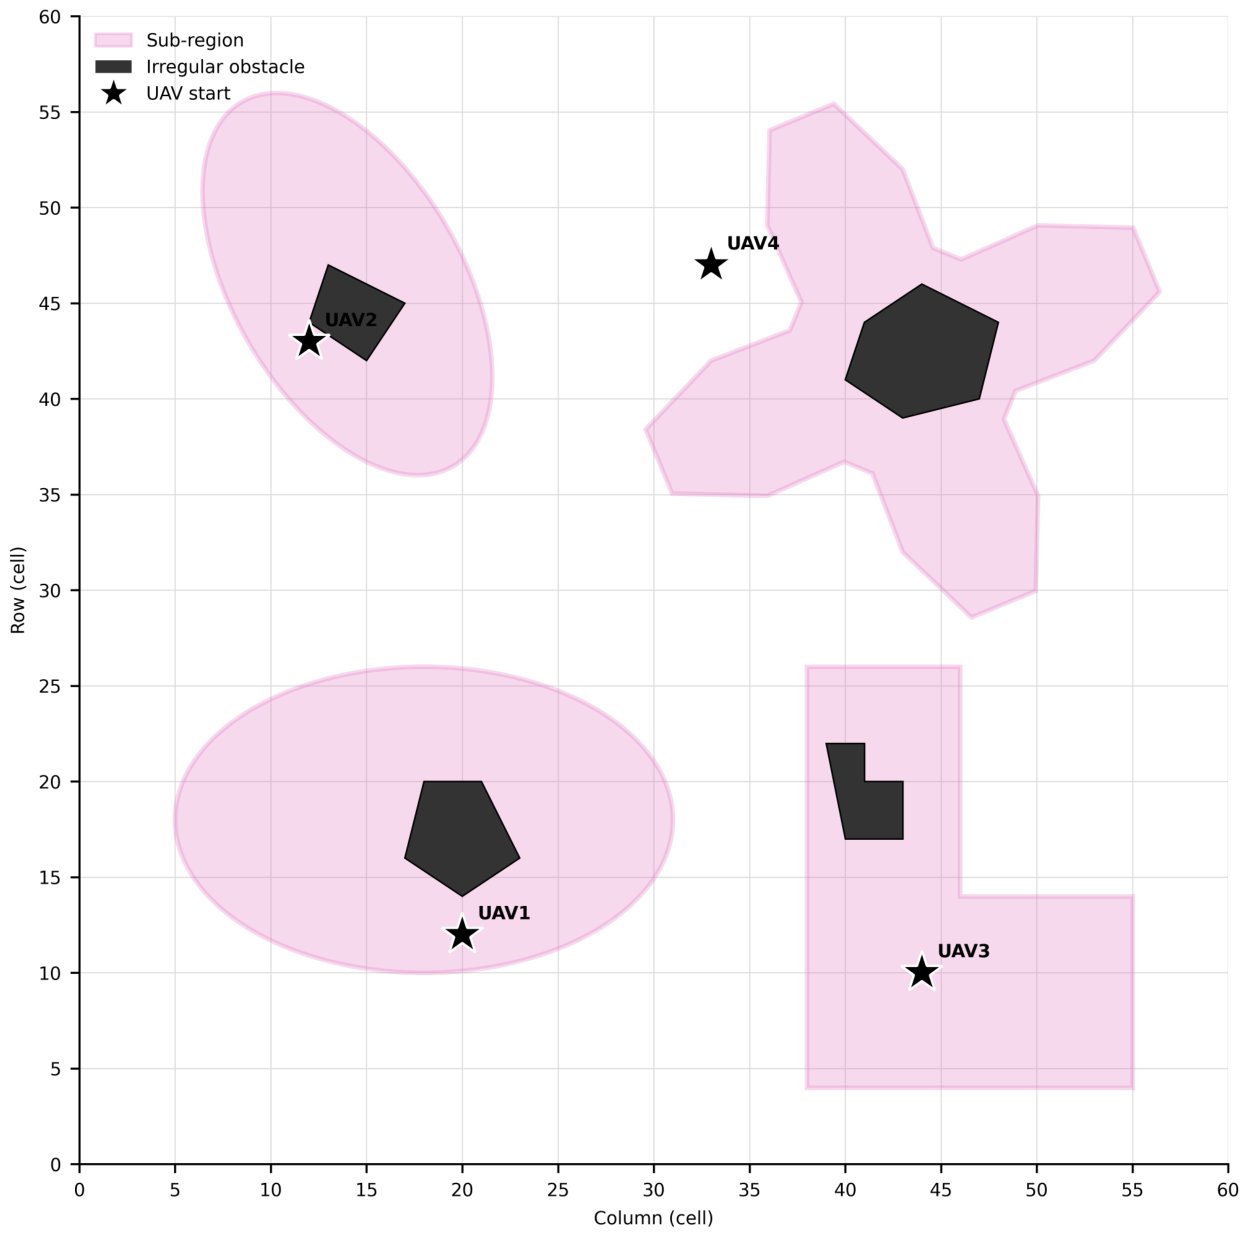
Figure 2.
Overview of the DARTS framework. The offline stage generates turn-aware sweep paths and solves the load-balanced allocation; the online stage refines the paths with A* and triggers the event-driven reallocation when a target is discovered, feeding the released tasks back into the allocation module.
Figure 2.
Overview of the DARTS framework. The offline stage generates turn-aware sweep paths and solves the load-balanced allocation; the online stage refines the paths with A* and triggers the event-driven reallocation when a target is discovered, feeding the released tasks back into the allocation module.
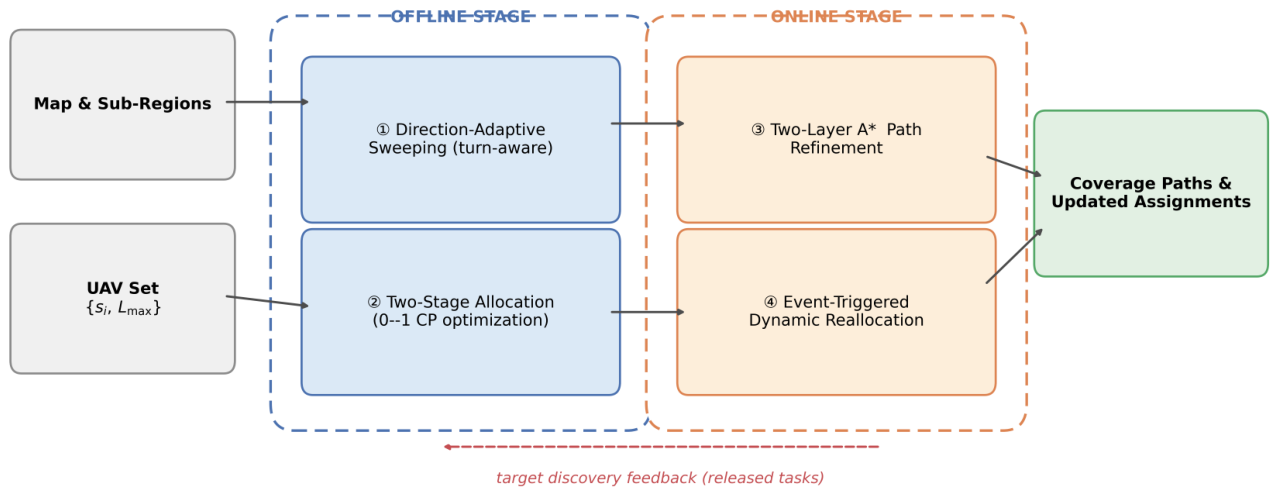
Figure 3.
Coefficient of variation of UAV path lengths across 15 random seeds under greedy and CP allocation.
Figure 3.
Coefficient of variation of UAV path lengths across 15 random seeds under greedy and CP allocation.
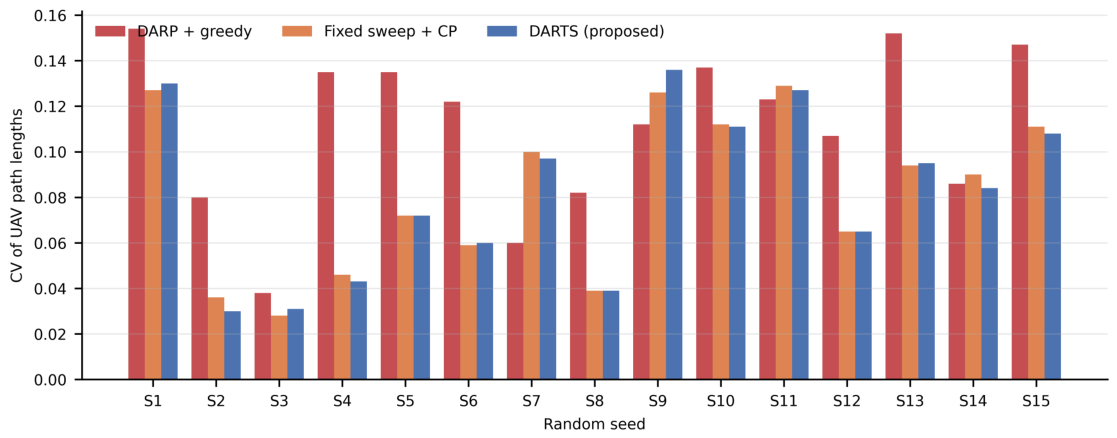
Figure 4.
Normalized average number of turns of the four fixed sweeping modes, the PCA-derived principal direction, and the adaptive selection on rectangular sub-regions (horizontal = 100).
Figure 4.
Normalized average number of turns of the four fixed sweeping modes, the PCA-derived principal direction, and the adaptive selection on rectangular sub-regions (horizontal = 100).
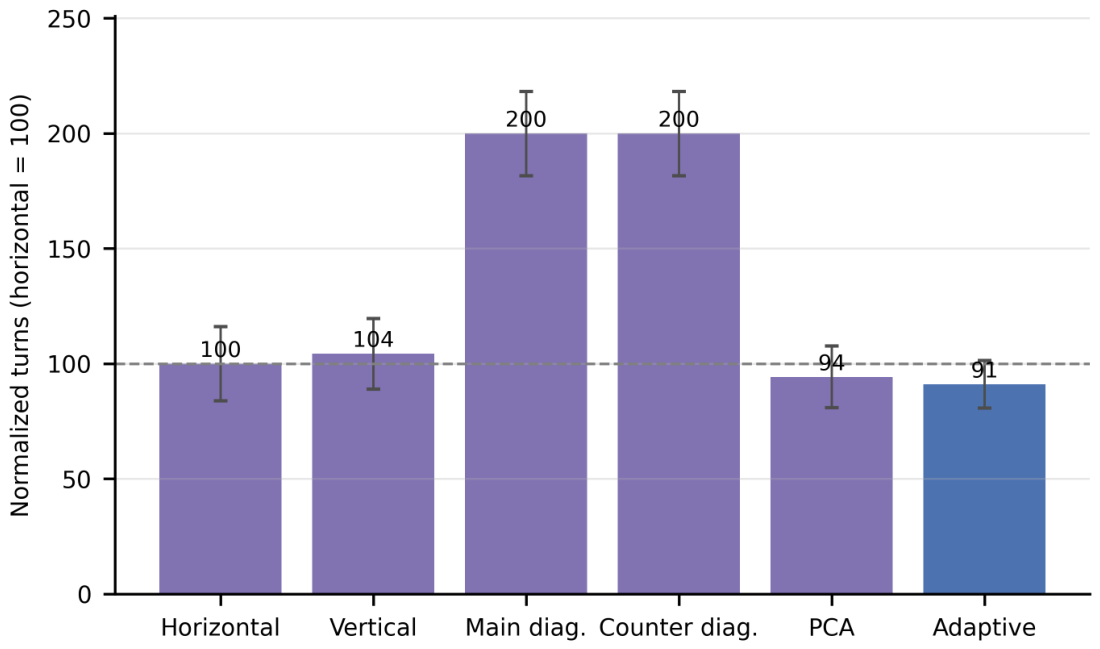
Figure 5.
Event-triggered reallocation on irregular sub-regions with irregular obstacles (seed 1). Left: initial paths before reallocation; right: final paths after reallocation. Gold stars mark the target locations. In the right panel, thick solid segments show the coverage paths taken over by the receiving UAVs, dotted segments show the handover transfer paths, circle markers denote the discovery points, and square markers mark the handover arrivals. Translucent fills and colored outlines indicate sub-region extents and boundaries, and the solid black blobs are the irregular obstacles, which lie inside the irregular sub-regions.
Figure 5.
Event-triggered reallocation on irregular sub-regions with irregular obstacles (seed 1). Left: initial paths before reallocation; right: final paths after reallocation. Gold stars mark the target locations. In the right panel, thick solid segments show the coverage paths taken over by the receiving UAVs, dotted segments show the handover transfer paths, circle markers denote the discovery points, and square markers mark the handover arrivals. Translucent fills and colored outlines indicate sub-region extents and boundaries, and the solid black blobs are the irregular obstacles, which lie inside the irregular sub-regions.
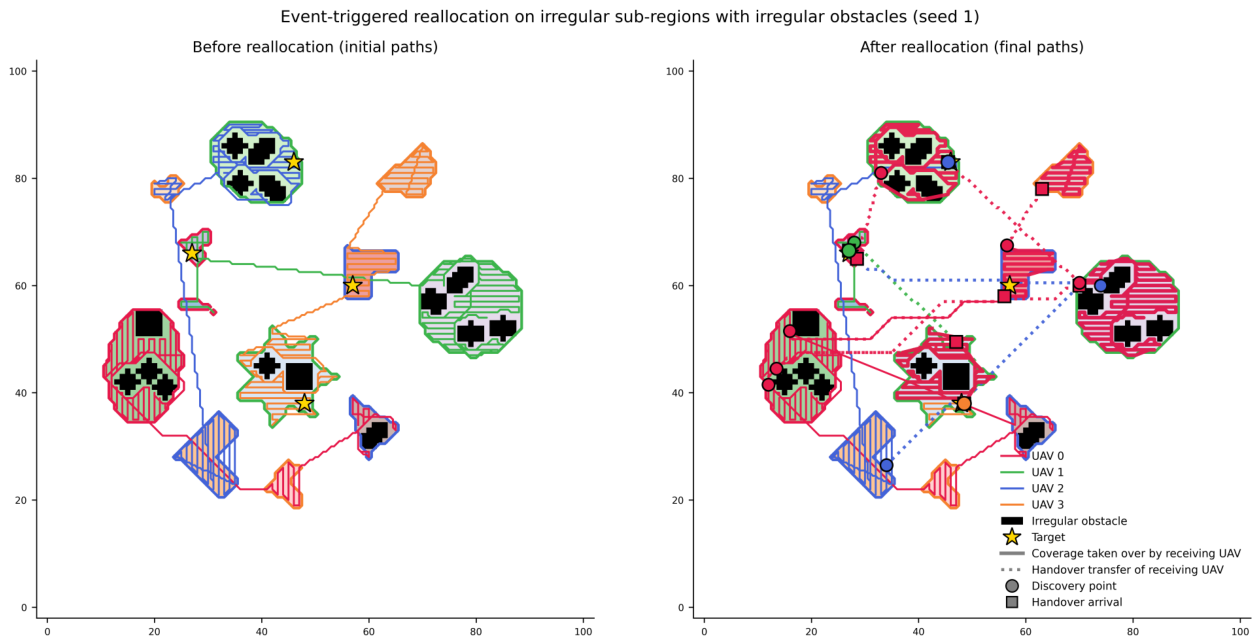
Figure 7.
Ablation of the two-stage CP allocation and the dynamic reallocation modules.
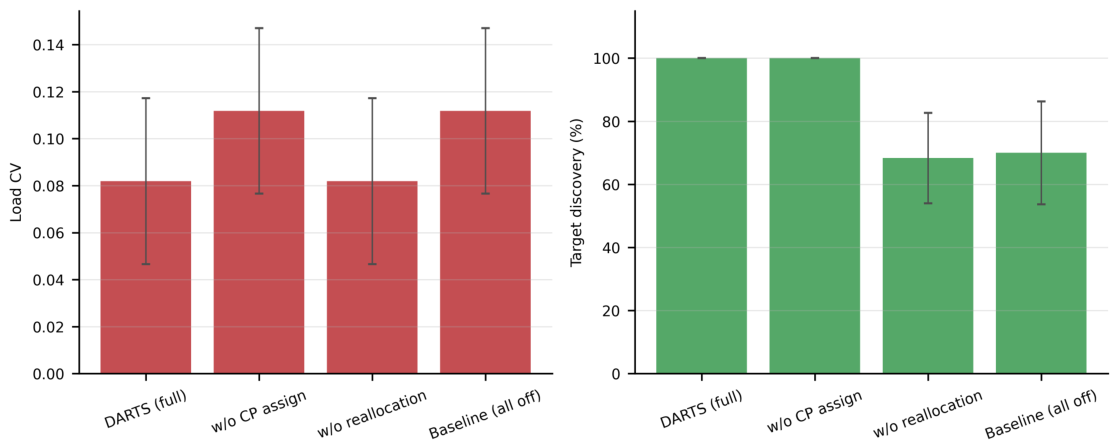
Figure 8.
Load CV of the greedy and the CP allocation across parameter settings.
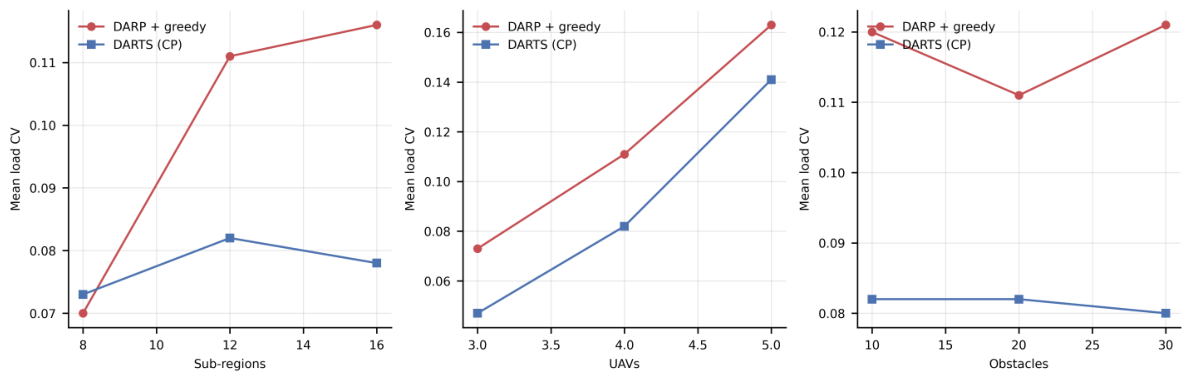

Table 1.
Simulation parameters.
| Parameter | Value |
|---|---|
| Map size | cells (double resolution ) |
| Number of UAVs | 4 |
| Number of sub-regions | 12 requested (rectangles, 18–30 cells per side; rejection sampling places 7–12, mean ≈9.4) |
| Number of obstacles | 20 (, ≈1.8% occupancy) |
| Targets (reallocation) | 4, sampled uniformly among all sub-regions |
| Obstacle safety radius | 1.0 (double-resolution cells) |
| Area-to-path factor | 2.5 |
| Scan modes | Horizontal / Vertical / Main diagonal / Counter diagonal / PCA principal / Adaptive |
| Assignment methods | Initial allocation: two-stage 0–1 programming (constraint programming); online reallocation: greedy composite score |
| Random seeds | 1–15 |
Table 2.
Load-balancing comparison (12 requested regions, 4 UAVs, 15 seeds).
| Method | CV (mean±std) | max/min (mean±std) | Mean path length |
|---|---|---|---|
| DARP + greedy | 2597 | ||
| Auction (market) allocation | 2583 | ||
| DARTS (CP + adaptive) | 2589 |
Table 3.
Dynamic reallocation under three policies (15 seeds).
| Metric | Reallocation | Stop-and-drop | Continue-and-cover |
|---|---|---|---|
| Target discovery | 100% | 68.3% | 98.3% |
| Coverage completion | 83.1% | 61.8% | 99.2% |
| Transfer overhead (of released path) | 13.1% | — | — |
Table 4.
Allocation time breakdown versus requested number of regions on the map (actual placements in parentheses).
Table 4.
Allocation time breakdown versus requested number of regions on the map (actual placements in parentheses).
| Regions (actual) | 8 (8) | 12 (9) | 16 (10) | 20 (10) | 24 (9) |
|---|---|---|---|---|---|
| Initial allocation (s) | 0.033 | 0.038 | 0.075 | 0.103 | 0.087 |
| Online reallocation (s) | 0.254 | 0.054 | 0.077 | 0.249 | 0.238 |
| Total allocation (s) | 0.287 | 0.092 | 0.151 | 0.353 | 0.326 |
Table 5.
A* transfer query time by start–goal distance.
| Distance | Avg (ms) | p95 (ms) |
|---|---|---|
| Short (<50 cells) | 1.75 | 4.08 |
| Medium (50–150 cells) | 18.80 | 41.04 |
| Long (>150 cells) | 79.79 | 149.65 |
Table 6.
Ablation study (12 regions, 4 UAVs).
| Configuration | Load CV | Target discovery |
|---|---|---|
| DARTS (full) | 0.082 | 100% |
| Without CP allocation (greedy) | 0.112 | 100% |
| Without reallocation | 0.082 | 68.3% |
| Baseline (all modules off) | 0.112 | 70.0% |
Table 7.
Parameter scan: mean load CV versus number of sub-regions.
| Regions | DARP + greedy | Auction | DARTS (CP) |
|---|---|---|---|
| 8 | 0.070 | 0.122 | 0.073 |
| 12 | 0.111 | 0.125 | 0.082 |
| 16 | 0.116 | 0.136 | 0.078 |
Table 8.
Parameter scan: mean load CV versus number of UAVs.
| UAVs | DARP + greedy | Auction | DARTS (CP) |
|---|---|---|---|
| 3 | 0.073 | 0.116 | 0.047 |
| 4 | 0.111 | 0.125 | 0.082 |
| 5 | 0.163 | 0.178 | 0.141 |
Table 9.
Parameter scan: mean load CV versus number of obstacles.
| Obstacles | DARP + greedy | Auction | DARTS (CP) |
|---|---|---|---|
| 10 | 0.120 | 0.135 | 0.082 |
| 20 | 0.111 | 0.125 | 0.082 |
| 30 | 0.121 | 0.134 | 0.080 |
Table 10.
Baseline comparison: DARP (full-map partition) versus DARTS (12 sub-regions), 8 seeds. The covered areas differ (about 12% of the traversable map for DARTS), so the path lengths are not directly comparable.
Table 10.
Baseline comparison: DARP (full-map partition) versus DARTS (12 sub-regions), 8 seeds. The covered areas differ (about 12% of the traversable map for DARTS), so the path lengths are not directly comparable.
| Method | Load CV | Mean path length (double cells) |
|---|---|---|
| DARP (full-map partition + MST coverage) | 0.000 | 9980 |
| DARTS (region scan) | 0.082 | 2589 |
Table 11.
Dynamic reallocation: DARTS (load-aware) versus simplified CBBA (cost-only).
| Method | Final load std | Transfer cost |
|---|---|---|
| DARTS reallocation | 637.7 | 93.7 |
| CBBA (cost-minimizing) | 948.9 | 85.1 |
Table 12.
Scalability results of the CP allocation on an map (3 seeds).
| Config. | CP time (s) | CV (CP) |
|---|---|---|
| 144 regions, 8 UAVs | 28.6 | 0.0269 |
| 144 regions, 16 UAVs | 15.1 | 0.0449 |
| 144 regions, 32 UAVs | 15.2 | 0.0613 |
| 144 regions, 64 UAVs | 15.5 | 0.1685 |
| 144 regions, 128 UAVs | 16.2 | 0.2524 |
| 24 regions, 16 UAVs | 25.2 | 0.3864 |
| 48 regions, 16 UAVs | 25.7 | 0.0912 |
| 72 regions, 16 UAVs | 26.4 | 0.0856 |
| 96 regions, 16 UAVs | 27.8 | 0.0653 |
| 200 regions, 16 UAVs | 15.2 | 0.0507 |
| 400 regions, 16 UAVs | 17.7 | 0.0203 |
| 800 regions, 16 UAVs | 57.2 | 0.0091 |
| 1000 regions, 16 UAVs | 82.7 | 0.0113 |
Disclaimer/Publisher’s Note: The statements, opinions and data contained in all publications are solely those of the individual author(s) and contributor(s) and not of MDPI and/or the editor(s). MDPI and/or the editor(s) disclaim responsibility for any injury to people or property resulting from any ideas, methods, instructions or products referred to in the content. |
© 2026 by the authors. Licensee MDPI, Basel, Switzerland. This article is an open access article distributed under the terms and conditions of the Creative Commons Attribution (CC BY) license (http://creativecommons.org/licenses/by/4.0/).
Copyright: This open access article is published under a Creative Commons CC BY 4.0 license, which permit the free download, distribution, and reuse, provided that the author and preprint are cited in any reuse.