

Submitted:
18 August 2026
Posted:
20 August 2026
You are already at the latest version
Abstract
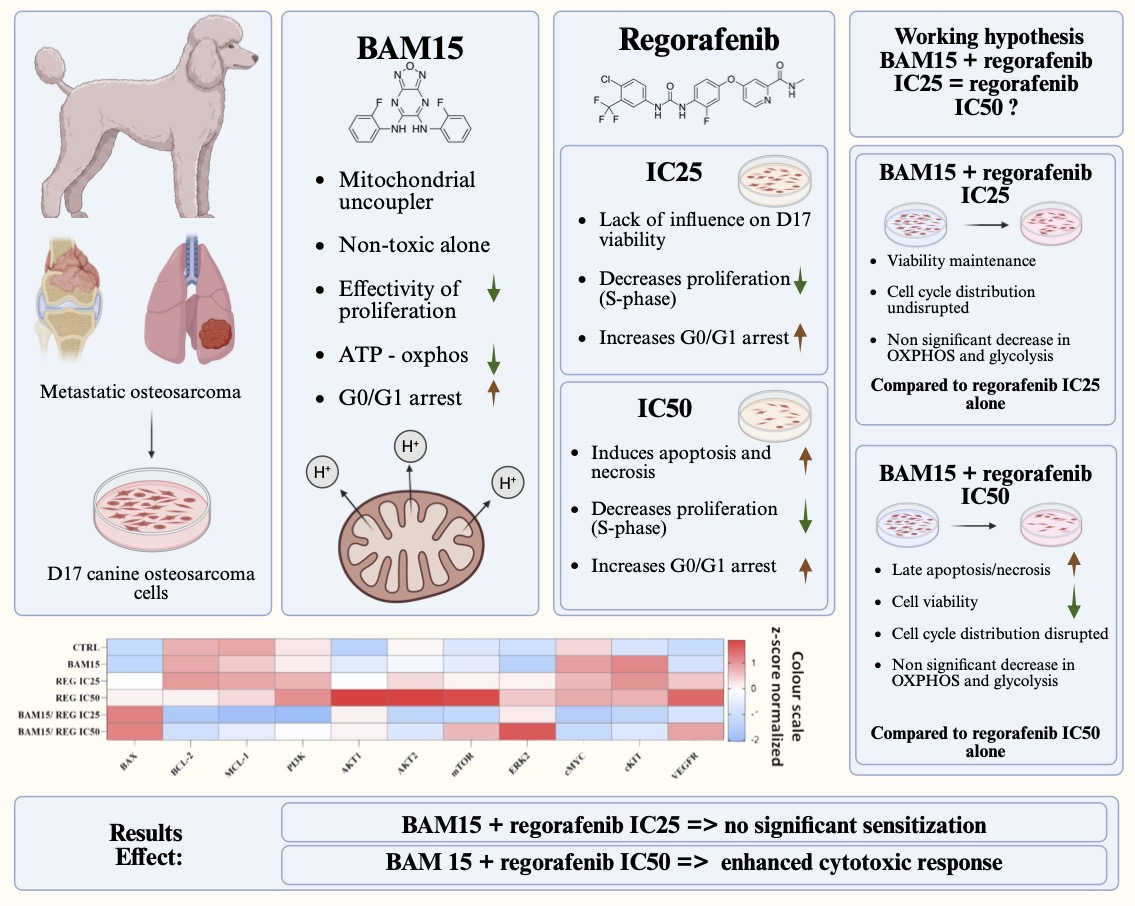
Osteosarcoma is an aggressive primary bone malignancy affecting both humans and dogs, and canine osteosarcoma represents a valuable comparative model for investigating novel therapeutic strategies. Targeting tumour metabolism may enhance the efficacy of existing anticancer treatments. This study investigated whether the mitochondrial uncoupler BAM15 sensitises canine D17 osteosarcoma cells to regorafenib. Cells were treated with BAM15 (20 µM) or regorafenib (REG; IC25, 8 µM; IC50, 16 µM) alone or pretreated with BAM15 before regorafenib exposure. Treatment effects were assessed using viability assays, Annexin V/propidium iodide staining, cell-cycle analysis, Seahorse XF bioenergetic profiling, quantitative PCR, and Western blotting. BAM15 alone was not cytotoxic but significantly enhanced the regorafenib-induced reduction in cell viability at IC50, whereas no significant sensitising effect occurred at IC25. Combined treatment at IC50 increased late apoptotic and necrotic populations and disrupted cell-cycle distribution. BAM15 reduced oxidative phosphorylation-derived ATP production without detectable glycolytic compensation but did not further suppress mitochondrial ATP production beyond regorafenib alone. Combined treatment also induced transcriptional changes in stress-adaptation-related genes, while protein analysis revealed reduced BAX and BAX/BCL-2 ratio. These findings provide preliminary evidence that mitochondrial uncoupling may modify osteosarcoma responses to regorafenib and warrant further mechanistic validation.
Keywords:
canine osteosarcoma
; regorafenib
; BAM15
; mitochondrial uncoupling
; metabolic plasticity
; comparative oncology
1. Introduction
Osteosarcoma occurs in dogs as a spontaneous malignancy and shows striking similarities in canine and human pathophysiology, biological behaviour, diagnosis, prognosis and treatment options [1]. Therefore, dogs serve as highly relevant comparative models in preclinical studies, accelerating the development of essential, life-saving therapeutics, enabling earlier assessment of drug safety and efficacy in a naturally occurring disease context [2]. Translational osteosarcoma research provides valuable insights into tumour biology, mechanisms of drug resistance, and treatment responses that are relevant to human clinical practice. This comparative, bidirectional approach advances veterinary care and has the potential to improve human cancer treatment strategies significantly [1].
Regorafenib (REG), an established anti-cancer drug in human medicine, represents a compelling candidate for repurposing in veterinary oncology. The drug is a multikinase inhibitor with anti-angiogenic and anti-proliferative effects [3]. It has emerged as a candidate therapeutic in human osteosarcoma, demonstrating limited but promising activity in clinical studies [4]. A randomised, double-blind, placebo-controlled study by Davis et al. demonstrated that regorafenib prolonged disease-free survival in adult patients with metastatic osteosarcoma compared with placebo [4]. Clinically, the drug has been approved in humans for the treatment of metastatic colorectal cancer, gastrointestinal stromal tumours (GIST), and hepatocellular carcinoma after progression on standard therapies [5]. In canines, the drug has been tested for its ability to reduce conjunctival scarring in postoperative wounds following glaucoma filtration surgery. Still, it has not yet been tested in veterinary oncology [6].
The limitations of current osteosarcoma therapies, together with the frequent emergence of drug resistance, underscore the need for alternative strategies that target broader and more fundamental vulnerabilities of tumour cells. Among these, altered energy metabolism and mitochondrial dysfunction have emerged as key determinants of osteosarcoma progression, survival, and therapeutic resistance. Targeting tumour bioenergetics represents a promising complementary approach to conventional signalling-based therapies.
In this context, we investigated BAM15, a mitochondrial uncoupler, as a candidate agent capable of modulating mitochondrial function and disrupting metabolic homeostasis, with the potential to enhance anti-tumor activity in osteosarcoma models [7]. BAM15 also known as N5,N6-Bis(2-fluorophenyl) [2,3]oxadiazolo [4,5-b]pyrazine-5,6-diamine modulate cell metabolism by disrupting mitochondrial membrane potential [8]. As a protonophore, BAM15 reduces mitochondrial coupling efficiency, thereby compromising ATP production [9]. Due to rapid proliferation, cancer cells have higher energy requirements and depend more on mitochondrial metabolism [10]. This mechanism suggests that BAM15 may act more selectively on cancer cells, potentially re-sensitising them to anti-cancer agents. Moreover, BAM15 is a novel agent under investigation for its potential in obesity, diabetes, sepsis, cardiovascular disease, and cancer treatment [7,11,12].
In the current study, we investigated the dose-dependent effects of regorafenib in the D17 canine osteosarcoma cell line and assessed whether mitochondrial uncoupling with BAM15 can modulate cellular responses to this treatment. By using a canine osteosarcoma cell model, this study provides a comparative in vitro framework for investigating whether metabolic modulation can enhance the response to regorafenib, with potential translational relevance to osteosarcoma treatment across species. In light of increasing evidence that cellular metabolic context may influence responses to targeted therapies, mitochondrial uncoupling was examined as a complementary experimental approach to explore potential metabolic contributions to treatment responsiveness [13]. Overall, this work establishes a controlled comparative in vitro framework to support further mechanistic and preclinical investigations of regorafenib combined with metabolic modulation in osteosarcoma, with potential relevance to both human and veterinary oncology.
2. Materials and Methods
Cell Culture
The cell line used for the in vitro experiment was a well-established D17 canine osteosarcoma cell line derived from a lung OSA metastasis with an epithelial morphology. For the experiment, cells were used at passage 12. The cell line was obtained from the American Type Culture Collection (ATCC; CRL-1427). The culture conditions include Complete Growth Medium (CGM) consisting of Eagle’s Minimum Essential Medium (EMEM, Sigma-Aldrich/Merck, Poznań, Poland) with 10% Fetal Bovine Serum (Gibco, Thermo Fisher Scientific, Waltham, MA, USA) and 1% Penicillin-Streptomycin (Sigma-Aldrich/Merck, Poznań, Poland). Cells were incubated in 37 ℃ with an atmosphere containing 5% CO2 in a humidified incubator under constant sterile conditions. The growth medium was replaced every 2 to 3 days, and cells were passaged upon reaching 70% confluence using the Stable-Cell Trypsin solution (Sigma Aldrich/Merck, Poznań, Poland). The cells have been tested for Mycoplasma contamination by IDEXX BioAnalytics (Germany), and all cultures used in the experiments were confirmed to be Mycoplasma-free.
Preparation of Regorafenib and BAM15
Regorafenib (MedChemExpress, USA) was dissolved in sterile DMSO to prepare a 1 mM stock solution, while BAM15 (Sigma-Aldrich/Merck) was prepared as a 20 mM stock. Both solutions were filtered through 0.22 μm syringe filters and diluted in culture medium immediately prior to use. Control cells received DMSO at a final concentration of 0.34% (v/v); the concentration corresponded with vehicle concentrations of regorafenib and BAM15-treated samples.
Screening Assay
Regorafenib cytotoxicity was evaluated using the MTS assay (Abcam). D17 cells were seeded in 96-well plates (1 × 10⁴ cells/well) in 200 μL of complete growth medium (CGM) and treated with regorafenib (2.5, 5, 10, 25, 50, 100, 250, 500, 750, 1000 µM). After 48 hours of drug exposure, MTS reagent was added to the cells, and absorbance was measured at 490 nm using a Spark 10M plate reader (Tecan). The IC50 value was calculated as 15.7 ± 0.25 µM. Based on preliminary data and published reports, BAM15 was used at 20 µM.
Experiment Design
Cells were seeded at 8 × 10³ cells/well on a 96-well plate and allowed to adhere for 24 h. Treatment groups included: (1) vehicle control (DMSO), (2) regorafenib IC25 (8 µM), (3) regorafenib IC50 (16 µM), (4) BAM15 alone (20 µM), (5) BAM15 + regorafenib IC25, and (6) BAM15 + regorafenib IC50. Cells were pretreated with BAM15 for 16 h, followed by regorafenib exposure for 48 h.
Cell Viability Assays
Cell viability and metabolic activity were each conducted on separately seeded 96-well plates, using MTS and Alamar Blue assays (Sigma-Aldrich/Merck), performed according to the manufacturer’s protocol. Two independent biological experiments were performed, one for each test, each experiment with six technical replicates per condition. Results were normalized to vehicle-treated controls.
Seahorse Extracellular Flux Analysis (OCR/ECAR)
Mitochondrial respiration and glycolytic activity were assessed using a Seahorse XFe96 Analyzer (Agilent Technologies, Santa Clara, CA). Prior to analysis, cells were incubated for one hour in Seahorse XF DMEM (pH 7.4) supplemented with glucose (10 mM), pyruvate (1 mM), and glutamine (2 mM), following the incubation sensor cartridge was prepared with oligomycin at a final concentration of 1.5 µM, and a mixture of rotenone and antimycin A at a final concentration of 0.5 µM. The resulting Seahorse data were processed and analyzed using Wave software (Agilent Technologies). Oxygen consumption rate (OCR) and extracellular acidification rate (ECAR) were measured using the Mito Stress Test and Glycolysis Stress Test protocols with sequential injections of oligomycin, FCCP, and rotenone/antimycin A. Data were analyzed using Wave software. Prior to exporting the dataset, ATP production rate and metabolic parameters were normalized to the cell number per well using the Normalize module in the Wave software. These normalized values were then used for subsequent analyses and graphical representations.
Apoptosis Profile Assays
Apoptosis was assessed by Annexin V/PI staining using the Dead Cell Apoptosis Kit (Invitrogen Life Technologies, Warsaw, Poland). Following washing, the cells were resuspended in 100 µL of 1X annexin-binding buffer. Subsequently, 5 µL of Alexa Fluor™ 488 Annexin V and 1 µL of propidium iodide (PI) working solution (100 µg/mL) were added to the suspension. The samples were then incubated at room temperature for 15 minutes in the dark. Following the incubation period 400 µL of 1X annexin-binding buffer was added to the samples, then gently mixed, and subsequently the samples were kept on ice until analysis. CytoFLEX flow cytometer was used to measure fluorescence (Beckman Coulter, CA, USA), the assay used included excitation at 488 nm and emission detection at 530 nm (Annexin V) and 575 nm (PI). Cells were stained according to the manufacturer’s protocol and analyzed using a CytoFLEX flow cytometer (Beckman Coulter). Data were processed using CytExpert 2.4 software. For every sample, 30,000 events corresponding to individual cells were acquired. Cellular debris was excluded according to forward and side scatter properties, and cell aggregates were eliminated by comparing FSC signal area with height and width parameters. Subsequent analysis was restricted to the singlet population, after which quadrant gating or region gating was applied to evaluate apoptosis and in the population. Gates were defined based on unstained and single-stained reference controls and were consistently maintained across all experimental groups.
Cancer-Related Gene Expression Analysis
Gene expression measurements were performed using quantitative real-time PCR using the SensiFAST SYBR® & Fluorescein Kit (Bioline Reagents Ltd., London, UK) on a CFX Opus 384 Real-Time PCR Detection System (Bio-Rad, Hercules, CA, USA). Total RNA was extracted using TRI Reagent (Sigma-Aldrich/Merck, Poznań, Poland) following the manufacturer’s instructions. RNA concentration and purity were assessed spectrophotometrically using a DS-11 Fx spectrophotometer (Denovix, Wilmington, DE, USA).
To preserve RNA integrity, total RNA (500 ng) was treated with DNase I using the PrecisionDNAse kit (PrimerDesign, BLIRT S.A., Gdańsk, Poland) prior to reverse transcription. cDNA was then synthesized using the Tetro cDNA Synthesis Kit (Bioline Reagents Limited, London, UK) according to the manufacturer’s protocol, using a T100 Thermal Cycler (Bio-Rad, Hercules, CA, USA). Each reaction was performed in a 10 µL total volume, consisting of 1 µL cDNA, 5 µL 2× Master Mix, and gene-specific primers at a final concentration of 500 nM. The thermal profile began with initial denaturation at 95 °C for 2 min, followed by 40 cycles of denaturation at 95 °C for 15 s, annealing at the primer-specific temperature (typically 62 °C for 15 s), and extension at 72 °C for 15s.
Gene expression levels were normalized to the reference gene (GAPDH) and relative transcript abundance was calculated using the 2^–ΔΔCq method, incorporating the RQMAX normalization approach, in which data are scaled to the lowest-expressed reference sample. The primer sequences applied in this study are presented in Table S1.
Protein Expression Analysis - Western Blot
Protein expression was analysed by Western blotting following a protocol previously established in our laboratory [14,15]. Total protein was isolated from D17 cells using ice-cold RIPA buffer (Sigma-Aldrich/Merck, Poznań, Poland) supplemented with 1% protease and phosphatase inhibitor cocktail (Thermo Fisher Scientific, Warsaw, Poland). Protein concentration was determined using a bicinchoninic acid (BCA) assay (Thermo Fisher Scientific, Warsaw, Poland). Equal amounts (10μg) of protein were separated by SDS-PAGE, transferred onto PVDF membranes, and incubated with the appropriate primary and HRP-conjugated secondary antibodies. Protein bands were visualised using the ChemiDoc™ XRS imaging system (Bio-Rad, Hercules, CA, USA), and band intensities were quantified by densitometric analysis using Image Lab™ software (version 6.1; Bio-Rad: Hercules, CA, USA; 2020) and normalised to β-actin (ACTB).
Statistical Analysis
All data were analyzed using GraphPad Prism version 10.6.1 (GraphPad Software, San Diego, CA, USA). Each experiment comprised two independent biological repeats, with duplicate technical measurements performed for every condition in each run. Statistical analyses were based on values averaged within each biological replicate, following the methodology previously established by our group for comparable datasets [15]. Graphs and statistical outputs were generated within the software. Normality of data distribution was assessed using the Shapiro–Wilk test. Statistical analyses were performed using one-way ANOVA, followed by Tukey’s multiple comparisons post-hoc test. Differences that were not statistically significant were denoted as “ns”. A significance threshold of p < 0.05 was applied. Statistical significance was indicated in the figures by asterisks as follows: p < 0.05 (*), p < 0.01 (**), p < 0.001 (***), and p < 0.0001 (****).
3. Results
Regorafenib Reduces the Viability of D17 Canine Osteosarcoma Cells in A Concentration-Dependent Manner, with BAM15 Enhancing Metabolic Decline at IC50
The IC50 value obtained for regorafenib in D17 cells was 15.7 ± 0.25 μM, as determined from the dose-response curve, reflecting a concentration-dependent inhibition of cell viability (Figure 1a).
Evaluation of regorafenib and BAM15, tested alone and in combination, showed that regorafenib reduced the viability of D17 cells in a concentration-dependent manner, with a more pronounced effect observed at IC50 compared to IC25. Compared with the control, BAM15 treatment alone showed no cytotoxicity, and BAM15 pretreatment did not modify the cytotoxic response to regorafenib at IC25. Notably, pretreatment with BAM15 followed by regorafenib at its IC50 significantly decreased cell viability compared with regorafenib alone at its IC50 (Figure 1b).
Regorafenib at IC25 Does Not Alter the Apoptotic Profile, Whereas IC50 Induces Marked Cytotoxicity That Is Enhanced by BAM15 in D17 Canine Osteosarcoma Cells
The analysis of the effects of regorafenib, BAM15, and their combination on cell survival and apoptosis in canine osteosarcoma D17 cells revealed that BAM15 alone did not significantly affect cell metabolism or the distribution of apoptotic populations compared with the control (Figure 2 a, d, g-j). Similarly, treatment with regorafenib at the IC25 concentration did not induce significant changes in the apoptotic profile of D17 cells, and this pattern remained unchanged following BAM15 pre-treatment (Figure 2, a, b, e, g-j).
In contrast, regorafenib at the IC50 concentration exerted a marked cytotoxic effect, manifested by a significant increase in the proportion of late apoptotic cells, along with an elevation in the early apoptotic fraction (Figure 2c). Notably, pre-treatment with BAM15 further enhanced this effect, resulting in a statistically significant increase in late apoptosis in D17 cells (Figure 2 f, i). An increased proportion of necrotic cells additionally reflected the cytotoxic response to regorafenib at IC50 (Figure 2c, h). The accumulation of cells in late apoptosis, together with an increased necrotic fraction, reflects the strong cytotoxic effect of regorafenib at IC50. Moreover, BAM15 increased the sensitivity of D17 cells to the drug, resulting in rapid progression toward irreversible cell death (Figure 2f, h).
Collectively, these results indicate that while BAM15 alone does not affect the survival or apoptotic status of D17 cells, it amplifies regorafenib-induced cytotoxicity at higher drug concentration (Figure 2).
Regorafenib at IC25 Induces G0/G1 Cell Cycle Arrest, Whereas IC50 promotes Cell Cycle Disruption That Is Enhanced by BAM15 in D17 Canine Osteosarcoma Cells
BAM15 treatment resulted in a significant increase in the proportion of D17 canine osteosarcoma cells in the G0/G1 phase, accompanied by a marked reduction in the proliferating S-phase population. In contrast to the control, BAM15 did not affect the cells’ shift into the G2/M fraction (Figure 3g–i).
Regorafenib treatment at both IC25 and IC50 concentrations induced a significant accumulation of cells in the G0/G1 phase. Notably, a more pronounced G0/G1 arrest was observed at the lower concentration of the drug (Figure 3g). The regorafenib-induced G0/G1 arrest was associated with a decrease in the proportion of S-phase cells (Figure 3h). At the same time, regorafenib treatment at IC50 additionally increased the fraction of cells in the G2/M phase compared to IC25.
Analysis of the combined treatment confirmed that BAM15 potentiated the toxic effect of regorafenib only at the IC50, as evidenced by a further reduction in the S-phase population and a decreased proportion of cells in the G2/M phase (Figure 3i).
Overall, the data suggest that regorafenib at IC25 causes G0/G1 arrest of canine D17 cells, whereas treatment of the cells with the drug at IC50 results in broader alterations in cell cycle distribution, which are also enhanced by BAM15 action (Figure 3g–i).
Glycolysis-Supported ATP Production Is Preserved Despite OXPHOS Impairment Induced by BAM15 and Regorafenib in D17 Canine Osteosarcoma Cells
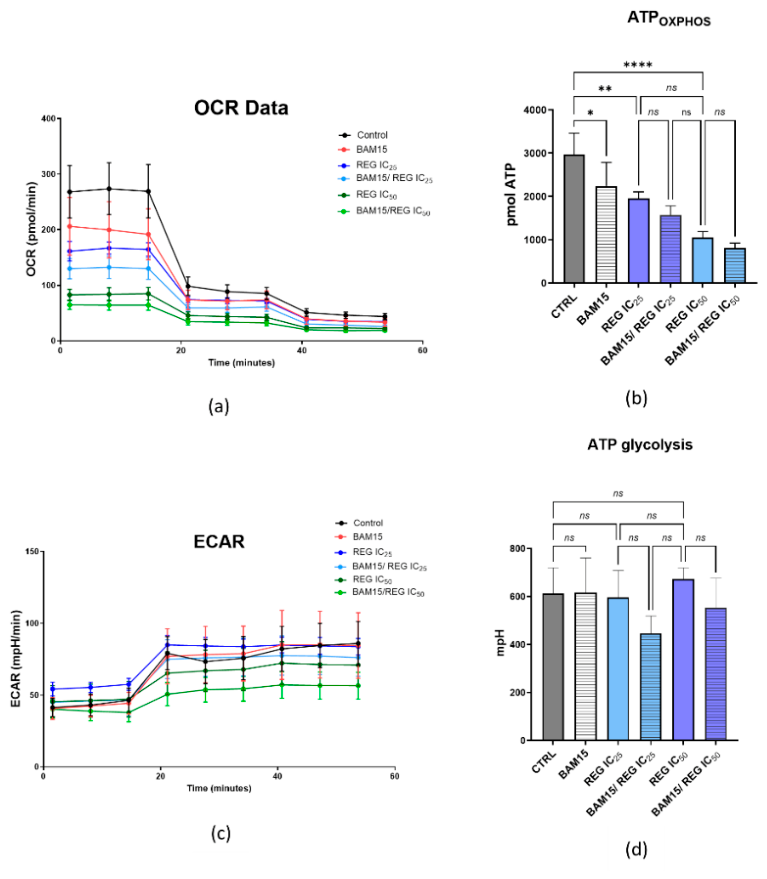
Real-time analysis of ATP production in canine osteosarcoma D17 cells revealed that exposure to BAM15, as well as to regorafenib at IC25 and IC50 concentrations applied individually, resulted in a significant reduction in ATP synthesis from oxidative phosphorylation (OXPHOS). In contrast, ATP production supported by glycolysis remained unaffected under these conditions. Furthermore, BAM15 pretreatment followed by regorafenib at both IC25 and IC50 led to a modest decrease in ATP synthesis in OXPHOS and glycolysis, but these changes did not reach statistical significance. The metabolic profile observed following BAM15 treatment is consistent with its established role as a mitochondrial uncoupler, which reduces the efficiency of OXPHOS without causing a profound depletion of cellular ATP pools or a compensatory upregulation of glycolytic ATP production. The metabolic profile observed under experimental conditions indicates a selective vulnerability of OXPHOS-dependent ATP synthesis in D17 cells. At the same time, glycolysis-supported energy production in D17 remains largely resilient to both BAM15 and regorafenib exposure, which is consistent with the expected bioenergetic response to mitochondrial uncoupling and targeted kinase inhibition.
Figure 4.
Effects of BAM15 and regorafenib on mitochondrial respiration and glycolytic activity in canine osteosarcoma D17 cells. (a) Oxygen consumption rate (OCR) measured over time using the Seahorse XF analyzer following treatment with BAM15 (20 µM), regorafenib at IC25 or IC50, or their combinations, compared to control cells. (b) Quantification of ATP production derived from oxidative phosphorylation (ATPOXPHOS). (c) Extracellular acidification rate (ECAR) measured as an indicator of glycolytic activity. (d) Quantification of ATP production derived from glycolysis. Data are presented as mean ± SD. Statistical significance was determined between indicated groups (*p < 0.05, **p < 0.01, ****p < 0.0001; ns, not significant).
Figure 4.
Effects of BAM15 and regorafenib on mitochondrial respiration and glycolytic activity in canine osteosarcoma D17 cells. (a) Oxygen consumption rate (OCR) measured over time using the Seahorse XF analyzer following treatment with BAM15 (20 µM), regorafenib at IC25 or IC50, or their combinations, compared to control cells. (b) Quantification of ATP production derived from oxidative phosphorylation (ATPOXPHOS). (c) Extracellular acidification rate (ECAR) measured as an indicator of glycolytic activity. (d) Quantification of ATP production derived from glycolysis. Data are presented as mean ± SD. Statistical significance was determined between indicated groups (*p < 0.05, **p < 0.01, ****p < 0.0001; ns, not significant).
Regorafenib Induces Dose-Dependent Cytotoxicity- and Adaptation-Related Transcriptional Responses in D17 Canine Osteosarcoma Cells, Differentially Altered by BAM15
Analysis of apoptosis-related transcripts in the D17 cell line demonstrated that regorafenib markedly altered the balance between pro- and anti-apoptotic signalling in a dose-dependent manner, while BAM15 modulated these effects.
BAX expression was significantly upregulated following regorafenib treatment, with increased mRNA levels observed at both IC25 and IC50 concentrations. BAM15 alone did not significantly affect BAX expression in D17 cells, and co-treatment with BAM15 and regorafenib did not further enhance BAX levels compared with regorafenib alone, indicating that BAX induction was primarily driven by regorafenib (Figure 5a).
At the IC25 concentration, regorafenib treatment was associated with increased accumulation of the anti-apoptotic BCL-2 transcript in D17 cells, while pre-treatment with BAM15 reduced BCL-2 mRNA expression. In contrast, BCL-2 expression in D17 cells was significantly decreased by regorafenib at the IC50 concentration, whereas pre-treatment with BAM15 partially attenuated this effect (Figure 5b).
Analysis of the BAX/BCL-2 ratio revealed a modest increase in the pro-apoptotic balance at the IC25 concentration of regorafenib following BAM15 pre-treatment. In contrast, regorafenib alone at IC50 produced the strongest pro-apoptotic shift, whereas BAM15 pre-treatment was associated with a relative reduction of this effect (Figure 5c).
Changes in the BAX/BCL-2 ratio were paralleled by alterations in MCL-1 mRNA (Figure 5d). D17 treated only with BAM15 treatment had significantly reduced MCL-1 transcript levels compared with the control culture, indicating an intrinsic effect of mitochondrial uncoupling on this anti-apoptotic regulator. In contrast, D17 treatment with regorafenib at the IC25 concentration alone did not alter MCL-1 expression in relation to the control; however, BAM15 pre-treatment resulted in a significant decrease in MCL-1 mRNA levels. The strongest suppression of MCL-1 expression was observed with regorafenib alone at IC50, while BAM15 pre-treatment was associated with a partial mitigation of this effect.
Analysis of the expression of genes related to the PI3K–AKT–mTOR signaling pathway also indicated a dose-dependent effect of regorafenib on the transcriptional activity of its key components (Figure 6) and a modulatory effect of BAM15.
Treatment of D17 cells with regorafenib at the IC25 concentration resulted in a significant upregulation of PI3K, AKT1, and mTOR mRNA levels compared to control cultures (Figure 6a,b,d). Moreover, pre-treatment with BAM15 followed by regorafenib exposure at the IC25 concentration resulted in a significant upregulation of AKT1 and mTOR transcripts, suggesting their involvement in modulating the adaptive response of D17 cells to the sub-cytotoxic stress. This transcriptional response is consistent with the activation of pro-survival mechanisms and correlates with the increased mRNA expression of the anti-apoptotic factor BCL-2.BAM15 alone significantly affected only AKT1 expression.
In contrast, exposure to regorafenib at the IC50 concentration led to marked suppression of PI3K and mTOR expression, which is consistent with pathway inhibition under cytotoxic conditions. Notably, BAM15 pre-treatment partially restored the expression of both genes in cells treated with regorafenib at IC50, indicating a modulatory effect of mitochondrial uncoupling on mRNA levels of these markers. Regorafenib-induced upregulation of AKT1 expression in D17 at IC50 concentration resulted in comparable transcript levels to those observed, and was not significantly influenced by prior BAM15 exposure.
AKT2 expression was not significantly altered following treatment with BAM15 alone or regorafenib at either IC25 or IC50 when compared with control cells. However, treatment with regorafenib at IC50 resulted in a significant decrease in AKT2 expression compared with IC25. In contrast, BAM15 pre-treatment combined with regorafenib at IC25 led to a significant upregulation of AKT2, suggesting activation of a compensatory pro-survival and metabolic adaptation response. This effect was not observed at the IC50 concentration, where BAM15 pre-treatment did not modify AKT2 expression, consistent with the predominance of regorafenib-induced cytotoxicity at higher drug doses.
Further analysis of the stress-responsive signaling profile revealed that D17 cells exposed to BAM15 alone exhibited a significant reduction in ERK2 expression. In contrast, regorafenib treatment at both IC25 and IC50 concentrations led to a significant upregulation of ERK2 expression, but in a dose-independent manner. Notably, BAM15 pre-treatment further enhanced ERK2 expression in regorafenib-treated cells at both concentrations (Figure 7a).
Moreover, compared with control cells, BAM15 alone significantly upregulated c-MYC and c-KIT expression. Regorafenib exposure at IC25 similarly significantly increased c-MYC and c-KIT transcript levels, and this effect was not further modified by BAM15 pre-treatment, suggesting that mitochondrial uncoupling does not interfere with the adaptive transcriptional response observed under IC25 treatment conditions. In contrast, regorafenib at the IC50 led to reductions in both c-MYC and c-KIT expression; however, a statistically significant decrease compared with control was observed only for c-MYC. In turn, BAM15 pre-treatment did not alter c-MYC or c-KIT expression at IC50, which is consistent with a cytotoxic treatment profile of the drug at high concentration (Figure 7 b,c).
Analysis of VEGFR expression revealed that BAM15 treatment alone did not significantly affect transcript levels compared with control cells. In contrast, regorafenib exposure at IC25 resulted in a significant upregulation of VEGFR. At the same time, BAM15 pre-treatment further enhanced VEGFR expression in cells treated with regorafenib at IC25. At IC50, regorafenib treatment alone did not significantly alter VEGFR expression compared with control cells. In turn, BAM15 pre-treatment resulted in a significant increase in VEGFR transcript levels, which again points to the engagement of compensatory, stress-associated receptor pathways (Figure 7d).
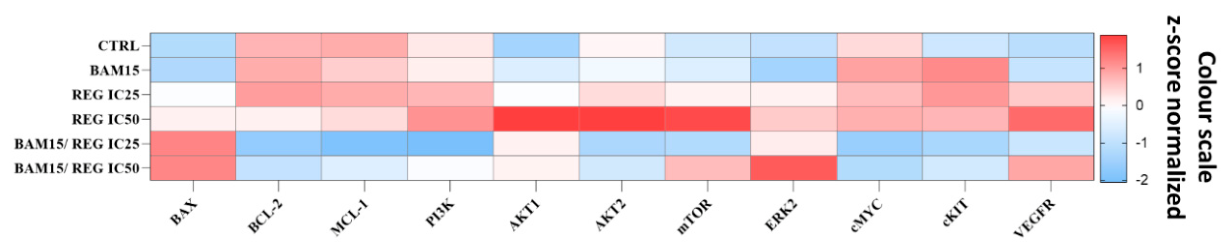
To summarise, the analysis revealed a dose-dependent remodeling of gene expression profiles in D17 cells treated with regorafenib, with BAM15 affecting the expression of selected genes and modulating regorafenib’s effects (Figure 8). IC25 exposure, with or without BAM15 pre-treatment, was associated with coordinated upregulation of adaptive survival- and receptor-related genes, whereas IC50 treatment induced a pro-apoptotic expression pattern marked by c-MYC and c-KIT suppression and increased BAX expression, while BAM15 pre-treatment selectively restored genes associated with adaptation to the stress.
Regorafenib and BAM15 Differentially Alter BAX and BCL-2 Protein Levels in D17 Canine Osteosarcoma Cells
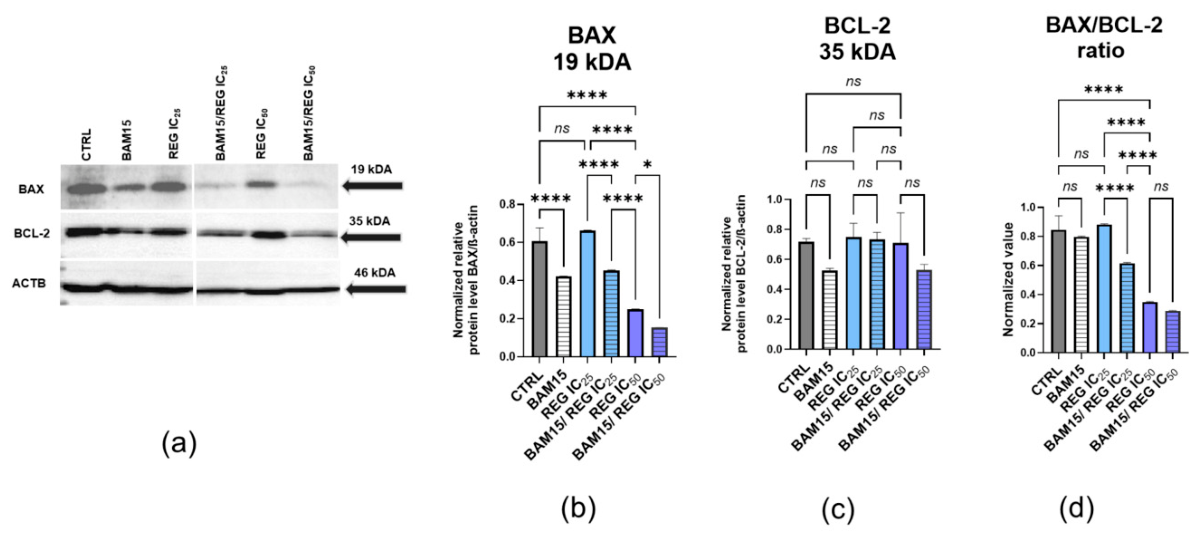
Western blot analysis of apoptosis-related proteins revealed differences in intracellular BAX levels across the experimental groups, whereas BCL-2 levels remained relatively stable, with no significant differences between groups. BAM15 alone significantly reduced BAX levels compared with the control but did not affect BCL-2 levels or the BAX/BCL-2 ratio. Regorafenib at IC25 did not significantly alter BAX or BCL-2 levels relative to the control. However, the combination of BAM15 and regorafenib at IC25 significantly reduced both BAX levels and the BAX/BCL-2 ratio compared with regorafenib at IC25 alone, while BCL-2 levels remained unchanged. Regorafenib at IC50 markedly reduced BAX levels and the BAX/BCL-2 ratio, and the addition of BAM15 did not significantly enhance these effects. The observed changes were only partially consistent with the Annexin V/PI staining results, which indicated increased late apoptosis and necrosis following treatment with REG IC50, particularly in combination with BAM15. However, these effects were not accompanied by an increased BAX/BCL-2 ratio. Moreover, the protein-level changes were not fully consistent with the corresponding transcriptional profiles, suggesting that changes in BAX and BCL-2 transcript abundance were not directly translated into alterations in their protein levels.
Figure 9.
Effect of BAM15, regorafenib, and their combination on BAX and BCL-2 protein levels in D17 osteosarcoma cells. Representative Western blot images of BAX, BCL-2, and β-actin (ACTB) (a), and densitometric quantification of BAX (b), BCL-2 (c), and the BAX/BCL-2 ratio (d) in D17 cells under control conditions (CTRL), BAM15 alone (20 µM), regorafenib alone (REG; IC25 or IC50), or combined BAM15 and regorafenib treatment (BAM15/REG IC25 and BAM15/REG IC50). In the combination groups, cells were pretreated with BAM15 for 16 h, followed by regorafenib exposure for 48 h. BAX and BCL-2 protein levels were normalised to ACTB, and the BAX/BCL-2 ratio was calculated from the normalised values. Data are presented as mean ± SEM. Statistical significance is indicated as p < 0.05 (), p < 0.01 (), p < 0.001 (), and p < 0.0001 (****); ns, not significant.
Figure 9.
Effect of BAM15, regorafenib, and their combination on BAX and BCL-2 protein levels in D17 osteosarcoma cells. Representative Western blot images of BAX, BCL-2, and β-actin (ACTB) (a), and densitometric quantification of BAX (b), BCL-2 (c), and the BAX/BCL-2 ratio (d) in D17 cells under control conditions (CTRL), BAM15 alone (20 µM), regorafenib alone (REG; IC25 or IC50), or combined BAM15 and regorafenib treatment (BAM15/REG IC25 and BAM15/REG IC50). In the combination groups, cells were pretreated with BAM15 for 16 h, followed by regorafenib exposure for 48 h. BAX and BCL-2 protein levels were normalised to ACTB, and the BAX/BCL-2 ratio was calculated from the normalised values. Data are presented as mean ± SEM. Statistical significance is indicated as p < 0.05 (), p < 0.01 (), p < 0.001 (), and p < 0.0001 (****); ns, not significant.
4. Discussion
Canine osteosarcoma represents a valuable comparative model for investigating therapeutic strategies relevant to both veterinary and human oncology. Given the biological similarities between canine and human osteosarcoma, studies using canine tumour models can provide insight into mechanisms of treatment response and resistance while also identifying strategies with potential cross-species translational relevance. Among these approaches, targeting altered mitochondrial function and metabolic plasticity may complement signalling-based therapies and enhance their antitumour activity [1].
Repurposing agents used in human oncology has become an attractive strategy in veterinary oncology, especially when paired with rational combinations that exploit fundamental tumor vulnerabilities, such as altered mitochondrial function and metabolic plasticity [16]. Such mechanism-guided combinations may enhance effectiveness through synergistic mechanisms without increasing the drug dosage, offering a potential pathway to improve treatment outcomes while maintaining tolerability in canine patients [16,17,18].
In light of these considerations, we evaluated the anti-tumor activity of regorafenib, a multi-kinase inhibitor approved for human oncology, in the D17 canine osteosarcoma cell model. We investigated whether the mitochondrial uncoupler BAM15 could act as a metabolic sensitizer, thereby enhancing D17 cellular responsiveness to regorafenib under in vitro conditions. The key finding of the present study was that BAM15 pretreatment enhanced the cytotoxic response of D17 cells to regorafenib at the IC50 concentration. This effect was reflected by a greater reduction in cell viability and an increased proportion of late apoptotic and necrotic cells, indicating that mitochondrial uncoupling can modify the cellular response to regorafenib under cytotoxic treatment conditions. Importantly, this sensitising effect was not observed at IC25, suggesting that the interaction between mitochondrial uncoupling and regorafenib depends on the intensity of treatment-induced stress.
Regorafenib, a multi-kinase inhibitor widely used in human oncology for the treatment of metastatic colorectal cancer [19], gastrointestinal stromal tumors [20], and hepatocellular carcinoma [21], has demonstrated the ability to inhibit angiogenesis, tumor proliferation, and survival signaling across multiple tumor types. Its broad mechanism of action includes the simultaneous inhibition of angiogenic (VEGFR1–3, TIE2), stromal (PDGFR, FGFR), and oncogenic kinases (BRAF, KIT), enabling multi-level interference with tumor growth and vascular support, as supported by both preclinical and clinical studies [22].
In veterinary medicine, regorafenib was used as eye drops to reduce intraocular pressure and improve postoperative bleb formation after glaucoma filtration surgery in dogs [8]. It also limited postoperative scarring and vascularisation, as evidenced by lower subconjunctival collagen and vessel densities and fewer vimentin-, TGF-β-, PCNA-, and α-SMA-positive cells compared with the vehicle-treated control [6]. However, the anti-tumor activity of regorafenib has not been formally assessed in canine cancers, including osteosarcoma, where novel targeted strategies remain urgently needed.
In the present study, we demonstrate that regorafenib exerts a clear concentration-dependent reduction in the metabolic potential of D17 canine osteosarcoma cells, consistent with its reported multikinase inhibition of tumor-supporting pathways. For example, regorafenib demonstrated strong, dose-dependent antitumor activity in eight gastric cancer PDX models, significantly inhibiting tumor growth in all models and consistently reducing angiogenesis, while also lowering proliferation and promoting apoptosis [23]. These preclinical findings reported by Huynh et al. support the concept that regorafenib, through its broad multikinase inhibitory activity, disrupts tumor-supporting signaling pathways, consistent with the concentration-dependent reduction in metabolic activity observed in our study in canine D17 osteosarcoma cells.
In our study, regorafenib exhibited an IC50 of 15.7 ± 0.25 µM in D17 cells, a value that should be interpreted in the context of the considerable variability in drug sensitivity reported across human osteosarcoma models. Pan et al. reported IC50 values in the 5–10 µM range for U-2 OS and MG-63 cells after 48 h of treatment, suggesting relatively high responsiveness in these models [24]. However, other studies have described markedly higher inhibitory concentrations. For example, Bai et al. reported an IC50 of 25 µM in HOS-MNNG and MG-63 cells after 48 h of exposure [25], while Ji et al. observed IC50 values above 5 µM for MG63 cells, further underscoring inter-study variability [26]. Similarly, Sun et al. demonstrated a dose-dependent reduction in cell viability across six human cancer cell lines representing breast, colorectal, cervical, lung, and tongue cancers, as well as glioma, with 24-h IC50 values ranging from 25.37 to 36.76 µM [27]. Moreover, in our previous study, we investigated regorafenib in the human osteosarcoma cell line MG63 and the patient-derived primary cell line APR1. Regorafenib produced concentration-dependent growth inhibition in both models, with respective IC50 values of 26 µM and 42 µM, indicating greater sensitivity of MG63 cells [14].
These findings indicate that the antitumor response to regorafenib differs substantially across osteosarcoma models, likely reflecting both biological heterogeneity and model-specific features. Viewed from a broader perspective, these findings reinforce the value of comparative oncology, as integrating evidence across species can provide a more comprehensive understanding of the biological diversity underlying therapeutic responses and enhance the translational relevance of preclinical research. Such an approach is increasingly recognized as essential for improving the predictive value of preclinical models and accelerating the development of effective therapies [1,28].
Importantly, the D17 cell line used in the present study was derived from a pulmonary osteosarcoma metastasis. This origin increases its relevance for investigating responses to systemic anticancer therapies in the metastatic setting, which remains a major therapeutic challenge in osteosarcoma [15].
The dose-dependent cytotoxicity of regorafenib in D17 cells was also evident in the apoptosis analysis. At the sublethal IC25 concentration, regorafenib largely preserved overall cell viability and did not markedly alter the proportions of apoptotic or necrotic cells. In contrast, treatment at the IC50 concentration significantly reduced viability and shifted the cell population towards late apoptosis and necrosis. These findings are consistent with the previously reported pro-apoptotic effects of regorafenib in human osteosarcoma models. However, whereas human osteosarcoma cells exhibited both early and late apoptotic responses [14,24,26], D17 cells accumulated predominantly in the late apoptotic and necrotic fractions. This suggests that, although regorafenib activates broadly similar cell death pathways, the kinetics and relative contribution of individual stages of cell death may differ between cellular models.
Importantly, although BAM15 pretreatment alone did not induce cytotoxicity, it altered cell-cycle distribution by decreasing the proportion of cells in the S phase and increasing their accumulation in G0/G1, suggesting a slowing of cell-cycle progression rather than cell death. When combined with regorafenib, however, BAM15 enhanced the cytotoxic response, particularly at the IC50 concentration. This was accompanied by a marked depletion of cells from all major cell-cycle phases, including G0/G1, S, and G2/M, indicating a broad loss of the cycling cell population rather than arrest at a specific checkpoint. Interestingly, the reduced S-phase fraction following BAM15 treatment coincided with decreased BAX protein abundance. Beyond its established pro-apoptotic function, BAX has also been implicated in cell-cycle regulation, with experimental evidence indicating that both BAX and BAK facilitate S-phase entry, whereas their deficiency delays G1/S progression [29,30]. Conversely, under the more cytotoxic IC50 conditions, the reduced BAX level and BAX/BCL-2 ratio did not correspond to the increased Annexin V+/PI+ population. Reduced BAX/BCL-2 ratios have previously been associated with poor chemotherapy response and an unfavourable prognosis, including in patients with acute myeloid leukaemia [31,32], supporting their association with an apoptosis-resistant phenotype. Thus, in the present study, the reduced protein ratio may reflect a concurrent survival-associated or adaptive response within the heterogeneous treated cell population, consistent with the transcriptional profile and the lack of compensatory glycolytic activation.
Moreover, Jiang et al. found that low-dose BAM15 increased mitochondrial respiration and proton leak while reducing ATP production and promoting futile energy expenditure, yet did not independently alter cell-cycle distribution [33].
In line with its established activity as a mitochondrial uncoupler [7], BAM15 reduced OXPHOS-derived ATP production in D17 cells without inducing a compensatory increase in ECAR. Regorafenib similarly suppressed mitochondrial ATP production, whereas BAM15 pretreatment did not further enhance this reduction. Thus, the greater cytotoxicity of the combined treatment cannot be explained by a quantitatively greater decline in OXPHOS-derived ATP at the analyzed time point. Instead, BAM15 may have impaired the metabolic flexibility and adaptive capacity of D17 cells, making them less able to withstand regorafenib-induced stress. This interpretation is consistent with the previously reported chemosensitizing activity of BAM15 in AML cells, in which it enhanced the anticancer effects of cytarabine, possibly through disruption of ROS homeostasis [34].
Moreover, the depletion of the major cell-cycle compartments, together with the increased late apoptotic and necrotic fractions, is consistent with an impaired capacity of D17 cells to maintain proliferation and adapt to regorafenib-induced metabolic stress. This interpretation is supported by previous findings in breast cancer cells, in which BAM15-mediated mitochondrial uncoupling reduced ATP production and glycolytic capacity, suppressed proliferation, and induced apoptosis [35].
The obtained findings suggest that BAM15, acting as a metabolic sensitizer, could represent a promising adjuvant strategy to improve the responsiveness to regorafenib in metabolically adaptable cancer cells. Metabolic sensitization represents a particularly attractive strategy in oncology, since rather than increasing drug dosage, modulation of tumor bioenergetics may lower the threshold at which anticancer agents become effective [7,34,35].
Indeed, BAM15 and regorafenib used as individual treatments significantly impaired mitochondrial oxidative phosphorylation in D17 cells, while ATP production supported by glycolysis remained unaffected by the conditions. This finding does not reflect a classical metabolic switch toward enhanced glycolysis, but rather preservation of glycolytic flux sufficient to maintain energy homeostasis during partial mitochondrial dysfunction [36]. Such maintenance of ATP production in the setting of reduced oxidative phosphorylation has been described in cancer cells as a manifestation of metabolic plasticity, allowing survival under therapeutic or environmental stress [37,38].
Analysis of apoptosis- and survival-related transcripts revealed a complex, concentration-dependent response that did not uniformly parallel the observed phenotypic effects. Regorafenib at IC50 induced the most pronounced increase in the BAX/BCL-2 ratio, whereas BAM15 pretreatment partially attenuated this transcriptional shift despite enhancing the accumulation of late apoptotic and necrotic cells. Similarly, changes in genes associated with PI3K/AKT/mTOR and MAPK signaling did not indicate consistent suppression of a single survival pathway but rather suggested the engagement of heterogeneous, treatment-dependent adaptive responses, which we also identified previously using a model of human osteosarcoma cells [14].
Among the analyzed transcripts, MCL-1, ERK2, mTOR and VEGFR showed the most notable treatment-associated changes. BAM15 pretreatment increased mTOR, ERK2, and VEGFR transcript levels relative to regorafenib alone at both concentrations, indicating a reproducible transcriptional response to combined metabolic and pharmacological stress. Given the involvement of mTOR-, ERK-, and VEGFR-related signaling in cellular survival, growth, and stress adaptation, this pattern may reflect an attempted compensatory response in the surviving cell population [39,40,41]. Our previous studies in osteosarcoma models demonstrated that regorafenib suppresses ERK- and AKT/mTOR-related signalling predominantly by reducing protein abundance or phosphorylation rather than by uniformly downregulating the corresponding transcripts [14]. Compensatory transcriptional upregulation of mTOR, ERK2, and VEGFR in BAM15-pretreated cells could therefore represent a feedback response aimed at restoring survival signaling suppressed by regorafenib. This interpretation is consistent with the bypass activation of pro-survival pathways previously implicated in regorafenib resistance, including reactivation of RAS/RAF/ERK signaling [42]. More broadly, cancer cells can compensate for pharmacological inhibition of one signaling pathway by activating alternative survival mechanisms, including reciprocal crosstalk between the MAPK and PI3K/AKT/mTOR pathways, thereby limiting the effectiveness of targeted therapies [43].
In turn, MCL-1 displayed a concentration-dependent pattern: BAM15 pretreatment reduced its expression relative to regorafenib alone at IC25 but increased it at IC50. As an anti-apoptotic member of the BCL-2 family, MCL-1 preserves mitochondrial integrity by restraining pro-apoptotic effectors, including BAX and BAK, and may consequently enable cancer cells to withstand therapeutic stress [44]. Its increased expression under BAM15/IC50 treatment conditions may also indicate an adaptive response of the surviving cell population. However, the biological and clinical significance of MCL-1 appears to be highly context-dependent. Mittal et al. reported that, despite its established anti-apoptotic function and association with chemoresistance, high MCL-1 expression in colorectal tumors was associated with more favorable clinical outcomes, including a longer time on regorafenib treatment [45].
Nevertheless, based on the observed expression signature, we identify MCL-1, mTOR, ERK2, and VEGFR as candidate components of a compensatory survival and stress-adaptation program induced by combined BAM15 and regorafenib treatment at IC50. Their functional involvement requires further validation at the protein level, including assessment of pathway activation through phosphorylation analyses.
In conclusion, this study provides preliminary evidence that mitochondrial uncoupling may modulate the response of canine osteosarcoma cells to regorafenib and enhance its cytotoxic activity. Although this effect was observed in a single canine osteosarcoma cell line and reached significance only at the IC50 concentration, the findings establish a rationale for further investigation of mitochondrial uncoupling as a metabolic strategy for modifying sensitivity to targeted therapy.
Future studies across genetically diverse canine and human osteosarcoma models should determine the reproducibility, selectivity, and molecular basis of this interaction, with particular attention to metabolic adaptation and the potential compensatory roles of MCL-1-, ERK-, and VEGFR-related signaling.
Supplementary Materials
The following supporting information can be downloaded at Preprints.org, Table S1: The list of the primers used for RT-qPCR; Table S2: List of antibodies used for Western blot analysis, including the applied working dilutions.
Author Contributions
Conceptualization, A.D. and A.Ś; methodology, K.M.; software, A.D. and A.Ś; validation, A.Ś., and V.F.; formal analysis, A.D. and A.Ś; investigation, A.D. and K.M.; data curation, A.Ś and K.M.; writing—original draft preparation, A.D., K.M and A.Ś; writing—review and editing, A.Ś, B.O.M and A.R.; visualization, A.D and A.Ś..; supervision, A.Ś and V.F.; project administration, A.Ś and A.R..; funding acquisition, A.R and A.Ś. All authors have read and agreed to the published version of the manuscript.
Funding
The project realization and was supported by the Medical Research Agency (ABM) under the project REGBONE (2021/ABM/01/00019). The APC is co-financed by Wrocław University of Environmental and Life Sciences.
Data Availability Statement
The raw data supporting the conclusions of this article will be made available by the authors on request.
Acknowledgments
The Graphical abstract was prepared with BioRender 2026—agreement number: IP2A2R92GH. The subscription ID for GraphPad Prism is 3850008.
Conflicts of Interest
The authors declare no conflicts of interest.
References
- Dolnicka, A.; Fosse, V.; Raciborska, A.; Śmieszek, A. Building a Therapeutic Bridge Between Dogs and Humans: A Review of Potential Cross-Species Osteosarcoma Biomarkers. Int. J. Mol. Sci. 2025, 26, 5152. [Google Scholar] [CrossRef] [PubMed]
- Rodriguez, C.O. Using Canine Osteosarcoma as a Model to Assess Efficacy of Novel Therapies: Can Old Dogs Teach Us New Tricks? Adv. Exp. Med. Biol. 2014, 804, 237–256. [Google Scholar] [CrossRef] [PubMed]
- Wilhelm, S.M.; Dumas, J.; Adnane, L.; Lynch, M.; Carter, C.A.; Schütz, G.; Thierauch, K.-H.; Zopf, D. Regorafenib (BAY 73-4506): A New Oral Multikinase Inhibitor of Angiogenic, Stromal and Oncogenic Receptor Tyrosine Kinases with Potent Preclinical Antitumor Activity. Int. J. Cancer 2011, 129, 245–255. [Google Scholar] [CrossRef] [PubMed]
- Duffaud, F.; Mir, O.; Boudou-Rouquette, P.; Piperno-Neumann, S.; Penel, N.; Bompas, E.; Delcambre, C.; Kalbacher, E.; Italiano, A.; Collard, O.; et al. Efficacy and Safety of Regorafenib in Adult Patients with Metastatic Osteosarcoma: A Non-Comparative, Randomised, Double-Blind, Placebo-Controlled, Phase 2 Study. Lancet Oncol. 2019, 20, 120–133. [Google Scholar] [CrossRef] [PubMed]
- Ettrich, T.J.; Seufferlein, T. Regorafenib. Recent Results Cancer Res. Fortschritte Krebsforsch. Prog. Dan. Rech. Sur Cancer 2018, 211, 45–56. [Google Scholar] [CrossRef] [PubMed]
- Nemoto, E.; Kojima, S.; Sugiyama, T.; Jin, D.; Takai, S.; Maeda, M.; Kohmoto, R.; Ueki, M.; Oku, H.; Ikeda, T. Effects of Regorafenib, a Multi-Kinase Inhibitor, on Conjunctival Scarring in a Canine Filtration Surgery Model in Comparison with Mitomycin-C. Int. J. Mol. Sci. 2020, 21, 63. [Google Scholar] [CrossRef] [PubMed]
- Xiong, G.; Zhang, K.; Ma, Y.; Song, Y.; Zhang, W.; Qi, T.; Qiu, H.; Shi, J.; Kan, C.; Zhang, J.; et al. BAM15 as a Mitochondrial Uncoupler: A Promising Therapeutic Agent for Diverse Diseases. Front. Endocrinol. 2023, 14, 1252141. [Google Scholar] [CrossRef] [PubMed]
- Kenwood, B.M.; Weaver, J.L.; Bajwa, A.; Poon, I.K.; Byrne, F.L.; Murrow, B.A.; Calderone, J.A.; Huang, L.; Divakaruni, A.S.; Tomsig, J.L.; et al. Identification of a Novel Mitochondrial Uncoupler That Does Not Depolarize the Plasma Membrane. Mol. Metab. 2014, 3, 114–123. [Google Scholar] [CrossRef] [PubMed]
- Alexopoulos, S.J.; Chen, S.-Y.; Brandon, A.E.; Salamoun, J.M.; Byrne, F.L.; Garcia, C.J.; Beretta, M.; Olzomer, E.M.; Shah, D.P.; Philp, A.M.; et al. Mitochondrial Uncoupler BAM15 Reverses Diet-Induced Obesity and Insulin Resistance in Mice. Nat. Commun. 2020, 11, 2397. [Google Scholar] [CrossRef] [PubMed]
- Weinberg, S.E.; Chandel, N.S. Targeting Mitochondria Metabolism for Cancer Therapy. Nat. Chem. Biol. 2015, 11, 9–15. [Google Scholar] [CrossRef] [PubMed]
- Axelrod, C.L.; King, W.T.; Davuluri, G.; Noland, R.C.; Hall, J.; Hull, M.; Dantas, W.S.; Zunica, E.R.; Alexopoulos, S.J.; Hoehn, K.L.; et al. BAM15-Mediated Mitochondrial Uncoupling Protects against Obesity and Improves Glycemic Control. EMBO Mol. Med. 2020, 12, e12088. [Google Scholar] [CrossRef] [PubMed]
- Tsuji, N.; Tsuji, T.; Yamashita, T.; Hayase, N.; Hu, X.; Yuen, P.S.T.; Star, R.A. BAM15 Treats Mouse Sepsis and Kidney Injury, Linking Mortality, Mitochondrial DNA, Tubule Damage, and Neutrophils. J. Clin. Invest. 2023, 133. [Google Scholar] [CrossRef] [PubMed]
- Zhao, Y.; Butler, E.B.; Tan, M. Targeting Cellular Metabolism to Improve Cancer Therapeutics. Cell Death Dis. 2013, 4, e532–e532. [Google Scholar] [CrossRef] [PubMed]
- Marcinkowska, K.; Raciborska, A.; Obmińska-Mrukowicz, B.; Śmieszek, A. Regorafenib-Induced Stress Response Alters the Bioenergetic Profile of Osteosarcoma Cells and Modulates Gene Expression Associated with Metabolic Regulation-a Potential Mechanism of Osteosarcoma Treatment-Related Adaptation. Cancer Manag. Res. 2026, 18, 562346. [Google Scholar] [CrossRef] [PubMed]
- Łukasik, E.M.; Marcinkowska, K.A.; Śmieszek, A. Functional Heterogeneity of Canine Osteosarcoma Cell Lines and Differential Expression of miR-27b-3p and IGF2BP3. Cells 2026, 15, 878. [Google Scholar] [CrossRef] [PubMed]
- Ciccarelli, S.; Perrone, C.; Cavalera, M.A.; Giuliano, A. Drug Repurposing in Veterinary Oncology: Myth or Reality? Vet. Sci. 2025, 12. [Google Scholar] [CrossRef] [PubMed]
- He, S.; Wu, S.; Chen, L.; Li, Y.; Wang, B. Metabolomic Profiling and Anti-Tumor Function of Canine NK Cells in Tumor Interaction. BMC Vet. Res. 2026, 22, 202. [Google Scholar] [CrossRef] [PubMed]
- Bitencourt, R.C.; Cruvinel, G.G.; Terrabuio, V.M.T. de C.; Linhares, L.C.M.; Bispo, G.A.; Anai, L.A.; Sobreira, M.F. da R.; Camplesi, A.C.; De Nardi, A.B.; Santana, A.E. Metronomic Chemotherapy in Dogs and Cats: Mechanisms, Indications, and Clinical Perspectives. Cancers 2025, 17, 3318. [Google Scholar] [CrossRef] [PubMed]
- Matsumoto, T.; Ikoma, T.; Yamamura, S.; Miura, K.; Tsuduki, T.; Watanabe, T.; Nagai, H.; Takatani, M.; Yasui, H. Regorafenib Is Suitable for Advanced Colorectal Cancer Patients Who Have Previously Received Trifluridine/Tipiracil plus Bevacizumab. Sci. Rep. 2023, 13, 2433. [Google Scholar] [CrossRef] [PubMed]
- Ferraro, D.; Zalcberg, J. Regorafenib in Gastrointestinal Stromal Tumors: Clinical Evidence and Place in Therapy. Ther. Adv. Med. Oncol. 2014, 6, 222–228. [Google Scholar] [CrossRef] [PubMed]
- Kim, Y.J.; Merle, P.; Finn, R.S.; Kudo, M.; Klümpen, H.-J.; Lim, H.Y.; Ikeda, M.; Granito, A.; Masi, G.; Gerolami, R.; et al. Regorafenib for Hepatocellular Carcinoma in Real-World Practice (REFINE): A Prospective, Observational Study. Liver Cancer 2025, 14, 391–407. [Google Scholar] [CrossRef] [PubMed]
- Grothey, A.; Blay, J.-Y.; Pavlakis, N.; Yoshino, T.; Bruix, J. Evolving Role of Regorafenib for the Treatment of Advanced Cancers. Cancer Treat. Rev. 2020, 86, 101993. [Google Scholar] [CrossRef] [PubMed]
- Huynh, H.; Ong, R.; Zopf, D. Antitumor Activity of the Multikinase Inhibitor Regorafenib in Patient-Derived Xenograft Models of Gastric Cancer. J. Exp. Clin. Cancer Res. CR 2015, 34, 132. [Google Scholar] [CrossRef] [PubMed]
- Pan, P.-J.; Liu, Y.-C.; Hsu, F.-T. Protein Kinase B and Extracellular Signal-Regulated Kinase Inactivation Is Associated with Regorafenib-Induced Inhibition of Osteosarcoma Progression In Vitro and In Vivo. J. Clin. Med. 2019, 8, 900. [Google Scholar] [CrossRef] [PubMed]
- Bai, G.; Zhao, S.; Zhao, M.; Chen, L.; Chen, W. The Phosphatase CTDSPL2 Promotes Proliferation, Invasion, Metastasis and Regorafenib Resistance in Osteosarcoma. J. Bone Oncol. 2025, 52, 100684. [Google Scholar] [CrossRef] [PubMed]
- Ji, Y.; Harris, M.A.; Newton, L.M.; Harris, T.J.; Fairlie, W.D.; Lee, E.F.; Hawkins, C.J. Osteosarcoma Cells Depend on MCL-1 for Survival, and Osteosarcoma Metastases Respond to MCL-1 Antagonism plus Regorafenib in Vivo. BMC Cancer 2024, 24, 1350. [Google Scholar] [CrossRef] [PubMed]
- Sun, B.; Chen, H.; Wang, X.; Chen, T. Regorafenib Induces Bim-Mediated Intrinsic Apoptosis by Blocking AKT-Mediated FOXO3a Nuclear Export. Cell Death Discov. 2023, 9, 37. [Google Scholar] [CrossRef] [PubMed]
- Vincze, O.; Spada, B.; Bilder, D.; Cagan, A.; DeGregori, J.; Gorbunova, V.; Maley, C.C.; Schiffman, J.D.; Seluanov, A.; Giraudeau, M.; et al. Advancing Cancer Research via Comparative Oncology. Nat. Rev. Cancer 2025, 25, 740–748. [Google Scholar] [CrossRef] [PubMed]
- Halikar, A.M.; Chandrasekharan, A.; Lekshmi, A.; Sivasailam, A.; Tiffee P J, J.; Tiwari, S.K.; Rather, A.A.; Santhoshkumar, T.R. Bax- Bcl-xL Interaction Dynamics during the Progression of Cell Cycle and Cell Death Using FLIM-FRET. Cell Stress 2025, 9, 143–157. [Google Scholar] [CrossRef] [PubMed]
- Takeuchi, O.; Fisher, J.; Suh, H.; Harada, H.; Malynn, B.A.; Korsmeyer, S.J. Essential Role of BAX, BAK in B Cell Homeostasis and Prevention of Autoimmune Disease. Proc. Natl. Acad. Sci. U. S. A. 2005, 102, 11272–11277. [Google Scholar] [CrossRef] [PubMed]
- Kuwana, T.; King, L.E.; Cosentino, K.; Suess, J.; Garcia-Saez, A.J.; Gilmore, A.P.; Newmeyer, D.D. Mitochondrial Residence of the Apoptosis Inducer BAX Is More Important than BAX Oligomerization in Promoting Membrane Permeabilization. J. Biol. Chem. 2020, 295, 1623–1636. [Google Scholar] [CrossRef] [PubMed]
- Kunac, N.; Filipović, N.; Kostić, S.; Vukojević, K. The Expression Pattern of Bcl-2 and Bax in the Tumor and Stromal Cells in Colorectal Carcinoma. Medicina (Mex.) 2022, 58, 1135. [Google Scholar] [CrossRef] [PubMed]
- Jiang, X.; Fan, Z.; Zhang, Z.; Zeng, F.; Sun, T.; Li, Y.; Huang, G.; Nie, L. Tumor Metabolome Remolded by Low Dose Mitochondrial Uncoupler Elicites Robust CD8+ T Cell Response. Cell Death Discov. 2025, 11, 291. [Google Scholar] [CrossRef] [PubMed]
- Gao, Z.X.; Cui, Z.L.; Zhou, M.R.; Fu, Y.; Liu, F.; Zhang, L.; Ma, S.; Chen, C.Y. The New Mitochondrial Uncoupler BAM15 Induces ROS Production for Treatment of Acute Myeloid Leukemia. Biochem. Pharmacol. 2022, 198, 114948. [Google Scholar] [CrossRef] [PubMed]
- Zunica, E.R.M.; Axelrod, C.L.; Cho, E.; Spielmann, G.; Davuluri, G.; Alexopoulos, S.J.; Beretta, M.; Hoehn, K.L.; Dantas, W.S.; Stadler, K.; et al. Breast Cancer Growth and Proliferation Is Suppressed by the Mitochondrial Targeted Furazano [3,4-b]Pyrazine BAM15. Cancer Metab. 2021, 9, 36. [Google Scholar] [CrossRef] [PubMed]
- Li, S.; Gong, J.; Kang, B.; Wang, Z.; Ma, Y.; Xia, X.; Yan, H. Targeting Glycolytic Metabolism in Cancer Therapy: Current Approaches and Future Perspectives. Cells 2026, 15, 362. [Google Scholar] [CrossRef] [PubMed]
- Awad, A.M.A.M.; Abdul Karim, N. Dysregulation of Mitochondrial Function in Cancer Cells. Int. J. Mol. Sci. 2025, 26, 6750. [Google Scholar] [CrossRef] [PubMed]
- Keoh, L.Q.; Chiu, C.-F.; Ramasamy, T.S. Metabolic Plasticity and Cancer Stem Cell Metabolism: Exploring the Glycolysis-OXPHOS Switch as a Mechanism for Resistance and Tumorigenesis. Stem Cell Rev. Rep. 2025, 21, 2446–2468. [Google Scholar] [CrossRef] [PubMed]
- Zhang, H.; Xiao, X.; Pan, Z.; Dokudovskaya, S. mTOR Signaling Networks: Mechanistic Insights and Translational Frontiers in Disease Therapeutics. Signal Transduct. Target. Ther. 2025, 10, 428. [Google Scholar] [CrossRef] [PubMed]
- Chandhanayingyong, C.; Kim, Y.; Staples, J.R.; Hahn, C.; Lee, F.Y. MAPK/ERK Signaling in Osteosarcomas, Ewing Sarcomas and Chondrosarcomas: Therapeutic Implications and Future Directions. Sarcoma 2012, 2012, 404810. [Google Scholar] [CrossRef] [PubMed]
- Lee, C.; Kim, M.-J.; Kumar, A.; Lee, H.-W.; Yang, Y.; Kim, Y. Vascular Endothelial Growth Factor Signaling in Health and Disease: From Molecular Mechanisms to Therapeutic Perspectives. Signal Transduct. Target. Ther. 2025, 10, 170. [Google Scholar] [CrossRef] [PubMed]
- Hu, L.; Shi, W.; Liu, K.; Ma, D.; Xin, Q.; Wang, Z.; Cao, Y.; Zhang, G. EGFR Bypass Activation Mediates Acquired Resistance to Regorafenib in Hepatocellular Carcinoma. Front. Med. 2024, 11, 1464610. [Google Scholar] [CrossRef] [PubMed]
- Brown, W.S.; McDonald, P.C.; Nemirovsky, O.; Awrey, S.; Chafe, S.C.; Schaeffer, D.F.; Li, J.; Renouf, D.J.; Stanger, B.Z.; Dedhar, S. Overcoming Adaptive Resistance to KRAS and MEK Inhibitors by Co-Targeting mTORC1/2 Complexes in Pancreatic Cancer. Cell Rep. Med. 2020, 1, 100131. [Google Scholar] [CrossRef] [PubMed]
- Mohiuddin, M. Targeting MCL-1 to Overcome Therapeutic Resistance and Improve Cancer Mortality. Health Sci. Rep. 2025, 8, e71390. [Google Scholar] [CrossRef] [PubMed]
- Mittal, P.; Battaglin, F.; Baca, Y.; Xiu, J.; Farrell, A.; Soni, S.; Lo, J.H.; Torres-Gonzalez, L.; Algaze, S.; Jayachandran, P.; et al. Comprehensive Characterization of MCL-1 in Patients with Colorectal Cancer: Expression, Molecular Profiles, and Outcomes. Int. J. Cancer 2025, 156, 1583–1593. [Google Scholar] [CrossRef] [PubMed]
Figure 1.
Cytotoxic effects of regorafenib alone and in combination with BAM15 in canine D17 osteosarcoma cells. Dose-response curve of D17 canine osteosarcoma cell viability following 48 h exposure to increasing concentrations of regorafenib (a) and MTS assay results (b) showing the effect of BAM15, regorafenib (REG; IC25 and IC50), and their combination on the metabolism of the cells after 48 h of treatment. Data are presented as mean ± SD. Statistical significance was assessed using ANOVA followed by a post hoc test. *p < 0.05, ***p < 0.001, ****p < 0.0001; ns – not significant.
Figure 1.
Cytotoxic effects of regorafenib alone and in combination with BAM15 in canine D17 osteosarcoma cells. Dose-response curve of D17 canine osteosarcoma cell viability following 48 h exposure to increasing concentrations of regorafenib (a) and MTS assay results (b) showing the effect of BAM15, regorafenib (REG; IC25 and IC50), and their combination on the metabolism of the cells after 48 h of treatment. Data are presented as mean ± SD. Statistical significance was assessed using ANOVA followed by a post hoc test. *p < 0.05, ***p < 0.001, ****p < 0.0001; ns – not significant.
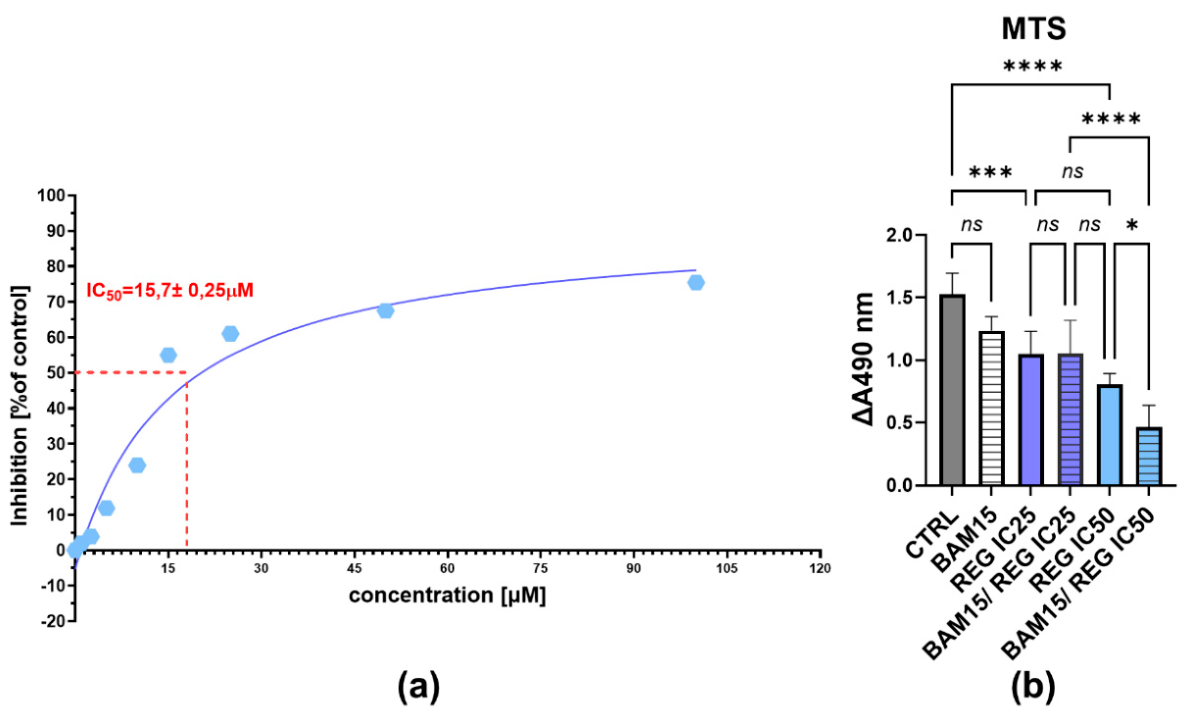
Figure 2.
Annexin V/PI analysis of apoptosis in osteosarcoma canine D17 cells treated with regorafenib and BAM15. Representative dot plots of Annexin V–FITC/propidium iodide (PI) staining in canine osteosarcoma D17 cells following treatment with regorafenib (IC25 and IC50), BAM15 alone, or BAM15 pre-treatment followed by regorafenib (IC25 and IC50. Quadrant analysis distinguishes viable (Annexin V−/PI−), early apoptotic (Annexin V+/PI−), late apoptotic (Annexin V+/PI+), and necrotic (Annexin V−/PI+) cell populations. Quantitative data are presented as mean ± SD from three independent experiments and are shown below the representative plots. Statistical significance was assessed using, ANOVA followed by post hoc test; ****p < 0.0001; ns – not significant.
Figure 2.
Annexin V/PI analysis of apoptosis in osteosarcoma canine D17 cells treated with regorafenib and BAM15. Representative dot plots of Annexin V–FITC/propidium iodide (PI) staining in canine osteosarcoma D17 cells following treatment with regorafenib (IC25 and IC50), BAM15 alone, or BAM15 pre-treatment followed by regorafenib (IC25 and IC50. Quadrant analysis distinguishes viable (Annexin V−/PI−), early apoptotic (Annexin V+/PI−), late apoptotic (Annexin V+/PI+), and necrotic (Annexin V−/PI+) cell populations. Quantitative data are presented as mean ± SD from three independent experiments and are shown below the representative plots. Statistical significance was assessed using, ANOVA followed by post hoc test; ****p < 0.0001; ns – not significant.
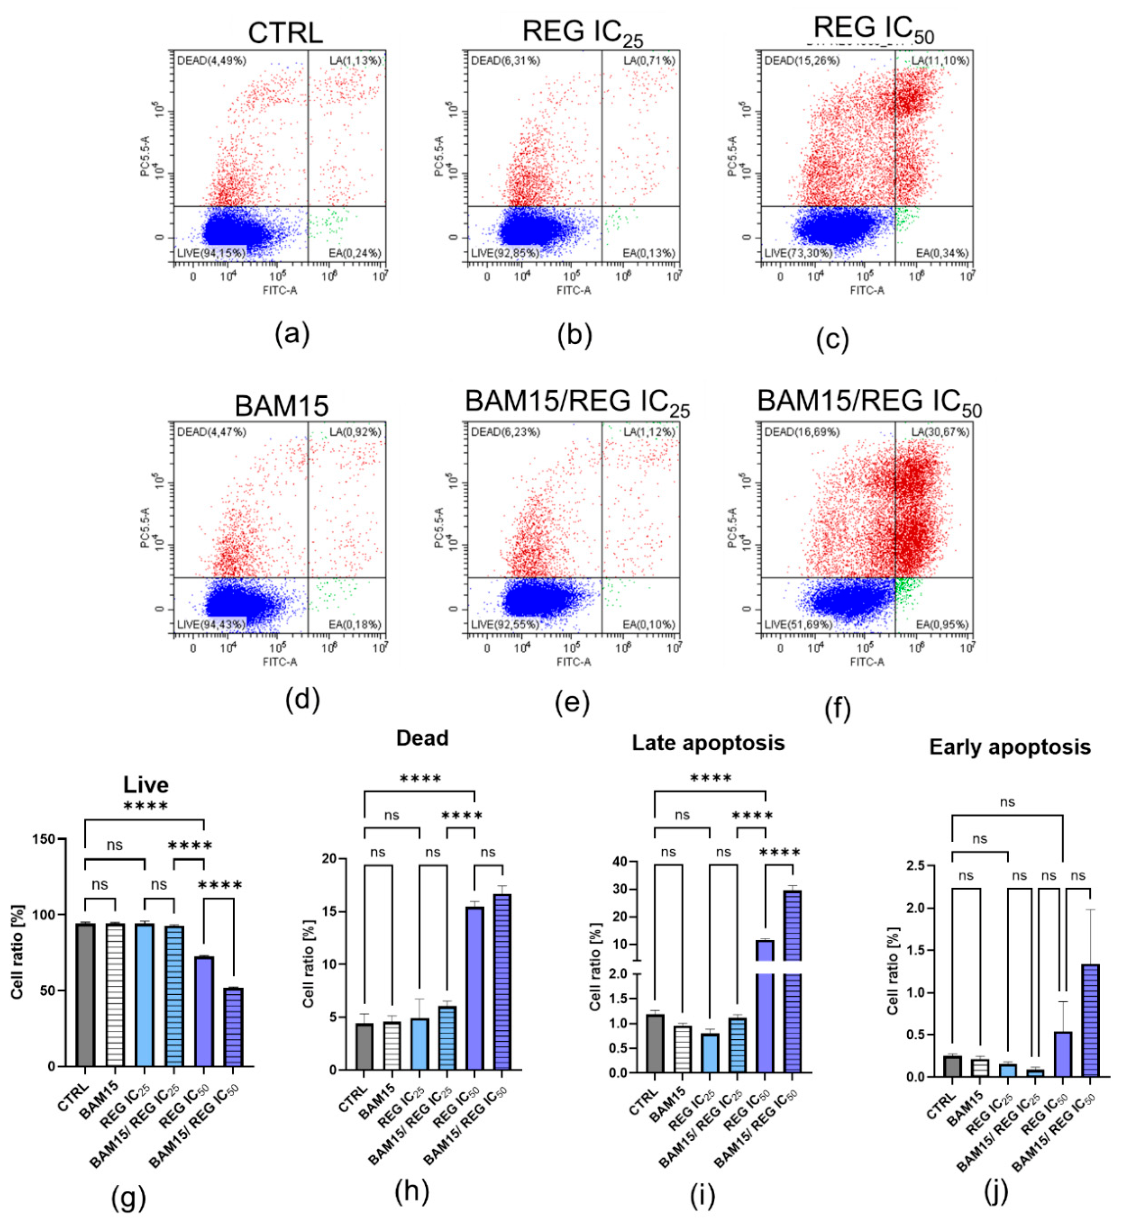
Figure 3.
Effect of BAM15, regorafenib and their combination on cell cycle distribution of canine osteosarcoma D17 cells. Representative flow cytometry histograms showing Propidium Iodide staining of D17 cells treated with vehicle control (CTRL) (a), regorafenib at IC25(b), regorafenib at IC50(c), BAM15 (20 µM) (d), BAM15 combined with regorafenib IC25(e), and BAM15 combined with regorafenib IC50(f). Quantitative analysis of the percentage of cells in the G0/G1 (g), S (h), and G2/M (i) phases of the cell cycle is presented as mean ± SD. Statistical significance was assessed relative to control or between indicated groups (*p < 0.05, **p < 0.01, ***p < 0.001, ****p < 0.0001; ns, not significant).
Figure 3.
Effect of BAM15, regorafenib and their combination on cell cycle distribution of canine osteosarcoma D17 cells. Representative flow cytometry histograms showing Propidium Iodide staining of D17 cells treated with vehicle control (CTRL) (a), regorafenib at IC25(b), regorafenib at IC50(c), BAM15 (20 µM) (d), BAM15 combined with regorafenib IC25(e), and BAM15 combined with regorafenib IC50(f). Quantitative analysis of the percentage of cells in the G0/G1 (g), S (h), and G2/M (i) phases of the cell cycle is presented as mean ± SD. Statistical significance was assessed relative to control or between indicated groups (*p < 0.05, **p < 0.01, ***p < 0.001, ****p < 0.0001; ns, not significant).
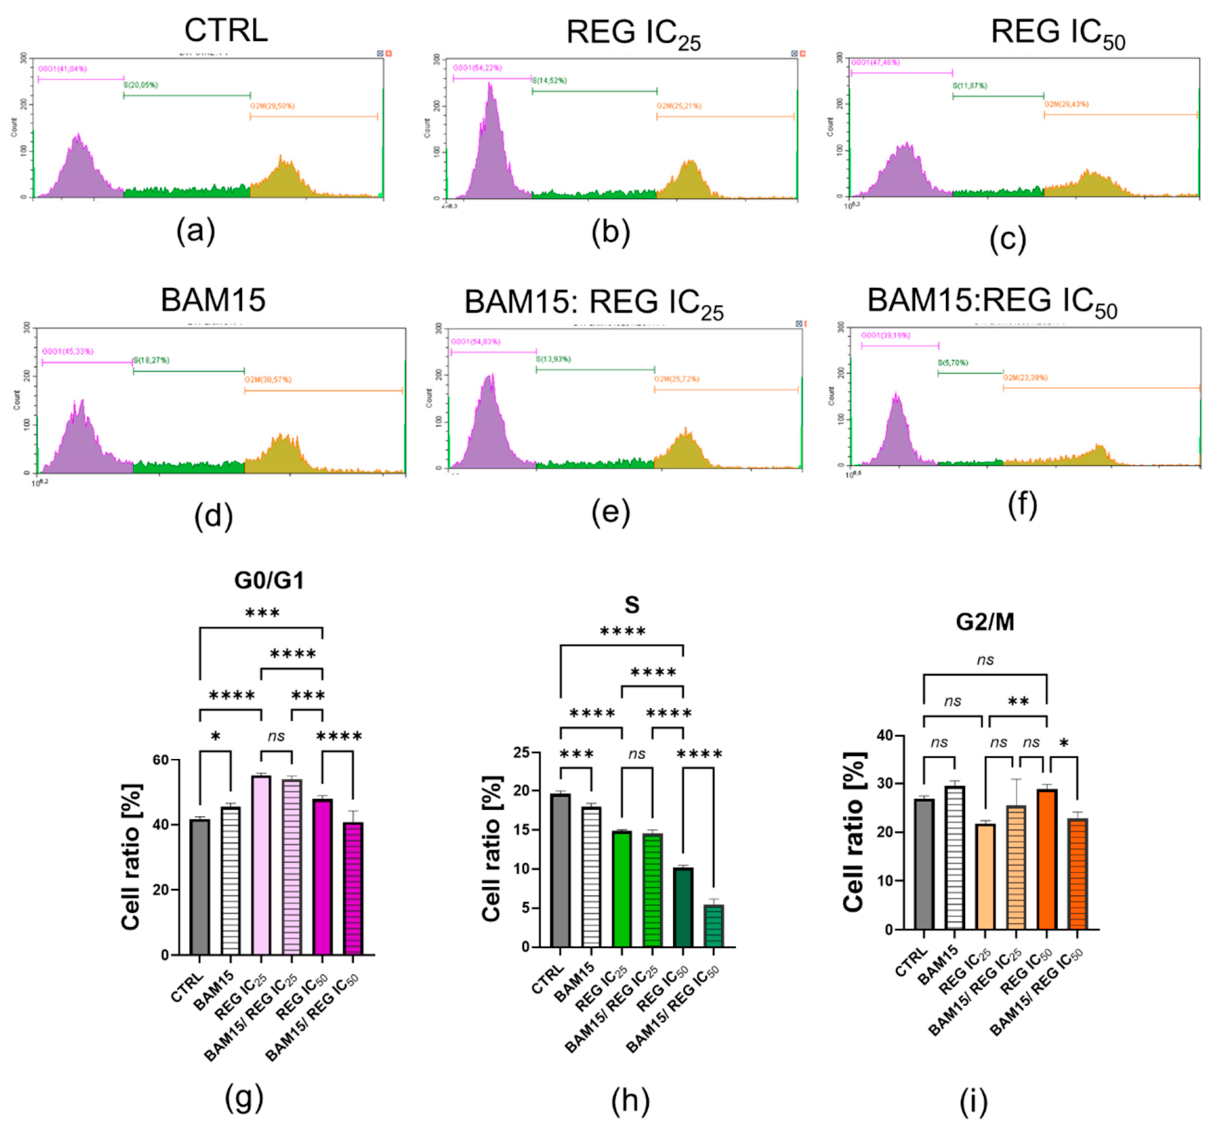
Figure 5.
Effect of BAM15 and regorafenib on the expression of apoptosis-related genes in canine osteosarcoma D17 cells. Relative mRNA expression levels of the pro-apoptotic gene BAX (a), anti-apoptotic genes BCL-2 (b) and MCL-1 (d), and the BAX/BCL-2 ratio (c) were determined following treatment with BAM15 (20 µM), regorafenib at IC25 or IC50, and their combinations. Gene expression was normalized to a reference gene and is presented as relative quantification (RQ) on a logarithmic scale. Data are shown as mean ± SD. Statistical significance between groups is indicated (*p < 0.05, **p < 0.01, ****p < 0.0001; ns, not significant).
Figure 5.
Effect of BAM15 and regorafenib on the expression of apoptosis-related genes in canine osteosarcoma D17 cells. Relative mRNA expression levels of the pro-apoptotic gene BAX (a), anti-apoptotic genes BCL-2 (b) and MCL-1 (d), and the BAX/BCL-2 ratio (c) were determined following treatment with BAM15 (20 µM), regorafenib at IC25 or IC50, and their combinations. Gene expression was normalized to a reference gene and is presented as relative quantification (RQ) on a logarithmic scale. Data are shown as mean ± SD. Statistical significance between groups is indicated (*p < 0.05, **p < 0.01, ****p < 0.0001; ns, not significant).
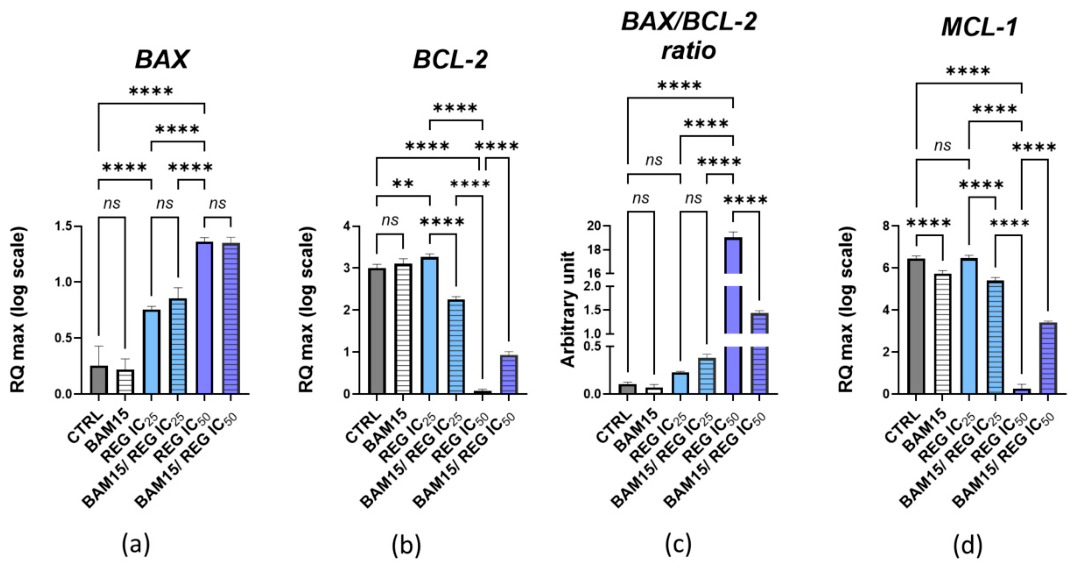
Figure 6.
Effect of BAM15, regorafenib, and their combination on the expression of PI3K/AKT/mTOR pathway genes in D17 osteosarcoma cells. Gene expression levels of PI3K (a), AKT1 (b), AKT2 (c), and mTOR (d) were analyzed by quantitative PCR in D17 cells under control conditions (CTRL), BAM15 alone (20 µM), regorafenib alone (REG; IC25 or IC50), or a combination of BAM15 with regorafenib (BAM15/REG IC25 and BAM15/REG IC50). In the combination groups, cells were pretreated with BAM15 for 16 h, followed by regorafenib exposure for 48 h. Results are presented as relative quantification (RQ max) on a logarithmic scale. Data are shown as mean ± SEM. Statistical significance was determined using appropriate statistical tests and is indicated as p < 0.05 (*), p < 0.01 (**), p < 0.001 (***), p < 0.0001 (****); ns, not significant.
Figure 6.
Effect of BAM15, regorafenib, and their combination on the expression of PI3K/AKT/mTOR pathway genes in D17 osteosarcoma cells. Gene expression levels of PI3K (a), AKT1 (b), AKT2 (c), and mTOR (d) were analyzed by quantitative PCR in D17 cells under control conditions (CTRL), BAM15 alone (20 µM), regorafenib alone (REG; IC25 or IC50), or a combination of BAM15 with regorafenib (BAM15/REG IC25 and BAM15/REG IC50). In the combination groups, cells were pretreated with BAM15 for 16 h, followed by regorafenib exposure for 48 h. Results are presented as relative quantification (RQ max) on a logarithmic scale. Data are shown as mean ± SEM. Statistical significance was determined using appropriate statistical tests and is indicated as p < 0.05 (*), p < 0.01 (**), p < 0.001 (***), p < 0.0001 (****); ns, not significant.
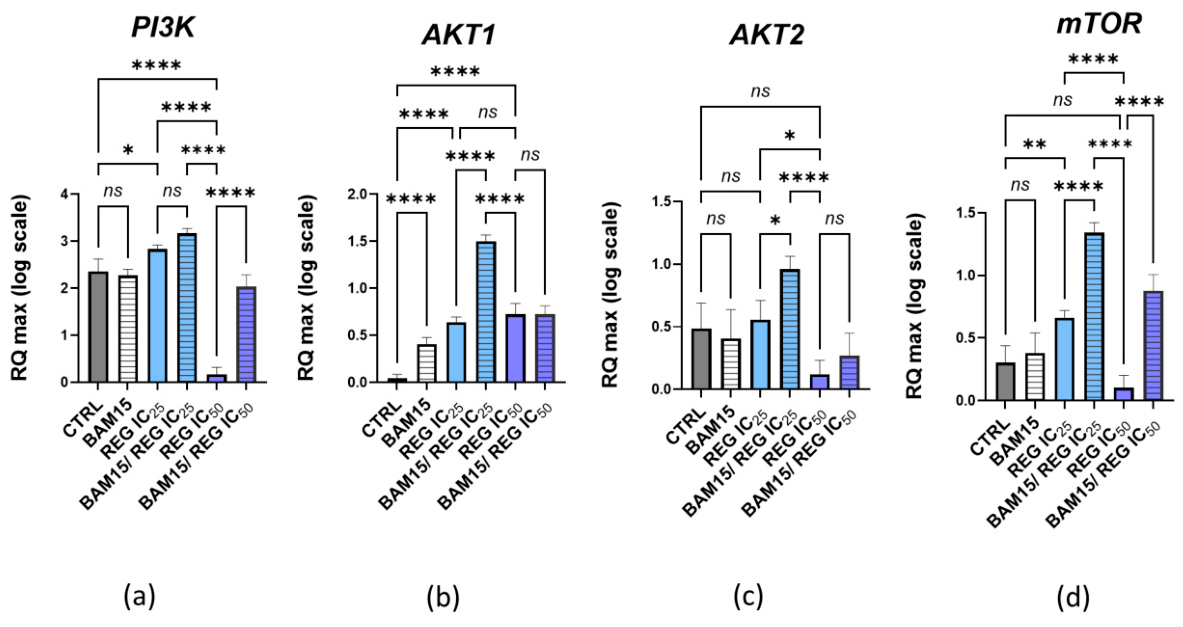
Figure 7.
Effect of BAM15, regorafenib, and their combination on the expression of ERK2, c-MYC, c-KIT, and VEGFR in D17 osteosarcoma cells. Relative mRNA expression levels of ERK2 (a), c-MYC (b), c-KIT (c), and VEGFR (d) were quantified by qPCR in D17 cells under control conditions (CTRL), BAM15 alone (20 µM), regorafenib alone (REG; IC25 or IC50), or combined BAM15 and regorafenib treatment (BAM15/REG IC25 and BAM15/REG IC50). In the combination groups, cells were pretreated with BAM15 for 16 h, followed by regorafenib exposure for 48 h. Expression levels are presented as relative quantification (RQ max) on a logarithmic scale. Data represent mean ± SEM. Statistical significance was assessed using appropriate statistical tests and is indicated as p < 0.05 (*), p < 0.01 (**), p < 0.001 (***), p < 0.0001 (****); ns, not significant.
Figure 7.
Effect of BAM15, regorafenib, and their combination on the expression of ERK2, c-MYC, c-KIT, and VEGFR in D17 osteosarcoma cells. Relative mRNA expression levels of ERK2 (a), c-MYC (b), c-KIT (c), and VEGFR (d) were quantified by qPCR in D17 cells under control conditions (CTRL), BAM15 alone (20 µM), regorafenib alone (REG; IC25 or IC50), or combined BAM15 and regorafenib treatment (BAM15/REG IC25 and BAM15/REG IC50). In the combination groups, cells were pretreated with BAM15 for 16 h, followed by regorafenib exposure for 48 h. Expression levels are presented as relative quantification (RQ max) on a logarithmic scale. Data represent mean ± SEM. Statistical significance was assessed using appropriate statistical tests and is indicated as p < 0.05 (*), p < 0.01 (**), p < 0.001 (***), p < 0.0001 (****); ns, not significant.
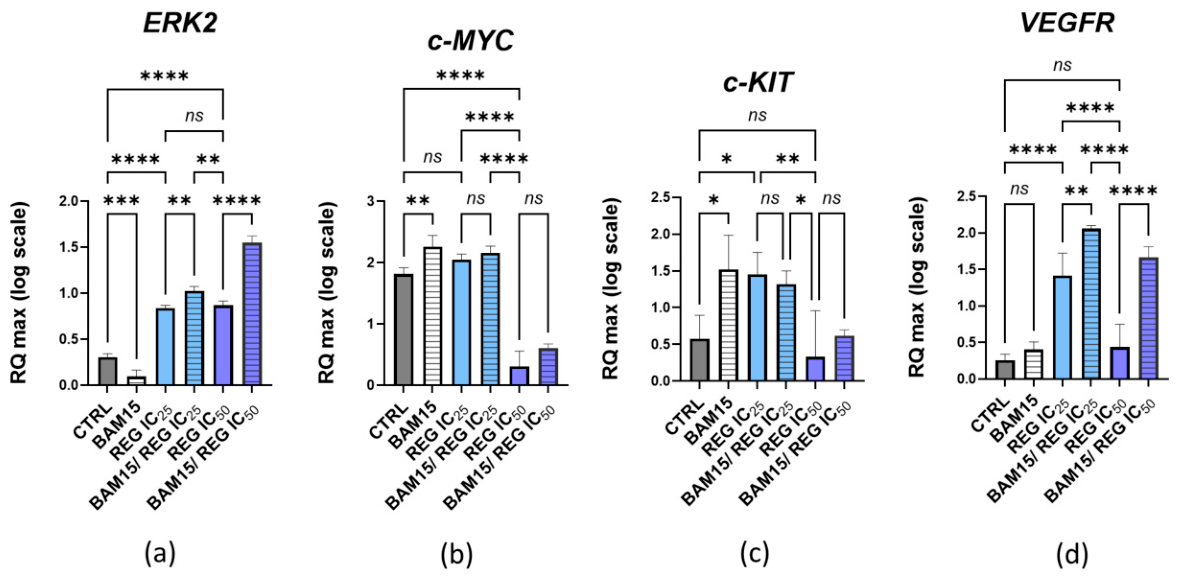
Figure 8.
Heatmap representation of gene expression changes in D17 osteosarcoma cells following treatment with BAM15, regorafenib, and their combination. The heatmap illustrates the relative expression patterns of genes associated with apoptosis (BAX, BCL-2, MCL-1), PI3K/AKT/mTOR and MAPK signaling (PI3K, AKT1, AKT2, mTOR, ERK2), oncogenic regulation (c-MYC), and receptor tyrosine kinase signaling (c-KIT, VEGFR) in D17 cells under control conditions (CTRL), BAM15 alone (20 µM), regorafenib alone (REG IC25 or REG IC50), or combined BAM15 and regorafenib treatment (BAM15/REG IC25 and BAM15/REG IC50). In the combination groups, cells were pretreated with BAM15 for 16 h, followed by regorafenib exposure for 48 h. Gene expression values were normalized and converted to Z-scores for visualization. Red indicates higher relative expression, while blue indicates lower relative expression, as shown by the color scale.
Figure 8.
Heatmap representation of gene expression changes in D17 osteosarcoma cells following treatment with BAM15, regorafenib, and their combination. The heatmap illustrates the relative expression patterns of genes associated with apoptosis (BAX, BCL-2, MCL-1), PI3K/AKT/mTOR and MAPK signaling (PI3K, AKT1, AKT2, mTOR, ERK2), oncogenic regulation (c-MYC), and receptor tyrosine kinase signaling (c-KIT, VEGFR) in D17 cells under control conditions (CTRL), BAM15 alone (20 µM), regorafenib alone (REG IC25 or REG IC50), or combined BAM15 and regorafenib treatment (BAM15/REG IC25 and BAM15/REG IC50). In the combination groups, cells were pretreated with BAM15 for 16 h, followed by regorafenib exposure for 48 h. Gene expression values were normalized and converted to Z-scores for visualization. Red indicates higher relative expression, while blue indicates lower relative expression, as shown by the color scale.
Disclaimer/Publisher’s Note: The statements, opinions and data contained in all publications are solely those of the individual author(s) and contributor(s) and not of MDPI and/or the editor(s). MDPI and/or the editor(s) disclaim responsibility for any injury to people or property resulting from any ideas, methods, instructions or products referred to in the content. |
© 2026 by the authors. Licensee MDPI, Basel, Switzerland. This article is an open access article distributed under the terms and conditions of the Creative Commons Attribution (CC BY) license.
Copyright: This open access article is published under a Creative Commons CC BY 4.0 license, which permit the free download, distribution, and reuse, provided that the author and preprint are cited in any reuse.