

Submitted:
19 August 2026
Posted:
19 August 2026
You are already at the latest version
Abstract
Background/Objectives: Reduced physical activity (PA) and increased sedentary behavior (SB) are associated with adverse outcomes in chronic obstructive pulmonary disease (COPD). However, the factors associated with their long-term change remain unclear. We investigated the baseline factors associated with a longitudinal decline in PA and increase in SB. Methods: Stable outpatients with COPD who participated in both the SPACE (baseline) and E-PAC (follow-up) studies in Japan were analyzed retrospectively. At baseline, 29 clinical variables were assessed, including demographic and anthropometric data, nutritional indices (body mass index [BMI], upper arm circumference), pulmonary function, blood tests, and the lowest percutaneous oxygen saturation (SpO2) during the 6-min walk test (6MWT). PA and SB were measured with a waist-worn triaxial accelerometer and expressed in metabolic equivalents (METs). Annual percentage changes were analyzed using Spearman’s rank correlation and multiple linear regression. Analyses were exploratory, with 95% confidence intervals reported. Results: Thirty-two men (median age 71.0 years; median follow-up 5.0 years) were analyzed. Greater annual declines in PA were associated with a poorer baseline nutritional status (lower body weight, BMI, and upper arm circumference), lower pulmonary function, and a lower lowest SpO2 during the 6MWT (i.e., exercise-induced desaturation). A greater annual increase in SB was associated with a lower lowest SpO2 and a higher baseline hemoglobin concentration. In multivariable models, BMI remained independently associated with the declines in total PA and in the duration at ≥3.0 METs. Conclusions: In this exploratory analysis, nutritional status, pulmonary function, and exercise-induced desaturation were associated with long-term behavioral changes in COPD, with BMI showing the most consistent association with the decline in PA. These hypothesis-generating findings require confirmation in a larger cohort.
Keywords:
chronic obstructive pulmonary disease
; longitudinal studies
; sedentary behavior
; metabolic equivalents
; nutritional status
1. Introduction
Chronic obstructive pulmonary disease (COPD) is characterized by progressive airflow obstruction and is a major cause of morbidity and mortality worldwide [1,2]. In patients with COPD, reduced physical activity (PA) and increased sedentary behavior (SB) are strongly associated with poor outcomes and therefore have attracted increasing attention [3,4,5]. PA refers to any bodily movement produced by skeletal muscles that results in energy expenditure and it is generally evaluated based on the duration of activities performed at moderate to vigorous intensity (≥3 metabolic equivalents [METs]) [6,7]. In contrast, waking behaviors performed in a sitting or reclining posture with an energy expenditure of ≤1.5 METs are classified as SB [7,8].
Although numerous cross-sectional studies have investigated the factors associated with PA and SB, the factors associated with a long-term decline in PA and increase in SB remain unclear. Several longitudinal studies have demonstrated that PA progressively declines over time in patients with COPD [9,10,11], and baseline pulmonary function may influence the rate of this decline.10 Importantly, this decline appears to occur independently of changes in exercise capacity, suggesting that behavioral and environmental factors, rather than physiological exercise capacity alone, play a substantial role [11]. However, these longitudinal studies were limited by relatively short follow-up periods, with a maximum duration of 3 years and mean follow-up periods of only 2.7 and 2.4 years. Furthermore, even large-scale accelerometer studies have generally assessed PA at a single time point. In a recent analysis of 1,551 individuals with COPD in the UK Biobank, the authors identified the inability to capture longitudinal changes in PA as a key limitation requiring further investigation [12]. In addition, many previous studies have relied primarily on the daily step count as the sole measure of PA. Although step count is a simple and intuitive metric, it does not adequately reflect activity intensity or SB. Consequently, evidence regarding long-term changes in SB and their clinical correlates remains particularly limited.
Given the vicious cycle in which reduced PA and increased SB worsen the disease severity, thereby promoting a further decline in PA and an increase in SB, it is clinically important to identify the factors associated with a long-term decline in PA and an increase in SB [13,14]. However, longitudinal studies examining the factors associated with a long-term decline in PA and an increase in SB remain limited.
We previously conducted a cross-sectional analysis that identified exercise capacity, dyspnea, pulmonary function, exercise-induced desaturation (EID), nutritional status, muscle strength, and hemoglobin A1c (HbA1c) as factors that discriminated four activity phenotypes defined by the combination of PA and SB levels at a single time point [15]. However, whether these baseline factors are also associated with longitudinal changes in PA and SB has not been investigated. Building on these cross-sectional findings, the present study aimed to identify the baseline factors associated with a long-term decline in PA and an increase in SB over an extended follow-up period in patients with COPD.
2. Materials and Methods
2.1. Participants
Participants were recruited from the SPACE study, which developed a reference equation for PA in Japanese patients with COPD (UMIN 000025459, January 10, 2017), and the E-PAC study, which developed a practical prediction equation for PA in patients with COPD (UMIN 000049919, January 4, 2023). Patient enrollment in the SPACE study was conducted from January 2017 to February 2020 at 21 institutions affiliated with the National Hospital Organization (NHO) group in Japan [16]. That in the E-PAC study was conducted from October 2022 to March 2025 at 32 institutions in Japan. The baseline data for the present cohort were obtained from the SPACE study [15]. In contrast to the previous report, the present analysis is a longitudinal study using follow-up data from the E-PAC study to assess the long-term changes in PA and SB.
In the present study, the participants were outpatients with stable COPD, diagnosed based on a post-bronchodilator forced expiratory volume in one second (FEV1.0)/forced vital capacity (FVC) ratio of <0.7 and an age of ≥40 years. The exclusion criteria were as follows: (1) a history of an exacerbation within the past three months, (2) a severely reduced PA owing to other diseases (including neuromuscular disease, bone and joint disease, active malignant disease, and myocardial infarction), (3) ongoing oxygen therapy, and (4) cases in which participation in the study was deemed inappropriate by the attending physician. This investigation was designed as a retrospective longitudinal analysis that included only those who participated in both studies.
This study was conducted in accordance with the provisions of the Declaration of Helsinki and was approved by the Ethics Committee of the NHO Wakayama Hospital (approval number: 06-1; approval date: May 9, 2024). The study was registered with the UMIN Clinical Trial Registry (UMIN 000060146, December 20, 2025). The participants were notified through the websites of the hospitals where they had participated in the study and were given the opportunity to decline participation.
2.2. Protocol
Data from the SPACE study were used as the baseline, and data from the E-PAC study were used as the follow-up. The annual percentage changes in PA and SB were calculated as follows: annual percentage change = 100× (follow-up value–baseline value) / baseline value/year. The follow-up duration in years was calculated by dividing the number of days between study registrations by 365. The relationship between these changes and the baseline variables was evaluated to investigate the predisposing factors influencing long-term changes in PA and SB in patients with COPD. Information on acute exacerbations of COPD, pneumonia, and hospitalizations due to respiratory diseases occurring between the SPACE and E-PAC studies was collected by reviewing the medical records. An acute exacerbation of COPD was defined as an event requiring treatment with systemic corticosteroids and/or antibiotics, or hospitalization. PA and SB were not assessed between the two studies, and comparisons were therefore limited to the two study time points.
2.3. Variables
In the SPACE study, participants wore an accelerometer from days 0 to 14 (or up to day 28). Day 0 was defined as the day on which informed consent was obtained. On day 0, the following variables were collected: age, sex, height, body weight, body mass index (BMI), smoking history, modified Medical Research Council (mMRC) dyspnea score, Hospital Anxiety and Depression Scale (HADS), medical history, nutritional status, grip strength, post-bronchodilation spirometry, and blood tests. The medical history included a history of COPD medication, whether or not pulmonary rehabilitation was performed, and the presence of comorbidities. The nutritional status was assessed by measuring the upper arm circumference and triceps subcutaneous fat thickness of the dominant hand. BMI was calculated as body weight (kg) divided by the square of height (m2); body weight, BMI, upper arm circumference, and triceps subcutaneous fat thickness were used as indices of nutritional status. Blood tests included assessments of red blood cells (RBCs), hemoglobin (Hb), fasting blood glucose (FBG), HbA1c, albumin (Alb), and brain natriuretic peptide (BNP). A 6-min walk test (6MWT) was performed on day 14 (or up to day 28), during which the lowest percutaneous oxygen saturation (SpO2) was recorded. In the E-PAC study, participants wore the same accelerometer from days 0 to 14 (or up to day 28). Day 0 was defined as the day on which informed consent was obtained. On day 0, the following variables were collected: age, sex, height, body weight, BMI, smoking history, mMRC score, and post-bronchodilation spirometry.
2.4. Accelerometric Evaluation
In both studies, from day 0 to day 14 (up to day 28), PA was measured by wearing a triaxial accelerometer, Active Style Pro HJA-750C® (Omron Healthcare, Kyoto, Japan), on the waist. In the SPACE study, measurement was performed for 24 h, excluding bathing and water activities, whereas in the E-PAC study, it was performed for waking hours, also excluding bathing and water activities. Participants were required to maintain an activity diary during the accelerometer measurement period. Step count, total PA, and duration at ≥3.0 METs were employed as indicators of PA, and duration at 1.0–1.5 METs was employed as an indicator of SB.
2.5. Data Cleaning
First, of the 15 recorded days (up to 29 days), rainy days, days with special activities, and days when the maximum temperature was < 5°C or minimum temperature ≥ 25°C were excluded because they were considered to affect the participants’ physical status [17,18]. Next, the accelerometric raw data from 07:00 to 20:00 were extracted from the recorded data, and the days with < 8 hours of accelerometer wearing time were excluded. Non-wear time was defined as 90 minutes of consecutive zeros with an allowance for 2 minutes of interruptions, in accordance with Choi’s method [19]. Finally, to obtain data reproducibility, data from participants who had at least three valid days were analyzed as valid data, and the mean of all valid days in each study period was used as the representative value for each PA and SB variable. Information on weather conditions and special activity days was obtained from the content of the diary. The maximum and minimum temperatures were retrieved from the records of the nearest weather station to each institution where the participant was recruited.
2.6. Sample Size and Power
Daily step count, total PA, duration at ≥3.0 METs, and duration at 1.0–1.5 METs were all pre-specified as measures of PA and SB. The sample size was, however, fixed by the number of participants common to both studies (n = 32); no a priori sample size calculation was performed, and no minimum important effect size was pre-specified for any of the associations examined. The study was therefore not powered to detect any particular magnitude of association, and the absence of statistical significance cannot be interpreted as evidence of the absence of an association. To allow readers to judge the range of effects compatible with our data, regression coefficients are reported with 95% confidence intervals (CI) for every independent variable in each model, irrespective of statistical significance. We deliberately did not perform post hoc power calculations, as these are a deterministic function of the observed p value and provide no information beyond these confidence intervals.
2.7. Statistical Analysis
Continuous variables are presented as the median (interquartile range, Q1, Q3). Spearman’s rank correlation coefficient was used for all correlation analyses. A single non-parametric method was applied uniformly across variables, because the annual percentage changes were skewed, the sample size was small, and parametric coefficients are sensitive to outliers. Multiple linear regression was used to examine the association between candidate variables and the change in PA. To limit overfitting, the number of independent variables was restricted to three, corresponding to approximately 10 observations per variable. The variables entered—BMI, the percentage of predicted FEV1.0 (FEV1.0 %pred), and the lowest SpO₂ during the 6MWT—were fixed before the models were fitted and were chosen on the basis of clinical relevance together with the results of the univariable analysis. BMI was prioritized over upper arm circumference to avoid multicollinearity; these two variables are strongly correlated and have been validated as reliable proxies for each other in clinical settings [20,21]. BMI was selected as the representative nutritional indicator because a low BMI has been consistently associated with the incidence, severity, and mortality of COPD in previous studies [22,23,24,25,26]. FEV1.0 %pred was employed rather than the absolute FEV1.0 value to standardize for individual differences in body size. Multicollinearity was assessed using variance inflation factors (VIF), with VIF > 5 considered indicative of significant multicollinearity.
All tests were two-tailed, and a threshold of p < 0.05 was used descriptively. Multiple linear regression analyses were performed using IBM SPSS Statistics for Windows, version 24.0 (IBM Corp., Armonk, NY, USA); all other analyses were performed using GraphPad Prism version 8.0 (GraphPad Software, San Diego, CA, USA).
2.8. Multiplicity
A total of 116 correlation coefficients (29 baseline variables × 4 outcome measures) and four multivariable models were computed, and no adjustment for multiplicity was applied. With 116 coefficients evaluated at a two-sided threshold of 0.05, approximately 5.8 would be expected to reach this threshold by chance alone. Formal control of the family-wise error rate was not undertaken because the purpose of these analyses was to identify candidate factors for subsequent confirmatory study rather than to test pre-specified hypotheses. All p values are accordingly presented descriptively, as indications of the strength of evidence within an exploratory analysis, and the associations identified are correspondingly provisional. These coefficients are not mutually independent: the four outcome measures were derived from the same accelerometer recordings and are strongly correlated with one another, as are several of the baseline variables. The expected number of chance findings given above therefore represents an upper bound obtained under an assumption of independence.
3. Results
Among the 253 participants enrolled in the SPACE study and the 394 enrolled in the E-PAC study, 34 took part in both. Two were excluded: one was hospitalized for another disease during the SPACE study, and the other had an acute exacerbation during the E-PAC study, thus leaving 32 participants from five institutions for analysis (Figure 1).
The median follow-up duration was 5.0 years. At baseline, the participants had a median age of 71.0 years and the median FEV1.0 %pred was 70.1%. The median daily step count, total PA, and duration at ≥3.0 METs and 1.0–1.5 METs were 4274 steps, 3.19 METs·h, 52.8 min, and 329 min, respectively. At follow-up (median age, 75.5 years), FEV1.0 %pred decreased to 65.1%. The median daily step count, total PA, and duration at ≥3.0 METs and 1.0–1.5 METs were 3679 steps, 2.43 METs·h, 39.6 min, and 349 min, respectively (Table 1).
The annual median percentage changes in the step count, total PA, duration at ≥3.0 METs, and duration at 1.0–1.5 METs were -3.6%, -6.2%, -6.1%, and 0.7%, respectively. The annual median percentage changes in inspiratory capacity (IC), FVC, and FEV1.0 were -1.6%, -2.2%, -3.0%, respectively (Table 2). Absolute changes and the annual percentage changes in PA and SB are illustrated in Figure 2 and Figure 3.
Spearman's rank correlation coefficients showed that the step count, total PA, and duration at ≥3.0 METs were significantly positively correlated with body weight, BMI, FEV1.0, FEV1.0/FVC, lowest SpO2 during the 6MWT, upper arm circumference, and HADS–Anxiety subscale (HADS-A). The duration at 1.0–1.5 METs was negatively correlated with the lowest SpO2 during the 6MWT and positively correlated with the hemoglobin concentration (Hb) (Table 3). Of the 32 participants, one experienced an acute exacerbation of COPD, three developed pneumonia, and three were hospitalized due to respiratory diseases between the SPACE and E-PAC study periods.
For percentage change in the duration at ≥3.0 METs with multiple linear regression analysis, the overall regression model was statistically significant (F = 4.31, p = 0.013), explaining 31.6% of the variance (adjusted R² = 0.243). BMI was associated with the change in the duration at ≥3.0 METs (β = 1.07, 95% CI 0.18 to 1.97, p = 0.020; Table 4). For the percentage change in total PA, the model reached statistical significance (F = 3.28, p = 0.035), explaining 26.0% of the variance (adjusted R² = 0.181). BMI was associated with the total PA change (β = 1.23, 95% CI 0.12 to 2.38, p = 0.031; Table 4). Regarding the percentage change in the step count, the overall model was not statistically significant (F = 2.56, p = 0.076), explaining 21.5% of the variance (adjusted R² = 0.131). None of the independent variables were significantly associated with the step count change, although BMI showed a borderline association (β = 1.21, 95% CI -0.17 to 2.58, p = 0.083; Table 4). For the percentage change in the duration at 1.0–1.5 METs, the model was not statistically significant (F = 1.41, p = 0.259), explaining 13.2% of the variance (adjusted R² = 0.039). None of the independent variables were significantly associated with the SB change (Table 4). The VIF values were < 2 for all independent variables in all models, thus indicating no evidence of problematic multicollinearity.
4. Discussion
We investigated the baseline factors associated with the long-term changes in PA and SB in patients with COPD. A higher body weight, BMI, upper arm circumference, FEV1.0, FEV1.0/FVC, lowest SpO2 during the 6MWT, and HADS-A were associated with a slower decline in the step count, total PA, and the duration at ≥3.0 METs. A higher lowest SpO2 during the 6MWT was associated with a smaller increase in SB, whereas a higher baseline hemoglobin concentration was associated with a greater increase in SB. In the multiple linear regression analyses, BMI remained associated with the annual percentage changes in total PA and in the duration at ≥3.0 METs after accounting for FEV1.0 %pred and the lowest SpO2 during the 6MWT.
Participants with a higher body weight, BMI, and upper arm circumference, which reflect a better nutritional status, showed a reduced rate of decline in PA over time. Although, to our knowledge, no studies have directly examined the relationship between nutritional status and a long-term decline in PA in patients with COPD, previous studies have shown that a low BMI is associated with an increased incidence, severity, and mortality of COPD [22,23,24,25,26]. Earlier reports have demonstrated differences in the activity levels across BMI categories in COPD populations [27,28]. Mortality due to respiratory diseases in East Asian populations is high in both the low- and high-BMI groups, which indicates that both extremely low and high BMI values may be associated with adverse outcomes [29]. In the present cohort, the BMI values were generally within a relatively low-to-moderate range. Therefore, the association observed between a higher BMI and a reduced rate of decline in PA may reflect the protective effect of an adequate nutritional status rather than the beneficial effect of excess body weight.
Whereas prior research has mainly reported cross-sectional associations between PA and nutritional status, the present study provides longitudinal evidence that BMI may be associated with the rate of decline in PA over time. One possible explanation is that a lower BMI may reflect a reduced skeletal muscle mass and impaired exercise tolerance, which may subsequently lead to an accelerated decline in PA [27,28,29,30]. This interpretation suggests that nutritional status may not only reflect current activity levels but also influence future declines in PA. Overall, maintaining an adequate nutritional status may be important for preventing excessive long-term declines in PA in patients with COPD. Although these findings do not constitute independent replication, the observed association is consistent with an established pathophysiological rationale and with previous reports linking a low BMI to adverse outcomes in COPD.
Among the participants with COPD, a higher lowest SpO₂ during the 6MWT was associated with a reduced rate of long-term decline in PA and a smaller increase in SB. EID is a marker of disease severity in COPD and has been correlated with an increased risk of mortality [31,32] and a greater impairment of pulmonary function [31]. A cross-sectional study reported that EID was associated with impaired daily PA in COPD [33]. Although no longitudinal studies have directly examined the associations between EID and a long-term decline in PA or an increase in SB, EID has been identified as a predictor of changes in exercise capacity [34]. These findings support the hypothesis that the physiological mechanisms underlying EID may also contribute to a long-term decline in PA and an increase in SB. The association with SB, however, rests on the univariable analysis alone: the multivariable model for the change in SB was not statistically significant.
Hypoxemia may attenuate the beneficial effects of exercise on skeletal muscles in patients with COPD [35]. Repeated desaturation can impair oxygen delivery to the peripheral muscles and promote skeletal muscle dysfunction, which may contribute to the progressive decline in PA [36,37]. In addition, pulmonary hypertension related to chronic hypoxemia may also contribute to a reduced exercise capacity in COPD [38,39]. However, this could not be evaluated in the present study because no echocardiographic or hemodynamic data were available.
In the present study, participants with COPD who had a higher baseline FEV1.0 were associated with a slower rate of decline in PA over the follow-up period. This finding is consistent with a previous prospective study that identified pulmonary function as an important determinant of lower long-term PA levels [40]. Cross-sectional studies have reported that PA in COPD is related to pulmonary and systemic disease components, although airflow limitation alone explains only a limited part of the variance, with dynamic hyperinflation and extrapulmonary factors playing a larger role [41,42]. However, longitudinal evidence on whether baseline pulmonary function is associated with the subsequent rate of decline in PA —rather than PA levels alone—remains scarce. The present study addresses this gap by showing that, over a 5-year follow-up period, a higher baseline pulmonary function was associated with a slower long-term decline in PA, thereby extending previous, largely cross-sectional observations to a longitudinal setting.
A positive correlation was observed between HADS-A and the annual percentage change in PA. However, previous studies have reported inconsistent associations between anxiety and PA in COPD [43,44,45]. In this cohort, the anxiety levels were generally low. Therefore, the clinical significance of this finding is uncertain. Anxiety was assessed with a single instrument; thus, the lack of corroboration by a second measure reflects the measurement design rather than evidence against the association. A positive correlation was also observed between the baseline Hb and the annual percentage change in the duration at 1.0–1.5 METs, indicating that a higher Hb was associated with a greater increase in SB. The Hb concentrations in this cohort were within the normal range in most participants. This association therefore reflects neither anemia nor polycythemia. Furthermore, Hb was not correlated with the lowest SpO2 during the 6MWT, which would have suggested a shared relationship with hypoxemia. Both associations emerged among the 116 coefficients examined without adjustment for multiplicity, and chance findings cannot be excluded; both could be regarded as candidate hypotheses requiring confirmation.
Our previous cross-sectional analysis of the baseline SPACE cohort demonstrated that nutritional indicators (BMI and upper arm circumference), muscle strength, pulmonary function, and EID were factors that discriminated the activity phenotypes at a single time point [15]. The present longitudinal study extends those findings by demonstrating that several of these baseline factors—particularly BMI and the lowest SpO2 during the 6MWT—not only characterize the current activity pattern but are also associated with the rate of long-term decline in PA and the increase in SB. Notably, the present analysis suggests that BMI may be associated with the subsequent rate of decline in PA—a relationship that cannot be examined in a cross-sectional design—and this represents the principal contribution of the present study. It remains a hypothesis to be tested in an adequately powered prospective cohort.
Our study has several limitations. First, the analysis was not powered to detect any particular magnitude of association; several of the confidence intervals we report are wide and do not exclude differences that would be considered clinically meaningful, and non-significant findings should therefore not be interpreted as evidence of absence. Second, no baseline factor was designated as being of primary interest in advance. The prominence given to BMI in our interpretation was determined after the results had been obtained, and the three variables entered into the regression models were selected with reference to the univariable results from the same dataset; the p values from these models might therefore be optimistically biased. Together with the absence of adjustment for multiplicity, this means that the associations described here are best regarded as candidate hypotheses, and independent replication in an adequately powered cohort is required before they can be considered established. Third, those who died, deteriorated clinically, or were unable to complete repeated monitoring were necessarily excluded, and participation in both studies is likely to have favored cooperative and comparatively active individuals. Our results should therefore be understood as applying to relatively stable patients with COPD, rather than to the broader COPD population. Fourth, as all participants were Japanese men, and because PA and SB patterns are further influenced by sex, [46,47] climate, and regional lifestyle habits [48], generalizability to women and to other populations is limited. Fifth, no established minimal important difference exists for total PA, for the duration of PA at ≥3.0 METs, or for the duration of SB, which limits the clinical interpretation of the magnitude of the changes observed in these outcomes. Sixth, other factors that may influence the long-term decline in PA were not fully evaluated. Although COPD exacerbations and other respiratory diseases requiring hospitalization, such as pneumonia, were assessed, the potential impact of other comorbidities or of changes in treatment during follow-up remains unclear.
In conclusion, long-term PA showed a reduced rate of decline in participants with COPD who had a better nutritional status, a preserved pulmonary function, and a higher lowest SpO₂ during the 6MWT. In the multivariable analysis, a lower BMI was independently associated with a greater longitudinal decline in PA, suggesting that nutritional status may play an important role in preventing an excessive decline in PA. EID may also contribute to long-term increases in SB, although this association rests on the univariable analysis alone. The early identification of patients with poor nutritional status may therefore help to detect individuals at risk of a future decline in PA.
Author Contributions
Conceptualization, Y.M. (Yusuke Murakami) and Y.M. (Yoshiaki Minakata); Methodology, Y.M. (Yusuke Murakami) and Y.M. (Yoshiaki Minakata); Formal analysis, Y.M. (Yusuke Murakami); Investigation, Y.M. (Yusuke Murakami), Y.T., K.M., S.T. and T.K.; Resources, Y.M. (Yoshiaki Minakata); Data curation, Y.M. (Yusuke Murakami), Y.T., K.M., S.T. and T.K.; Writing—original draft preparation, Y.M. (Yusuke Murakami); Writing—review and editing, Y.M. (Yusuke Murakami), Y.M. (Yoshiaki Minakata), Y.T., K.M., S.T., and T.K.; Visualization, Y.M. (Yusuke Murakami); Supervision, Y.M. (Yoshiaki Minakata); Project administration, Y.M. (Yusuke Murakami); Funding acquisition, Y.M. (Yusuke Murakami). All authors have read and agreed to the published version of the manuscript.
Funding
This study was supported by a grant for PI Development Research from the National Hospital Organization (NHO), Japan. The Article Processing Charge for the publication of this research was also funded by the same grant.
Institutional Review Board Statement
The study was conducted in accordance with the Declaration of Helsinki and was approved by the Ethics Committee of the NHO Wakayama Hospital (approval number 06-1, approved on 9 May 2024). The study was registered with the UMIN Clinical Trials Registry (UMIN000060146, registered on 20 December 2025).
Informed Consent Statement
Patient consent was waived owing to the retrospective nature of the study. Information regarding the study was disclosed on the websites of the participating institutions, and potential participants were given the opportunity to opt out.
Data Availability Statement
The data presented in this study are available on request from the corresponding author owing to ethical and privacy restrictions.
Acknowledgments
We would like to thank the participants and staff of the institutions affiliated with the National Hospital Organization (NHO) who participated in the SPACE and E-PAC studies. The authors thank Brian Quinn, Managing Editor of Japan Medical Communication, for proofreading the manuscript.
Conflicts of Interest
KM has a JP patent 6798747 issued, and a ZL 201980072350. X issued. All the other authors declare that they have no conflicts of interest.
References
- Global Initiative for Chronic Obstructive Lung Disease. Global Strategy for the Diagnosis, Management, and Prevention of Chronic Obstructive Pulmonary Disease: 2025 Report. 2024. Available online: https://goldcopd.org/2025-gold-report/ (accessed on 10 December 2025).
- World Health Organization. Chronic Obstructive Pulmonary Disease (COPD). 2024. Available online: https://www.who.int/news-room/fact-sheets/detail/chronic-obstructive-pulmonary-disease-(copd) (accessed on 10 December 2025).
- Waschki, B.; Kirsten, A.; Holz, O.; et al. Physical activity is the strongest predictor of all-cause mortality in patients with COPD: a prospective cohort study. Chest 2011, 140(2), 331–342. [Google Scholar] [CrossRef]
- Gimeno-Santos, E.; Frei, A.; Steurer-Stey, C.; et al. Determinants and outcomes of physical activity in patients with COPD: a systematic review. Thorax 2014, 69(8), 731–739. [Google Scholar] [CrossRef]
- Furlanetto, K.C.; Donaría, L.; Schneider, L.P.; Lopes, J.R.; Hernandes, N.A.; Pitta, F. Sedentary behavior is an independent predictor of mortality in subjects with COPD. Respir. Care 2017, 62(5), 579–587. [Google Scholar] [CrossRef] [PubMed]
- Caspersen, C.J.; Powell, K.E.; Christenson, G.M. Physical activity, exercise, and physical fitness: definitions and distinctions for health-related research. Public Health Rep. 1985, 100(2), 126–131. [Google Scholar] [PubMed]
- World Health Organization. WHO Guidelines on Physical Activity and Sedentary Behaviour. 2020. Available online: https://www.who.int/publications/i/item/9789240015128 (accessed on 12 December 2025).
- Tremblay, M.S.; Aubert, S.; Barnes, J.D.; et al. Sedentary Behavior Research Network (SBRN) – Terminology Consensus Project process and outcome. Int. J. Behav. Nutr. Phys. Act. 2017, 14(1), 75. [Google Scholar] [CrossRef] [PubMed]
- Waschki, B.; Kirsten, A.M.; Holz, O.; et al. Disease progression and changes in physical activity in patients with chronic obstructive pulmonary disease. Am. J. Respir. Crit. Care Med. 2015, 192(3), 295–306. [Google Scholar] [CrossRef] [PubMed]
- Clarenbach, C.F.; Sievi, N.A.; Haile, S.R.; et al. Determinants of annual change in physical activity in COPD. Respirology 2017, 22(6), 1133–1139. [Google Scholar] [CrossRef] [PubMed]
- Sievi, N.A.; Brack, T.; Brutsche, M.H.; et al. Physical activity declines in COPD while exercise capacity remains stable: a longitudinal study over 5 years. Respir. Med. 2018, 141, 1–6. [Google Scholar] [CrossRef] [PubMed]
- Zhou, W.; Veliz, P.T.; Pu, J.; Luo, W.; Shang, S.; Larson, J.L. Dose-response relationship of physical activity and sedentary time with mortality in people with chronic obstructive pulmonary disease: an analysis of UK biobank accelerometer cohort. BMC Pulm. Med. 2025, 25(1), 502. [Google Scholar] [CrossRef] [PubMed]
- Polkey, M.I.; Rabe, K.F. Chicken or egg: physical activity in COPD revisited. Eur. Respir. J. 2009, 33(2), 227–229. [Google Scholar] [CrossRef] [PubMed]
- Watz, H.; Pitta, F.; Rochester, C.L.; et al. An official European Respiratory Society statement on physical activity in COPD. Eur. Respir. J. 2014, 44(6), 1521–1537. [Google Scholar] [CrossRef] [PubMed]
- Murakami, Y.; Minakata, Y.; Kato, M.; et al. Determinants of activity phenotype in patients with chronic obstructive pulmonary disease. Int. J. Chron. Obstruct Pulmon Dis. 2023, 18, 1919–1929. [Google Scholar] [CrossRef]
- Minakata, Y.; Sasaki, S.; Azuma, Y.; Kawabe, K.; Ono, H. Reference equations for assessing the physical activity of Japanese patients with chronic obstructive pulmonary disease. Int. J. Chron. Obstruct Pulmon Dis. 2021, 16, 3041–3053. [Google Scholar] [CrossRef] [PubMed]
- Miyamoto, S.; Minakata, Y.; Azuma, Y.; et al. Verification of a motion sensor for evaluating physical activity in COPD patients. Can. Respir. J. 2018, 2018, 8343705. [Google Scholar] [CrossRef] [PubMed]
- Sugino, A.; Minakata, Y.; Kanda, M.; et al. Validation of a compact motion sensor for the measurement of physical activity in patients with chronic obstructive pulmonary disease. Respiration 2012, 83(4), 300–307. [Google Scholar] [CrossRef] [PubMed]
- Choi, L.; Liu, Z.; Matthews, C.E.; Buchowski, M.S. Validation of accelerometer wear and nonwear time classification algorithm. Med. Sci. Sports Exerc. 2011, 43(2), 357–364. [Google Scholar] [CrossRef] [PubMed]
- Gottschall, C.; Tarnowski, M.; Machado, P.; et al. Predictive and concurrent validity of the Malnutrition Universal Screening Tool using mid-upper arm circumference instead of body mass index. J. Hum. Nutr. Diet. 2019, 32(6), 775–780. [Google Scholar] [CrossRef] [PubMed]
- Benítez Brito, N.; Suárez Llanos, J.P.; Fuentes Ferrer, M.; et al. Relationship between mid-upper arm circumference and body mass index in inpatients. PLoS ONE 2016, 11(8), e0160480. [Google Scholar] [CrossRef] [PubMed]
- Celli, B.R.; Cote, C.G.; Marin, J.M.; et al. The body-mass index, airflow obstruction, dyspnea, and exercise capacity index in chronic obstructive pulmonary disease. N Engl. J. Med. 2004, 350(10), 1005–1012. [Google Scholar] [CrossRef] [PubMed]
- Park, H.J.; Cho, J.H.; Kim, H.J.; Park, J.Y.; Lee, H.S.; Byun, M.K. The effect of low body mass index on the development of COPD and mortality. J. Intern Med. 2019, 286(5), 573–582. [Google Scholar] [CrossRef] [PubMed]
- Harik-Khan, R.I.; Fleg, J.L.; Wise, R.A. Body mass index and the risk of COPD. Chest 2002, 121(2), 370–376. [Google Scholar] [CrossRef] [PubMed]
- Baig, M.M.A.; Hashmat, N.; Adnan, M.; Rahat, T. The relationship of dyspnea and disease severity with anthropometric indicators of malnutrition among patients with COPD. Pak. J. Med. Sci. 2018, 34(6), 1408–1413. [Google Scholar] [CrossRef] [PubMed]
- Arora, S.; Madan, K.; Mohan, A.; Kalaivani, M.; Guleria, R. Serum inflammatory markers and nutritional status in patients with stable COPD. Lung India 2019, 36(5), 393–398. [Google Scholar] [CrossRef] [PubMed]
- Machado, F.V.; Vogelmeier, C.F.; Jörres, R.A.; et al. Differential impact of low fat-free mass in people with COPD based on BMI classifications. Chest 2023, 163(5), 1071–1083. [Google Scholar] [CrossRef] [PubMed]
- Monteiro, F.; Camillo, C.A.; Vitorasso, R.; et al. Obesity and physical activity in the daily life of patients with COPD. Lung 2012, 190(4), 403–410. [Google Scholar] [CrossRef] [PubMed]
- Zheng, W.; McLerran, D.F.; Rolland, B.; et al. Association between body-mass index and risk of death in more than 1 million Asians. N Engl. J. Med. 2011, 364(8), 719–729. [Google Scholar] [CrossRef] [PubMed]
- Kawai, T.; Asai, K.; Miyamoto, A.; et al. Distinct contributions of muscle mass and strength stratified by nutritional status to physical activity in patients with chronic obstructive pulmonary disease. Respir. Investig. 2023, 61(4), 389–397. [Google Scholar] [CrossRef] [PubMed]
- Waatevik, M.; Johannessen, A.; Gomez Real, F.; et al. Oxygen desaturation in 6-min walk test is a risk factor for adverse outcomes in COPD. Eur. Respir. J. 2016, 48(1), 82–91. [Google Scholar] [CrossRef] [PubMed]
- Takigawa, N.; Tada, A.; Soda, R.; et al. Distance and oxygen desaturation in 6-min walk test predict prognosis in COPD patients. Respir. Med. 2007, 101(3), 561–567. [Google Scholar] [CrossRef] [PubMed]
- van Gestel, A.J.; Clarenbach, C.F.; Stöwhas, A.C.; et al. Prevalence and prediction of exercise-induced oxygen desaturation in patients with chronic obstructive pulmonary disease. Respiration 2012, 84(5), 353–359. [Google Scholar] [CrossRef] [PubMed]
- Misu, S.; Kaneko, M.; Sakai, H.; et al. Exercise-induced oxygen desaturation as a predictive factor for longitudinal decline in 6-minute walk distance in subjects with COPD. Respir. Care 2019, 64(2), 145–152. [Google Scholar] [CrossRef] [PubMed]
- Barreiro, E.; Gea, J. Molecular and biological pathways of skeletal muscle dysfunction in chronic obstructive pulmonary disease. Chron. Respir. Dis. 2016, 13(3), 297–311. [Google Scholar] [CrossRef] [PubMed]
- Maltais, F.; Decramer, M.; Casaburi, R.; et al. An official American Thoracic Society/European Respiratory Society statement: update on limb muscle dysfunction in chronic obstructive pulmonary disease. Am. J. Respir. Crit. Care Med. 2014, 189(9), e15–e62. [Google Scholar] [CrossRef] [PubMed]
- Gea, J.; Pascual, S.; Casadevall, C.; Orozco-Levi, M.; Barreiro, E. Muscle dysfunction in chronic obstructive pulmonary disease: update on causes and biological findings. J. Thorac. Dis. 2015, 7(10), E418–E438. [Google Scholar] [CrossRef] [PubMed]
- Sims, M.W.; Margolis, D.J.; Localio, A.R.; Panettieri, R.A.; Kawut, S.M.; Christie, J.D. Impact of pulmonary artery pressure on exercise function in severe COPD. Chest 2009, 136(2), 412–419. [Google Scholar] [CrossRef] [PubMed]
- Hilde, J.M.; Skjørten, I.; Hansteen, V.; et al. Haemodynamic responses to exercise in patients with COPD. Eur. Respir. J. 2013, 41(5), 1031–1041. [Google Scholar] [CrossRef] [PubMed]
- Yu, T.; Frei, A.; Ter Riet, G.; Puhan, M.A. Determinants of physical activity in patients with chronic obstructive pulmonary disease: a 5-year prospective follow-up study. Respiration 2016, 92(2), 72–79. [Google Scholar] [CrossRef] [PubMed]
- Watz, H.; Waschki, B.; Boehme, C.; Claussen, M.; Meyer, T.; Magnussen, H. Extrapulmonary effects of chronic obstructive pulmonary disease on physical activity: a cross-sectional study. Am. J. Respir. Crit. Care Med. 2008, 177(7), 743–751. [Google Scholar] [CrossRef] [PubMed]
- Garcia-Rio, F.; Lores, V.; Mediano, O.; et al. Daily physical activity in patients with chronic obstructive pulmonary disease is mainly associated with dynamic hyperinflation. Am. J. Respir. Crit. Care Med. 2009, 180(6), 506–512. [Google Scholar] [CrossRef] [PubMed]
- Neale, C.D.; Christensen, P.E.; Dall, C.; et al. Sleep quality and self-reported symptoms of anxiety and depression are associated with physical activity in patients with severe COPD. Int. J. Env. Res. Public Health 2022, 19(24), 16804. [Google Scholar] [CrossRef] [PubMed]
- Dueñas-Espín, I.; Demeyer, H.; Gimeno-Santos, E.; et al. Depression symptoms reduce physical activity in COPD patients: a prospective multicenter study. Int. J. Chron. Obstruct Pulmon Dis. 2016, 11, 1287–1295. [Google Scholar] [CrossRef] [PubMed]
- Selzler, A.M.; Ellerton, C.; Ellerton, L.; et al. The relationship between physical activity, depression and anxiety in people with COPD: a systematic review and meta-analyses. COPD 2023, 20(1), 167–174. [Google Scholar] [CrossRef] [PubMed]
- Amagasa, S.; Inoue, S.; Ukawa, S.; et al. Are Japanese women less physically active than men? Findings from the DOSANCO Health Study. J. Epidemiol. 2021, 31(10), 530–536. [Google Scholar] [CrossRef] [PubMed]
- Amagasa, S.; Inoue, S.; Shibata, A.; et al. Differences in accelerometer-measured physical activity and sedentary behavior between middle-aged men and women in Japan: a compositional data analysis. J. Phys. Act. Health 2022, 19(7), 500–508. [Google Scholar] [CrossRef] [PubMed]
- Minakata, Y.; Azuma, Y.; Sasaki, S.; Murakami, Y. Objective measurement of physical activity and sedentary behavior in patients with chronic obstructive pulmonary disease: points to keep in mind during evaluations. J. Clin. Med. 2023, 12(9), 3254. [Google Scholar] [CrossRef] [PubMed]
Figure 1.
Flow diagram of participant enrollment in the present study.
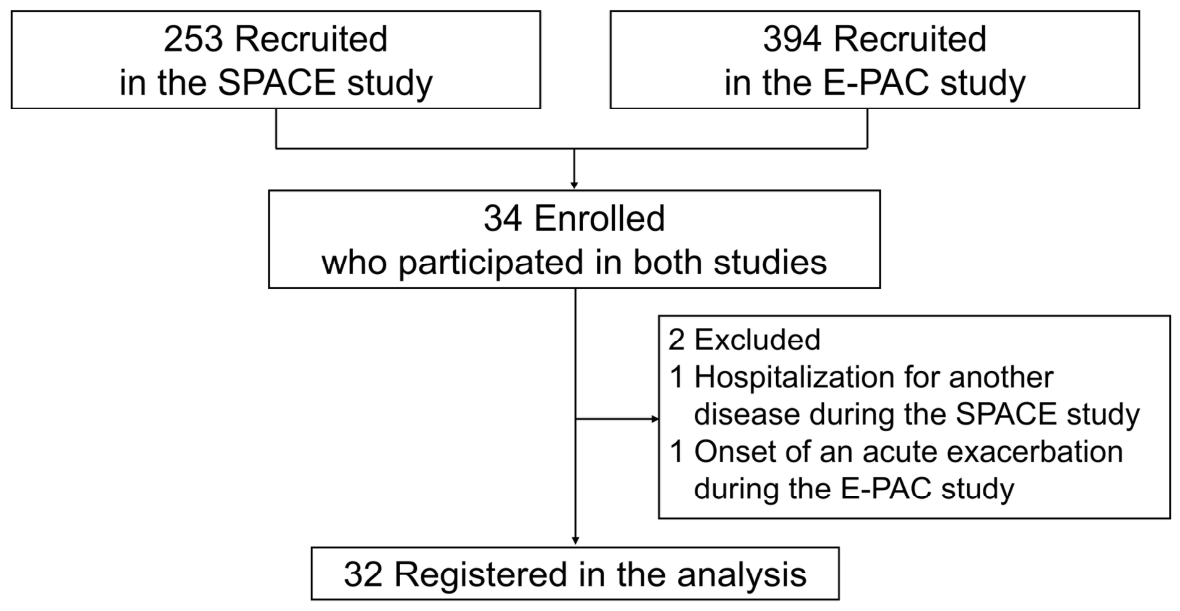
Figure 2.
Changes in the PA and SB parameters from baseline to follow-up. (A) total PA, (B) duration of PA at ≥3.0 METs, (C) step count, and (D) duration of SB at 1.0–1.5 METs. All values are daily values averaged over the measurement period. Gray circles represent the individual participant values, plotted at baseline (year 0) and at that participant’s own follow-up duration. Gray lines connect the baseline and the follow-up values to facilitate the visualization of changes; the intermediate values were not measured, and these lines indicate neither actual trajectories nor linear changes. The left black circle represents the median baseline value. For illustrative purposes, the right black circle was obtained by applying the median annual rate of change over the median follow-up period of 5.0 years to the median baseline value, and is plotted at 5.0 years; it therefore illustrates the median annual rate of change rather than the median of the observed follow-up values, which were obtained at differing follow-up durations. The black line represents this median annual rate of change applied uniformly over the median follow-up period, and is shown for illustrative purposes only. Abbreviations: PA, physical activity; SB, sedentary behavior; METs, metabolic equivalents.
Figure 2.
Changes in the PA and SB parameters from baseline to follow-up. (A) total PA, (B) duration of PA at ≥3.0 METs, (C) step count, and (D) duration of SB at 1.0–1.5 METs. All values are daily values averaged over the measurement period. Gray circles represent the individual participant values, plotted at baseline (year 0) and at that participant’s own follow-up duration. Gray lines connect the baseline and the follow-up values to facilitate the visualization of changes; the intermediate values were not measured, and these lines indicate neither actual trajectories nor linear changes. The left black circle represents the median baseline value. For illustrative purposes, the right black circle was obtained by applying the median annual rate of change over the median follow-up period of 5.0 years to the median baseline value, and is plotted at 5.0 years; it therefore illustrates the median annual rate of change rather than the median of the observed follow-up values, which were obtained at differing follow-up durations. The black line represents this median annual rate of change applied uniformly over the median follow-up period, and is shown for illustrative purposes only. Abbreviations: PA, physical activity; SB, sedentary behavior; METs, metabolic equivalents.
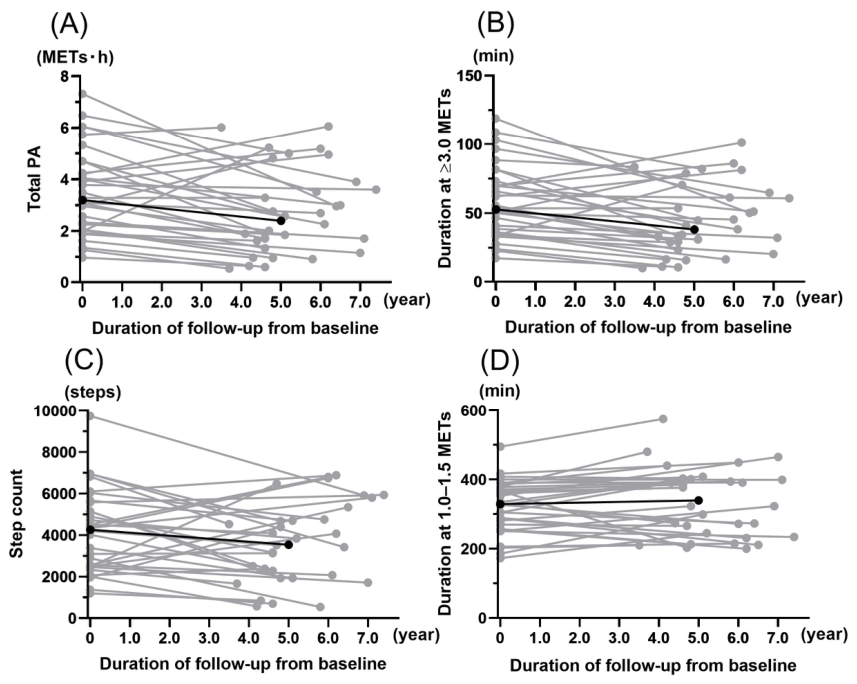
Figure 3.
Changes in the PA and SB parameters from baseline to follow-up, expressed relative to each participant’s own baseline value. (A) total PA, (B) duration of PA at ≥3.0 METs, (C) step count, and (D) duration of SB at 1.0–1.5 METs. Values are expressed relative to each participant’s own baseline value, which is set at 100%; a value of 100% therefore indicates no change from baseline. Gray circles represent the individual participant values, plotted at baseline (year 0) and at that participant’s own follow-up duration. Gray lines connect the baseline and the follow-up values to facilitate the visualization of changes; the intermediate values were not measured, and these lines indicate neither actual trajectories nor linear changes. The left black circle is fixed at 100% by definition. For illustrative purposes, the right black circle was obtained by applying the median annual rate of change, expressed as a percentage of the baseline value, over the median follow-up period of 5.0 years to the baseline value of 100%, and is plotted at 5.0 years; it therefore illustrates the median annual rate of change rather than the median of the observed values at follow-up. The black line represents this median annual rate of change applied uniformly over the median follow-up period, and is shown for illustrative purposes only. Because the median of the individual ratios is not equal to the ratio of the medians, this value does not correspond exactly to the ratio between the two black circles in Figure 2. Note that the y-axis scale of panel (D) differs from that of panels (A–C). Abbreviations: PA, physical activity; SB, sedentary behavior; METs, metabolic equivalents.
Figure 3.
Changes in the PA and SB parameters from baseline to follow-up, expressed relative to each participant’s own baseline value. (A) total PA, (B) duration of PA at ≥3.0 METs, (C) step count, and (D) duration of SB at 1.0–1.5 METs. Values are expressed relative to each participant’s own baseline value, which is set at 100%; a value of 100% therefore indicates no change from baseline. Gray circles represent the individual participant values, plotted at baseline (year 0) and at that participant’s own follow-up duration. Gray lines connect the baseline and the follow-up values to facilitate the visualization of changes; the intermediate values were not measured, and these lines indicate neither actual trajectories nor linear changes. The left black circle is fixed at 100% by definition. For illustrative purposes, the right black circle was obtained by applying the median annual rate of change, expressed as a percentage of the baseline value, over the median follow-up period of 5.0 years to the baseline value of 100%, and is plotted at 5.0 years; it therefore illustrates the median annual rate of change rather than the median of the observed values at follow-up. The black line represents this median annual rate of change applied uniformly over the median follow-up period, and is shown for illustrative purposes only. Because the median of the individual ratios is not equal to the ratio of the medians, this value does not correspond exactly to the ratio between the two black circles in Figure 2. Note that the y-axis scale of panel (D) differs from that of panels (A–C). Abbreviations: PA, physical activity; SB, sedentary behavior; METs, metabolic equivalents.
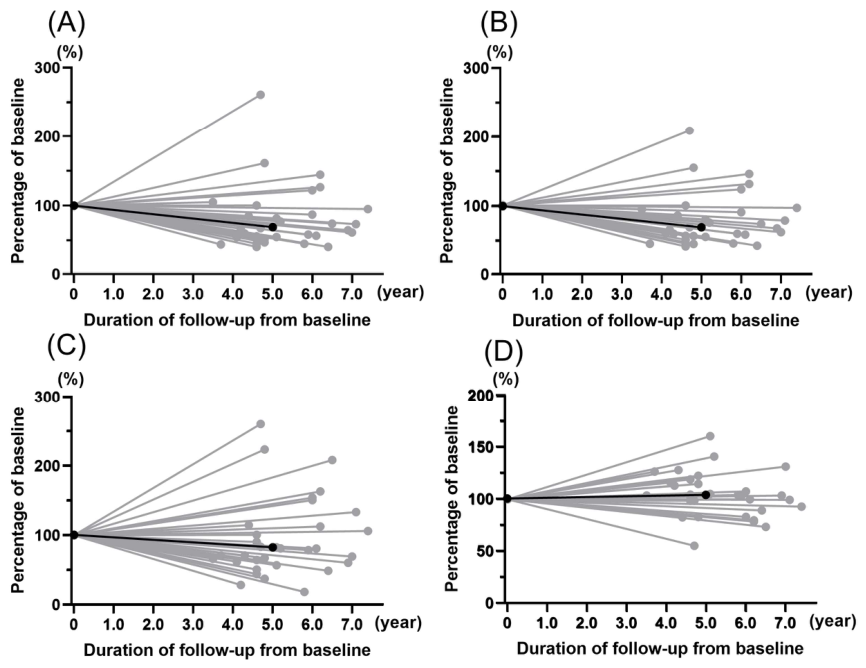

Table 1.
Characteristics of all patients.
| Baseline (the SPACE study) | Follow-up (the E-PAC study) | |
| Gender (Male/Female) | 32/0 | |
| Follow-up duration (years) | 5.0 (4.6, 6.1) | |
| Age (years) | 71.0 (67.8, 75.3) | 75.5 (73.8, 81.0) |
| BMI (kg/m2) | 23.1 (20.6, 24.7) | 23.3 (20.4, 24.3) |
| Smoking history | ||
| Current/Former/Never | 3/29/0 | 2/30/0 |
| Pack-year | 47.5 (37.3, 85.5) | 53.0 (39.8, 80.0) |
| mMRC (0/1/2/3/4) | 7/21/2/2/0 | 1/22/5/3/1 |
| COPD stage (Ⅰ/Ⅱ/Ⅲ/Ⅳ) | 9/17/5/1 | 6/18/6/2 |
| Pulmonary function | ||
| IC (L) | 2.46 (2.18, 2.79) | 2.27 (1.80, 2.63) |
| FVC (L) | 3.55 (3.12, 3.82) | 3.16 (2.69, 3.49) |
| FVC %pred (%) | 101.7 (94.2, 111.6) | 90.9 (80.5, 106.2) |
| FEV1.0 (L) | 1.98 (1.53, 2.17) | 1.66 (1.17, 2.05) |
| FEV1.0 %pred (%) | 70.1 (58.5, 83.8) | 65.1 (49.0, 73.6) |
| FEV1.0/FVC (%) | 55.2 (48.6, 64.0) | 54.5 (42.3, 60.8) |
| 6MWD (m) | 453 (417, 503) | |
| Lowest SpO2 during the 6MWT (%) | 90.0 (87.0, 91.5) | |
| PA | ||
| Step count (steps) | 4274 (2492, 5262) | 3679 (2036, 4903) |
| Total PA (METs·h) | 3.19 (2.06, 4.36) | 2.43 (1.57, 3.69) |
| Duration at ≥3.0 METs (min) | 52.8 (36.1, 70.7) | 39.6 (27.6, 62.1) |
| SB | ||
| Duration at 1.0–1.5 METs (min) | 329 (267, 378) | 349 (242, 400) |
| Nutrition | ||
| Upper arm circumference (cm) | 28.4 (26.6, 29.8) | |
| Subcutaneous fat thickness of triceps brachii (cm) |
0.90 (0.60, 1.20) | |
| Grip strength (kg) | 35.0 (33.8, 39.3) | |
| Blood tests | ||
| FBG (mg/dL) | 102 (95, 111) | |
| HbA1c (%) | 5.9 (5.7, 6.2) | |
| RBC (×104/μl) | 479 (442, 515) | |
| Hb (g/dL) | 14.9 (14.3, 15.7) | |
| BNP (pg/mL) | 17.0 (6.4, 46.9) | |
| Alb (g/dL) | 4.3 (4.1, 4.4) | |
| HADS | ||
| Anxiety score | 3.0 (0.8, 6.0) | |
| Depression score | 2.5 (1.0, 5.3) | |
| Treatment (Yes/No) | 28/4 | |
| Rehabilitation (Yes/No) | 3/29 | |
| Comorbidities (Yes/No) | 22/10 |
The results are expressed as median (interquartile range, Q1, Q3). Abbreviations: BMI, body mass index; mMRC, modified Medical Research Council dyspnea scale; IC, inspiratory capacity; FVC, forced vital capacity; FEV1.0, forced expiratory volume in one second; %pred, % of predicted value; 6MWD, 6-minute walk distance; 6MWT, 6-minute walk test; PA, physical activity; METs, metabolic equivalents; SB, sedentary behavior; FBG, fasting blood glucose; HbA1c, hemoglobin A1c; RBC, red blood cell count; Hb, hemoglobin; BNP, brain natriuretic peptide; Alb, albumin; HADS, hospital anxiety and depression scale.
Table 2.
Changes in physical activity, sedentary behavior and pulmonary function.
| Annual change | Annual percentage change | |
| PA | ||
| Step count (steps) | -145 (-372, -84) | -3.6 (-8.0, 2.4) |
| Total PA (METs·h) | -0.16 (-0.29, -0.05) | -6.2 (-9.4, -1.8) |
| Duration at ≥3.0 METs (min) | -2.9 (-4.9, -1.0) | -6.1 (-9.4, -1.6) |
| SB | ||
| Duration at 1.0–1.5 METs (min) | 2.1 (-3.0, 10.4) | 0.7 (-1.1, 3.1) |
| Pulmonary function | ||
| IC (L) | -0.044 (-0.088, 0.004) | -1.6 (-3.8, 0.2) |
| FVC (L) | -0.067 (-0.105, -0.025) | -2.2 (-3.0, -0.7) |
| FEV1.0 (L) | -0.056 (-0.072, 0.026) | -3.0 (-4.5, -1.3) |
The results are expressed as median (interquartile range, Q1, Q3). Abbreviations: PA, physical activity; METs, metabolic equivalents; SB, sedentary behavior; IC, inspiratory capacity; FVC, forced vital capacity; FEV1.0, forced expiratory volume in one second.
Table 3.
Correlations between baseline characteristics and percentage changes in physical activity and sedentary behavior.
Table 3.
Correlations between baseline characteristics and percentage changes in physical activity and sedentary behavior.
|
Percentage change in step count |
Percentage change in total PA |
Percentage change in duration of PA at ≥3.0 METs |
Percentage change in duration of SB at1.0–1.5 METs |
|||||
| r | p | r | p | r | p | r | p | |
| Age (years) | 0.234 | 0.197 | -0.200 | 0.272 | -0.173 | 0.345 | -0.099 | 0.590 |
| Height (m) | 0.033 | 0.858 | -0.031 | 0.866 | 0.033 | 0.858 | 0.176 | 0.335 |
| Weight (kg) | 0.550 | 0.001 | 0.606 | < 0.001 | 0.590 | < 0.001 | -0.258 | 0.154 |
| BMI (kg/m2) | 0.461 | 0.008 | 0.491 | 0.004 | 0.470 | 0.007 | -0.278 | 0.124 |
|
Smoking history (pack-year) |
0.047 | 0.800 | 0.030 | 0.872 | 0.007 | 0.971 | 0.296 | 0.100 |
| Pulmonary function | ||||||||
| IC (L) | 0.152 | 0.406 | 0.297 | 0.099 | 0.291 | 0.107 | -0.142 | 0.438 |
| FVC (L) | 0.065 | 0.723 | 0.228 | 0.209 | 0.205 | 0.260 | 0.220 | 0.227 |
| %FVC (%) | 0.055 | 0.767 | 0.115 | 0.532 | 0.097 | 0.598 | 0.121 | 0.509 |
| FEV1.0 (L) | 0.449 | 0.010 | 0.486 | 0.005 | 0.496 | 0.004 | -0.141 | 0.442 |
| FEV1.0/FVC (%) | 0.556 | 0.001 | 0.451 | 0.010 | 0.483 | 0.005 | -0.357 | 0.045 |
| FEV1.0 %pred (%) | 0.416 | 0.018 | 0.348 | 0.051 | 0.364 | 0.041 | -0.162 | 0.376 |
| 6MWD (m) | 0.338 | 0.059 | 0.294 | 0.103 | 0.322 | 0.072 | -0.115 | 0.531 |
| Lowest SpO2 during 6MWT (%) | 0.493 | 0.004 | 0.577 | <0.001 | 0.558 | <0.001 | -0.406 | 0.021 |
| Nutrition | ||||||||
| Upper arm circumference (cm) | 0.447 | 0.010 | 0.475 | 0.006 | 0.479 | 0.006 | -0.286 | 0.112 |
| Subcutaneous fat thickness of triceps brachii (cm) | 0.060 | 0.744 | 0.135 | 0.462 | 0.146 | 0.427 | -0.223 | 0.220 |
| Grip strength (kg) | 0.329 | 0.066 | 0.307 | 0.087 | 0.279 | 0.123 | -0.127 | 0.488 |
| Blood tests | ||||||||
| FBG (mg/dL) | 0.058 | 0.753 | -0.022 | 0.905 | -0.023 | 0.900 | 0.150 | 0.413 |
| HbA1c (%) | -0.025 | 0.894 | 0.190 | 0.297 | 0.162 | 0.376 | 0.020 | 0.912 |
| RBC (×104/μl) | -0.389 | 0.028 | -0.154 | 0.399 | -0.166 | 0.364 | 0.344 | 0.054 |
| Hb (g/dL) | -0.307 | 0.087 | -0.272 | 0.133 | -0.282 | 0.118 | 0.420 | 0.017 |
| BNP (pg/mL) | 0.250 | 0.167 | 0.096 | 0.602 | 0.069 | 0.709 | -0.302 | 0.093 |
| Alb (g/dL) | -0.043 | 0.817 | 0.225 | 0.217 | 0.248 | 0.172 | 0.001 | 0.994 |
| HADS | ||||||||
| Anxiety score | 0.402 | 0.023 | 0.449 | 0.010 | 0.445 | 0.011 | -0.305 | 0.089 |
| Depression score | 0.197 | 0.280 | 0.208 | 0.254 | 0.230 | 0.206 | -0.229 | 0.208 |
| mMRC | -0.145 | 0.429 | 0.003 | 0.985 | -0.021 | 0.910 | -0.041 | 0.826 |
| PA | ||||||||
| Step count (steps) | -0.135 | 0.462 | -0.031 | 0.866 | -0.000 | 0.998 | 0.077 | 0.675 |
| Total PA (METs·h) | 0.205 | 0.261 | 0.169 | 0.356 | 0.194 | 0.287 | -0.088 | 0.632 |
| Duration at ≥3.0 METs (min) |
0.205 | 0.261 | 0.157 | 0.390 | 0.180 | 0.324 | -0.092 | 0.616 |
| SB | ||||||||
| Duration at 1.0–1.5 METs (min) |
-0.157 | 0.390 | -0.215 | 0.238 | -0.193 | 0.290 | 0.048 | 0.796 |
Abbreviations: BMI, body mass index; mMRC, modified Medical Research Council dyspnea scale; IC, inspiratory capacity; FVC, forced vital capacity; FEV1.0, forced expiratory volume in one second; %pred, % of predicted value; 6MWT, 6-minute walk test; FBG, fasting blood glucose; HbA1c, hemoglobin A1c; RBC, red blood cell count; Hb, hemoglobin; BNP, brain natriuretic peptide; Alb, albumin; HADS, hospital anxiety and depression scale; PA, physical activity; METs, metabolic equivalents; SB, sedentary behavior.
Table 4.
A multiple linear regression analysis identifying the predictors of percentage changes in physical activity and sedentary behavior.
Table 4.
A multiple linear regression analysis identifying the predictors of percentage changes in physical activity and sedentary behavior.
| Percentage change in step count | Percentage change in total PA |
Percentage change in duration at ≥3.0 METs |
Percentage change in duration at 1.0–1.5 METs |
|||||
| β (95% CI) |
p | β (95% CI) |
p | β (95% CI) |
p | β (95% CI) |
p | |
| BMI (kg/m²) | 1.21 (-0.17, 2.58) |
0.083 | 1.23 (0.12, 2.38) |
0.031 | 1.07 (0.18, 1.97) |
0.020 | -0.41 (-0.95, 0.13) |
0.127 |
| FEV1.0 %pred (%) | -0.003 (-0.25, 0.24) |
0.979 | -0.07 (-0.27, 0.13) |
0.480 | -0.05 (-0.21, 0.11) |
0.519 | 0.03 (-0.07, 0.13) |
0.508 |
| Lowest SpO2 during 6MWT (%) | 0.41 (-0.38, 1.21) |
0.295 | 0.45 (-0.19, 1.09) |
0.164 | 0.44 (-0.08, 0.95) |
0.094 | -0.14 (-0.45, 0.17) |
0.359 |
β, unstandardized regression coefficient; CI, confidence interval. Abbreviations: PA, physical activity; METs, metabolic equivalents; SB, sedentary behavior; BMI, body mass index; FEV1.0, forced expiratory volume in one second; %pred, % of predicted value; 6MWT, 6-minute walk test.
Disclaimer/Publisher’s Note: The statements, opinions and data contained in all publications are solely those of the individual author(s) and contributor(s) and not of MDPI and/or the editor(s). MDPI and/or the editor(s) disclaim responsibility for any injury to people or property resulting from any ideas, methods, instructions or products referred to in the content. |
© 2026 by the authors. Licensee MDPI, Basel, Switzerland. This article is an open access article distributed under the terms and conditions of the Creative Commons Attribution (CC BY) license.
Copyright: This open access article is published under a Creative Commons CC BY 4.0 license, which permit the free download, distribution, and reuse, provided that the author and preprint are cited in any reuse.