

Submitted:
18 August 2026
Posted:
19 August 2026
You are already at the latest version
Abstract
Background The growing use of computational modeling of real-world data (RWD) in clinical research introduces significant risks for data scientists already managing inconsistency, unexamined bias, and analytical opacity. Without the formal theory supporting biostatistical models and despite more than 600 guideline-based checklists for data quality and transparency reporting in observational RWD, reliance on ad hoc model specification and verification is still the norm. No structured guidance exists to help clinicians and researchers systematically assess and manage the risks generated by computational results using RWD. In this paper, we propose a framework that reflects a rigorous, bias-aware methodology for complex analyses of RWD. We also propose the curated use of a large language model (LLM) supporting AI-generated code-auditing to ensure data quality. Our structured hierarchical approach coupled with AI-auditing is the first phase in the development of full-stack automation of RWD analytic validation.
Methods Our analytic framework spans 10 domains across three analytic phases. Each domain includes prespecified criteria governing verification with potential biases, mechanisms, and mitigation strategies systematically mapped throughout. Phase 1 entails Specification (Domains 1–4: objectives and estimands, data inputs and outputs, cohort and filters, and variable coding); Phase 2:Modeling (Domains 5–7: model testing, diagnostics, and reasonableness checks); and Phase 3: Robustness and Interpretation (Domains 8–10: missing data handling, temporal and stratified checks, and scope boundaries). We utilize specific prompt-directed large language model (LLM) auditing of model elements to ensure data quality. The methodology is illustrated with examples from an empirical characterization of inpatient opioid data from Cerner Real World (2014–2021).
Results The Cerner RWD data base contained 16,734 pediatric cancer patients (76,395 encounters) across 55 U.S. health systems. During the specification phase, total daily dose could not be estimated with sufficient validity from Cerner RWD, and “as-needed” orders, warranted empirically supported exclusion. The modeling phase revealed residual variability in opioid ordering attributable primarily to patient-level differences within health systems (ICC=19.9%) rather than between health systems (ICC=2.0%). Temporal analysis revealed a downward trend in morphine and fentanyl ordering trajectories from 2017-onward. We then utilized curated prompting to enforce an AI-generated coding requirement to produce valid likelihood ratio tests across the prespecified model sequence accounting for temporal trends.
Conclusions The 10-domain framework provides a structured, reproducible mechanism for governing RWD analyses, supporting transparent exposure definition, systematic bias assessment, prespecified analytic decision-making, and auditing via curated AI prompting. To our knowledge, this is the first structured framework to 1) identify analytic metrics at risk for unreliability; 2) incorporate AI-audited workflows in RWD research; and 3) demonstrate utility in a large multi-institutional real-world data base. The approach reflects the initial development in automating of RWE data analytics.
Keywords:
real-world data (RWD)
; large language models (LLM)
; artificial intelligence (AI)
; bias (epidemiology)
; linear modeling
; pediatrics
; medical oncology
1. Background
The growing use of computational modeling of real-world data (RWD) in clinical research introduces significant risks for data scientists already managing inconsistency, unexamined bias, and analytical opacity. The risks are substantial with the democratization of large administrative databases where there is little-to-no technical barrier to access, although general access may be subject to legal constraints on use. Clinical studies using RWD, routinely rely on clinical or administrative data generated outside controlled research settings, and results increasingly depend on derived analytic outputs from unaudited data and analytics. A simple measurement, e.g., weight-based pharmacological metrics in pediatric clinical research, are a good example of a confounded, often unreliable estimate of dose. In constructing an emulated trial or digital twin from RWE in a quasi-experimental dose-escalation emulated trial, the unreliability of one simple measure could invalidate the research. RWE requires careful specification, a sensitivity to the need for hierarchical modeling, and iterative validation to ensure reliability and reproducibility [1,2]. In pediatrics, these challenges are compounded by well-documented data quality limitations, including high missingness and inaccuracy in weight data [3], fragmented medication capture across EMR and dispensing systems, and unknowingly censored data extractions that seriously circumscribe researchers’ ability to self-discover data limitations [4].
Universal access to data via platforms like EPIC Research or EPIC Cosmos, as well as the increasing reliance on LLMs for population and pattern discovery, have the potential to lower these barriers and broaden analytic accessibility. Without a framework governing their use, however, reliance on requirement-driven data extractions or LLM-generated code introduces increased risks of inconsistency, unexamined bias, and analytical opacity that can undermine standards for RWD evidence generation [5,6,7,8,9].
Despite more than 600 guideline-based checklists that exist for data-quality assessment and transparency reporting across study designs, clinical domains, and report sections [10,11,12,13,14,15,16,17], including the NICE Real-World Evidence Framework and its accompanying Data Suitability Assessment Tool (DataSAT) [18], guidelines alone are not sufficient to ensure reproducibility. Efforts to address comparability across data systems, including initiatives to standardize data elements across U.S. healthcare systems and promote analytic auditing through digital twinning, represent progress toward this goal [19,20]. However, these efforts do not yet address the immediate challenges of working with non-standardized data, nor do they govern transparency and reproducibility within the analytic workflow itself. Even when guidelines are applied, decisions regarding bias assessment and mitigation, specification error, data missingness, robustness, and verification of results remain subject to considerable ad hoc judgment in observational RWD research.
Aligning study objectives with a reproducible analytic workflow remains a persistent challenge in clinical research using RWD, particularly as analytic complexity increases. Yet published workflows rarely make transparent the many pre-processing decisions and modeling choices that most affect data integrity and reproducibility [21]. The growing use of LLMs to assist with or generate analytic code introduces additional complexity: without structured oversight, LLM outputs can be inconsistent or inaccurate, underscoring the need for reasoning accuracy [22] and systematic task auditing when LLMs are applied to complex analyses [5,6,7,8,20,23]. We advocate for a structured framework that explicitly governs how LLM assistance is incorporated into each analytic decision point is therefore needed to address these compounding challenges.
In this paper, we propose a structured, bias-aware analytic framework spanning 10 domains to establish transparency and reproducibility in the derivation, analysis, and interpretation of metrics from RWD prone to data quality limitations, through explicit and curated auditing using AI-generated code. To our knowledge, this is the first structured framework for analytic metrics at risk for unreliability, and the first to incorporate an audit process using a targeted AI analytic workflow in RWD research. The framework’s 10 domains span three core areas, specification, hierarchical modeling, and robustness and interpretation. We demonstrate the framework’s utility with an example from inpatient opioid ordering among pediatric cancer patients across a multi-site U.S. health system network using Cerner RWD, a database where explicit characterization of limitations is not well-described [24,25,26]. The example is not intended as a critique of Cerner but an illustration of how the framework can identify and mitigate data limitations inherent in every database. In addition, we propose a conservative use of the LLM to support self-auditing. By formalizing the analytic process, we hope to move closer to fully automated (and audited) data analytics. This research provides a practical, iterative analytic framework designed to improve transparency and reproducibility, and offers clinicians and researchers a curated auditing approach utilizing AI to promote future automation of these tasks.
2. Methods
2.1. Analytic Framework
The analytic framework (Figure 1) is organized into three domain groups that can be used sequentially but are more effective if utilized iteratively to ensure comprehensive assessment: (I) Specification (Domains 1-4)—objectives/estimands, data inputs/outputs, cohort/filters, and variable coding; (II) Hierarchical modeling (Domains 5-7)—model specification, diagnostics, and reasonableness checks; and (III)—Robustness and interpretation (Domains 8-10)—missing data handling, temporal/stratified checks, and scope boundaries.
2.2. Specification Domains 1-4
2.2.1. Domain 1. Identify and Confirm Research Objective and Estimands
Domain 1 is used to ensure that the study objectives are well-matched to the data generated assuming the data structure. Like many health-related databases, Cerner is a billing database that captures patient encounters during a hospital stay. There can be a wide variety of encounters billed including medications and treatments. In this illustration, the analytics followed from the study objective: to compare medication proscribing across pediatric patients diagnosed with cancer, accounting for different cancer diagnoses patient, as well as demographic and clinical characteristics that may impact dose. Primary and secondary estimands specified a priori included: (1) encounter-level outcomes across prespecified covariates; (2) patient level variance components; and (3) cluster-level variance components; (4) time-related variance components. The target metric for comparability across the patient cohort was morphine milligram equivalents (MME) based on opioid dosing (mg/kg) as the estimand. The primary unit of analysis was the encounter; secondary unit of analysis was the patient. Because the data are provided by hospitals, hospital variation, and changes in medication prescribing guidelines over time would also be incorporated into the Domain 1 assessment.
2.2.2. Domain 2. Data Inputs and Outputs
Inputs-Patient characteristics, health-system characteristics, and opioid-order data were the primary inputs and were extracted from Cerner Real-World Data in August 2023. Candidate predictors, operational definitions, analytic parameterizations, and intended uses are summarized in Table 1. Parameterization was guided by published guidelines, clinical reasoning, prior literature, and the observed distribution of each variable. These features were prespecified in the data pre-processing and analytic code to support transparency and reproducibility.
For each patient, we extracted the first recorded cancer diagnosis which was classified by eight clinically derived categories using ICD-10 codes C00–C96 or comparable ICD-9 codes. Current pediatric guidelines, empiric practices within and across hospitals, and maximum inpatient pain were identified as primary inputs to MME. Initial descriptive analyses of the pain input was performed based on the scale score for the pain metric (0–10) with the expectation that the input would be constrained by pediatric guidelines for opioid administration, and would vary within institutions based on empiric practice, as well as between institutions and hospital departments (oncology vs PICU). We identified that the recording of this input was inconsistent across hospital days; there were unmeasured biases in recording reflected in the recording, variation across hospital days, and approximately 25% of encounters had missing pain data. These concerns prompted a subsequent assessment to determine if the metric should be excluded from analysis or imputed; and if imputed, what management of the metric would be required to limit unmeasured bias.
The primary estimand MME would have to be constructed from inpatient opioid exposure, defined as one or more opioid orders during the encounter versus none. The exposure window and detailed operational definition are provided in Domain 4. Before analysis, eligibility criteria and cohort filters were prespecified to ensure that all data-processing and analytic procedures were applied to the intended study population.
Outputs- Output directories, file prefixes, and naming conventions were specified in advance so that exported data checks, tables, figures, models, and fit statistics could be linked to the corresponding analytic step. Distributional summaries and model results were printed and exported in formats suitable for review and documentation. Automated flags were used to identify potential concerns, but all outputs were also visually inspected and interpreted by the evaluator to confirm flagged findings, identify unflagged anomalies, and assess the clinical and statistical interpretability of results before reporting.
2.2.3. Domain 3. Cohort and Filters
Inclusion and exclusion criteria are described in Figure 2. To reduce confounding and selection bias, we excluded encounters with missing (n=50) or invalid (n=34) length of stay (LOS), encounters classified as Labor and Delivery (n=6), and health systems with fewer than five cancer-diagnosis encounters (n=48), the latter supporting more stable assessment of between-system variability. Given the file size, these exclusions were not considered material to inducing censoring. Encounter series were truncated at each patient’s 20th hospitalization, meaning later encounters among high-utilization patients were not included in analyses; this threshold corresponds to approximately the 98th percentile of patient-level encounter counts and was applied to stabilize estimates across hierarchical levels. Sensitivity tests around this percentile score suggested this cut-point was robust. Encounters with LOS > 30 days were assessed, considered clinically as a distinct prescribing pattern based on as prolonged hospitalizations that may reflect distinct prescribing patterns for subacute or chronic pain management, and therefore excluded (n=3,665). However, this exclusion could be managed as a separate sub-cohort in future analyses. Of note, the >30 day LOS was not randomly distributed across patients; therefore, its potential effect on characterization of opioid ordering among higher-complexity patients would require sub-cohort analysis prior to publication or could be targeted to be addressed in the limitations section of Discussion. The final analytic cohort comprised 76,395 encounters from 16,734 patients across 55 geographically and organizationally diverse U.S. health systems. As the unit of analysis is encounters rather than patients, high-utilization patients contribute more observations, which is addressed through the hierarchical modeling framework described in Domains 5–7.
Data Auditing for Illogical Encounters- Data extraction produced a medication file containing 225,508 opioid prescription orders across all encounter records. After restricting to the five most common opioid types (morphine, fentanyl, oxycodone, hydromorphone, and methadone), accounting for 96.9% of all orders, the dataset comprised 218,260 order rows. Sequential exclusion criteria were then applied as shown in supplemental Table 2: 1) orders with a start date earlier than the patient’s admission date, indicative of left-censoring or data entry error (n=1,399); 2) orders with status marked as Cancelled or Error Entry Deleted (n=2,148); 3) orders containing one of the five opioids in combination with another active ingredient (n=4,822); and 4) orders with as-needed status marked as True (n=86,636). Given the distinct clinical indication of as-needed orders, a subset comparison of discontinuation rates between as-needed “True” (n=86,636) and as-needed “False” (n=123,255) orders was conducted to assess the appropriateness of PRN exclusion from the primary analytic sample. The 123,255 non-PRN orders comprised the primary analytic sample for all subsequent analyses.
2.2.4. Domain 4. Variable Coding
Drug Exposure Window and Operationalization- For each encounter and each of the five primary opioids, the exposure window was defined from admission through discharge. Any prescribed days’ supply extending beyond discharge was excluded from the encounter-level exposure calculation, and the 0.3% of orders with a missing end date were assumed applicable only on the start date. Five drug-specific binary variables were created to denote whether each order referenced the respective opioid (1=Yes, 0=No). Data were then aggregated by encounter, hospital day, and opioid type across all valid orders, with the maximum value retained for each opioid-day, to account for multiple orders of the same drug on a given day. Three exposure variables were constructed from this aggregated structure: daily exposure, indicating opioid use on a given hospital day; cumulative exposure, measured as opioid-days summed across all opioids over the full hospitalization; and ever exposure, a binary indicator of any opioid use during the encounter. Together these variables support assessment of individual opioid contributions to overall exposure, as-needed prescribing patterns, and variance partitioning across cluster levels including ICC estimates. The ever-exposure outcome at the encounter level serves as the primary analytic outcome for the AI-audited coding exemplar demonstrated in this framework.
Daily dose of opioid medication- Without actual dosing available, we attempted to develop an algorithm using the extracted data to estimate daily dose and morphine milligram equivalents (MME); however, significant validity issues in construction were identified. First, these dose elements (frequency, dose quantity, and administration route) required for calculation reflected the order not the actual administration of the dose and this was of critical import to the validity of the MME metric. Second, the data were complete for only 35.0% (Supplemental Table 3). We were also unable to aggregate same-day orders when discontinued or modifications occurred within overlapping time windows, a not uncommon clinical practice that could not be disaggregated from the data. Using Cerner Real World, we could not determine reasons for discontinuation or reconcile multiple same-day orders, and we could not reliably distinguish among orders written, prescription dispense, and doses administered. The impact of this conflation meant that orders could not be treated as a valid proxy for doses. Although there may be rough equivalence, the association could not be reliably quantified and the introduction of this proxy could undermine the validity and reliability of the analysis. We made a secondary effort to associate orders with doses by using a meta-imputation approach using the Pediatric Health Information System (PHIS) as an external data source to construct a Gibbs sampler, a Bayesian iterative algorithm that could be used to estimate doses from the conditional distributions of patient-defining covariates, an approach used successfully in genomic imputation [27]. However, because PHIS provides dose in milligrams without corresponding weight data, we would have had to match the weight data from Cerner to PHIS, adding significant risk to the analyses given that pediatric weight estimates are notoriously unreliable. As a result of an unsuccessful imputation strategy owing to unknown sources of systematic bias and high rates of missingness, we were precluded from the weight-based normalization required for reliable MME conversion.
Non-Independence- Nevertheless, we still investigated clustering effects to further characterize the reliability issues of orders. Multilevel variance partitioning was used to assess clustering in prescribing (orders and dose) completeness across health system, patient, and encounter levels. Clustering was substantial and primarily attributable to the health-system level (Supplemental Figure 1), indicating that missing or incomplete dosage fields likely reflected system-level documentation practices, data-entry protocols, and institutional policies rather than random missingness alone. This finding further limited the validity of meta-imputation for estimating daily dose, mg/kg dose, or MME in the current multisystem RWD dataset. Although total daily dose could not be estimated with sufficient validity from Cerner RWD at the time of this study, such estimation may still be completely feasible within individual health systems going forward.
Future derivation of dose-based opioid exposure measures from multisystem RWD will require improved standardization of dosage documentation and computational methods that account for health-system-specific documentation patterns.
2.3. Modeling Domains 5-7
2.3.1. Domain 5. Model Specification
Cluster Levels- Analyses were conducted within a three-level hierarchical structure to test the nested nature of the data: encounters nested within patients, and patients nested within health systems. This structure was specified to account for the non-independence of repeated encounters within patients and variation in opioid ordering practices across health systems. At the health system level, a random effect term was proposed to account for unmeasured between-system variation, with fixed effects specified for geographic region (nine U.S. regions), health system volume (three categories based on the interquartile range of median encounters per year: low ≤4, moderate 5–222, and high >222), and temporal trends by admission year (2014–2021). When a health system treated patients from multiple geographic regions, the region with the highest frequency of encounters was assigned as the system’s primary region, although we recognized the limitations of this assumption. No sensitivity tests were performed evaluating the impact of this assumption but could be evaluated in silico in follow-up efforts. At the time of this study, the first digit of the patient’s ZIP code was the most granular geographic variable available in Cerner RWD, corresponding to nine U.S. regions. This level of geographic granularity precluded neighborhood-level evaluation of social determinants of health, a recognized limitation of Cerner RWD.
Model Building- Hierarchical generalized linear mixed models (GLMMs) were considered a robust approach to manage the data. GLMMs were specified to estimate covariate-adjusted encounter-level opioid order probability, drug-specific calendar year effects (adjusted odds ratios [aORs] with 95% CIs), and intraclass correlation coefficients (ICCs). Model building followed a prespecified nested sequence: M1 (random effects only), M2 (system-level covariates added), M3 (system-level plus case-mix covariates), and M4 (fully adjusted: system-level, case-mix, and calendar year). Model fit was assessed using AIC at each step, with prespecified diagnostics including residual and influence checks and singularity assessment. Given negligible encounter-level variance, the encounter-level random intercept was excluded from the final M4 specification. Primary inference focused on ICCs and calendar year drug-type trends; the nested sequence was therefore fit on the overall opioid order outcome, after which drug-specific analyses were conducted using the final M4 specification. Marginalized probability estimates and ICCs with 95% CIs are reported for the overall outcome and by drug type. Covariate-specific aORs for system-level and case-mix fixed effects are not presented; interaction analyses were outside the scope of the current study and are planned for future work.
Sparse Data and Model Instability- For methadone and hydromorphone, prespecified instability criteria for frequentist GLMMs under sparse data conditions were met, including quasi-separation and convergence-related instability. Bayesian hierarchical models were therefore specified for these two drugs and summarized using posterior estimates with 95% credible intervals.
Software- Descriptive analyses and data transposition were performed in IBM SPSS Statistics v29.0. GLMMs and corresponding outputs were generated in R v4.4.2. Curated AI-auditing of first-pass code drafting was performed using ChatGPT 5.2 (OpenAI).
2.3.2. Domain 6: Model Diagnostics
Fit and Stability- Diagnostic thresholds were prespecified prior to model estimation to ensure objective assessment of model fit and stability. Model fit was evaluated using AIC comparisons across the nested model sequence, with residual and influence diagnostics reviewed at each step. Convergence warnings and variance component behavior were systematically assessed across model specifications. Singularity- occurring when random effect variance estimates approach zero due to insufficient within-cluster variation or sparse data within cluster levels, indicating the model complexity exceeds what the data can reliably support, was evaluated as a prespecified diagnostic criterion. Where instability was detected, as in the case of methadone and hydromorphone under frequentist estimation, alternative model specifications were evaluated and documented, with Bayesian hierarchical models adopted as the prespecified alternative for sparse data conditions.
2.3.3. Domain 7: Reasonableness Checks
Coherence and Shrinkage- Prior to final model estimation, expected directions and magnitudes of key associations were prespecified based on clinical reasoning and existing literature. Crude and adjusted estimates were compared to assess coherence; specifically, whether covariate adjustment produced directionally consistent and clinically plausible changes in effect estimates. Hierarchical shrinkage of health system-level random effects was examined to verify that between-system variability was appropriately attenuated under the multilevel structure, consistent with expected behavior under hierarchical modeling. Estimates deviating substantially from prespecified expectations were flagged for review and documented as part of the bias-aware analytic workflow.
2.4. Robustness and Interpretation Domains 8-10
2.4.1. Domain 8: Missing Data Handling
Missing data identification, imputation strategies considered, and analytic treatment of remaining missingness are described in Section I, where they arise naturally within the data preparation workflow. Key missing data decisions and their potential impact on estimation are further addressed in the Limitations..
2.4.2. Domain 9: Temporal and Stratified Checks
Sensitivity Analysis and Stratification- As-needed opioid orders were evaluated separately from the primary analytic sample given their distinct clinical indication and substantial volume, accounting for 41.3% of 209,889 valid opioid prescription orders. Stratified analyses by admission year were conducted to assess temporal consistency in as-needed ordering patterns across the study period. Whether as-needed orders resulted in filled prescriptions could not be ascertained from Cerner RWD, representing a recognized data constraint on the interpretation of ordering versus administration patterns.
Temporal ICC Estimation- Calendar year-stratified intercept-only logistic GLMMs were fit to evaluate temporal patterns in hierarchical variance for overall as-needed ordering. ICCs were calculated on the latent logistic scale (ICCk = σ²k/σ²total), where σ²total represents the sum of all hierarchical variance components plus the fixed logistic-distribution variance (π²/3 = 3.29). Year-specific ICC 95% CIs were estimated using parametric bootstrap from each fitted GLMM, given that year-stratified models are more susceptible to sparse data and boundary behavior than models fit across the full study period.
Discontinuation Modeling- To assess the appropriateness of excluding as-needed orders from the primary analytic sample, discontinued order status was modeled using a logistic GLMM with fixed effects for as-needed status and drug type, and random intercepts for health system, patient within health system, and encounter within patient. The adjusted odds ratio for discontinuation in as-needed versus non-PRN orders is reported with its 95% Wald CI and p-value.
2.4.3. Domain 10: Scope Boundaries
Prespecified analytic claims and limitations were defined prior to analysis to prevent overreach beyond the study’s inferential goals. Interaction analyses were prespecified as outside scope and are planned for future work. Covariate-specific adjusted ORs for system-level and case-mix fixed effects are reported descriptively and were not the focus of primary inference. The following results are presented within these prespecified scope boundaries.
Study Size-This analysis was descriptive and not inferential. The sample size was not derived from a priori power calculation. Accordingly, effect-size estimation and precision were constrained to general contextual effects with a cluster. We acknowledge that power may be limited for sparse subgroup comparisons and for heavily adjusted models. Subsequent rounds of outcome-focused analyses should prespecify objective-specific sample size and power calculations, particularly for low-frequency demographic or clinical subgroups and multivariable models with high parameter-to-event requirements.
In-Scope Results- Results are presented for the primary analytic sample of 16,734 pediatric cancer patients (76,395 encounters), excluding as-needed orders, and are limited to the prespecified estimands defined in Domain 1.
2.5. Bias Assessment
Potential biases in defining opioid exposure and estimating prescribing patterns using Cerner RWD were systematically identified and addressed across the eight primary bias categories depicted in Figure 3: selection, measurement, misclassification, systematic, temporal, missing data, confounding, and geospatial. Key empirical findings from bias assessment are described below; mitigation strategies for each category are summarized in Figure 3.
Selection Bias- Selection bias was addressed as a foundational concern across Domains 1–4 of the analytic framework because cohort construction and opioid order extraction involved eligibility-based exclusions that may not have been uniformly distributed across the hierarchical data structure. For the encounter-level binary exposure estimand, exclusion of hospitalizations exceeding 30 days and restriction to non-PRN orders may disproportionately affect higher-complexity patients and those receiving as-needed pain regimens, respectively, with potential implications for both adjusted effect estimates and variance component estimands. Restriction to the five most prevalent opioid types, which accounted for 96.9% of opioid orders, may also differentially affect exposure ascertainment across drug classes. Representativeness was evaluated through exclusion audits stratified by cluster level, drug type, and calendar year, including checks of variation in as-needed prescription exclusions across health systems and over time. Uniform application of eligibility criteria across health systems was verified to support the stability and interpretability of between-system ICC estimates. Future analyses will further compare patients retained versus excluded from the final analytic cohort across health system factors and patient case-mix characteristics, including age, sex, race/ethnicity, payor, admission diagnosis, admission type, and length of stay..
Misclassification Bias- The initial medication extraction captured orders for 13 opioid types, from which five primary opioids with a sole active ingredient, morphine, fentanyl, oxycodone, hydromorphone, and methadone, were retained for exposure assessment. The remaining eight opioids lacked direct clinical indication for managing acute cancer-related pain and were excluded [28], as were combination products containing one of the five primary opioids alongside another active ingredient (e.g., fentanyl-bupivacaine). Potential under-capture from omitted trade names was evaluated via post-hoc random sampling of 10,000 prescription orders from a broader pediatric RWD cohort across the concurrent eight-year period. Overall, 6.7% of sampled orders were excluded due to missed trade name identification (Supplemental Table 3) [29,30,31]. Misclassification was concentrated in the hydromorphone category, where 23.2% of sampled prescriptions were listed under the trade name Dilaudid, though this estimate may be inflated given it was derived from a broader patient sample. Misclassification was negligible for morphine (<0.1%) and minimal for fentanyl (1.3%) and oxycodone (2.2%). Expansion of extraction criteria to include trade names within the specific study cohort was not scoped in the original study proposal and is recommended for future analyses.
Measurement Bias- To reduce potential overestimation of opioid exposure, as-needed orders were excluded from primary analyses, with the appropriateness of this decision evaluated empirically through discontinuation rate comparisons. Among 86,634 as-needed orders, 87.7% were discontinued, compared to 15.5% of the 123,255 non-PRN orders comprising the primary analytic sample. After adjustment for drug type, as-needed orders had 4.34 times higher odds of discontinuation (95% CI: 4.31, 4.37, p<.001), consistent with a distinct clinical documentation process governing as-needed orders within the EMR, either recorded separately upon transitioning to completed status, or documented infrequently relative to actual administration. This differential discontinuation pattern supports exclusion of as-needed orders from primary analyses, promoting homogeneity in the clinical ordering process subject to modeling and mitigating masking bias in the assessment of opioid exposure at the encounter level.
Systematic Bias- Variation in data-entry practices across health systems was addressed through hierarchical modeling of clustering at the health system, patient, and encounter levels, with ICCs estimated at each level as described in Domain 5.
Temporal Bias and Health System Drift- As-needed opioid orders were relatively stable across the study period, with the highest rate observed for oxycodone (69.2%; Figure 4a). However, between-system variation in as-needed order patterns declined substantially over time, with the ICC decreasing from 20.2% (95% CI: 10.5%, 29.5%) in 2014 to 10.0% (95% CI: 5.1%, 14.6%) by 2021 (Figure 4b), likely reflecting advances in EHR documentation, data entry standardization, and stricter opioid prescription monitoring. In contrast, patient- and encounter-level ICCs remained relatively stable throughout (range: 5.5–9.3% and 3.3–7.1%, respectively), suggesting that early health system-level clustering in as-needed order exclusions attenuated over time to levels comparable to patient- and encounter-level variance.
Missing Data Bias- Complete dosage information was available in only 35% of opioid orders and was formally assessed across years and cluster levels, as described in Domain 4. Insurance status, missing in 25% of encounters, was retained as an unknown analytic category in outcome models. Due to inconsistent measurement and approximately 25% encounter-level missingness, pain was limited to descriptive analyses. Missingness across other case-mix variables was less than 5%.
Confounding Bias- Opioid exposure parameterization and valid-order identification were evaluated across cluster levels, drug type, and calendar years. Outcome models were specified with adjustment for health system factors and patient case-mix as described in Domain 5.
Geospatial Bias- Although geospatial bias is sometimes treated as a dimension of confounding, it is addressed separately here given the recognized limitations of geographic data in Cerner RWD and its implications for social determinants of health. Geospatial bias assessment was constrained by the limited spatial granularity available, where only the first digit of the patient’s ZIP code was accessible, precluding neighborhood-level evaluation of social determinants of health. Geospatial variation was addressed indirectly through hierarchical modeling, with geographic region fixed effects spanning nine U.S. regions and health system random effects serving as proxies for unmeasured spatial variation in opioid ordering patterns.
3. Verification
AI-Audited Workflow
The final analytic cohort included 16,734 pediatric cancer patients contributing 76,395 encounters. Cohort size, encounter frequency, and the distributions of key patient-, encounter-, and health-system-level variables were reviewed to confirm that the data structure and observed values were consistent with expectations across the hierarchical levels of analysis.
To verify results, we constructed an audit process utilizing a curated AI workflow that targeted the three domain groupings of the analytic framework, (specification, hierarchical modeling, and robustness and interpretation). For each domain, curated, structured prompt templates were constructed and tested. We also developed verification criteria, and interpretation guidance summarized in Table 2. AI-audited first-pass code drafting was performed using ChatGPT with GPT-5.2 (OpenAI) in a privacy-preserving local environment; no patient-level data were submitted to the LLM. It must be noted that this approach was illustrated here using ChatGPT, we believe that our approach is platform-agnostic and could be implemented with other LLM platforms such as Gemini (Google) or Claude (Anthropic). Comparative evaluation across platforms is planned as a secondary study.
Code Specification Domains 1–4- Prompts were structured to generate R code for estimating encounter-level opioid order probability with prespecified effect and variance estimands. Co-primary estimands were specified a priori: adjusted odds ratios (aORs) for encounter-level opioid ordering across prespecified covariates, and cluster-level variance components and ICCs for each level of the prespecified hierarchy. Prompt inputs included the local data import path; output artifact requirements including destination directory, filename prefix, and traceable export naming conventions; variable definitions specifying continuous versus factor classification with prespecified reference levels; and cohort and filter validation checks against expected sample size counts at each sequential filter step. Verification prior to modeling confirmed that output files were generated with traceable filenames, input/output counts and variable types were validated against the data dictionary, analytic N reconciled with the cohort flow at each filter step, and distributional checks and outlier identification were completed before modeling proceeded.
Hierarchical Modeling Domains 5–7- Model prompts specified logistic GLMMs with a prespecified nested model sequence: M1 (random effects only), M2 (M1 plus system-level factors), M3 (M2 plus patient case-mix), and M4 (fully adjusted). Verification criteria required that model formulas and covariate blocks matched the prespecified analysis plan, likelihood ratio tests used a common complete-case sample across all models, and all diagnostic flags, including convergence warnings, singularity, and AIC comparisons, were reviewed and resolved or documented before final reporting. A prespecified guardrail prompt was used to enforce consistent estimation methods and flag non-comparable model comparisons before reporting likelihood ratio test results. Crude and adjusted patterns were required to be directionally coherent; discordance between crude and adjusted estimates was prespecified to trigger code or filter review before proceeding to interpretation.
Robustness and Interpretation Domains 8–10- Missing data rules were implemented as prespecified: insurance missing in 25% of encounters was retained as an unknown analytic category; sex missingness triggered complete-case enforcement across all models to support valid nested likelihood ratio tests. Temporal and stratified checks were conducted overall and by drug type across calendar years. Scope boundaries were enforced throughout: interaction analyses were prespecified as outside scope, and the workflow implemented the prespecified analytic plan only without unsanctioned model expansion.
Outputs and Prompt Refinement- Outputs were required to meet all prespecified verification criteria prior to interpretation, as specified in Table 2. These criteria were particularly important given the data quality limitations documented in Domains 3 and 4, including fragmented medication capture and high missingness in dose elements. When execution errors occurred, error-informed prompt refinement was performed by rerunning revised code until all verification criteria were met; illustrating the iterative, bias-aware auditing process the framework is designed to support. One such refinement was required when 308 records with missing sex were inadvertently included in M1–M2, preventing valid likelihood ratio tests for nested model comparisons; code was updated to enforce a common complete-case sample across all models. Because missingness was less than 1%, imputation and additional sensitivity analyses were not warranted.
Modeling Effects- Prespecified models for hospitalization opioid ordering (Y/N) were estimated overall and by drug type across calendar years, with adjusted effects, variance components, and ICCs summarized in Supplemental Table 4. Likelihood ratio testing supported meaningful improvement in model performance with covariate adjustment: compared with the random-effects-only baseline (M1), adding system-level factors (M2) only slightly improved fit (AIC 92,347 → 92,344), while incorporating patient case-mix substantially improved predictive validity (AIC 89,680), with the fully adjusted model yielding the lowest AIC and significant improvement over baseline (AIC 89,673; LR test vs M1, p<.001).
Residual Variability- In the fully adjusted model, most residual variability in opioid ordering reflected differences among patients within the same health system (ICC=19.9%), while between-health system variability was comparatively small (2.0%) after accounting for measured system-level and case-mix covariates. The encounter-within-patient variance component was negligible (<0.001%), consistent with guidance that variance components estimated at or near the boundary of zero do not substantially contribute to model fit and may be removed for parsimony [32,33]; therefore, the encounter-level random effect was omitted, resulting in a two-level model that retained the substantive sources of clustering while avoiding an unnecessary variance component.
Primary Outcome Assessment- Opioids were ordered in 33.5% of 76,087 pediatric cancer encounters (Table 3a). Estimates were derived from the fully adjusted GLMM with random intercepts at the health system and patient levels; the encounter-within-patient random effect was omitted for parsimony given negligible variance in M4, and no singularities were observed for the overall opioid ordering outcome. The final reduced model substantially improved fit relative to the random-effects-only baseline (AIC 89,671 vs. 92,345; ΔAIC=−2,674). Encounter-level opioid ordering outcomes were estimated using frequentist GLMMs with 95% CIs for the overall outcome and for morphine-, fentanyl-, and oxycodone-specific outcomes. For hydromorphone and methadone, sparse events led to convergence warnings and separation-related coefficient instability in frequentist models; these outcomes were therefore refit using Bayesian multilevel logistic models, with uncertainty summarized using 95% credible intervals (CrI).

Table 3.
a. Overall only (yearly raw prevalence) and adjusted probability a of opioid ordering at encounter by year and drug type.
Table 3.
a. Overall only (yearly raw prevalence) and adjusted probability a of opioid ordering at encounter by year and drug type.
| Year | Observed Prevalence | Overall | Morphine | Fentanyl | Oxycodone | Hydromorphone | Methadone |
| n (%) | p̂ (95% CI) | p̂ (95% CI) | p̂ (95% CI) | p̂ (95% CI) | p̂ (95% CrI) | p̂ (95% CrI) | |
| Total | 76,087 (33.5%) b | ||||||
| 2014 | 6760 (34.1%) | 31.9% (28.5, 35.4) | 13.8% (11.8, 16.1) | 15.3% (12.6, 18.4) | 2.3% (1.5, 3.5) | 5.4% (0.8, 17.9) | 2.2% (0.6, 7.7) |
| 2015 | 8312 (33.4%) | 32.4% (29.1, 35.9) | 12.6% (10.7, 14.7) | 15.9% (13.2, 19.1) | 2.3% (1.5, 3.6) | 4.8% (0.7, 15.8) | 2.9% (0.9, 9.0) |
| 2016 | 9936 (33.1%) | 32.1% (28.9, 35.6) | 13.0% (11.1, 15.1) | 16.2% (13.4, 19.4) | 2.1% (1.4, 3.2) | 4.9% (0.7, 16.1) | 1.7% (0.4, 6.4) |
| 2017 | 10130 (33.5%) | 32.7% (29.4, 36.1) | 12.4% (10.6, 14.5) | 17.0% (14.2, 20.4) | 2.5% (1.6, 3.8) | 4.9% (0.7, 15.8) | 1.8% (0.5, 6.6) |
| 2018 | 10669 (32.1%) | 31.8% (28.6, 35.2) | 11.3% (9.6, 13.2) | 17.2% (14.3, 20.6) | 2.3% (1.5, 3.6) | 4.7% (0.6, 15.8) | 1.3% (0.4, 4.9) |
| 2019 | 10855 (32.0%) | 31.3% (28.1, 34.7) | 11.4% (9.7, 13.4) | 17.0% (14.2, 20.3) | 2.4% (1.6, 3.7) | 5.3% (0.8, 17.3) | 1.7% (0.4, 6.2) |
| 2020 | 9520 (34.7%) | 34.5% (31.1, 38.0) | 11.3% (9.6, 13.2) | 19.4% (16.2, 23.0) | 2.4% (1.5, 3.6) | 5.9% (1.0, 18.6) | 2.0% (0.5, 7.7) |
| 2021 | 9905 (35.5%) | 34.3% (30.9, 37.8) | 11.8% (10.1, 13.8) | 19.3% (16.1, 22.9) | 2.3% (1.3, 3.2) | 6.3% (0.9, 20.9) | 2.2% (0.6, 9.0) |
a Adjusted marginal probabilities were estimated from fully adjusted multilevel logistic models with random intercepts for health system and patient. For hydromorphone and methadone, uncertainty is reported as 95% credible intervals (CrI) from Bayesian multilevel logistic models; all other outcomes report 95% confidence intervals (CI) from frequentist GLMMs. Calendar year was modeled as a factor. Drug-specific columns represent separate outcomes indicating whether the specified drug was ordered during the encounter (Y/N) (outcomes are not mutually exclusive). b Excluded 308 records with missing sex information.
Table 3.
b. Fully adjusted odds ratios for calendar-year effects on opioid ordering during encounters, overall and by drug-specific outcome a.
Table 3.
b. Fully adjusted odds ratios for calendar-year effects on opioid ordering during encounters, overall and by drug-specific outcome a.
| Year | Overall | Morphine | Fentanyl | Oxycodone | Hydromorphone | Methadone |
| aOR (95% CI) | aOR (95% CI) | aOR (95% CI) | aOR (95% CI) | aOR (95% CrI) | aOR (95% CrI) | |
| 2014 | Ref | Ref | Ref | Ref | Ref | Ref |
| 2015 | 1.02 (0.94, 1.12) | 0.90 (0.81, 0.99) | 1.05 (0.95, 1.16) | 1.01 (0.86, 1.18) | 0.95 (0.78, 1.14) | 1.54 (1.05, 2.28) ^ |
| 2016 | 1.01 (0.93, 1.10) | 0.93 (0.84, 1.03) | 1.07 (0.97, 1.19) | 0.92 (0.78, 1.08) | 1.03 (0.83, 1.26) | 0.96 (0.62, 1.50) |
| 2017 | 1.04 (0.95, 1.13) | 0.88 (0.80, 0.98)* | 1.14 (1.03, 1.26)** | 1.07 (0.92, 1.25) | 1.01 (0.82, 1.23) | 1.03 (0.66, 1.56) |
| 2018 | 1.00 (0.91, 1.09) | 0.79 (0.72, 0.88)** | 1.16 (1.05, 1.27)** | 1.03 (0.88, 1.20) | 1.08 (0.88, 1.33) | 0.65 (0.41, 1.03) |
| 2019 | 0.97 (0.89, 1.06) | 0.81 (0.73, 0.89)** | 1.14 (1.03, 1.26)** | 1.05 (0.90, 1.22) | 1.22 (1.00, 1.48) | 0.96 (0.61, 1.50) |
| 2020 | 1.12 (1.03, 1.23)* | 0.80 (0.71, 0.89)** | 1.33 (1.21, 1.47)** | 1.03 (0.88, 1.21) | 1.32 (1.09, 1.61) ^ | 1.60 (1.01, 2.54) ^ |
| 2021 | 1.11 (1.02, 1.22)* | 0.84 (0.75, 0.93)** | 1.33 (1.20, 1.47)** | 0.90 (0.77, 1.06) | 1.61 (1.32, 1.95) ^ | 1.96 (1.22, 3.07) ^ |
*p<.05, **p<.01, ^ 95% credible interval (CrI) excludes 1.0, indicating strong posterior evidence that the aOR differs from 2014. a Adjusted odds ratios (aORs) compare each calendar year with 2014 (reference) within each outcome column and were estimated from the same fully adjusted multilevel logistic models. For hydromorphone and methadone, uncertainty is reported as 95% CrI from Bayesian models; all other outcomes report 95% CI from frequentist GLMMs. Calendar year was modeled as a factor.
4. Discussion
This study proposed and demonstrated a structured, 10-domain analytic framework with embedded auditing using curated AI prompts. A feasibility assessment of the primary validity and reliability issues was made for inpatient opioid ordering among pediatric cancer patients across 55 U.S. health systems documented in Cerner RWD. The framework attempts to address a recognized gap in observational RWD research: despite extensive reporting guidance, model specification, bias assessment, and validation of inputs, outputs and results remain largely underreported and ad hoc. Further, when outcomes reflect nested features, clustering structure, variance partitioning, and scope governance, they require explicit prespecified hierarchical analytic decisions to support valid and reliable results.
Several findings from this application illustrate the framework’s value. First, systematic application of Specification Domains 1–4 identified that 1) 96.9% of opioid orders were captured by five primary drugs; 2) that as-needed orders accounted for 41.3% of valid orders and warranted separate treatment supported empirically by a 4.34-fold higher odds of discontinuation relative to non-PRN orders; and 3) that total daily dose could not be estimated with sufficient validity from Cerner RWD, underscoring how structured data analytics reveals metric unreliability before modeling proceeds. Second, Hierarchical Modeling Domains 5–7 demonstrated that 1) patient-level clustering in opioid orders during hospitalization (ICC=19.9%) substantially exceeded health system-level clustering (ICC=2.0%) in the fully adjusted model. Third, Robustness Domains 8–10 documented a temporal shift in health system clustering of as-needed ordering from 20.2% in 2014 to 10.0% in 2021, consistent with evolving EHR practices and opioid monitoring policies, and confirmed that morphine and fentanyl ordering trajectories diverged significantly beginning in 2017. This is a pattern that would have been obscured without drug-specific stratified analyses. Together these findings demonstrate that organizing the analytic workflow into prespecified, verifiable domain groups directly improves transparency and reproducibility in hierarchical RWD research.
Our curated AI-audited code refinement showed that verification via AI can benefit validity, reliability, robustness and sensitivity testing. We caught inadvertent inclusion of 308 records with missing sex which would have made invalid or prevented likelihood ratio tests across the prespecified model sequence.
Our study also illustrates the generic analytic utility of a structured framework. Our approach is not designed to showcase the limitations of a particular dataset but rather to provide general standards to support validity and reliability as well as mitigation strategies. We showed that sequential exposure definition, systematic bias assessment, and hierarchical modeling were each necessary preconditions for valid measurement, steps that would be difficult to govern consistently without a structured analytic framework. Importantly, a framework-guided feasibility assessment can delineate what RWD can and cannot reliably support before confirmatory analyses are undertaken, a function that becomes particularly valuable when working with multi-institutional data prone to documentation variability and metric unreliability.
Health System Effects- Health systems with stricter data entry practices or different patient populations could disproportionately influence the findings, leading to skewed results that do not accurately reflect broader trends. The ICCs in our study substantiate the need for statistical adjustments to control for these clustering effects to ensure that the conclusions drawn are robust and generalizable across different health systems. Adjustment for health system level variations in opioid prescribing practices proved relevant and agreed with the moderate hospital-level variation observed in opioid prescribing practices in pediatric patients newly diagnosed with acute myeloid leukemia reported by Getz KD and colleagues (2018) utilizing the PHIS data [38]. Their findings, along with those of Keano O and colleagues (2024) who also utilized PHIS [39], provide additional evidence of the importance of addressing health system variations when using RWD for related analyses [38,39]. If hierarchical levels are not properly accounted for, the analysis may incorrectly attribute observed effects to individual-level factors rather than to clustering or structural influences.
Hierarchical Modeling with Large Datasets- Population-averaged approaches, such as GEE, provide a robust method for examining system- and patient-level factors while adjusting for clustering effects. These methods are particularly useful when the primary goal is to estimate average effects across the population rather than to partition and explain variance within subpopulations or across hierarchical levels. GEE does not explicitly model random effects but instead accounts for correlation within clusters through working correlation structures. However, typically, model building using very large datasets requires considerable, even excessive computational time to test model effects for hierarchical datasets using the GLMM procedure without adequate model specification. Our framework specifically places the burden of managing unmeasured heterogeneity on model specification. We recommend built-in optimizers in statistical packages or iteratively refined manual fixed-effects modeling (e.g., selecting significant interactions) using GEE can provide an initial structure for clustering of data, before transitioning to the more computationally intensive GLMM. It is also important to note that specifying alternative covariance structures for repeat measures which reflect counterintuitive latent processes is an excellent robustness check among other advantageous it provides and the glmmTMB (template model builder) package in R can be utilized for this purpose.
5. Limitations
Several limitations in this study merit discussion. First, using the ‘drug’ variable to identify the active ingredient can underrepresented the actual number of orders for medications unless a lexicon is built to match generic and trade names. Our own exploration of this issue in a random sample of 10,000 pediatric patients suggested that this limitation is minimal, affecting fewer than 0.3% of all orders for these drugs. However, an exception was noted for hydromorphone, where 23% of orders were recorded under a different drug name, i.e., Dilaudid (see Supplemental Table 3). The ‘As-Needed’ orders were very common, approximately 41.3% of orders in the database, but direct comparison could not be made because ‘As Needed’ percentages were not reported in other studies [37,39]. We chose to exclude ‘As Needed’ once we noted that when an order was subsequently completed, it appeared to be listed as a separate data row without an ‘As Needed’ indication. This is an assumption which was somewhat confirmed through clinical targeted investigation of specific patients, further suggesting that no large database undertaking should be made without clinical guidance. Restricting the analytic dataset to the first 20 hospitalizations per patient deliberately truncated encounter histories for high utilization patients and affected the observed patterns of opioid ordering used in model development and auditing [40]. Using an estimation procedure that accounts for that truncation would be warranted. Future analyses should also assess how the encounter window changes model performance or what bias is introduced with truncated encounter series. The inability to capture more detailed geographic variations beyond the nine regions in the U.S. is a fairly serious limitation of our model using Cerner RWD. Considerable variation can emerge on a state by state basis owing to local payor structures. The absence of this information can easily prevent optimized management of geographic heterogeneity as well as examination of neighborhood-level characteristics, such as the Child Opportunity Index (COI) [41] in relation to outcomes. We attempted to utilize PHIS as an complementary database in the analysis, a critical but too infrequently used verification method. Important to note that a recent article by Davis et al. (2024) detailed a potential resolution to increase geographic capture in Cerner RWD by extension to the first three digits of the ZIP code using a Standardized Health Data and Research Exchange [42]. Contextual factors such as the time of day, staff availability, and the patient’s condition at the time of the encounter further influence these variations potentially leading to significant deviations in treatment approaches not captured in the database or our modeling. Importantly, the limitations described above were identified through the framework’s prespecified domains rather than post hoc, illustrating how structured analytic governance can surface data constraints before they affect inference. We have acknowledged that we limited our audit process using AI to a single LLM, and the prompts developed are specific to that platform; however, future research should evaluate the generalizability of this approach across alternative LLMs. Platforms such as CODEX and other advanced coding, data-processing, extraction, and interoperability tools are not currently implemented within our healthcare system, but they are coming. It is more important than ever to adopt structured verification frameworks to complement these automations.
6. Conclusions
This study demonstrated that a structured framework for validation and an audit process for verification can clearly identify platform-specific constraints. In our illustration, we found and documented the infeasibility of reliable daily dose and MME estimation from order-level data alone. The ten-domain framework proposed here provides a structured, reproducible mechanism for making these decisions transparently. We also demonstrated the value of curated AI to audit validation. Beyond this application, the framework and audit process is designed to be automated strengthening investigator-led, observational research we need to meet regulatory, scientific, and clinical evidence standards. Besides automating and validating the framework, we believe that current publication guidelines could also be revised to require framework-driven, audited validation confirming standards have been implemented prior to publication.
Ethical considerations
Study procedures were approved by the CHOC’s Institutional Review Board (protocol code: IRB #1761350-1 and date of approval: July 14, 2021).
Consent for publication
Not applicable.
Declaration of conflicting interest
The authors declared no potential conflicts of interest with respect to the research, authorship, and/or publication of this article.
Funding statement
CSO Small Grants Program, CHOC Children’s Research Institute.
Data availability
The data used in this study were obtained from Cerner Corporation (North Kansas City, Missouri) through a data licensing agreement with the Real World Data Institute and are not publicly available. Researchers interested in accessing these data should contact Cerner Corporation directly regarding licensing and availability.
Supplementary Materials
The following supporting information can be downloaded at the website of this paper posted on Preprints.org.
References
- Akehurst, R., Murphy, L. A., Solà-Morales, O., Cunningham, D., Mestre-Ferrandiz, J., & de Pouvourville, G. (2023). Using real-world data in the health technology assessment of pharmaceuticals: strengths, difficulties, and a pragmatic way forward. Value in Health, 26(4), 11-19.
- Winterstein AG, Ehrenstein V, Brown JS, Stürmer T, Smith MY. A road map for peer review of real-world evidence studies on safety and effectiveness of treatments. Diabetes Care. 2023;46(8):1448-1454.
- Wu DTY, Meganathan K, Newcomb M, Ni Y, Dexheimer JW, Kirkendall ES, et al. A comparison of existing methods to detect weight data errors in a pediatric academic medical center. AMIA Annu Symp Proc. 2018;2018:1103-1109.
- L’Yi S, Zhang HG, Mar AP, Smits TC, Weru L, Rojas S, et al. A comprehensive evaluation of life sciences data resources reveals significant accessibility barriers. Sci Rep. 2025;15(1):23676. [CrossRef]
- Rashidi E, Brooks M, Hassoon A, Mehta S, Althoff K, Alexander GC. Is artificial intelligence a friend or foe to epidemiology? Ann Epidemiol. 2026.
- Liu J, Liu F, Wang C, Liu S. Prompt engineering in clinical practice: tutorial for clinicians. J Med Internet Res. 2025;27:e72644.
- Soroush A, Glicksberg BS, Zimlichman E, Barash Y, Freeman R, Charney AW, et al. Large language models are poor medical coders: benchmarking of medical code querying. NEJM AI. 2024;1(5):AIdbp2300040.
- Wang L, Chen X, Deng X, Wen H, You M, Liu W, et al. Prompt engineering in consistency and reliability with the evidence-based guideline for LLMs. NPJ Digit Med. 2024;7(1):41.
- U.S. Food and Drug Administration. Real-world data: assessing electronic health records and medical claims data to support regulatory decision-making for drug and biological products: guidance for industry. Silver Spring: U.S. Department of Health and Human Services, Center for Drug Evaluation and Research, Center for Biologics Evaluation and Research, Oncology Center of Excellence; 2024. https://www.fda.gov/media/152503/download.
- Von Elm E, Altman DG, Egger M, Pocock SJ, Gøtzsche PC, Vandenbroucke JP. The Strengthening the Reporting of Observational Studies in Epidemiology statement: guidelines for reporting observational studies. Lancet. 2007;370(9596):1453-1457.
- Vandenbroucke JP, von Elm E, Altman DG, Gøtzsche PC, Mulrow CD, Pocock SJ, et al. Strengthening the Reporting of Observational Studies in Epidemiology: explanation and elaboration. Ann Intern Med. 2007;147(8):W163-W194.
- Benchimol EI, Smeeth L, Guttmann A, Harron K, Moher D, Petersen I, et al. The REporting of studies Conducted using Observational Routinely-collected health Data statement. PLoS Med. 2015;12(10):e1001885.
- Jaksa A, Wu J, Jónsson P, Eichler HG, Vititoe S, Gatto NM. Organized structure of real-world evidence best practices: moving from fragmented recommendations to comprehensive guidance. J Comp Eff Res. 2021;10(9):711-731.
- Langan SM, Schmidt SA, Wing K, Ehrenstein V, Nicholls SG, Filion KB, et al. The Reporting of studies Conducted using Observational Routinely collected health Data statement for pharmacoepidemiology. BMJ. 2018;363:k3532.
- Valla V, Tzelepi K, Charitou P, Lewis A, Polatidis B, Koukoura A, et al. Use of real-world evidence for international regulatory decision making in medical devices. Int J Digit Health. 2023;3(1):1.
- UK EQUATOR Centre. The EQUATOR Network website and database. https://www.equator-network.org/reporting-guidelines/. Accessed 20 Jun 2024.
- Pratt NL, Mack CD, Meyer AM, Davis KJ, Hammill BG, Hampp C, et al. Data linkage in pharmacoepidemiology: a call for rigorous evaluation and reporting. Pharmacoepidemiol Drug Saf. 2020;29(1):9-17.
- National Institute for Health and Care Excellence. NICE real-world evidence framework. Corporate document ECD9. Published 23 Jun 2022. https://www.nice.org.uk/corporate/ecd9/chapter/overview. Accessed 13 May 2026.
- Zozus MN, Choi BY, Garza MY, Facile R, Lanham HJ, Wang Z, et al. Collaborative program to evaluate real world data for use in clinical studies and regulatory decision making. AMIA Summits Transl Sci Proc. 2023;2023:632.
- Sayrs L, Stottlemyre R. A socio-technical framework for pediatric digital health twins, complementary and prescriptive validity. Poster presented at: 3rd Annual Pediatric & the Lifespan in Data Science Conference; 2026 Apr 29-30; Irvine, CA.
- Beam AL, Manrai AK, Ghassemi M. Challenges to the reproducibility of machine learning models in health care. JAMA. 2020;323(4):305-306. [CrossRef]
- Rao AS, Esmail KP, Lee RS, Jiang S, Arraiza Carlo B, Gill J, et al. Large language model performance and clinical reasoning tasks. JAMA Netw Open. 2026;9(4):e264003.
- Gao Y, Xiong Y, Gao X, Jia K, Pan J, Bi Y, et al. Retrieval-augmented generation for large language models: a survey. arXiv. 2023. arXiv:2312.10997.
- Pierce RP, Eskridge B, Ross B, Wright M, Selva T. Impact of a vendor-developed opioid clinical decision support intervention on adherence to prescribing guidelines, opioid prescribing, and rates of opioid-related encounters. Appl Clin Inform. 2022;13(2):419-430.
- Bohnert AS, Valenstein M, Bair MJ, Ganoczy D, McCarthy JF, Ilgen MA, et al. Association between opioid prescribing patterns and opioid overdose-related deaths. JAMA. 2011;305(13):1315-1321.
- Fortier MA, Yang S, Phan MT, Tomaszewski DM, Jenkins BN, Kain ZN. Children’s cancer pain in a world of the opioid epidemic: challenges and opportunities. Pediatr Blood Cancer. 2020;67(4):e28124.
- Kumar KH, Rubinacci S, Zöllner S. MetaGLIMPSE: meta-imputation of low-coverage sequencing data for modern and ancient genomes. Am J Hum Genet. 2026;113(3):472-482.
- Paice JA, Bohlke K, Barton D, Craig DS, El-Jawahri A, Hershman DL, et al. Use of opioids for adults with pain from cancer or cancer treatment: ASCO guideline. J Clin Oncol. 2023;41(4):914-930.
- Olsen Y, Sharfstein JM. The opioid epidemic: what everyone needs to know. Oxford: Oxford University Press; 2021. Appendix 4.
- Modern Recovery Network. Opioid prescription addiction: generic opioid prescriptions. https://www.modernrecoverynetwork.com/opioid-prescription-addiction-generic-opioid-prescriptions/. Accessed 4 Apr 2024.
- U.S. Food and Drug Administration. Drugs@FDA database. https://www.fda.gov/drugs/development-approval-process-drugs/drug-approvals-and-databases. Accessed 3 Apr 2024.
- Bolker B, et al. GLMM FAQ. Published 19 Jul 2025. https://bbolker.github.io/mixedmodels-misc/glmmFAQ.html. Accessed May 1, 2026.
- Bates D, Kliegl R, Vasishth S, Baayen H. Parsimonious mixed models. arXiv. 2015. arXiv:1506.04967.
- Beauchemin M, Dorritie R, Hershman DL. Opioid use and misuse in children, adolescents, and young adults with cancer: a systematic review of the literature. Support Care Cancer. 2021;29(8):4521-4527.
- Smitherman AB, Mohabir D, Wilkins TM, Blatt J, Nichols HB, Dusetzina SB. Early post-therapy prescription drug usage among childhood and adolescent cancer survivors. J Pediatr. 2018;195:161-168.
- Betts AC, Murphy CC, Shay LA, Balasubramanian BA, Markham C, Allicock M. Polypharmacy and prescription medication use in a population-based sample of adolescent and young adult cancer survivors. J Cancer Surviv. 2023;17(4):1149-1160.
- Ehwerhemuepha L, Donaldson CD, Kain ZN, Luong V, Fortier MA, Feaster W, et al. Race, ethnicity, and insurance: the association with opioid use in a pediatric hospital setting. J Racial Ethn Health Disparities. 2021;8:1232-1241.
- Getz KD, Miller TP, Seif AE, Li Y, Huang YS, Fisher BT, et al. Opioid utilization among pediatric patients treated for newly diagnosed acute myeloid leukemia. PLoS One. 2018;13(2):e0192529.
- Keane OA, Ourshalimian S, Lakshmanan A, Lee HC, Hintz SR, Nguyen N, et al. Institutional and regional variation in opioid prescribing for hospitalized infants in the US. JAMA Netw Open. 2024;7(3):e240555.
- Brooks JM. Improving characterization of study populations: the identification problem. In: Velentgas P, Dreyer NA, Nourjah P, et al., editors. Developing a protocol for observational comparative effectiveness research: a user’s guide. Rockville: Agency for Healthcare Research and Quality; 2013. Supplement 1. https://www.ncbi.nlm.nih.gov/books/NBK126181/.
- Noelke C, McArdle N, DeVoe B, Leonardos M, Lu Y, Ressler RW, et al. Child Opportunity Index 3.0. 2024. https://www.diversitydatakids.org/sites/default/files/file/COI30_TechDoc_20240313.pdf. Accessed 25 Jul 2024.
- Davis S, Ehwerhemuepha L, Feaster W, Hackman J, Morizono H, Kanakasabai S, et al. Standardized Health data and Research Exchange: promoting a learning health system. JAMIA Open. 2022;5(1):ooab120.
Figure 1.
Analytic framework for AI-assisted first iteration code generation in hierarchical RWD analyses (10-domains). Domains are iterative, not strictly sequential.
Figure 1.
Analytic framework for AI-assisted first iteration code generation in hierarchical RWD analyses (10-domains). Domains are iterative, not strictly sequential.
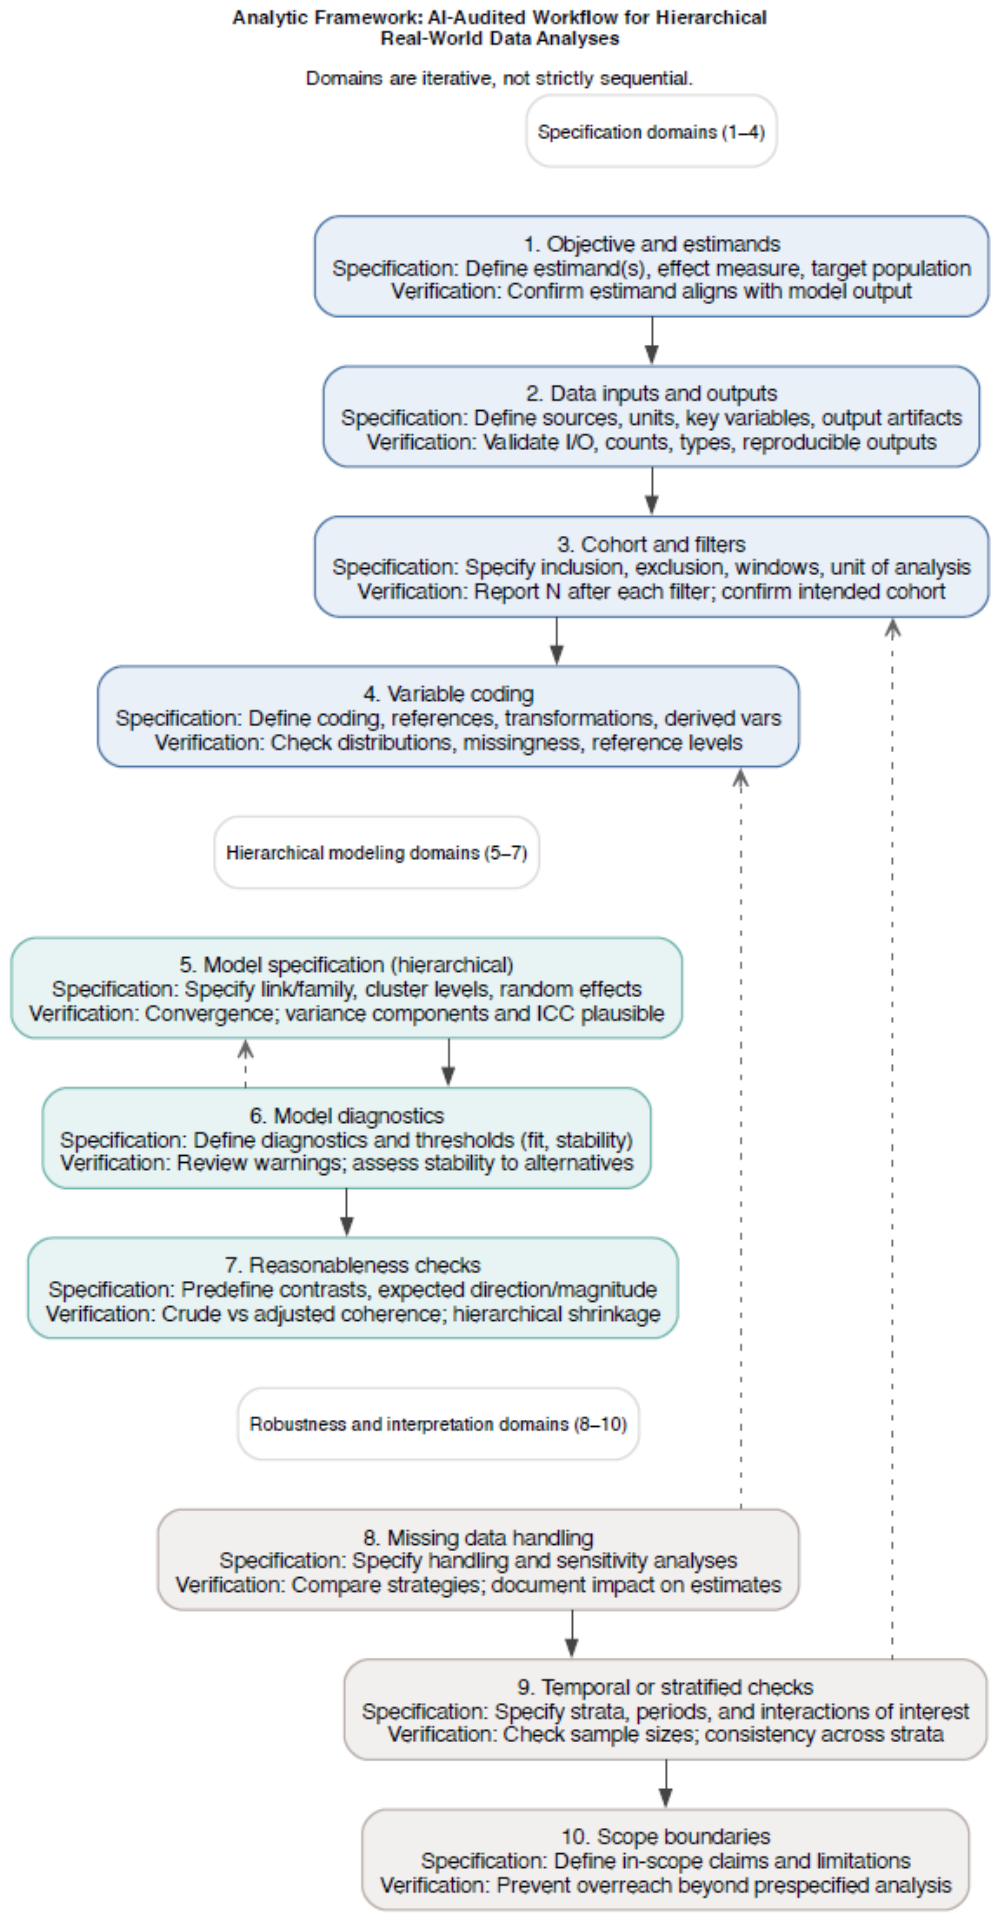
Figure 2.
Flow diagram displaying selection of encounters, patients, and health care systems for analyses.
Figure 2.
Flow diagram displaying selection of encounters, patients, and health care systems for analyses.
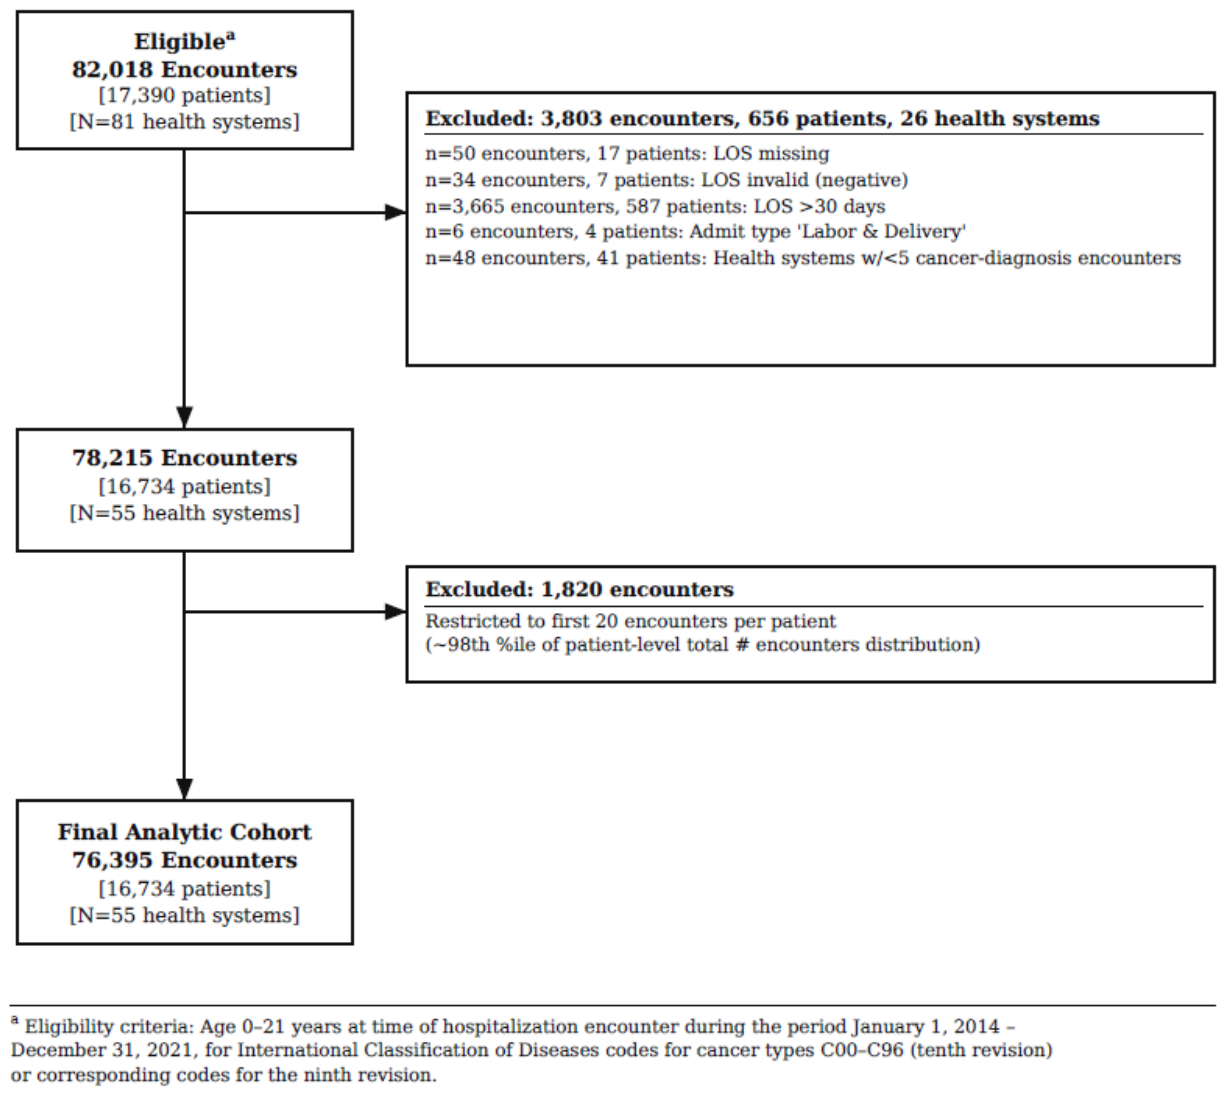
Figure 3.
Systematic identification and address of potential biases in defining and examining opioid exposure using Cerner RWD. Arrows denote the sequential workflow from bias identification through assessment to mitigation.
Figure 3.
Systematic identification and address of potential biases in defining and examining opioid exposure using Cerner RWD. Arrows denote the sequential workflow from bias identification through assessment to mitigation.
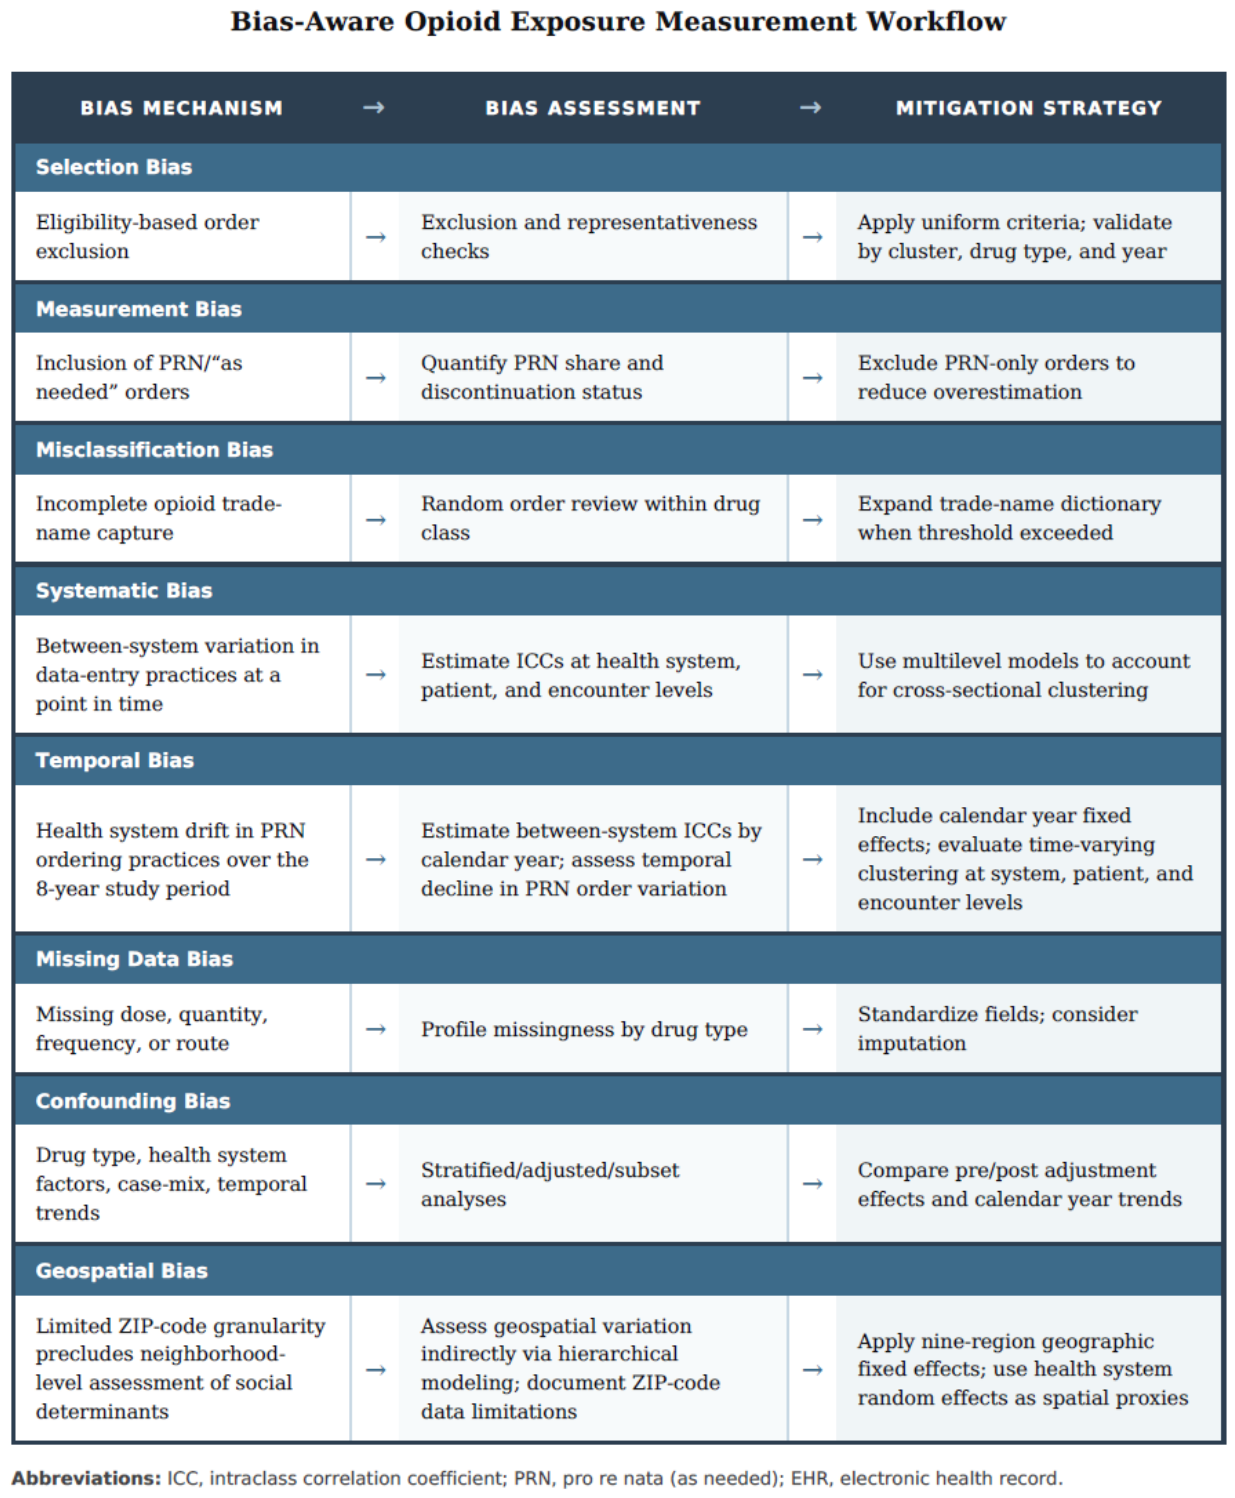
Figure 4.
a. Descriptive comparison of opioid order characteristics by as-needed (PRN) status (included vs excluded orders) overall and by drug type. b. Hierarchical variance decomposition for PRN status (excluded vs non-PRN) using multilevel logistic models: variance components and ICCs by level and year. Note. Variance components (σ²) and intraclass correlation coefficients (ICC) were estimated from multilevel logistic models with random intercepts for health system, patient nested within health system, and encounter nested within patient. ICC represents the proportion of total variance attributable to each grouping level, with the logistic residual variance treated as fixed at π²/3 (=3.29). Models included a fixed effect for opioid drug type; year-stratified models were fit to evaluate temporal patterns in ICC estimates. One health system with only two opioid orders (no outcome variation) was excluded from model-based estimation.
Figure 4.
a. Descriptive comparison of opioid order characteristics by as-needed (PRN) status (included vs excluded orders) overall and by drug type. b. Hierarchical variance decomposition for PRN status (excluded vs non-PRN) using multilevel logistic models: variance components and ICCs by level and year. Note. Variance components (σ²) and intraclass correlation coefficients (ICC) were estimated from multilevel logistic models with random intercepts for health system, patient nested within health system, and encounter nested within patient. ICC represents the proportion of total variance attributable to each grouping level, with the logistic residual variance treated as fixed at π²/3 (=3.29). Models included a fixed effect for opioid drug type; year-stratified models were fit to evaluate temporal patterns in ICC estimates. One health system with only two opioid orders (no outcome variation) was excluded from model-based estimation.
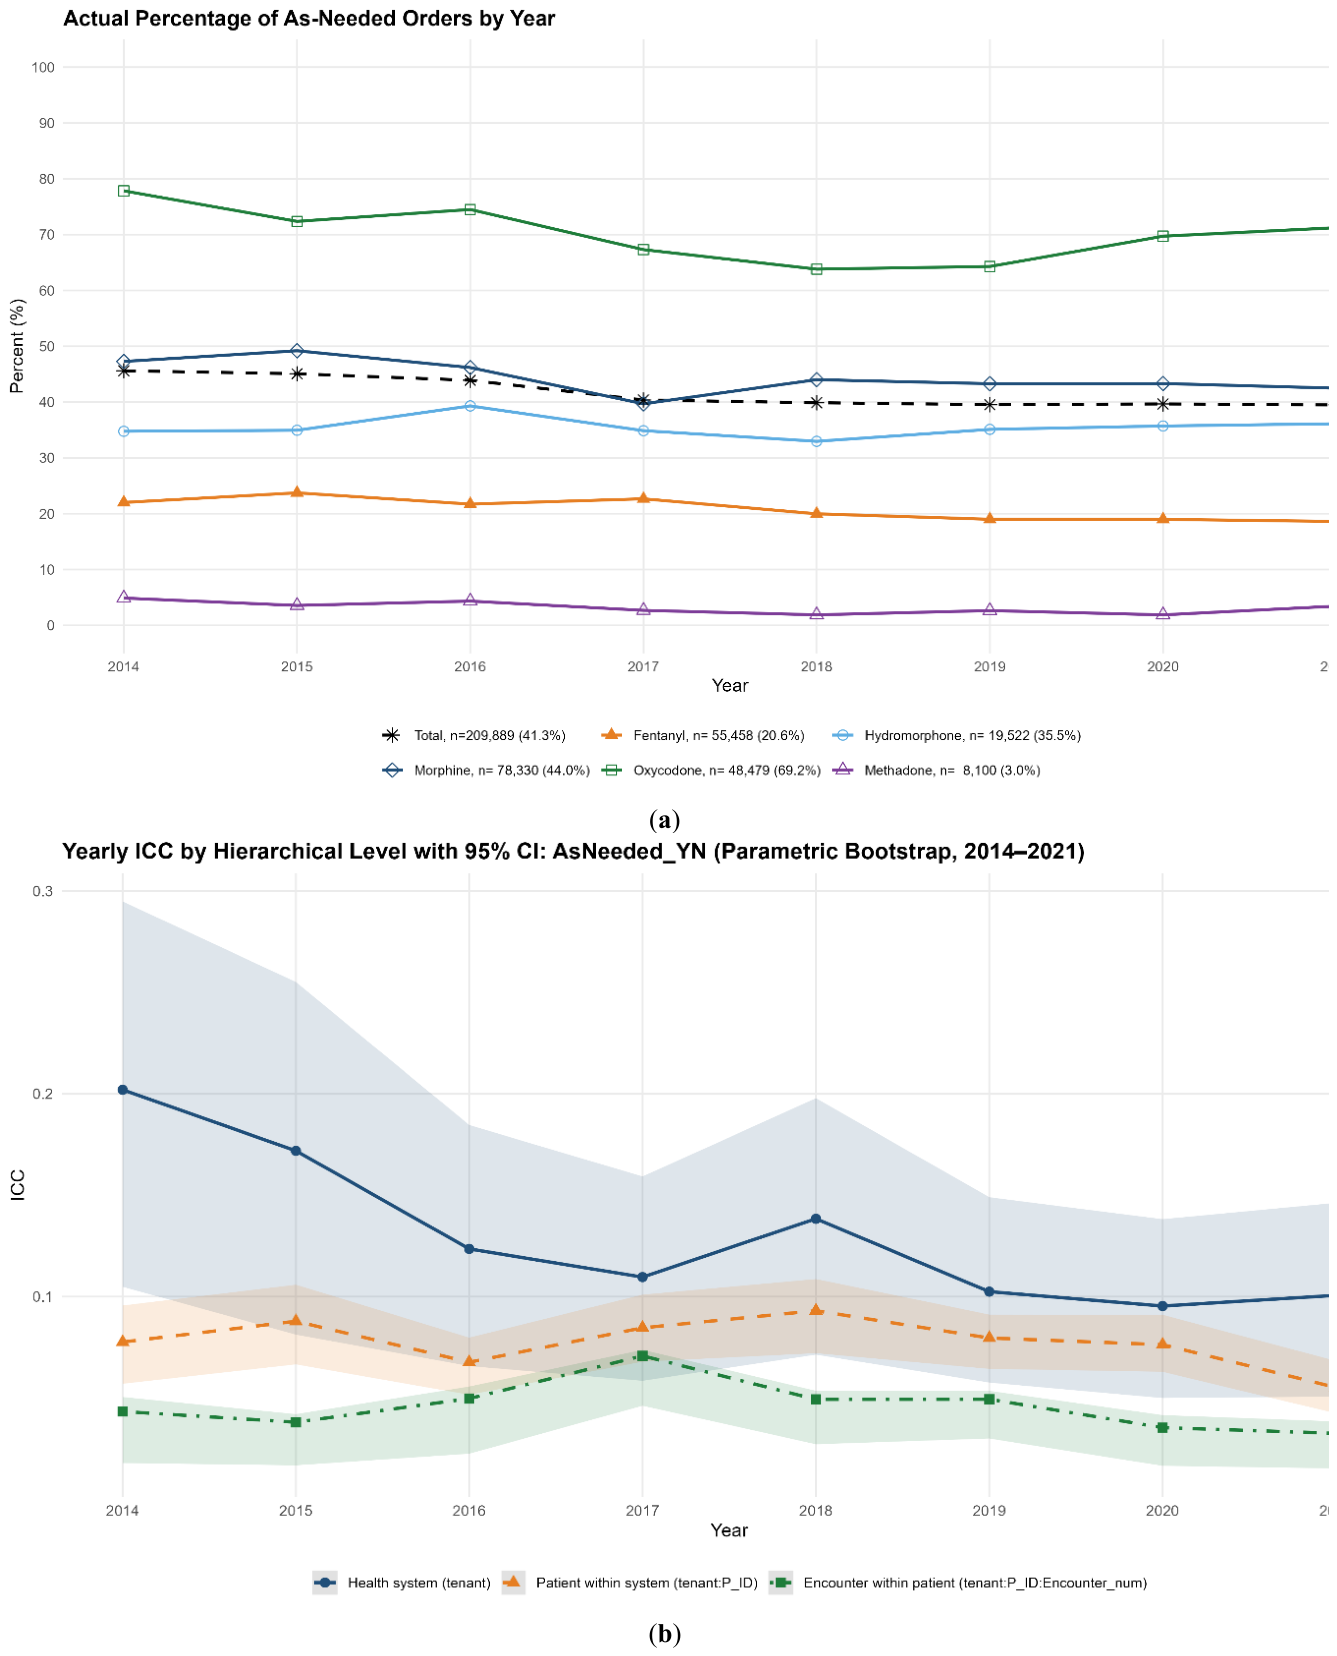
Table 1.
Analytic Inputs, Operational Definitions, and Planned Use.
| Domain | Variable | Operational definition or parameterization | Analytic use |
| Patient characteristics | Age | Categorized as 0–1, 2–12, 13–17, and 18–21 years. | Candidate predictor |
| Sex | Male or female. | Candidate predictor | |
| Insurance type | Public, private, or other. | Candidate predictor | |
| Race and ethnicity | American Indian/Alaska Native, Asian/Asian American, Black/African American, Hispanic/Latino, White, mixed race, other, or unknown/preferred not to state. | Candidate predictor | |
| Clinical characteristics | Cancer diagnosis | First recorded cancer diagnosis classified into eight clinically derived categories using ICD-10 codes C00–C96 or comparable ICD-9 codes. | Case-mix adjustment |
| Admission type | Elective, emergency, routine, urgent, or other/unknown. | Candidate predictor | |
| Maximum inpatient pain score | Maximum daily recorded numeric score from 0–10; the assessment instrument could vary across institutions and clinical settings. | Measurement heterogeneity across sites and approximately 25% missingness | |
| Health-system characteristics | Health-system volume | Low, moderate, or high, as defined in the preceding section. | System-level predictor |
| Geographic region | Nine U.S. geographic regions. | System-level predictor | |
| Admission year | 2014–2021; treated categorically or used in stratified analyses. | Temporal adjustment or stratification | |
| Opioid-order characteristics | Opioid exposure | Any inpatient opioid order versus none; coded 1 = exposed and 0 = unexposed. | Primary outcome |
| Data-processing specifications | Eligibility and filtering | Prespecified inclusion, exclusion, and analytic-population criteria applied before descriptive analyses and modeling. | Cohort construction |
| Missingness and distribution checks | Missingness, sparse cells, ranges, skewness, outliers, and possible data-entry concerns evaluated before modeling. | Data-quality assessment | |
| Continuous-variable assessment | Histograms, boxplots, and, when appropriate, predictor–outcome plots; linearity assessed for continuous specifications. | Functional-form assessment | |
| Output conventions | Prespecified output directory, consistent file prefix, and traceable names for checks, tables, figures, models, and fit statistics. | Reproducibility and audit trail |
Abbreviations: ICD-10, International Classification of Diseases, Ninth Revision; ICD-10, International Classification of Diseases, Tenth Revision.
Table 2.
Structured prompt framework for AI-assisted first-iteration code generation in hierarchical real-world data analyses applied to exemplar (opioid order during hospital encounter, Y/N).
Table 2.
Structured prompt framework for AI-assisted first-iteration code generation in hierarchical real-world data analyses applied to exemplar (opioid order during hospital encounter, Y/N).
| # | Domain | Prompt Template Element | Required Specification | Verification Before Interpretation |
| Specification Domains (1–4) | ||||
| 1 | Objective and estimands | “Write [language] script to estimate [outcome] with [effect estimands] and [variance estimands].” | Co-primary estimands specified a priori: (1) aORs for encounter-level outcome across prespecified covariates; (2) cluster-level variance components and ICCs for each level of the prespecified hierarchy (e.g., health system, patient, encounter). | Output includes aORs with 95% CIs and p-values, model fit statistics (AIC), variance components, and ICCs for each prespecified model (M1–M4). |
| 2 | Data inputs and outputs | “Read [input path], write outputs to [directory/prefix], export [tables/figures].” | Exact local data import path; output destination directory; file prefix (e.g., R_Output_); traceable export naming conventions; required output formats (tables, figures). | All prespecified output files generated with filenames traceable to the analysis run; I/O counts and variable types validated against the data dictionary. |
| 3 | Cohort and filters | “Apply [inclusion/exclusion criteria] in this order and print N after each step.” | Ordered inclusion/exclusion criteria; unit of analysis (e.g., encounter-level); prespecified truncation rules (e.g., >20 encounters per cluster) and minimum system-level count rules; expected sample-size counts (N) for validation. | Analytic N reconciles with cohort flow at each sequential filter step; printed N at each step confirms intended cohort before modeling. |
| 4 | Variable coding | “Use exact variable names/types; set [reference levels]; run distributional checks across covariates and outcome.” | Case-sensitive variable names; data types (continuous vs. factor); binary coding rules; factor reference categories; derived variable definitions; outcome specification (Y/N binary). | Levels, references, and recode checks match the data dictionary and specification sheet; distributional checks completed; outliers identified before modeling. |
| Hierarchical Modeling Domains (5–7) | ||||
| 5 | Model specification | “Fit prespecified model sequence M1–M4 with [hierarchy / covariance structure / covariates].” | Logistic GLMMs with nested hierarchy; four prespecified models: M1: random effects only (health system, patient, encounter); M2: M1 + system-level factors; M3: M2 + patient case-mix; M4: M3 + calendar year (fully adjusted). |
Formulas and covariate blocks match prespecified analysis plan; LR tests comparing M2–M4 to M1 use a common complete-case sample across all models.a |
| 6 | Model diagnostics | “Return convergence, singularity, fit statistics, ICCs, and residual/influence diagnostics.” | Convergence and singularity checks; AIC extraction and model comparison; variance component and ICC extraction per cluster level; prespecified residual and influence diagnostics; stability thresholds defined a priori. | All diagnostic flags reviewed and resolved (or documented with rationale) before final reporting; model stability assessed relative to plausible alternatives. |
| 7 | Reasonableness checks | “Provide crude and adjusted summaries for key contrasts; report cluster-level summaries by calendar year.” | Prespecified descriptive checks (cross-tabulations, crude rates, crude effect estimates) for key exposure–outcome pairs; expected direction and approximate magnitude specified a priori; cluster-year summaries for temporal patterns. | Crude and adjusted patterns directionally coherent; discordance between crude and adjusted estimates triggers code or filter review before proceeding to interpretation. |
| Robustness and Interpretation Domains (8–10) | ||||
| 8 | Missing data handling | “Implement [variable-specific missing-data rules]; flag records excluded from LR tests due to missingness; run [sensitivity analyses] if prespecified.” | Variable-specific strategy defined a priori (e.g., “unknown” insurance coded as analytic category; sex missing → complete-case for all models to enable valid nested LR tests). Sensitivity analyses run when prespecified; missingness threshold for imputation defined a priori (e.g., >5%). | Missing-data rules applied consistently; complete-case sample used uniformly across M1–M4 to support valid LR test comparisons; proportion missing documented; imputation performed only if prespecified threshold exceeded; deviations from plan recorded with rationale. |
| 9 | Temporal and stratified checks | “Run fully adjusted model (M4) stratified by [strata variable]; export [plots/tables]; remove near-zero variance components for parsimony.” | Fully adjusted model estimated overall and stratified by drug type across calendar years for bias-assessment and visualization; random-effect simplification rule prespecified (remove encounter-level random intercept if variance component ≈ 0) to reduce model complexity without important information loss. | Stratified outputs complete and internally consistent across tables and figures; sample sizes adequate within strata; variance component removal documented with observed estimate, singularity/convergence assessment, and parsimony rationale (encounter-level random intercept near-zero boundary; two-level model retained). |
| 10 | Scope boundaries | “Implement prespecified analyses only; flag any scope expansion before execution.” | Workflow implements the prespecified analytic plan as an exemplar of AI-assisted code generation; unsanctioned model expansion explicitly prohibited. All data processing, model fitting, and interpretation performed by investigators in a secure local environment. | Outputs match prespecified scope; no unsanctioned model expansion occurred; any deviations from the prespecified plan documented with rationale. PHI and clinical data not shared with AI system; code generation only. |
aOR, adjusted odds ratio; AIC, Akaike information criterion; GLMM, generalized linear mixed model; ICC, intraclass correlation coefficient; LR, likelihood ratio; RWD, real-world data. a Guardrail prompt: “Use the same estimation method and complete-case dataset across all compared models; flag any non-nested or otherwise non-comparable model comparisons before reporting LR test results.” Domains are iterative, not strictly sequential; return to earlier domains when execution errors, diagnostic failures, or reasonableness concerns are identified. LLMs were used for code drafting and refinement only; all model execution, diagnostics, and interpretation were analyst-led in a secure local environment without sharing clinical data.
Disclaimer/Publisher’s Note: The statements, opinions and data contained in all publications are solely those of the individual author(s) and contributor(s) and not of MDPI and/or the editor(s). MDPI and/or the editor(s) disclaim responsibility for any injury to people or property resulting from any ideas, methods, instructions or products referred to in the content. |
© 2026 by the authors. Licensee MDPI, Basel, Switzerland. This article is an open access article distributed under the terms and conditions of the Creative Commons Attribution (CC BY) license (http://creativecommons.org/licenses/by/4.0/).
Copyright: This open access article is published under a Creative Commons CC BY 4.0 license, which permit the free download, distribution, and reuse, provided that the author and preprint are cited in any reuse.