Preprint
Article

This version is not peer-reviewed.

Vaccine Adjuvants Recapitulate the Early Innate Response to Live Vaccination: Implications for Therapeutic Cancer Vaccine Design

A peer-reviewed version of this preprint was published in:
Vaccines 2026, 14(9), 792. https://doi.org/10.3390/vaccines14090792

Submitted:

17 August 2026

Posted:

18 August 2026

You are already at the latest version

Abstract

Background/Objectives: Therapeutic cancer vaccines can generate measurable immunity without tumor regression. Adjuvants initiate innate activation, but antitumor efficacy also requires antigen presentation, lymphoid priming, effector differentiation, tumor trafficking, cancer-cell recognition and killing, and persistence. We compared the magnitude, duration, and downstream breadth of clinically used adjuvant responses with live vaccination. Methods: We reanalyzed transcriptomic data from six randomized human vaccine studies and one controlled mouse experiment; one human study sequenced six sorted leukocyte populations. Twenty-three prespecified gene sets spanning innate ignition, antigen presentation, adaptive differentiation, trafficking, and effector programs were scored by participant-paired, baseline-adjusted comparisons with matched controls. One trial sampled placebo, adjuvanted, unadjuvanted, and live attenuated vaccines daily. Results: AS01B, AS01E, AS03, and MF59 increased type I interferon by 9.6, 8.6, 7.5, and 3.2 percentile points at 24 hours; AS04 and aluminum salt remained at control levels. Yellow fever 17D sustained interferon through day 7; MF59 resolved by day 3 and AS01/AS03 by day 7. Antigen-presenting-cell activation and MHC class I machinery rose with interferon. Apart from a small day-7 germinal-center/plasmablast signal in two AS03 trials, no reproducible sustained downstream program was detected in blood; acute cytotoxic and natural-killer-cell decreases mainly reflected blood-cell composition. Conclusions: Adjuvants produce robust ignition, but these blood datasets do not establish the later cellular functions required for tumor-cell killing. Duration is one candidate determinant of this transition. Cancer-vaccine trials should measure ignition together with compartment-appropriate priming, trafficking, cytotoxic function, and persistence across repeated doses.
Keywords: 
;  ;  ;  ;  ;  ;  ;  ;  ;  

1. Introduction

Therapeutic cancer vaccination requires a linked sequence beyond recognition of the vaccine antigen: antigen acquisition and presentation, dendritic cell licensing, lymphoid priming, clonal expansion and differentiation, trafficking to tumor, cytotoxic activity within a suppressive tissue, and persistence. Interruption at a later step can uncouple an early immune signal from tumor control. This distinction is central to the cancer-immunity cycle and to modern therapeutic vaccine design [1,2,3].
Cancer vaccine trials nevertheless often rely on peripheral antigen-specific assays, especially interferon gamma enzyme-linked immunospot (ELISpot), tetramer binding, or cytokine release, as practical indicators of immunogenicity. ELISpot is sensitive and useful, and standardization has materially improved its reproducibility [4]. It enumerates cells capable of secreting a selected cytokine under the assay conditions; complementary assays are required to assess cross-presentation in vivo, polyfunctional differentiation, tumor homing, resistance to exhaustion, recognition of naturally processed tumor antigen, and cancer-cell killing. The mismatch between immune surrogate endpoints and objective tumor regression was made plain in an analysis of 440 cancer vaccine recipients, in whom the objective response rate was 2.6 percent despite encouraging immunological endpoints [5]. The field has advanced substantially since, particularly through neoantigens and checkpoint blockade, while the endpoint problem remains.
Adjuvants are intended to support the earliest steps of this sequence, and the mechanisms by which licensed formulations act have been reviewed in detail [6]. For therapeutic cancer vaccination, however, the size of the early inflammatory signal is only one dimension of response quality. A formulation can generate type I interferon and antigen-presenting-cell activation yet fail to support durable cross-priming, effector differentiation, tumor trafficking, recognition of naturally processed antigen, or killing within a suppressive tumor [2,3]. The relevant comparison is therefore not only which adjuvant produces the largest peak, but whether the response is sufficiently sustained and biologically broad to enable the later stages.
Existing public data can address these questions when comparisons are constructed consistently and the response is examined across early and late biological programs. Much of the published adjuvant transcriptomic literature reports change within a single arm from a participant's own pre-vaccination baseline [7,8]. This design captures the response after vaccination. A matched control arm and a baseline-adjusted between-arm comparison additionally attribute that response to the adjuvant by accounting for antigen, injection, and elapsed time. This distinction is necessary before an early signal is used to select an adjuvant for a therapeutic cancer vaccine.
One particular dataset allows a further comparison that has not previously been exploited. The Biomarkers for Enhanced Vaccine Safety (BIOVACSAFE) studies [9] sampled participants daily after vaccination and included, under a shared protocol family and a common placebo arm, an adjuvanted inactivated vaccine, its antigen-matched unadjuvanted comparator, an aluminum-adjuvanted vaccine, and two live attenuated vaccines. One of the latter is yellow fever 17D, a single dose of which elicits neutralizing antibody detectable three decades later [10] and an integrated innate and adaptive response that has become a reference example in systems vaccinology [11,12]. Although it is not a cancer vaccine, yellow fever provides an internal positive benchmark for progression beyond innate ignition, measured on the same platform, in the same trial, and against the same reference.
We therefore asked four linked questions. Do clinically used adjuvants differ in the magnitude and breadth of innate ignition when antigen is held constant? How does the duration of that response compare with a live attenuated vaccine measured in the same trial? Which antigen-presentation and later immune programs are detected across 23 prespecified gene sets spanning the response needed for cancer-cell killing? And which stages remain absent from blood, limited by compartment, or unmeasured and therefore require different assays in therapeutic cancer-vaccine trials?

2. Materials and Methods

2.1. Study Selection

We sought public transcriptomic datasets in which an adjuvant effect could be estimated against a matched control arm sampled at the same times, with metadata sufficient to assign every array unambiguously to a participant, an arm and a time point. Seven datasets met these conditions (Table 1). Studies were analyzed separately and never pooled with one another.

2.2. Datasets

The publications associated with the included datasets are reference [7] for GSE116975, [13] for PMID 28099485, [14] for GSE112293, [15] for GSE102012, [9] for GSE124533, [8] for GSE74975 and [16] for GSE85339. The link between GSE112293 and reference [14] is established through the citation recorded in the GEO record; that publication deposits its own derived data separately and does not cite the accession, so the attribution is one-directional. The analysis here used the GEO series matrix in every case. All human studies used intramuscular deltoid administration. The mouse experiment used subcutaneous injection at the tail base and is therefore reported separately as a descriptive compartment observation, not pooled with or used to corroborate the human findings.

2.3. Gene Sets and Scoring

Twenty-three immune gene sets were defined before analysis to interrogate the linked functions connecting vaccine sensing to antitumor immunity: innate sensing and inflammatory ignition; dendritic-cell activation and MHC class I antigen processing and presentation; Th1/interleukin-12, cytotoxic T-cell, natural-killer/interleukin-15, and naive/memory programs; trafficking and adhesion; and germinal-center/plasmablast responses. Lineage sets for major circulating leukocyte populations were included to distinguish transcriptional regulation from shifts in blood-cell composition. The gene sets provide a biological map of the sampled response; they do not by themselves prove that a later immune function occurred in lymphoid tissue or tumor.
Membership, gene counts, and provenance are reported in Table S2. The scoring follows the established practice of summarizing blood transcriptional modules as a single per-sample value [17,18]. Within each sample, all probes were converted to percentile ranks with average ranks for ties. Probes were mapped to gene symbols using the official platform annotation for each accession, and where several probes mapped to one gene their ranks were averaged. A gene set score is the mean percentile rank of its observed member genes, requiring at least three mapped genes and 40 percent coverage. Coverage was 0.77 to 1.00 in all human datasets. Mouse orthologs were mapped using the project ortholog table.

2.4. Contrasts and Statistics

For each participant, gene set and post-dose time point, we computed the change from that participant's own sample immediately before the relevant dose. The adjuvant effect is the between-arm difference in that paired change, tested by Welch's t test on participant-level changes. The control arm is the antigen-matched unadjuvanted arm where the study provided one, and the placebo arm otherwise; Table S5 names the reference arm and its size for every row. In the BIOVACSAFE program (GSE124533) the placebo recipients of protocols CRC305A, CRC305B and CRC305C were pooled into a single 20-participant reference arm, because the three protocols share a design and a placebo definition and each contributes only four to eight placebo recipients on its own; MF59 (Fluad) was instead compared against antigen-matched Agrippal. Where two pre-dose samples were available, the one taken on the day of dosing was used. Mouse animals were sampled terminally, so groups were compared unpaired at each tissue and time point without baseline adjustment; this design difference is stated wherever those results appear.
Benjamini-Hochberg control at 0.05 [19] was applied within each immunogen-versus-control family, treating each such comparison as one scientific question. A family is one vaccine or adjuvant arm compared against its matched control arm within one study, taken across all 23 gene sets and all sampling windows of that comparison. The seven studies yield 17 families, and Table S5 names the family and its size for every row. Where a study sampled the same two arms in more than one compartment, or in more than one staggered cohort, those strata belong to the same family because they address the same question. This rule was applied to all seven studies without exception, including the sorted-leukocyte study, in which the six sorted populations form one family. Under this primary framework 234 of 3,633 evaluable comparisons are significant. The alternative of pooling every comparison within a study into one family gives 210, disagreeing on 28 rows; both columns are reported in Table S5 so that any row can be read under either rule.
To separate transcriptional change from change in sample composition, associations were recomputed as partial correlations, regressing both variables on a T cell lineage index built from cell-identity transcripts that are not interferon inducible (CD3D, CD3E, CD3G, CD2, CD6, TRAC, TRBC1, LCK, THEMIS, SKAP1; Table S3).
Across the seven datasets, this procedure generated 3,725 tabulated contrasts. Ninety-two gene-set-by-population rows in the sorted-leukocyte study fell below the scoring floor and were retained as flagged, nonevaluable rows; 3,633 comparisons were evaluable. The uniform multiplicity framework identified 234 significant comparisons. Table S5 reports every contrast, scoring flag, family assignment, adjusted probability, and standardized effect size.

2.5. Serum Protein Analysis

Public multiplex immunoassay data for an AS03-adjuvanted H5N1 trial (ImmPort SDY1252) provided 76 analytes in 39 participants across 14 time points, analyzed as change from the dose-appropriate baseline with Welch tests, Benjamini-Hochberg control, leave-one-participant-out sensitivity analysis and re-estimation on the observed-concentration sheet.

2.6. Software and Availability

Python 3.10.12 with numpy 2.2.6, pandas 2.3.3, scipy 1.15.3, statsmodels 0.14.6; figures with matplotlib 3.10.9. The Supplementary Materials accompanying this article are a single workbook containing Tables S1 to S7, including the complete table of 3,633 evaluable comparisons. All analysis code, gene set definitions, per-sample gene set scores and self-contained figure build packages are archived separately at https://doi.org/10.5281/zenodo.21815492.

3. Results

3.1. Active Adjuvants Generate Robust, Broadly Comparable Innate Ignition

AS01B, AS01E and AS03 each raised type I interferon well above the aluminum salt control: 9.6, 8.6 and 7.5 percentile points at 24 hours after the second dose, with concordant increases across interferon gamma signaling, complement, inflammasome and pyroptosis gene sets (Figure 1b). AS03 reproduced this in two further trials against unadjuvanted comparators: 9.4 percentile points in whole blood 24 h after the second dose in GSE102012, and in the same window in GSE112293 5.4 points in whole blood and 6.2 in PBMC, the two compartments having been analyzed separately. MF59 raised interferon by 3.2 percentile points against antigen-matched Agrippal.
The three Adjuvant System (AS) formulations generated broadly comparable responses. Across all six innate gene sets and both 24-hour windows, AS01E and AS03 were concordant in all twelve pairwise comparisons and AS01B and AS01E in eleven. AS01B and AS03 differed in five comparisons by 1.0 to 2.1 percentile points, with comparable responses at the primary window (q = 0.19). Each exceeded aluminum salt by 7.5 to 9.6 points at that window (Table S4).
AS04 estimates remained centered near zero across 161 comparisons with aluminum salt (-1.6 to +1.6 percentile points), including 42 innate comparisons (-0.6 to +1.5). Under the alternative pooled-within-study rule, one AS04 comparison reached significance (trafficking and adhesion, dose 2 plus 24 h, -1.59 percentile points); Table S5 provides both multiplicity columns. Aluminum salt likewise remained at placebo levels across 230 comparisons in CRC305A-C. Two independent studies with different references therefore identify AS04 and aluminum-only formulations as minimally active in the systemic innate readout.

3.2. A Live Vaccine Sustains the Same Response Six Times Longer

In CRC305A-C, each adjuvanted and live arm was compared with the program's pooled placebo arm under daily sampling (Figure 1a); placebo recipients were pooled across the three protocols, which share a design and placebo definition, because each protocol alone contributes only four to eight participants. MF59 was compared with antigen-matched Agrippal. The yellow fever 17D interferon response emerged on day 2, rose monotonically to 8.3 percentile points on day 7, and had resolved by day 14 (-0.8 points, q = 0.66), with the same participants sampled through days 21 and 28. Its measured duration was therefore seven days. MF59 peaked at 3.2 points on day 1 and returned to baseline by day 3. Aluminum salt, unadjuvanted influenza, and varicella remained at placebo levels throughout.
Duration separated the classes more clearly than peak amplitude (Figure 1b). AS01B reached 9.6 percentile points, exceeding yellow fever's peak of 8.3, yet AS01 and AS03 had resolved by day 7 and MF59 lasted a single day. Yellow fever sustained its response for seven days before resolving by day 14.

3.3. The Live Vaccine Progresses Beyond Ignition; Later Adjuvant Programs Are Limited in Blood

Yellow fever produced an ordered sequence: type I interferon at days 2 to 7, interferon gamma signaling at days 3 and 4, dendritic-cell activation at days 3 to 5, complement at days 4 and 7, pyroptosis and trafficking at day 7, and a germinal-center and plasmablast response at day 14. The day-14 adaptive signal was unique to yellow fever. A smaller day-7 germinal-center and plasmablast signal occurred in the two AS03 trials sampled at that time: 1.6 percentile points in GSE116975 (q = 0.050) and 1.6 points in GSE102012 (q = 0.037); later persistence was not tested in those trials.
Beyond that limited day-7 signal, the adjuvant studies did not show a reproducible sustained positive program across the prespecified Th1/interleukin-12, cytotoxic T-cell, natural-killer/interleukin-15, naive/memory, or trafficking and adhesion sets in blood. Acute decreases in several lymphocyte-associated scores were subsequently shown to be dominated by blood-cell composition rather than loss of transcription within sorted lymphocytes (Section 3.6 and Section 3.7). The data therefore establish robust immune ignition and antigen-presenting-cell engagement, while later functions required for tumor-cell recognition and killing were either not detected systemically, not sampled in the relevant tissue, or not directly measured.

3.4. Antigen Presentation Rises Independently of Sample Composition

Dendritic cell activation, which includes CD40, CD80, CD86, BATF3, CLEC9A, and XCR1, rose by 4.0, 4.1, and 3.3 percentile points in the AS01B, AS01E, and AS03 arms at 24 hours after the second dose, by 3.8 points for AS03 in whole blood in the validation trial, and by 3.0 points for MF59. Major histocompatibility complex (MHC) class I presentation machinery rose by 1.5 to 2.3 points. The corresponding AS04 estimate was -0.21.
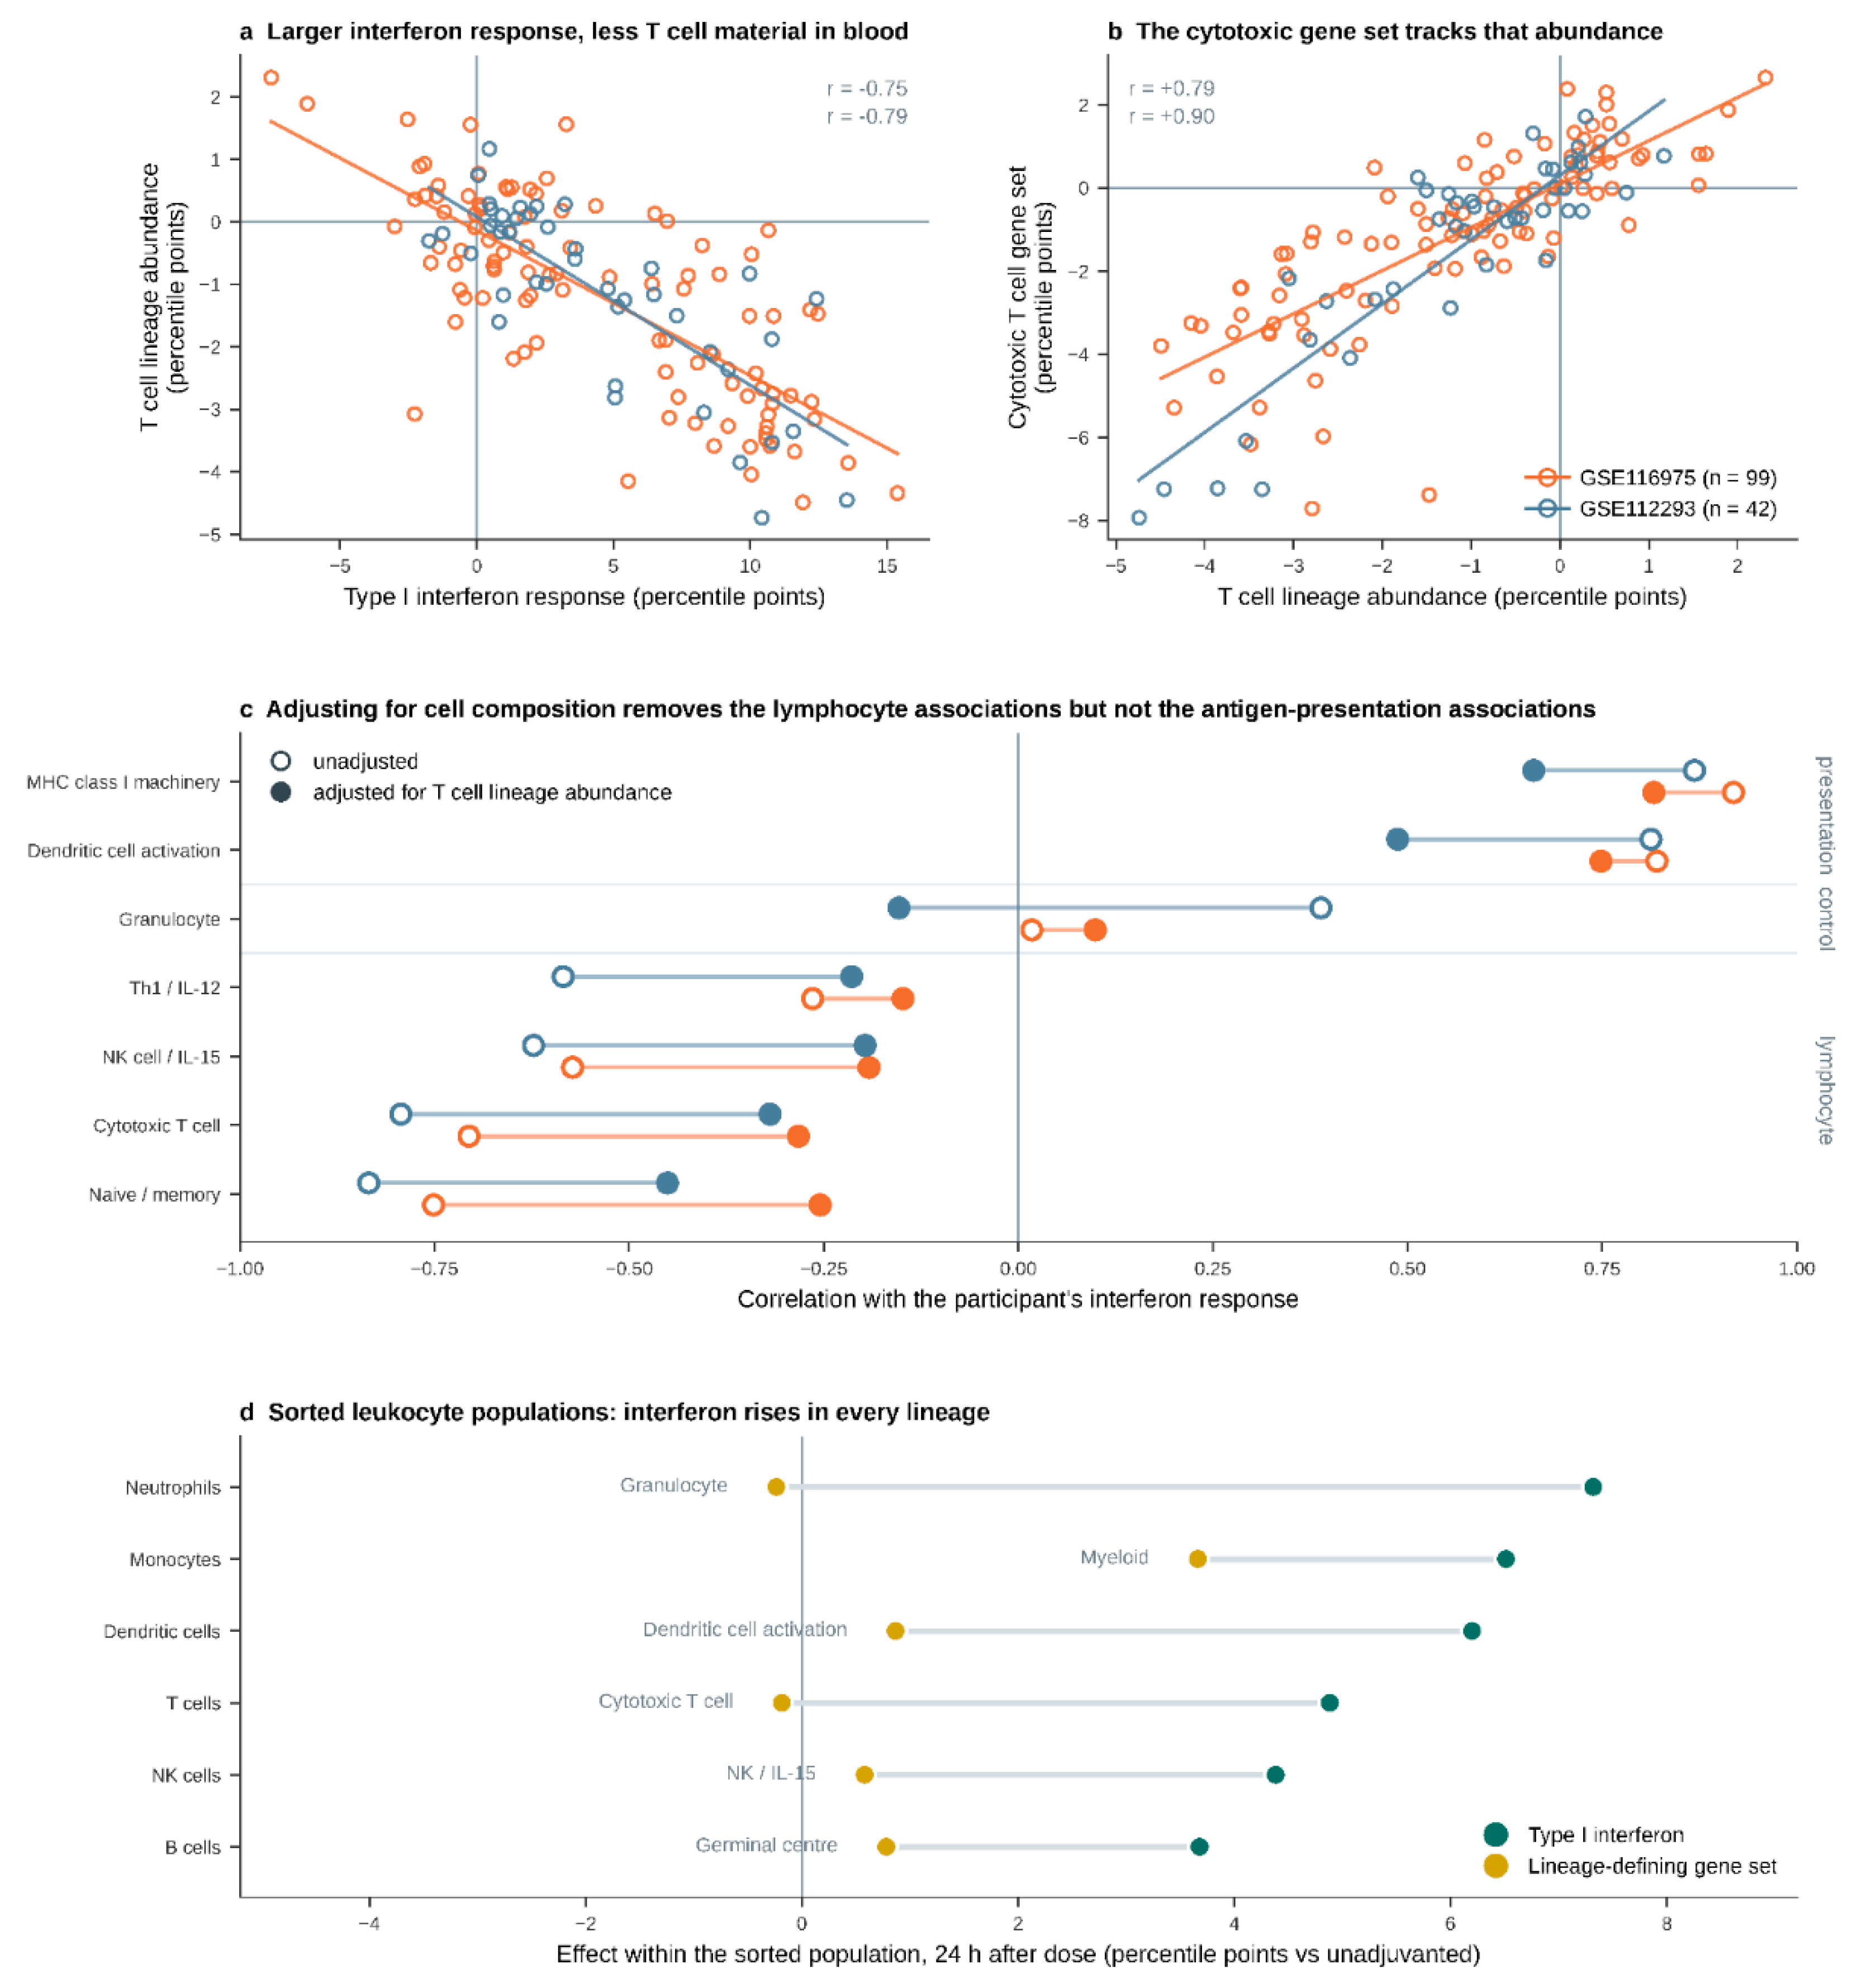
At participant level both gene sets scaled with the individual's own interferon response, at r = 0.82 and 0.81 for dendritic cell activation and 0.92 and 0.87 for class I machinery in the two trials with sufficient sampling, and both retained a partial correlation after adjustment for T cell lineage abundance: 0.75 and 0.49 for dendritic cell activation and 0.82 and 0.66 for class I machinery, an attenuation of 9 to 40 percent against the 60 to 68 percent seen for the lymphocyte gene sets (Figure 2c; Table S7).

3.5. Interferon and Antigen-Presentation Signals Reflect Per-Cell Transcription

Because gene set scores in whole blood are sensitive to cellular composition, we tested the contribution of myeloid expansion directly. Each participant's interferon change was regressed on the corresponding change in monocyte and neutrophil lineage abundance, and the between-arm comparison was repeated on the residuals. The effect was retained almost entirely: 99 percent for AS01E (+8.51, p = 4.5e-11), 96 percent for AS03 (+7.23, p = 7e-10), 77 percent for AS01B (+7.31, p = 5e-05), and 52 percent for AS03 in the second trial (+2.85, p = 0.003). AS04 remained null. The retained effects establish per-cell transcription as the principal source of the interferon signal. Table S7 provides the unadjusted and adjusted estimates, p values, and covariates removed for each comparison.

3.6. Sorted Leukocyte Populations Confirm Per-Cell Interferon Transcription and Localize the Compositional Effect

One study (NCT01573312) sequenced six sorted leukocyte populations separately from the same participants: T cells, B cells, natural killer cells, monocytes, dendritic cells and neutrophils, at days 0, 1, 3, 7 and 28 after AS03-adjuvanted or unadjuvanted H5N1 vaccine (10 participants per arm). Within a sorted population, any change in a gene set score is a change in transcription per cell and cannot arise from a shift in the composition of the sample.
The interferon response was present in all six sorted populations at day 1, at 7.3, 6.5, 6.2, 4.9, 4.4 and 3.7 percentile points in neutrophils, monocytes, dendritic cells, T cells, natural killer cells and B cells respectively, each nominally significant (p = 0.0004 to 0.005). The assay therefore detects adjuvant-induced transcription in every lineage, including the lymphocytes.
The cytotoxic gene set remained stable. Within sorted T cells at day 1, the cytotoxic score changed by -0.19 percentile points (p = 0.85) and the naive/memory score by -0.20 (p = 0.19), alongside an interferon response of +4.88 (p = 0.003) in the same cells, participants, and samples. Within sorted natural killer cells, the natural killer/interleukin-15 (NK/IL-15) score changed by +0.58 (p = 0.07), alongside an interferon response of +4.38 (p = 0.005) (Figure 2d).
In whole blood, the same gene sets fall by 2.5 to 3.7 percentile points; in sorted cells they remain stable, while the interferon response is 20 to 25 times larger than the cytotoxic change. Cell sorting therefore demonstrates directly that the apparent loss of cytotoxic signal in whole blood reflects sample composition rather than altered cytotoxic transcription within the cells.
Under the uniform correction applied across all six sorted populations, the day-1 interferon effect remained significant in five populations and was marginal in natural killer cells, whereas the cytotoxic and naive/memory scores within sorted T cells remained null (Table S5). One isolated day-28 neutrophil inflammasome/interleukin-1 signal had no whole-blood counterpart and was not sampled later; it is reported as an isolated observation rather than evidence of sustained innate activation. The complete 528-row table, including 436 evaluable comparisons, is provided in Table S5.
This is the only dataset with sorted populations, and it contains a single adjuvant (AS03). The demonstration is therefore specific to AS03, although the mechanism it identifies, a shift in the cellular composition of whole blood, is not adjuvant-specific and would be expected to operate wherever an interferon response of similar size occurs.

3.7. The Accompanying Lymphocyte Decrease Is a Property of the Sample

Cytotoxic T cell, natural killer and naive/memory gene sets fell in every responding arm, by up to 3.7, 3.4 and 2.9 percentile points, and the decline scaled with each participant's interferon response (r = -0.71 to -0.83). Lineage identity markers show this reflects sample composition (Figure 2a, Figure 2b; Table S7): participants with larger interferon responses had proportionally less T cell lineage signal in blood (r = -0.75 and -0.79), the cytotoxic gene set tracked that signal at r = 0.79 and 0.90, and holding lineage abundance constant removed 60 percent of the association for the cytotoxic gene set, 67 and 68 percent for natural killer, which lost significance entirely, and 66 and 46 percent for naive/memory. Granulocyte scores showed no consistent association.
The same pattern appeared with MF59 in a fourth independent study, where dendritic cell activation rose by 3.0 and complement by 3.4 percentile points while cytotoxic, natural killer, Th1 and naive/memory gene sets fell by 2.5, 2.7, 2.2 and 1.6, all at day 1 and all resolved by day 3.

3.8. Sampling and Compartment Clarify Two Previously Ambiguous Results

GSE74975 showed concordant medium effect sizes at its earliest post-vaccination sample, day 1 post-boost, with 14 participants per arm: Hedges g was 0.64 for interferon, 0.72 for complement, and 0.76 for dendritic cell activation (p = 0.097, 0.064, and 0.050, respectively). A standardized effect size, computed identically for every contrast with the small-sample correction applied, is reported for each of the 3,633 evaluable comparisons in Table S5. The concordant effect sizes support limited power as the explanation for the absence of statistically significant contrasts.
In the mouse experiment, reported separately because it used subcutaneous rather than intramuscular administration, the acute decrease in lymphocyte gene sets at 24 hours was confined to blood. The draining lymph node instead showed a germinal center and plasmablast response at 72 hours, the experiment's significant adaptive signal, illustrating the compartment-specific information carried by blood and lymphoid tissue.

3.9. Serum Proteins Confirm That Boosting Amplifies but Does Not Prolong the Acute Response

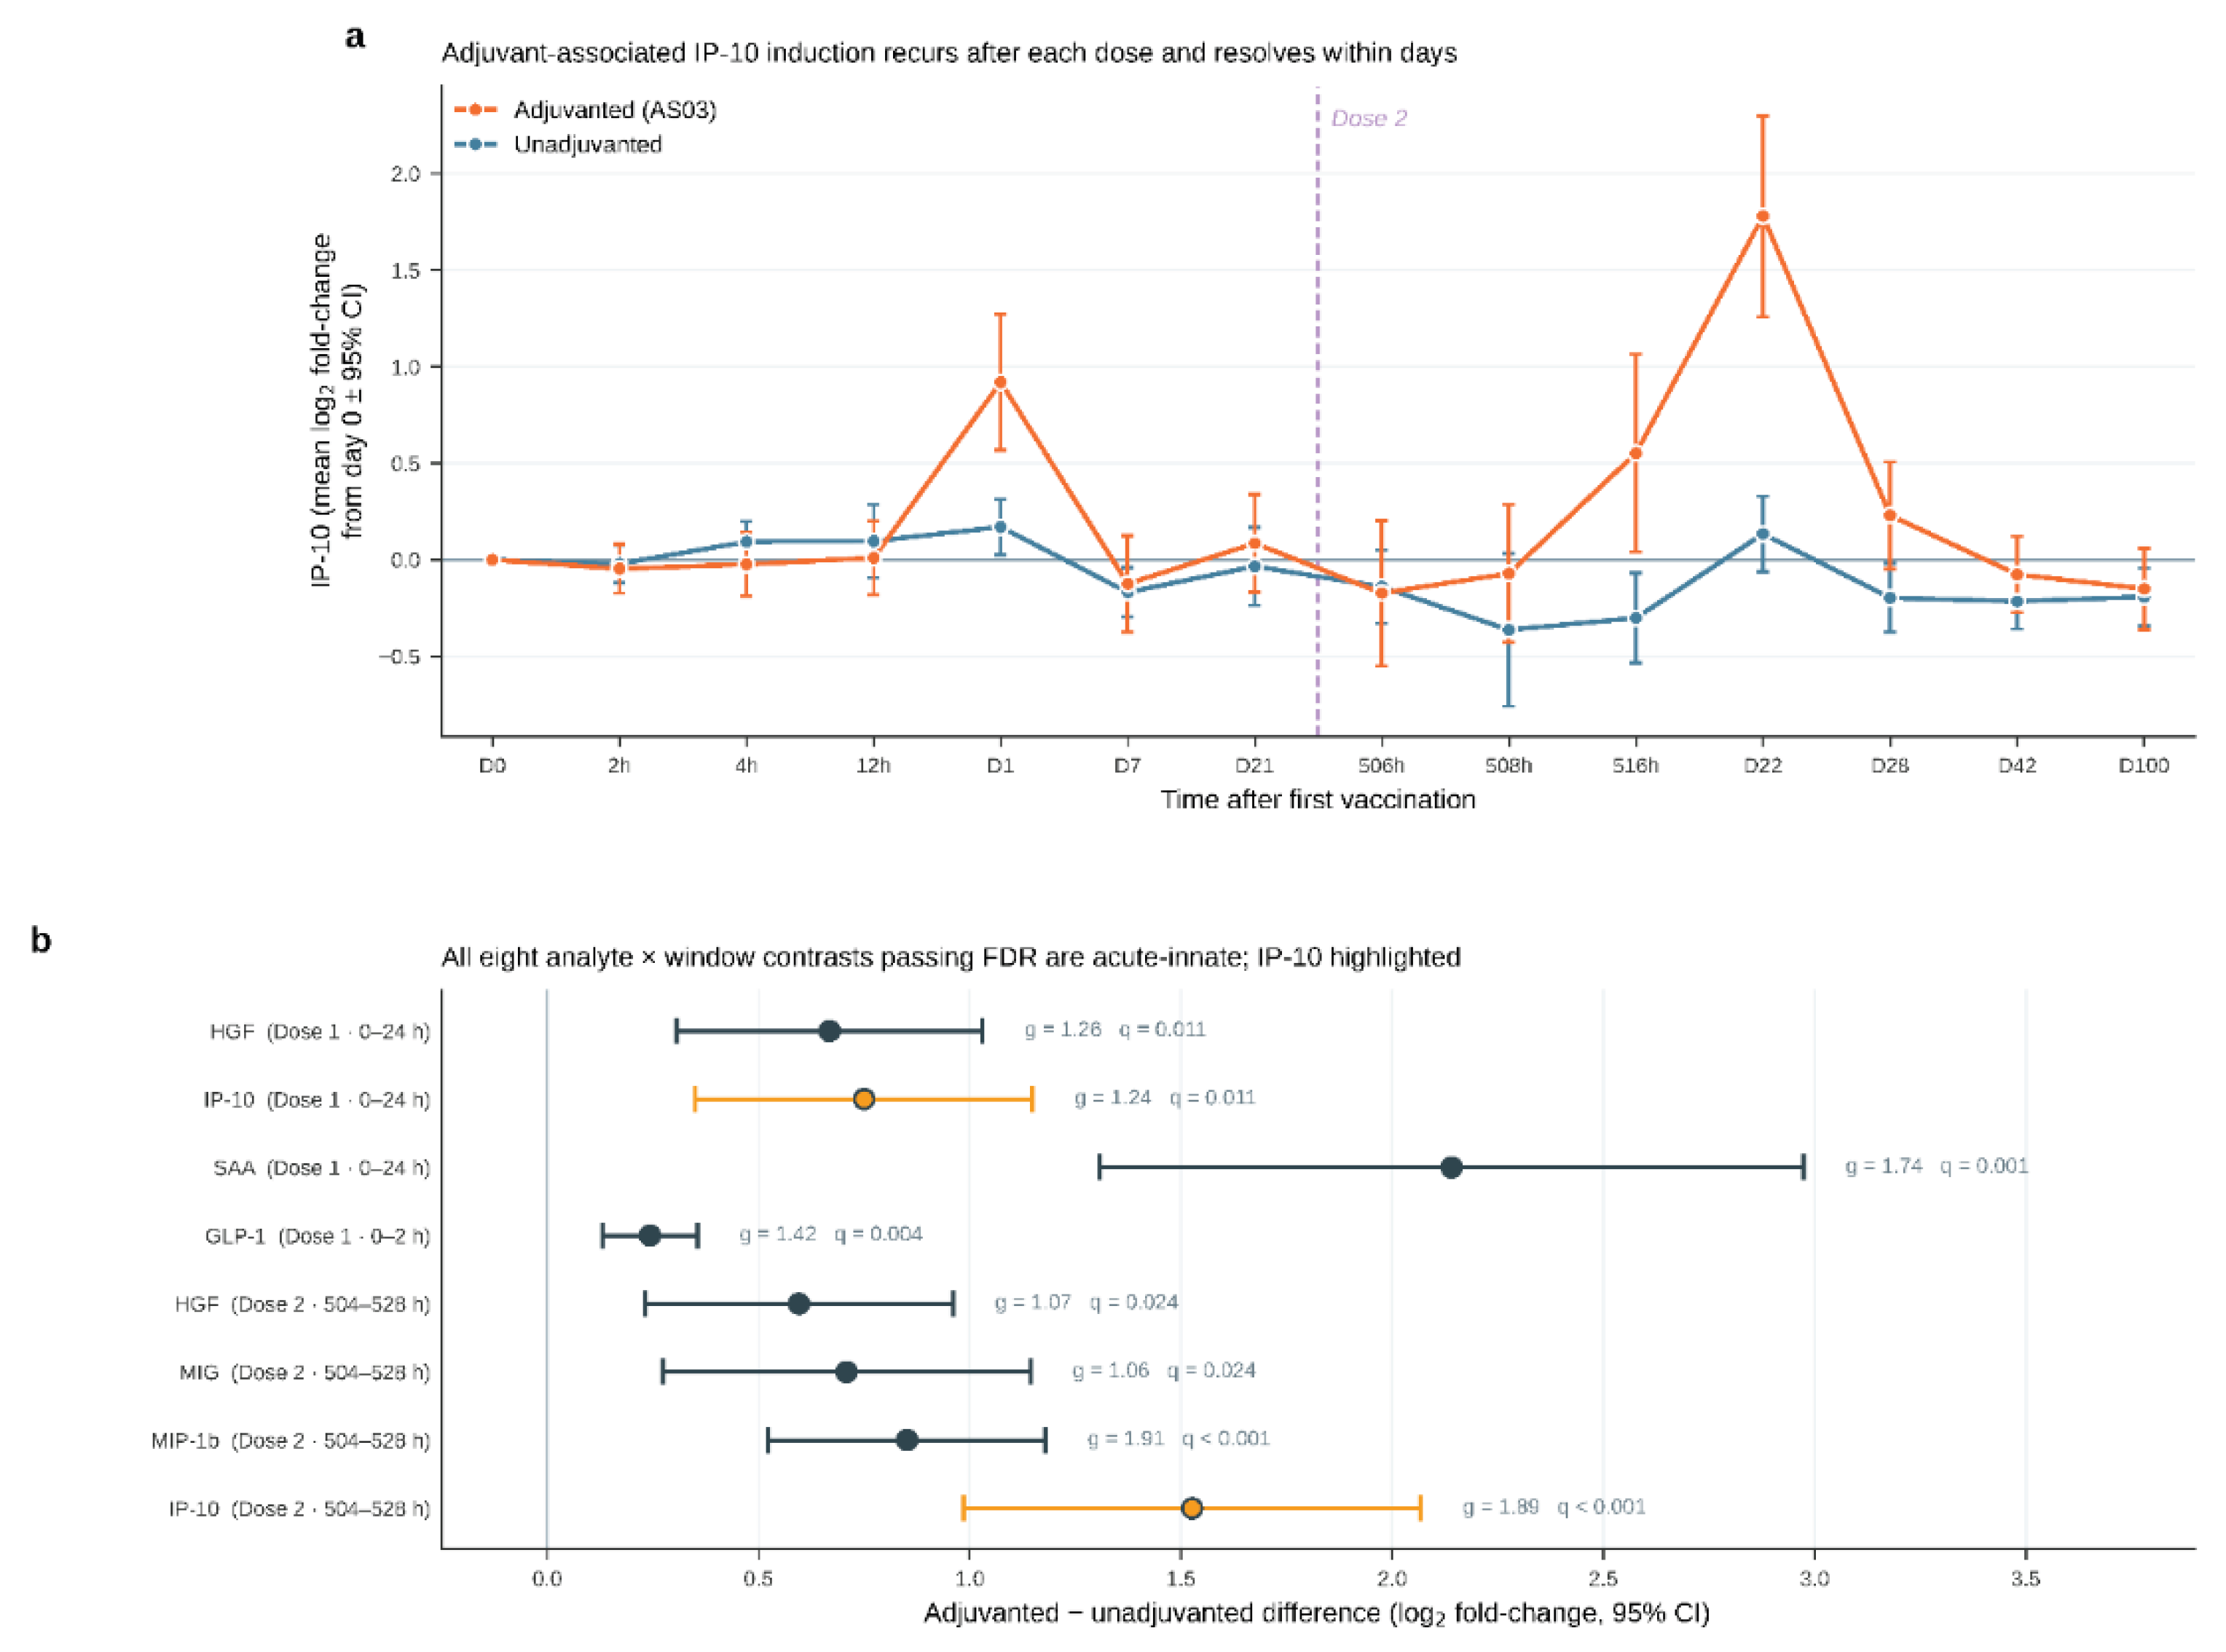
SDY1252 provided 14 serum time points around two doses of AS03-adjuvanted or unadjuvanted H5N1 vaccine. IP-10 increased after both doses, with a post-boost peak approximately twice the post-prime peak, and had returned to baseline by day 28 (Figure 3a). The protein data therefore independently reproduce the transcriptomic pattern of discrete acute pulses rather than sustained activation.
Across 76 analytes, all eight adjuvanted-versus-unadjuvanted contrasts surviving false discovery correction occurred in acute innate windows after either dose; no adaptive-phase analyte reached significance at any sampled window (Figure 3b). Results were stable in leave-one-participant-out analysis and when reestimated from observed concentrations.

4. Discussion

4.1. Immune Ignition Is Robust but Brief

AS01B, AS01E, AS03, and MF59 each raised type I interferon by 3.2 to 9.6 percentile points above matched controls at 24 hours, reproduced across four independent trials and two antigens, with concordant complement, inflammasome, and pyroptosis responses. Active adjuvants therefore produced strong and reproducible immune ignition rather than a weak initiating signal.
The response was also brief. MF59 had resolved by day 3, and AS01 and AS03 by day 7. Across 874 whole-blood comparisons at day 7 or later, all innate adjuvant effects had resolved. Serum proteins reproduced the same kinetic pattern: the second dose generated a larger IP-10 peak but another discrete pulse rather than sustained activation (Figure 3). The differentiating feature in these datasets is persistence, not failure to initiate.

4.2. Duration Distinguishes the Adjuvant Response from Durable Live Vaccination

Yellow fever 17D provided an internal benchmark measured on the same platform. It sustained interferon from day 2 through day 7, progressed through dendritic-cell and trafficking signals, and produced a germinal-center and plasmablast response at day 14. Peak amplitude did not distinguish the vaccine classes; AS01B reached a higher peak than yellow fever. Duration did.
This comparison identifies duration as a measurable candidate determinant of immune progression, not as a complete definition of response quality. A live vaccine also differs in replication, antigenic breadth, anatomical distribution, and the continuity of antigen expression. The biologically relevant question is whether a longer period of antigen-plus-innate stimulation enables the later functions that a transient peak does not establish.

4.3. Adjuvants Reliably Engage Antigen-Presenting-Cell Activation and Antigen Presentation

Dendritic-cell activation, including CD40, CD80, CD86, BATF3, CLEC9A, and XCR1, rose by 3.0 to 4.1 percentile points in every responding arm, while MHC class I antigen-presentation machinery rose by 1.5 to 2.3 points. Both programs scaled with each participant's interferon response and remained associated after adjustment for blood-cell composition.
Antigen-presenting-cell activation is therefore a measurable strength of the early adjuvant response. The data support engagement of key components needed for cross-presentation of tumor antigen. They do not, by themselves, establish that antigen was productively cross-presented in vivo or that tumor-reactive T cells were subsequently primed, expanded, and licensed for killing.

4.4. Active Formulations Show Broadly Comparable Innate Potency

AS01B, AS01E, and AS03 produced broadly comparable innate responses, with only modest differences among them, whereas AS04 and aluminum salt remained near control levels across independent comparisons. For an anticancer cellular objective, formulation, antigen compatibility, durability, and downstream immune quality may therefore be more informative discriminators among active adjuvants than peak innate potency alone.

4.5. Whole Blood Measures Ignition Well but Cannot Localize Downstream Immunity

Interferon and antigen-presentation scores reflected genuine per-cell transcription. Lymphocyte-associated scores behaved differently: their acute decreases were largely explained by changing cellular composition, and cytotoxic and naive/memory scores remained stable within sorted T cells despite strong interferon induction in those same cells. Acute whole-blood cytotoxic scores therefore cannot be read as direct measures of cytotoxic differentiation.
The relevant leukocytes may also leave the circulation for draining lymph nodes or other tissues, removing their transcripts from whole blood. In the mouse experiment, a germinal-center and plasmablast response appeared in the draining lymph node without a corresponding blood signal. Sequestration, margination, and redistribution remain additional possibilities. Failure to detect a downstream program in blood is therefore not evidence that the program is absent from lymphoid tissue or tumor.

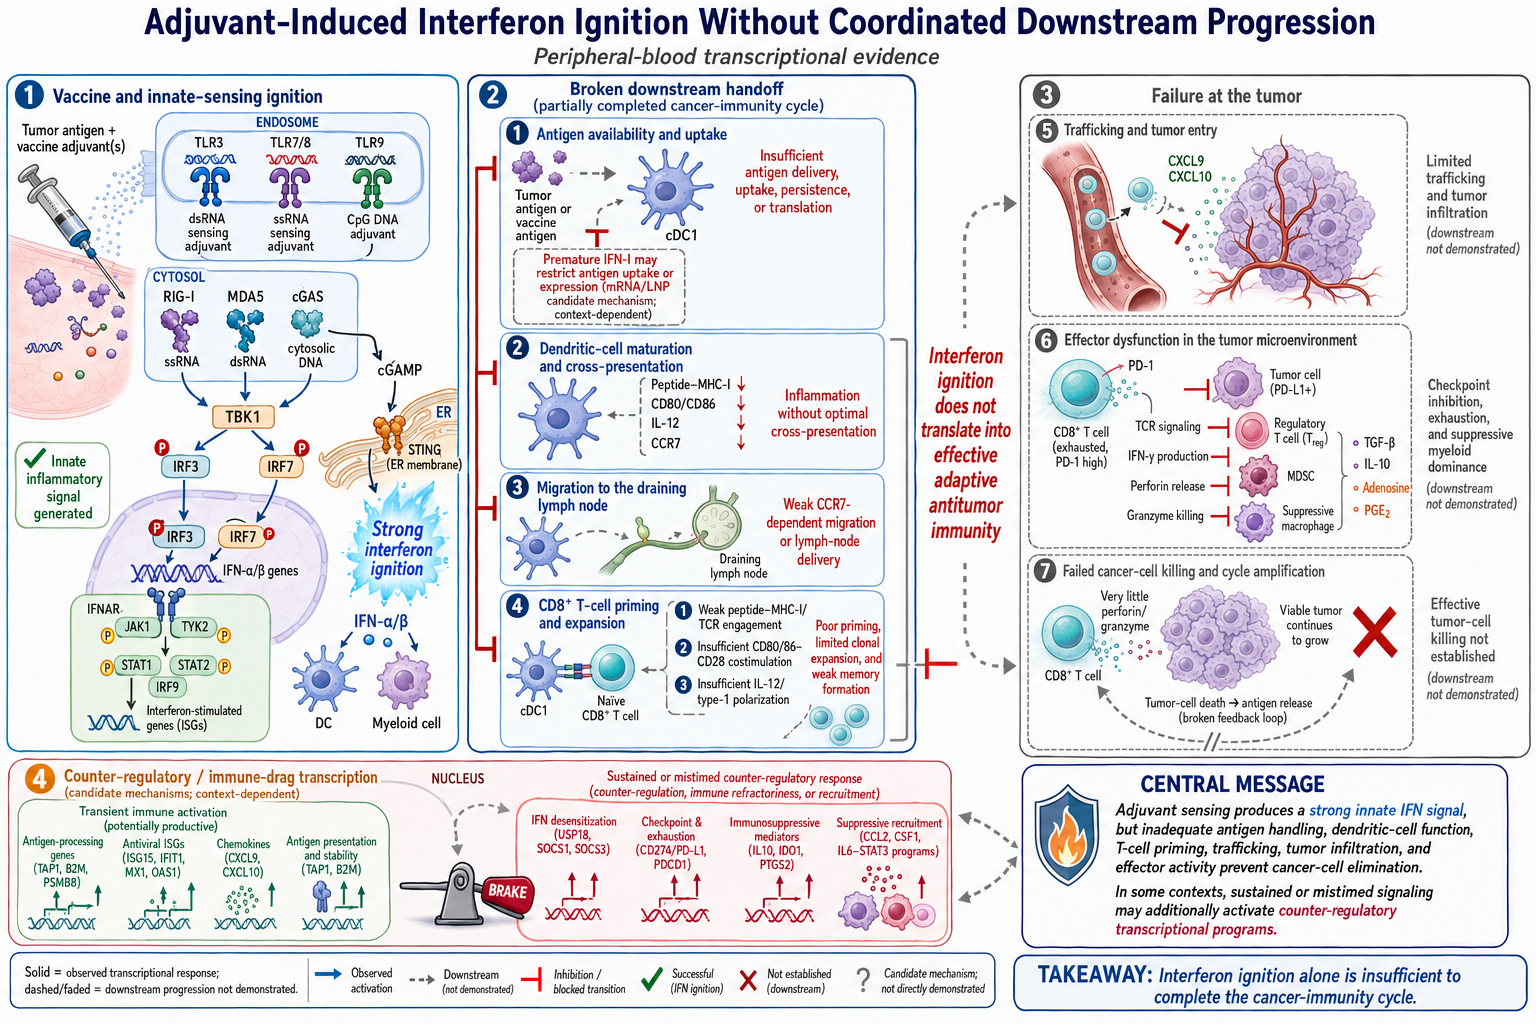
4.6. Immune Ignition Does Not Complete the Antitumor Immune Sequence

The 23 gene sets were selected to ask whether vaccination progressed from innate sensing and antigen-presenting-cell engagement into the later functions relevant to cancer-cell killing. The answer was asymmetric: early interferon and antigen-presentation programs were strong and reproducible, whereas sustained positive Th1/interleukin-12, cytotoxic T-cell, natural-killer/interleukin-15, naive/memory, and trafficking programs were limited, heterogeneous, absent from blood, or not measurable at the sampled times and compartments.
For therapeutic cancer vaccination, successful initiation must be followed by adequate clonal expansion and differentiation, tumor trafficking and infiltration, recognition of naturally processed tumor antigen, resistance to local suppression and exhaustion, direct cancer-cell killing, and persistence. The present analysis does not demonstrate that each of these functions failed. It shows that robust ignition and antigen-presenting-cell activation did not, by themselves, establish that the later sequence had been completed.

4.7. Why Cancer Vaccines May Be Immunogenic Without Producing Tumor Control

A vaccine can therefore produce an interferon signal, antigen-presenting-cell activation, and a detectable antigen-specific ELISpot, tetramer, or cytokine response while still falling short of tumor control. Each assay captures a useful portion of the response, but none alone establishes tumor access, recognition of naturally processed antigen, cytotoxic execution within a suppressive microenvironment, or durable immune memory [1,2,3,4].
The one- to three-day innate pulses observed here provide a specific hypothesis for this dissociation: the overlap between antigen availability and effective innate stimulation may be too brief to support the transition from immune recognition to a complete cellular response. Duration is unlikely to be the only determinant. Later failure can also arise from inadequate T-cell quality, poor trafficking, tumor antigen-presentation defects, suppressive stroma or vasculature, checkpoint-mediated dysfunction, and target loss. The findings nominate persistence as one tractable variable without reducing cancer-vaccine failure to a single mechanism.

4.8. Repeated Dosing and Newer Delivery Platforms May Change the Response

Most analyzed regimens contained one or two doses, whereas therapeutic cancer-vaccine protocols commonly use serial priming and repeated boosters [2,3]. In the serum dataset, boosting increased peak IP-10 but did not prolong the individual pulse. These data cannot determine whether repeated pulses cumulatively expand and consolidate tumor-reactive clones or whether downstream bottlenecks persist despite boosting. Both possibilities require longitudinal sampling across the full vaccine series.
The conventional adjuvants studied here also should not be generalized to RNA-lipoplex or messenger-RNA lipid-nanoparticle platforms. RNA lipoplexes can target dendritic cells while engaging antiviral innate sensing in cancer immunotherapy, and ionizable lipid nanoparticles can themselves provide adjuvant activity and promote T-follicular-helper and germinal-center responses in preclinical models [22,23]. These platforms couple antigen delivery, antigen expression, and innate stimulation and may therefore alter both response kinetics and downstream quality. Viral vectors and self-amplifying RNA may likewise extend antigen expression beyond that of an adjuvanted protein.
The resulting prediction is testable: platforms or dosing schedules that prolong antigen-plus-innate stimulation should sustain interferon and antigen-presentation programs beyond a single acute peak. The more important test is whether that persistence is followed by measurable priming, trafficking, functional killing, and memory rather than simply a longer inflammatory signal.

4.9. Implications for Cancer-Vaccine Trial Design and Monitoring

Monitoring should test both ignition and completion. Early measurements can include serum cytokines and chemokines and innate transcriptomic modules at 4 to 24 hours, followed by antigen-presenting-cell licensing and migration markers such as CD40, CD80, CD86, HLA-DR, and CCR7 at 24 to 48 hours. Later assessments should address antigen-specific clonal expansion, polyfunctionality, cytotoxic capacity, trafficking phenotype, paired tumor or lymphoid-tissue activity when feasible, recognition and killing of cells presenting naturally processed antigen, and persistence across booster doses. ELISpot remains useful, but it is one component of this stage-aligned assessment rather than a surrogate for the entire antitumor response.
Duration should be treated as an independent engineering variable alongside antigen persistence, antigen-presenting-cell licensing, downstream cytokine support, tumor access, and relief of suppression. Sustained-release formulations, fractionated or repeated dosing, and combined pattern-recognition and costimulatory triggering are rational approaches for prospective evaluation [21]. The pre-vaccination immune state should also be recorded because it may influence whether the same initiating signal progresses successfully [20].

4.10. Limitations

The analyzed cohorts involved prophylactic vaccination in healthy participants and contained no tumor antigen, tumor biopsy, direct cytotoxicity, tumor response, or survival endpoint. Whole-blood transcription is informative for systemic ignition but cannot establish what occurred in draining lymph nodes or tumors; leukocyte redistribution may remove relevant cells and transcripts from the sampled compartment. The mouse draining-node result illustrates this possibility but does not substitute for paired human blood, lymphoid-tissue, and tumor measurements.
Sampling schedules bound the duration estimates, and most studies evaluated only one or two doses rather than the repeated booster schedules used in many therapeutic cancer-vaccine protocols. The sorted-cell confirmation was limited to a small AS03 trial. Yellow fever differs from formulated adjuvants in replication and antigenic breadth, and the dataset did not include viral vectors, RNA lipoplexes, or messenger-RNA lipid nanoparticles. The findings therefore identify response duration and downstream completion as candidates for prospective testing rather than proving that either determines clinical efficacy.

4.11. Conclusion

Clinically used active adjuvants generate robust innate ignition and measurable antigen-presenting-cell activation, with peak amplitudes comparable to a live attenuated vaccine. Their systemic responses are brief, and the analyzed blood datasets do not establish a reproducible, sustained transition through the later cellular functions required for tumor-cell killing. Yellow fever 17D differs in both duration and progression to a detectable adaptive program.
For cancer-vaccine development, the actionable conclusion is to optimize and measure both sides of that transition: the magnitude and persistence of early ignition, and the subsequent quality, localization, cytotoxic function, and durability of the antitumor response. Ignition is necessary; successful cancer-cell killing requires completion of the immune sequence it is intended to start.

Supplementary Materials

The following supporting information can be downloaded at the website of this paper posted on Preprints.org. The following are available in the Supplementary Materials: Table S1, datasets screened but not included; Table S2, immune gene set definitions, membership and provenance; Table S3, cell-lineage identity marker definitions; Table S4, complete pairwise comparisons between adjuvant arms; Table S5, all 3,725 tabulated contrast-by-gene-set rows, of which 3,633 are evaluable, carrying the primary and the alternative multiplicity columns, the family assignment for every row and a standardized effect size; Table S6, covariate and baseline balance audit; Table S7, the composition-adjustment statistics behind Figure 2 and Section 3.4, Section 3.5 and Section 3.7. These tables are supplied as a single workbook whose first sheet gives each legend, the multiple-testing framework and the data availability statement. The Zenodo deposit at https://doi.org/10.5281/zenodo.21815492 is a separate and more extensive archive: it holds the same tables together with the analysis code, the per-sample gene set scores, the per-study contrast files from which Table S5 is assembled, and self-contained packages that rebuild each figure from its own data.

Author Contributions

Conceptualization, C.K.G.; methodology, C.K.G.; software, C.K.G.; validation, C.K.G.; formal analysis, C.K.G.; investigation, C.K.G.; data curation, C.K.G.; writing—original draft preparation, C.K.G.; writing—review and editing, C.K.G.; visualization, C.K.G.; project administration, C.K.G. The author has read and agreed to the published version of the manuscript.

Funding

This research received no external funding.

Institutional Review Board Statement

Not applicable. This secondary analysis used only de-identified, publicly available human datasets and publicly available animal data; it involved no new participant recruitment, intervention, data collection, or animal procedures. The original studies report their human-subject ethics and animal-care approvals.

Data Availability Statement

The primary transcriptomic data from six datasets are publicly available through the NCBI Gene Expression Omnibus under accessions GSE116975, GSE112293, GSE102012, GSE124533, GSE74975, and GSE85339. Gene-expression quantifications for the sorted-leukocyte study (NCT01573312; PMID 28099485) are available in the original publication and its Supporting Information. Serum protein data are publicly available through ImmPort study SDY1252. Derived analyses, supplementary materials, and supporting documentation are available in the Zenodo repository: Goldman, C. (2026). Vaccine Adjuvants Recapitulate the Early Innate Response to Live Vaccination: Implications for Therapeutic Cancer Vaccine Design [Dataset]. Zenodo. https://doi.org/10.5281/zenodo.21815492.

Acknowledgments

The author gratefully acknowledges the investigators, study participants, and research teams responsible for generating, validating, and depositing the transcriptomic datasets used in this work through the NCBI Gene Expression Omnibus (GEO). The author recognizes the considerable effort and resources required to produce these datasets and deeply appreciates their commitment to open data sharing, which enables reproducibility, validation, and new discoveries across the scientific community.

Use of Generative Artificial Intelligence

During the preparation and revision of this manuscript, the author used OpenAI ChatGPT 5.6 and Codex to assist with manuscript organization, language editing, and refinement of the discussion and interpretation. The author independently reviewed and verified the manuscript text, analytic outputs, references, and interpretations, made all scientific decisions, and accepts full responsibility for the content of the published article.

Conflicts of Interest

The author declares no conflicts of interest.

Abbreviations

APC, antigen-presenting cell; AS, Adjuvant System; BIOVACSAFE, Biomarkers for Enhanced Vaccine Safety; ELISpot, enzyme-linked immunospot; FDR, false discovery rate; GEO/GSE, Gene Expression Omnibus/GEO Series; H5N1, influenza A(H5N1); IL, interleukin; IP-10, interferon gamma-induced protein 10 (CXCL10); LNP, lipid nanoparticle; LPX, lipoplex; MHC, major histocompatibility complex; MF59, squalene-based oil-in-water emulsion; NCBI, National Center for Biotechnology Information; NK, natural killer; PBMC, peripheral blood mononuclear cell; PMID, PubMed identifier; RNA, ribonucleic acid.

References

  1. Chen, D.S.; Mellman, I. Oncology meets immunology: The cancer-immunity cycle. Immunity 2013, 39, 1-10. [CrossRef]
  2. Melief, C.J.M.; van Hall, T.; Arens, R.; Ossendorp, F.; van der Burg, S.H. Therapeutic cancer vaccines. J. Clin. Investig. 2015, 125, 3401-3412. [CrossRef]
  3. Saxena, M.; van der Burg, S.H.; Melief, C.J.M.; Bhardwaj, N. Therapeutic cancer vaccines. Nat. Rev. Cancer 2021, 21, 360-378. [CrossRef]
  4. Janetzki, S.; Panageas, K.S.; Ben-Porat, L.; et al. Results and harmonization guidelines from two large-scale international ELISpot proficiency panels conducted by the Cancer Vaccine Consortium. Cancer Immunol. Immunother. 2008, 57, 303-315. [CrossRef]
  5. Rosenberg, S.A.; Yang, J.C.; Restifo, N.P. Cancer immunotherapy: Moving beyond current vaccines. Nat. Med. 2004, 10, 909-915. [CrossRef]
  6. Pulendran, B.; S. Arunachalam, P.; O'Hagan, D.T. Emerging concepts in the science of vaccine adjuvants. Nat. Rev. Drug Discov. 2021, 20, 454-475. [CrossRef]
  7. De Mot, L.; Bechtold, V.; Bol, V.; et al. Transcriptional profiles of adjuvanted hepatitis B vaccines display variable interindividual homogeneity but a shared core signature. Sci. Transl. Med. 2020, 12, eaay8618. [CrossRef]
  8. Nakaya, H.I.; Clutterbuck, E.; Kazmin, D.; et al. Systems biology of immunity to MF59-adjuvanted versus nonadjuvanted trivalent seasonal influenza vaccines in early childhood. Proc. Natl. Acad. Sci. USA 2016, 113, 1853-1858. [CrossRef]
  9. Weiner, J.; Lewis, D.J.M.; Maertzdorf, J.; et al. Characterization of potential biomarkers of reactogenicity of licensed antiviral vaccines: randomized controlled clinical trials conducted by the BIOVACSAFE consortium. Sci. Rep. 2019, 9, 20362. [CrossRef]
  10. Poland, J.D.; Calisher, C.H.; Monath, T.P.; Downs, W.G.; Murphy, K. Persistence of neutralizing antibody 30-35 years after immunization with 17D yellow fever vaccine. Bull. World Health Organ. 1981, 59, 895-900.
  11. Querec, T.D.; Akondy, R.S.; Lee, E.K.; et al. Systems biology approach predicts immunogenicity of the yellow fever vaccine in humans. Nat. Immunol. 2009, 10, 116-125. [CrossRef]
  12. Gaucher, D.; Therrien, R.; Kettaf, N.; et al. Yellow fever vaccine induces integrated multilineage and polyfunctional immune responses. J. Exp. Med. 2008, 205, 3119-3131. [CrossRef]
  13. Howard, L.M.; Hoek, K.L.; Goll, J.B.; et al. Cell-based systems biology analysis of human AS03-adjuvanted H5N1 avian influenza vaccine responses: A phase I randomized controlled trial. PLoS ONE 2017, 12, e0167488. [CrossRef]
  14. Apps, R.; Biancotto, A.; Candia, J.; et al. Acute and persistent responses after H5N1 vaccination in humans. Cell Rep. 2024, 43, 114706. [CrossRef]
  15. Wimmers, F.; Donato, M.; Kuo, A.; et al. The single-cell epigenomic and transcriptional landscape of immunity to influenza vaccination. Cell 2021, 184, 3915-3935.e21. [CrossRef]
  16. Olafsdottir, T.A.; Lindqvist, M.; Nookaew, I.; et al. Comparative systems analyses reveal molecular signatures of clinically tested vaccine adjuvants. Sci. Rep. 2016, 6, 39097. [CrossRef]
  17. Li, S.; Rouphael, N.; Duraisingham, S.; et al. Molecular signatures of antibody responses derived from a systems biology study of five human vaccines. Nat. Immunol. 2014, 15, 195-204. [CrossRef]
  18. Barbie, D.A.; Tamayo, P.; Boehm, J.S.; et al. Systematic RNA interference reveals that oncogenic KRAS-driven cancers require TBK1. Nature 2009, 462, 108-112. [CrossRef]
  19. Benjamini, Y.; Hochberg, Y. Controlling the false discovery rate: A practical and powerful approach to multiple testing. J. R. Stat. Soc. B 1995, 57, 289-300. [CrossRef]
  20. Fourati, S.; Tomalin, L.E.; Mule, M.P.; et al. Pan-vaccine analysis reveals innate immune endotypes predictive of antibody responses to vaccination. Nat. Immunol. 2022, 23, 1777-1787. [CrossRef]
  21. Ahonen, C.L.; Doxsee, C.L.; McGurran, S.M.; et al. Combined TLR and CD40 triggering induces potent CD8+ T cell expansion with variable dependence on type I IFN. J. Exp. Med. 2004, 199, 775-784. [CrossRef]
  22. Kranz, L.M.; Diken, M.; Haas, H.; et al. Systemic RNA delivery to dendritic cells exploits antiviral defence for cancer immunotherapy. Nature 2016, 534, 396-401. [CrossRef]
  23. Alameh, M.-G.; Tombácz, I.; Bettini, E.; et al. Lipid nanoparticles enhance the efficacy of mRNA and protein subunit vaccines by inducing robust T follicular helper cell and humoral responses. Immunity 2021, 54, 2877-2892.e7. [CrossRef]
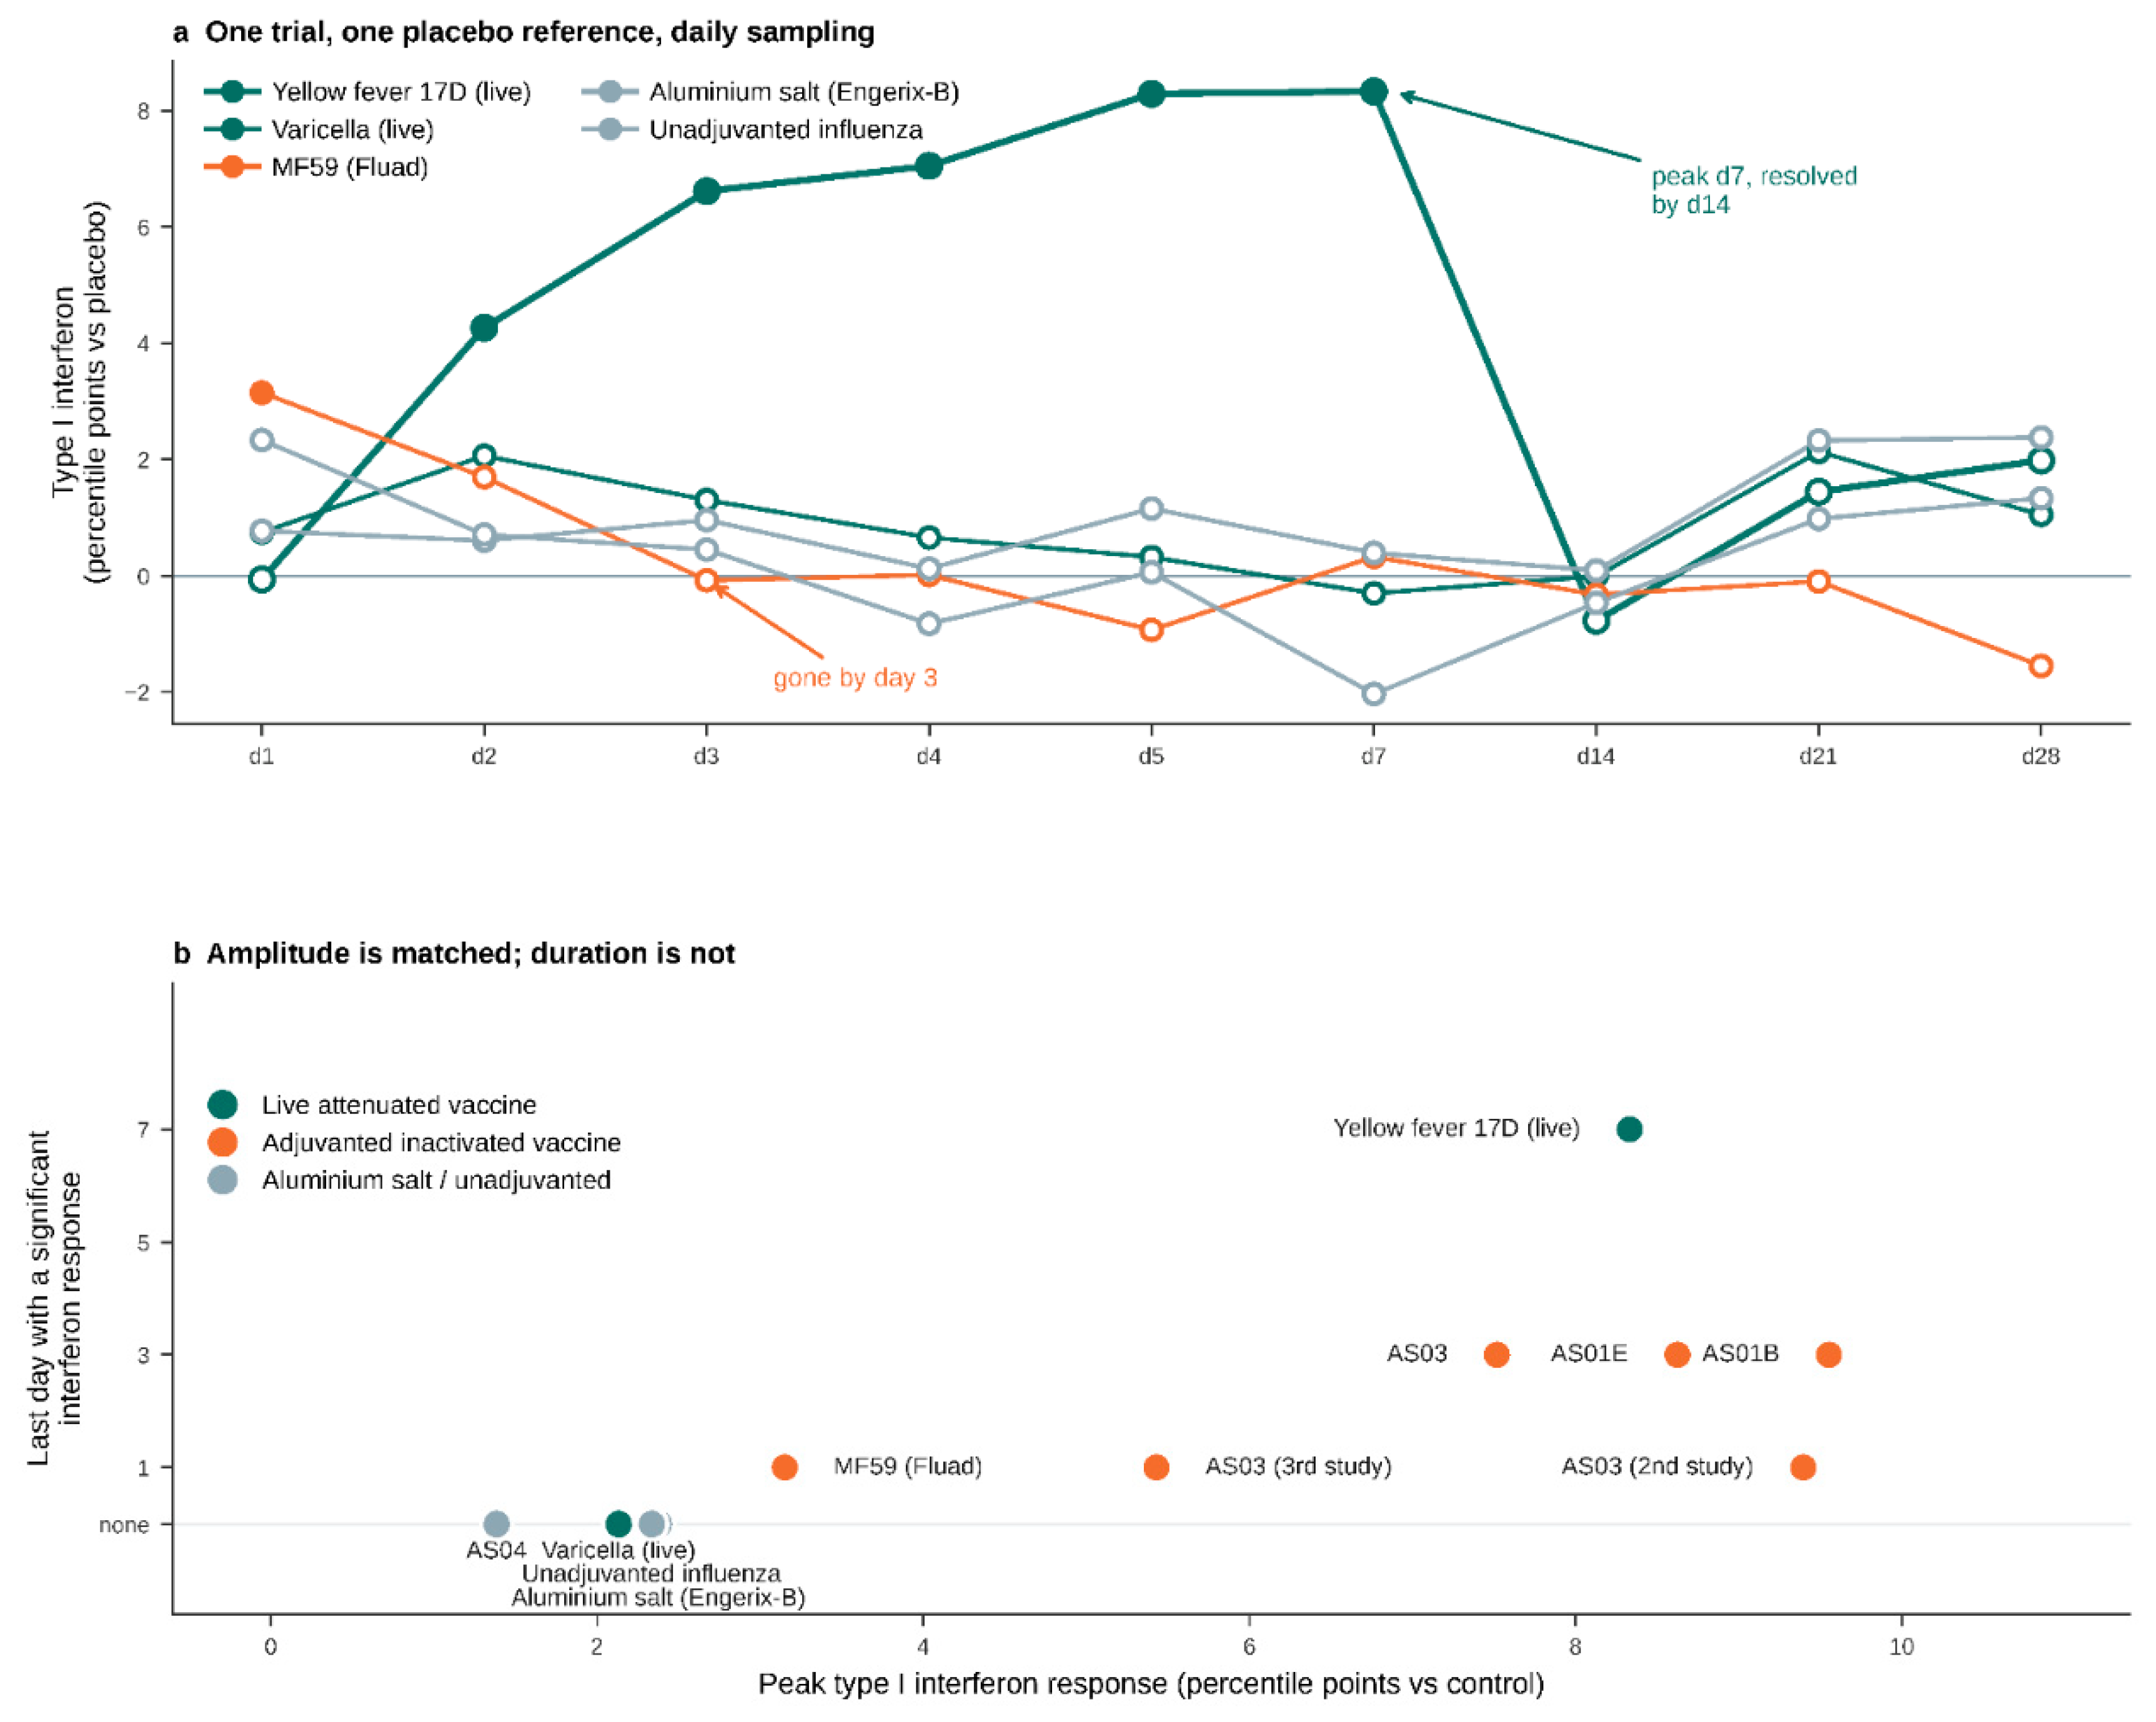
Figure 1. Adjuvants match a live vaccine's peak interferon response but sustain it for one to three days instead of seven. (a) CRC305A-C (GSE124533), daily sampling; each adjuvanted or live arm is compared with the trial program's pooled placebo arm (n = 20 across CRC305A-C), except MF59 (Fluad), which is compared with antigen-matched Agrippal. Placebo participants were pooled across the three protocols because each protocol alone contributes only four to eight placebo recipients; Table S5 reports the reference arm and its size for every row. Points are baseline-adjusted between-arm differences in type I interferon gene set percentile rank; filled symbols pass Benjamini-Hochberg FDR < 0.05 within that immunogen's family, open symbols do not. Yellow fever 17D holds a significant response from day 2 to day 7, peaks at 8.3 percentile points on day 7, and has resolved by day 14 (-0.8 points, q = 0.66) with no further signal at day 21 or day 28; MF59 (Fluad) peaks on day 1 and has resolved by day 3; aluminum salt (Engerix-B) and unadjuvanted influenza do not differ from placebo at any day. (b) Peak interferon effect against the last day on which that effect remained significant, for every immunogen across five human studies, each compared with its own antigen-matched or placebo control. Peak is the largest effect across that arm's sampled windows; for GSE112293, which was analyzed in two compartments, the whole blood value is plotted. AS01B reaches a higher peak than yellow fever yet lasts three days; "none" denotes immunogens with no day at which the response was significant. Multiplicity was controlled by Benjamini-Hochberg within each immunogen-versus-control family, applied uniformly across all seven studies (Table S5).
Preprints 228799 g001
Figure 2. Lymphocyte gene set scores in blood are governed by cell composition, whereas antigen-presentation scores are not. Values are participant-level changes from the pre-dose sample, 24 h after the second dose. T cell lineage abundance is scored from cell-identity transcripts (CD3D, CD3E, CD3G, CD2, CD6, TRAC, TRBC1, LCK, THEMIS, SKAP1) that are not interferon inducible. (a) Each participant's type I interferon response against the change in T cell lineage abundance. (b) T cell lineage abundance against the cytotoxic T cell gene set. Each point is one participant; all study arms are pooled and lines are ordinary least-squares fits within study. Pearson r is annotated per study. (c) Correlation of each gene set with the participant's interferon response before (open symbols) and after (filled symbols) partialling out T cell lineage abundance. Long connectors mark associations that are explained by cell composition; short connectors mark associations that are not. (d) NCT01573312 (AS03 versus unadjuvanted H5N1, 10 participants per arm), the only dataset with sorted leukocyte populations, in which a change within a sorted population cannot arise from sample composition. Type I interferon rises in all six lineages, whereas the lineage-defining gene sets do not move, except the myeloid set in monocytes. Filled symbols indicate p < 0.05. Panel c is a statement about the measurement, not about cell fate: these data cannot distinguish margination, tissue trafficking, sequestration or lymphopenia, and no such claim is made. The unadjusted and adjusted coefficients plotted in panel c, the covariates removed, and the per-population effects in panel d are tabulated in Table S7.
Preprints 228799 g002
Figure 3. Serum protein measurements confirm that the adjuvant response is acute, larger after the boost, and not sustained. SDY1252 (NCT01573312) serum multiplex proteomics; AS03-adjuvanted (n = 19) versus unadjuvanted (n = 20) H5N1. (a) IP-10 as mean log2 fold-change from day 0 by arm across the 14 sampled timepoints; whiskers are 95% confidence intervals of the mean. The dashed rule marks the second injection, given after the day 21 (504 h) pre-dose draw. Induction recurs after each dose, is roughly twice as large after the boost, and has returned to baseline by day 28. (b) Every analyte x window contrast passing Benjamini-Hochberg FDR across the full analyte panel, expressed as the adjuvanted minus unadjuvanted difference in log2 fold-change with 95% confidence interval; Hedges g and the adjusted p value (q) are printed beside each contrast. IP-10 is highlighted. All eight surviving contrasts fall in the acute innate window after either dose; no adaptive-phase analyte reaches significance at any window.
Preprints 228799 g003
Table 1. Public transcriptomic datasets and study designs included in the analysis.
Study Design Arms Sampling
GSE116975 (NCT00805389) Randomized, five arms, hepatitis B surface antigen 20 µg identical in all arms AS01B (18), AS01E (23), AS03 (28), AS04 (22), aluminum salt (21) pre-dose, 3-6 h, 24 h, d14 after dose 1; pre-dose, 3-6 h, 24 h, d3, d7 after dose 2
GSE112293 Randomized, two arms, H5N1 AS03 (19), unadjuvanted (23) 2, 4, 12, 24 h and d7 after each dose; d28, d42, d100. PBMC and whole blood analyzed separately
GSE102012 Randomized, two arms, H5N1 AS03 (33), unadjuvanted (16) d1, d3, d7 after each of two doses
GSE124533 (CRC305A-C) Randomized, eight arms across three protocols, placebo controlled MF59 influenza (20), antigen-matched unadjuvanted influenza (21), aluminum hepatitis B (21 and 20), yellow fever 17D (20), varicella (20), placebo (20) daily at d1-d5, then d7, d14, d21, d28
GSE74975 Randomized, two arms, influenza in children 14-26 months MF59-adjuvanted (n=42), unadjuvanted (n=40) d0; d1, d3 or d7 post-boost by staggered cohort; d56
PMID 28099485 (NCT01573312) Randomized, two arms, six sorted leukocyte populations AS03 (10), unadjuvanted (10) d-28, d-14, d0, d1, d3, d7, d28
GSE85339 Controlled mouse experiment, subcutaneous tail base, blood and draining lymph node H56 antigen alone or with GLA-SE, aluminum salt, CAF01 or IC31 6, 24, 72, 168 h
Disclaimer/Publisher’s Note: The statements, opinions and data contained in all publications are solely those of the individual author(s) and contributor(s) and not of MDPI and/or the editor(s). MDPI and/or the editor(s) disclaim responsibility for any injury to people or property resulting from any ideas, methods, instructions or products referred to in the content.
Copyright: This open access article is published under a Creative Commons CC BY 4.0 license, which permit the free download, distribution, and reuse, provided that the author and preprint are cited in any reuse.