

Submitted:
17 August 2026
Posted:
18 August 2026
You are already at the latest version
Abstract
Reliable ship-to-shore backhaul is essential for maritime Internet of Things (IoT) data delivery, yet cellular and satellite connectivity varies by route, operating phase, and qualification criterion. This study analyses 606,625 georeferenced monitoring records collected during a nine-month, 12-voyage campaign aboard a 1,800-TEU (twenty-foot equivalent unit) container ship operating between Korea and Southeast Asia, with the cellular–GEO analysis limited to the active VSAT service period. During sailing, cellular attachment was reported for 70.3% of valid cellular-state records, but only 28.0% satisfied the adopted RAT-specific received-power criteria, with leg-level qualified fractions ranging from 77.1% (Incheon–Busan) to 17.3% (Shanghai–Ho Chi Minh). Within the joint-analysis window, either the cellular criterion was satisfied or a valid GEO probe response was observed in 99.40% of records, although the residual gap reached 3.11% on Laem Chabang–Ho Chi Minh. Under retrospective cellular-first allocation, raising the candidate VSAT SNR threshold from 6 to 7 dB increased the store-and-forward share from 6.70% to 25.73% without reducing the median RTT of the retained GEO records, and the longest buffered interval grew from 2.02 to 9.86 h. These results show that route segment, operating phase, state definition, and threshold selection materially influence link allocation and buffering implications; live traffic steering and application-level availability were not evaluated.
Keywords:
maritime Internet of Things
; ship-to-shore backhaul
; cellular–satellite integration
; GEO VSAT
; multi-RAT
; store-and-forward
; field measurement
1. Introduction
Commercial vessels increasingly operate as mobile Internet of Things (IoT) platforms, generating navigation, machinery, cargo, and environmental data for shore-based monitoring and operational support. Unlike fixed gateways, shipboard aggregation points traverse communication environments that vary with geography, coastal infrastructure, operating phase, and roaming conditions. Cellular access can provide lower latency and greater capacity near shore, whereas geostationary (GEO) satellite service offers broader offshore coverage at the cost of higher latency. A maritime multi-RAT gateway must therefore determine when to use cellular connectivity, when to fall back to GEO satellite service, and when to retain data for deferred delivery. Such decisions require clear distinctions among network attachment, received-power qualification, and end-to-end path responsiveness. Measurements collected across repeated commercial voyages are needed to identify recurring route-specific conditions and to determine how link-state definitions and quality thresholds influence tier allocation and buffering implications. This study focuses on the heterogeneous backhaul layer that governs immediate and deferred delivery of shipboard IoT data; it does not evaluate the onboard sensor network or application traffic itself.
Previous studies have established maritime propagation models, terrestrial–non-terrestrial architectures, multi-hop coverage extensions, and multi-access gateway concepts [1,2,3,4,5,6,7,8,9,10,11,12,13,14,15,16,17,18,19]. However, empirical evidence remains limited on how commercially deployed cellular and GEO satellite services perform across repeated operational voyages and how their observed states translate into maritime IoT backhaul decisions. Three gaps are particularly relevant. First, network attachment, received-power qualification, and monitored path responsiveness are often reported without being clearly distinguished. Second, pooled route-level statistics can conceal differences between sailing and port stays and cannot determine whether observed patterns recur across voyages. Third, field studies rarely quantify how cellular eligibility rules and satellite-quality thresholds affect fallback allocation, deferred-delivery intervals, and buffering implications. This study addresses these gaps through repeated voyage-leg analysis, explicit denominator definitions, voyage-level uncertainty assessment, joint cellular–GEO state analysis, and retrospective policy evaluation.
This study analyses a nine-month measurement campaign conducted aboard a 1,800-TEU (twenty-foot equivalent unit) container ship operating between Korea and Southeast Asia. The complete-voyage dataset comprises 606,625 georeferenced multi-RAT monitoring records from 12 voyages. The joint cellular–GEO analysis is limited to records collected during the period of active VSAT service. Voyage legs are treated as the primary operational unit, and sailing records are analysed separately from port stays. The study addresses three research questions (RQ):
- (RQ1) How do cellular attachment and received-power-qualified reception vary across repeated voyage legs?
- (RQ2) To what extent does GEO VSAT complement cellular records that do not satisfy the selected received-power criterion?
- (RQ3) How do cellular eligibility definitions and candidate VSAT SNR thresholds affect retrospective tier allocation, deferred-delivery intervals, and buffering implications?
These questions are addressed as follows. For RQ1, cellular attachment was reported for 70.3% of valid cellular-state sailing records, whereas only 28.0% satisfied the adopted RAT-specific received-power criteria; this qualified fraction varied nearly five-fold across the six recurring voyage legs, from 77.1% on Incheon–Busan to 17.3% on Shanghai–Ho Chi Minh. The contrast between these strongest and weakest legs remained consistent across voyages and under the threshold-sensitivity analyses. For RQ2, GEO VSAT complemented cellular effectively across most of the route: within the joint-analysis window, either the cellular criterion was satisfied or a valid GEO probe response was observed in 99.40% of records, but this complementarity weakened on Laem Chabang–Ho Chi Minh, where the residual neither-tier-qualified share reached 3.11% because a low cellular-qualified fraction coincided with the lowest GEO response rate among cellular-non-qualified records. For RQ3, the retrospective cellular-first evaluation showed that raising the candidate VSAT SNR threshold from 6 to 7 dB increased the store-and-forward share from 6.70% to 25.73% without reducing the median RTT of the retained GEO records, while the longest buffered interval grew from 2.02 h to 9.86 h; a stricter gateway-status-restricted eligibility definition produced a substantially larger store-and-forward share at every tested threshold, showing that both the satellite-quality threshold and the evidentiary requirement for cellular selection materially shape deferred-delivery demand. Taken together, these findings indicate that recurring route- and leg-specific conditions, rather than campaign-wide averages, should govern when cellular access can realistically be relied upon and how much buffering capacity a maritime multi-RAT gateway should provide.
The principal contributions are threefold:
- a repeated-voyage characterization that distinguishes network attachment, received-power qualification, and monitored path responsiveness;
- a voyage-leg assessment of cellular–GEO complementarity supported by voyage-level uncertainty analysis; and
- a measurement-based evaluation of how alternative cellular eligibility rules and satellite-quality thresholds affect retrospective tier allocation and deferred-delivery demand.
The scope is limited to the heterogeneous IoT backhaul layer. Sensor-network operation, application throughput, and live traffic steering were not evaluated in the measurement campaign. The remainder of this paper is organized as follows. Section 2 reviews related work on maritime IoT backhaul, field measurements of maritime connectivity, heterogeneous cellular–satellite integration, and delay-tolerant delivery. Section 3 describes the vessel, route, onboard multi-RAT system, measurement indicators, preprocessing, analysis sets, qualification criteria, and the uncertainty and retrospective policy methods. Section 4 reports the voyage-leg and cross-voyage results, cellular–GEO complementarity, delay and packet-loss characteristics, and the retrospective link-selection evaluation. Section 5 discusses the implications for maritime IoT data delivery, multi-RAT link selection, and future terrestrial–non-terrestrial integration, together with the study limitations. Section 6 concludes the paper.
2. Related Work
This section reviews prior work on maritime IoT backhaul, field measurements of maritime cellular and satellite connectivity, heterogeneous cellular–satellite integration and link selection, and delay-tolerant delivery, and positions the present repeated-voyage measurement campaign relative to these strands of research.
2.1. Maritime IoT and Ship-to-Shore Backhaul
Maritime Internet of Things (IoT) systems depend on ship-to-shore backhaul to deliver sensing, monitoring, and operational data. Previous studies characterize this environment as heterogeneous, integrating terrestrial, satellite, aerial, and relay-based links to support services ranging from routine telemetry to safety-related communications [1,2,9]. Standardization efforts have also addressed maritime cellular service continuity and communication beyond conventional terrestrial coverage [11].
Maritime links are influenced by sea-surface reflection, antenna height, coastal infrastructure, and vessel mobility [3,10]. Experimental platforms such as TRITON and BLUECOM+ have demonstrated mesh- and relay-based approaches for extending connectivity offshore [12,13]. However, these studies have focused primarily on network architecture and coverage extension. They provide limited evidence on the recurring cellular and satellite states encountered by commercial vessels using conventional roaming arrangements and contracted satellite services across repeated voyages.
For such vessels, backhaul design involves more than determining whether coverage is present. It must also establish when each access tier should carry IoT data and when transmission should be deferred. Field-observed link states therefore provide the operational basis for multi-RAT selection rules and preliminary assessment of onboard buffering needs.
2.2. Field Measurements of Maritime Cellular and Satellite Connectivity
Empirical evidence on maritime connectivity remains less developed than propagation and architectural research. Fleet-based trials have demonstrated maritime 5G extension and multi-hop operation, while studies of low-Earth-orbit (LEO) satellite mobility have reported throughput and latency under selected fixed and mobile conditions [7,8,14,17]. However, most campaigns involve only a small number of transits, a specific trial environment, or a newly deployed system. This makes it difficult to distinguish recurring route characteristics from temporary network or operational conditions.
Comparability is further constrained by inconsistent definitions of connectivity. Network attachment, received power, probe response, and application throughput represent different levels of evidence, while port-stay records can overstate route-wide performance relative to conditions under way. Repeated measurements from commercial voyages are therefore needed to separate route structure, between-voyage variation, and the effects of state definition. This study addresses these limitations by analysing recurring voyage legs, separating sailing records from port stays, and distinguishing network attachment, received-power qualification, and monitored data-path responsiveness.
2.3. Heterogeneous Cellular–Satellite Integration and Link Selection
Terrestrial–non-terrestrial integration is widely regarded as a practical means of extending maritime communication beyond coastal cellular coverage. Proposed architectures combine terrestrial, satellite, aerial, and relay layers, including hybrid satellite–terrestrial maritime IoT networks, satellite–UAV–terrestrial systems, and broader space–air–ground–sea frameworks [4,5,6,9,15,16]. These studies demonstrate the coverage potential of heterogeneous maritime networks, but they focus primarily on architecture, modelling, and future-system design.
Integrated gateways provide a system-level basis for accessing multiple networks through a common ship-to-shore interface. Previous work has demonstrated dynamic traffic steering between terrestrial and satellite links and the simultaneous use of multiple radio access networks aboard autonomous ships [18,19]. However, such gateways still require operational criteria for determining when cellular, satellite, or deferred delivery should be selected. Their behaviour therefore depends on the observed state and eligibility criterion of each tier, as well as on the duration of intervals during which neither tier satisfies the selected condition.
This study does not propose a new traffic-steering mechanism or evaluate a standardized non-terrestrial network (NTN) implementation. Instead, it uses repeated commercial-voyage measurements to assess retrospective cellular-first policies and to quantify how cellular eligibility definitions and candidate VSAT SNR thresholds affect tier allocation and store-and-forward demand. The findings provide operational evidence relevant to future terrestrial–non-terrestrial integration, including the ubiquitous-connectivity objectives of IMT-2030 and the continuing development of 3GPP NTN systems [20,21,22].
2.4. Deferred Delivery and Research Gap
Store-and-forward delivery is required when continuous end-to-end connectivity cannot be assumed. Delay-tolerant networking retains data during communication interruptions and forwards them once a suitable path becomes available [23,24]. This approach is particularly relevant to maritime IoT telemetry and monitoring data that can tolerate delay but should not be lost. Buffer design, however, depends on more than the aggregate share of records that fail to satisfy the selected connectivity criteria. It also depends on the number, duration, and maximum length of buffered intervals, together with the data-generation rate.
Previous studies provide limited repeated-voyage evidence linking heterogeneous cellular–satellite states to these temporal buffering implications. This study addresses that gap by distinguishing cellular attachment, received-power qualification, and monitored path responsiveness; quantifying cellular–GEO complementarity by voyage leg; and retrospectively evaluating how cellular eligibility definitions and candidate VSAT SNR thresholds affect tier allocation, buffered-interval duration, and illustrative storage implications.
3. Materials and Methods
This section describes the measurement platform and the analytical procedures used to derive the results reported in Section 4. It first introduces the vessel, route, and voyage-leg segmentation and the onboard multi-RAT gateway used to collect cellular and GEO VSAT measurements, followed by the measurement indicators and monitoring scope, the preprocessing and missing-data handling procedures, the VSAT service period and analysis window, and the six record sets and denominators used throughout the paper. It then presents the received-power qualification and VSAT probe-response criteria, the cross-voyage uncertainty analysis, and the retrospective link-selection policy, sensitivity scenario, and buffered-interval definition applied to evaluate cellular–GEO complementarity and store-and-forward implications.
3.1. Vessel, Route, and Voyage Segmentation
Measurements were collected aboard a 1,800-TEU container ship operating in regular commercial service between Korea and Southeast Asia, with port calls at Incheon, Busan, Shanghai, Ho Chi Minh City, and Laem Chabang. The vessel and service-provider names are withheld for reasons of commercial confidentiality. Twelve complete voyages recorded between 19 July 2025 and 17 April 2026 are labelled Voyages 1–12 in chronological order. The vessel tracks span approximately 8.3°N–37.3°N and 100.7°E–129.6°E (Figure 1).
The voyage leg, defined as the scheduled passage between consecutive ports, is used as the primary spatial unit. Each record was assigned by timestamp either to a scheduled passage or to the corresponding port stay. Records at the scheduled departure and arrival times were assigned to the passage. A total of 606 records collected after the final scheduled arrival were excluded, leaving 606,625 records in the complete-voyage dataset. Six voyage legs recurred during the campaign, with valid serving-RAT records available from 10 or 11 voyages per leg.
This schedule-based segmentation preserves both the sea area traversed and the sequence of mobile networks encountered under international roaming. A purely geometric definition, such as distance from a port, would conflate propagation distance with changes in the serving country and network and could encourage unsupported causal interpretations. The voyage leg is therefore treated as an operational reporting unit rather than as a uniform propagation zone.
Operating phase was also defined from the voyage schedule. The dataset contains 484,037 sailing records and 122,588 port-stay records. Route-level analyses use sailing records, while port-stay conditions are reported separately in Section 4.9. A sensitivity analysis based on the available port-radius flag is also presented in Section 4.9. The schedule-based definition was retained because anchorage waiting is operationally distinct from passage, whereas approach and departure occur while the vessel remains under way.
3.2. Onboard Multi-RAT System
Shipboard sensing and monitoring data were aggregated by an onboard data-bridge unit and forwarded to a shore control centre through a multi-RAT gateway (Figure 2). The measurements characterize the cellular and GEO VSAT links supporting this backhaul rather than the sensing traffic itself. Both paths were monitored during the period of active VSAT service; the tier-specific monitoring procedures and their asymmetry are described in Section 3.3.
The system was based on the multi-RAT gateway platform described in [18,19]. Cellular measurements were obtained using a Quectel EC25E0GL LTE/WCDMA module with a standard commercial subscription and international roaming. The terminal used the home network in Korean waters and an available visited network elsewhere under the roaming agreement. The serving network was therefore route dependent and was not controlled by the vessel. Reception used two deck-mounted 1.5-GHz dipole antennas with 2 dBi gain, and LTE multiple-input multiple-output (MIMO) was not enabled.
The GEO VSAT subsystem used a contracted maritime service with regional coverage, an iDirect X7 terminal, and a 1-m Intellian maritime antenna. The service profiles specified maximum information rates of 512 kbps to 2 Mbps and committed information rates of 128 to 256 kbps. The active VSAT service period is defined in Section 3.5.
The cellular antennas were connected using LMR-600 cables of unrecorded length. Detailed VSAT installation and cabling information was unavailable because the service provider performed the installation. Cellular signal levels are therefore interpreted as terminal-side measurements rather than calibrated antenna-input values. The installed cellular terminal supported LTE and WCDMA only; 5G New Radio was outside the scope of the campaign. Because WCDMA remained a substantial serving RAT on several voyage legs (Section 4.2), the results characterize the LTE/WCDMA service available through the measured commercial roaming configuration rather than the capabilities of newer terrestrial networks.
3.3. Measurement Indicators, Sampling, and Monitoring Scope
The monitoring system was configured with a nominal sampling interval of 30 s, while the median observed inter-record interval was 31–32 s. Each database record represents a newly acquired output from a monitoring cycle rather than a value carried forward from the preceding record. At this cadence, LTE records include reference signal received power (RSRP), reference signal received quality (RSRQ), and signal-to-interference-plus-noise ratio (SINR), while WCDMA records include received signal code power (RSCP) and energy per chip to interference density (Ec/Io). These indicators follow 3GPP TS 36.214 [26] and TS 25.215 [27], respectively. Because LTE and WCDMA rely on different physical-layer measurements, their signal indicators are analysed separately rather than combined into a single cross-RAT quality metric.
GEO VSAT records include receiver-reported signal-to-noise ratio (SNR), link-monitoring status, round-trip time (RTT), and packet-loss outputs. The cellular and VSAT paths terminated at different Google Public Domain Name System (DNS) endpoints. System documentation specifies RAT-specific ICMP probing at 1 Hz, whereas the analytical database stores cycle-level outputs at approximately 30-s intervals. The exported data do not preserve packet size, timeout, loss-estimation window, aggregation rule, or confirmation that every nominal cellular probe opportunity was executed. RTT is therefore interpreted as an end-to-end path measurement spanning the onboard gateway, radio access, operator network, Internet routing, and monitoring endpoint, rather than as radio-access or propagation delay alone.
Monitoring was asymmetric across tiers. GEO VSAT served as the primary WAN and was monitored continuously, whereas cellular RTT and packet-loss values were recorded only when the cellular gateway probe returned a response. Cellular delay and loss statistics are therefore conditional on responsive records and should not be interpreted as measures of route-wide cellular availability. Comparisons among LTE, WCDMA, and GEO VSAT in Section 4.7 and Section 4.8 describe the conditional responding-path distribution of each tier. Because the tiers used different monitoring regimes and sample sizes, these comparisons should not be interpreted as like-for-like assessments of reliability.
3.4. Preprocessing, Voyage Selection, and Missing-Data Handling
The final preprocessed dataset contains 607,231 records referenced by Global Positioning System (GPS) coordinates and collected between 19 July 2025 and 18 April 2026. Of these, 606,625 records belong to the 12 complete voyages and constitute the complete-voyage dataset. The remaining 606 records form a short incomplete segment collected after the final scheduled arrival and were excluded because they could not contribute to voyage-leg or cross-voyage comparisons.
Records lacking both a serving-RAT label and all cellular signal fields were treated as logging or instrumentation gaps rather than as confirmed no-service observations. These records were excluded from the valid cellular-state denominator defined in Section 3.6. The complete-voyage dataset contains 13,633 such records, including 13,117 sailing records. Missingness is concentrated in Voyage 4, where 9,939 records lack a valid cellular state; 9,938 of these occur during the Ho Chi Minh–Incheon passage. This continuous block spans 16–21 October 2025 and contains no serving-RAT label. Because the exported data do not retain sufficient diagnostic information to identify the cause, the block was treated as a terminal-side instrumentation gap. Section 4.1 presents a conservative sensitivity analysis in which all sailing records with missing cellular state are reclassified as unattached and not power-qualified. By contrast, records that explicitly reported no serving cell were retained as confirmed no-service observations and included in the denominator; these records were analysed separately from attached records that failed to satisfy the received-power criterion.
3.5. VSAT Service Period and Analysis Window
The contracted GEO VSAT service ended on 13 January 2026. Because the exported data do not preserve the exact termination time or time zone, the active-service window was defined as records timestamped through 12 January 2026 according to the database convention. This boundary is unambiguous in the available data: the final included record is timestamped 12 January 2026 at 23:59:36, and the first excluded record is timestamped 13 January 2026 at 00:00:08.
A total of 200,026 records from the boundary onward were excluded from analyses of VSAT response, SNR, latency, and joint cellular–GEO state. These records were treated as outside the contracted service window rather than as VSAT outages, and the voyage spanning the boundary was retained and partitioned by timestamp. As a result, cellular-only analyses include all 12 voyages, whereas VSAT and joint cellular–GEO analyses cover the period from 19 July 2025 to 12 January 2026 and therefore represent a narrower seasonal window.
3.6. Analysis Sets and Denominators
The analyses use six record sets, each defined for a specific research purpose. Table 1 summarizes their inclusion criteria, record counts, and primary uses. All percentages are calculated using the analysis set explicitly identified in the corresponding text, table, or figure.
The complete-voyage dataset contains 606,625 records from the 12 complete voyages, comprising 484,037 sailing records and 122,588 port-stay records. Cellular-state analyses retain records reporting LTE, WCDMA, or an explicit no-service state and exclude records lacking both a serving-RAT label and cellular signal measurements, as defined in Section 3.4. This results in 470,920 valid cellular-state sailing records for route-level analyses of attachment, no-service occurrence, and received-power qualification.
The joint-analysis set comprises 319,363 valid sailing records collected during the active VSAT service period defined in Section 3.5. This set is used to evaluate cellular–GEO complementarity, sensitivity to candidate VSAT SNR thresholds, and retrospective cellular-first allocation. Port-stay conditions are analysed separately using 122,072 valid cellular-state records. Combining the valid sailing and port-stay sets yields 592,992 all-phase records, which are used only to illustrate the effect of mixing operating phases and not for voyage-leg or policy analyses.
3.7. Received-Power Qualification and VSAT Probe-Response Criteria
A cellular record was classified as received-power-qualified when LTE RSRP was at least −100 dBm or WCDMA RSCP was at least −85 dBm. These screening thresholds indicate only that the recorded received power satisfied the adopted analytical criterion; they do not establish IP-layer (Internet Protocol layer) reachability, throughput, packet delivery, or application-level availability. The analysis therefore distinguishes three levels of cellular evidence: network attachment, received-power qualification, and observed gateway responsiveness. Because RSRP and RSCP are different physical quantities, the two thresholds are not calibrated to an equivalent service level, and RAT-specific results are reported where relevant. Section 4.4 evaluates the stability of voyage-leg results under uniform and RAT-specific threshold shifts of up to ±5 dB rather than attempting to identify an application-optimal threshold.
A valid GEO VSAT probe response required a positive stored RTT and packet loss below 100%. Records without populated RTT and packet-loss fields were treated as non-responsive unknown outcomes in the joint-state analysis. Among the 30 such records, 12 remained cellular-qualified and 18 entered the residual neither-tier category. Their small number did not affect the reported percentages at the stated precision.
The VSAT receiver used −100 dB as a no-signal SNR sentinel. The 43 sentinel records were excluded from numerical SNR analyses but retained their observed probe-response classification. For a candidate threshold , a VSAT record was classified as SNR-qualified only when a valid probe response was observed and the reported SNR was at least . The threshold was treated as an analytical sensitivity parameter rather than as a standardized service requirement.
The stored VSAT link-status label and the observed probe outcome were retained as separate variables. When the two disagreed, the probe outcome was used in the primary joint-state and retrospective allocation analyses because it indicated a completed monitored exchange. The stored status label was used only in the sensitivity analysis.
3.8. Cross-Voyage Uncertainty Analysis
Consecutive records collected along a vessel trajectory are temporally and spatially correlated. The approximately 30-s records were therefore not treated as independent experimental units. Record-level data were retained for pooled descriptive statistics, whereas uncertainty was assessed using complete voyages as the resampling unit in a cluster bootstrap [28].
For each voyage leg, voyages were sampled with replacement and all records from the selected voyages were pooled within each bootstrap replicate. This procedure was repeated 10,000 times using a fixed random seed. The 2.5th and 97.5th percentiles of the bootstrap distribution were used to form the 95% percentile interval [29,30].
Leave-one-voyage-out estimates and unweighted voyage-level summaries were also reported to assess sensitivity to individual voyages and to differences in voyage duration. These analyses describe between-voyage stability within the specific vessel, route, subscription, and observation period examined in this study. Because each voyage leg included only 10 or 11 voyage clusters, the resulting intervals should not be interpreted as population-level confidence bounds.
3.9. Retrospective Link-Selection Policy, Sensitivity Scenario, and Buffered-Interval Definition
A received-power-based cellular-first policy and a gateway-status-restricted sensitivity scenario were evaluated retrospectively using the joint-analysis set. Both followed the same assignment order: cellular first, GEO VSAT second, and store-and-forward when neither tier satisfied the applicable criterion. Under the received-power-based policy, cellular was selected when the LTE or WCDMA received-power criterion defined in Section 3.7 was satisfied. Otherwise, GEO VSAT was selected when a valid probe response was observed and the reported SNR was at least the candidate threshold . All remaining records were assigned to store-and-forward.
The gateway-status-restricted scenario used the same assignment order but required both received-power qualification and a reachable cellular gateway status for cellular selection. This stricter definition was used only as a sensitivity scenario because the monitoring data could not distinguish an unavailable cellular path from a monitoring cycle in which the cellular probe session was not maintained. Among the 92,079 received-power-qualified records, 23.6% had a reachable gateway status. The policy and sensitivity scenario therefore represent alternative evidence requirements rather than operational upper and lower bounds. In both cases, the candidate minimum VSAT SNR threshold was treated as an analytical sensitivity parameter, not as a standardized service requirement or an application-optimized setting, because the campaign did not measure the application-specific throughput, delay constraints, or utility functions needed to identify such an optimum.
Buffered intervals were constructed separately for each voyage by grouping consecutive store-and-forward records. A new interval began when the time gap between adjacent records exceeded 90 s, preventing a monitoring interruption from being classified as a continuous backhaul outage. For an interval extending from record i to record j, duration was calculated as the elapsed time between their timestamps plus one median monitoring cycle of 31 s. A single-record interval was therefore assigned a duration of 31 s. The interval distribution was summarized by the number of intervals, total buffered time, 90th-percentile duration, maximum duration, and the number of intervals lasting at least 30 min.
All assignments were retrospective. The campaign did not redirect operational sensing traffic, maintain application queues, or experimentally forward buffered data according to the derived states. The results therefore quantify how the recorded states would have been classified under the policy and sensitivity scenario, rather than the performance of a deployed multi-RAT control system.
4. Results
This section reports the empirical results of the measurement campaign in the order in which the analytical procedures were introduced in Section 3. It first presents the overall dataset composition and its sensitivity to missing cellular-state records, followed by voyage-leg cellular connectivity states, cross-voyage stability, and sensitivity to the received-power thresholds. It then reports serving-RAT transition behaviour, cellular–GEO VSAT complementarity, and GEO probe-response delay and packet loss, and concludes with the retrospective evaluation of the link-selection policy and sensitivity scenario together with the effect of port-stay records on cellular connectivity statistics. Unless otherwise noted, percentages are calculated over the analysis set explicitly identified in each subsection, following the denominators defined in Section 3.6.
4.1. Dataset Overview and Sensitivity to Missing Cellular-State Records
The complete-voyage dataset contains 606,625 records from 12 voyages, comprising 484,037 sailing records and 122,588 port-stay records. Table 2 summarizes the voyage periods, durations, and record counts. Among the sailing records, 470,920 reported LTE, WCDMA, or an explicit no-service state and therefore constituted the valid cellular-state sailing set used in the route-level analyses. Within this valid sailing set, the terminal was attached to a cellular network in 70.30% of records, while 28.02% satisfied the adopted received-power criterion. This difference shows that network attachment and received-power qualification represent distinct cellular states and supports their separate treatment in the subsequent analyses.
The remaining 13,117 sailing records lacked both a serving-RAT label and cellular signal measurements and were treated as instrumentation or logging gaps. As described in Section 3.4, these records were concentrated in the Voyage 4 Ho Chi Minh–Incheon passage. They were excluded from the primary cellular-state denominator rather than classified as confirmed no-service records.
A conservative sensitivity analysis reclassified all sailing records with missing cellular state as unattached and not received-power-qualified. Under this assumption, the pooled attachment fraction decreased from 70.30% to 68.40%, and the received-power-qualified fraction decreased from 28.02% to 27.26%. The effect at the voyage-leg level was less than 0.15 percentage points for all legs except Ho Chi Minh–Incheon, where the concentration of missing records in Voyage 4 reduced the qualified fraction by 1.47 percentage points.
This conservative treatment did not change the principal route-level findings. Cellular attachment remained substantially more frequent than received-power qualification, and the contrast between the strongest coastal leg and the weakest offshore leg was preserved. The following analyses therefore use the valid cellular-state sailing set as the primary denominator, with the conservative reclassification retained as a sensitivity check.
4.2. Cellular Connectivity States by Voyage Leg
Table 3 and Figure 3 summarize cellular attachment, received-power qualification, explicit no-service states, and serving-RAT composition across the six recurring voyage legs. All percentages are calculated over the valid cellular-state sailing records defined in Section 3.6. Cellular conditions varied markedly among voyage legs. Incheon–Busan was the strongest segment, with 99.9% attachment and 77.1% of records satisfying the RAT-specific received-power criterion. Shanghai–Ho Chi Minh was the weakest, with a received-power-qualified fraction of 17.3% and an explicit no-service share of 43.8%. The remaining four legs had qualified fractions ranging from 21.5% to 40.9%, resulting in an approximately 4.5-fold difference between the strongest and weakest legs.
Figure 3a distinguishes two operationally different non-qualified states. Explicit no service indicates that the terminal reported no serving network, whereas attached below criterion indicates that a serving RAT was present but the measured received power did not satisfy the selected threshold. The latter state was particularly common on the two legs between Ho Chi Minh City and Laem Chabang. Neither state alone establishes application-level availability because received power and end-to-end path responsiveness represent different levels of evidence.
Serving-RAT composition also differed by leg (Figure 3b). LTE dominated the two northern legs, whereas WCDMA accounted for most valid records on the two Laem Chabang legs. The longer offshore legs showed more mixed RAT compositions. Because the terminal used a standard commercial roaming subscription, these differences reflect the visited networks encountered along the route rather than an onboard RAT-selection experiment. The RAT-specific qualification results should therefore be interpreted as operating context rather than as a direct LTE–WCDMA performance comparison, since RSRP and RSCP are different physical measurements and their thresholds are not calibrated to an equivalent service level.
Leg-level averages also conceal substantial variation within individual passages. Across ten equal-count temporal bins, the received-power-qualified fraction varied by 70–81 percentage points on three of the longer southern legs, compared with 33 percentage points on Incheon–Busan. The voyage leg is retained as the primary operational unit for retrospective link allocation and buffering analysis, but each leg-level value represents an aggregate across coastal, near-shore, and open-sea portions rather than uniform conditions throughout the passage.
The number of contributing voyages differs by leg because not every scheduled rotation included every passage. One voyage omitted the northern segment, and two omitted the Laem Chabang segment. Ho Chi Minh–Incheon was included in all 12 voyages, but Voyage 4 contributed no valid cellular-state records for that passage because of the missing-data block described in Section 3.4 and Section 4.1.
4.3. Cross-Voyage Stability of Received-Power Qualification
Figure 4 and Table 4 summarize cross-voyage variation using voyage-cluster bootstrap intervals, leave-one-voyage-out ranges, and voyage-level standard deviations. Complete voyages were used as the resampling unit so that the uncertainty estimates reflect variation between voyages rather than treating the approximately 30-s records as independent observations. The clearest and most stable route-level result was the separation between the two extreme legs. Incheon–Busan had a higher received-power-qualified fraction than Shanghai–Ho Chi Minh in every voyage for which both legs were observed, with pooled fractions of 77.1% and 17.3%, respectively. The intermediate legs had overlapping intervals and changed rank across voyages. The results therefore support a recurring distinction between the strongest and weakest legs, rather than a fixed ordering of all six legs.
Across all sailing records, the pooled received-power-qualified fraction was 28.02%, with a 95% voyage-cluster bootstrap interval of 25.9–30.8%. The leave-one-voyage-out estimates ranged from 26.8% to 28.4%, indicating that the campaign-wide estimate was not dominated by any single voyage. Between-voyage variability differed substantially by leg. Incheon–Busan had the widest bootstrap interval and the largest voyage-level standard deviation, whereas Ho Chi Minh–Incheon was comparatively stable (Table 4). This contrast indicates that uncertainty was driven primarily by differences among voyages rather than by the large number of approximately 30-s records within each leg. Given the limited number of contributing voyages, the intervals are interpreted as descriptive measures of cross-voyage stability rather than as population-level confidence bounds.
4.4. Sensitivity to Received-Power Thresholds
Figure 5 examines the sensitivity of voyage-leg qualification fractions to the LTE RSRP and WCDMA RSCP criteria. When both thresholds were shifted uniformly from −5 to +5 dB relative to baseline, the pooled received-power-qualified fraction decreased from 37.7% to 19.5%, compared with 28.0% at baseline. The absolute qualification fraction therefore depends substantially on the selected power criteria.
The response to the uniform shift varied among voyage legs, indicating differences in the concentration of records near the thresholds. Nevertheless, the ordering of all six legs remained unchanged across the tested range: Incheon–Busan consistently had the highest qualified fraction, while Shanghai–Ho Chi Minh remained the lowest. The broad route pattern was therefore stable when the relative stringency of the LTE and WCDMA criteria was preserved.
Because RSRP and RSCP are different physical quantities, the two criteria were also varied separately. Tightening the WCDMA criterion by 5 dB reduced the pooled qualified fraction from 28.0% to 24.0% without changing the leg ordering. Tightening only the LTE criterion by 5 dB reduced the pooled fraction to 23.5% and reversed one adjacent pair, with Busan–Shanghai falling below Ho Chi Minh–Laem Chabang. This reversal is consistent with the different serving-RAT compositions of the two legs and does not by itself demonstrate a change in propagation conditions.
Loosening either RAT-specific criterion by 5 dB increased the pooled qualified fraction to 32.9% and did not alter the ordering. Across all uniform and single-criterion shifts, the separation between the strongest and weakest legs remained unchanged, whereas the ordering of intermediate legs showed limited sensitivity to the selected criterion pair. Accordingly, the absolute qualification fractions and some comparisons among intermediate legs should be interpreted as outcomes of the adopted RAT-specific thresholds applied to the observed serving-RAT mixture; the persistent separation between the two extreme legs is more robust than a fully criterion-independent ranking of all six voyage legs.
4.5. Serving-RAT Transition Behaviour
Figure 6 summarizes changes in the recorded serving-RAT state between consecutive sailing records within the same continuous recording sequence. Records without a serving-RAT label were retained as a separate missing-label state so that logging gaps were not misclassified as confirmed service transitions. Transition frequency varied substantially by voyage leg. Incheon–Busan had the lowest rate, at 3.8 transitions per 1,000 sailing records, whereas Shanghai–Ho Chi Minh had the highest, at 133.4 transitions per 1,000 records. The pooled rate was 105.2 transitions per 1,000 records. These values describe state changes observable at the approximately 30-s sampling interval; shorter transitions occurring between monitoring cycles were not captured.
Transitions into or out of the explicit no-service state accounted for 80.2% of all recorded transitions, while direct LTE–WCDMA transitions accounted for 9.3%. Transitions involving the missing-label state represented the remaining 10.5%. When only confirmed service-state transitions are considered, no-service-related transitions account for approximately 89.6% and direct LTE–WCDMA transitions for approximately 10.4%.
These recorded label changes should not be interpreted as protocol-level handovers because the exported data do not distinguish among handover, cell reselection, detachment and reattachment, roaming registration, or other network procedures. Within this limitation, the observed transitions suggest that degradation near the edge of terrestrial coverage was more often associated with loss and recovery of cellular attachment than with direct switching between LTE and WCDMA. During such intervals, continued data delivery may require GEO fallback or store-and-forward operation.
4.6. Cellular–GEO VSAT Complementarity
The joint-analysis set comprised 319,363 valid cellular-state sailing records collected during the active GEO VSAT service period. Because the satellite service ended before the completion of the campaign, the joint-analysis window covered seven complete voyages and part of the voyage spanning the service boundary. Across the joint-analysis set, cellular satisfied the adopted received-power criterion in 28.83% of records. Among the remaining records, GEO VSAT returned a valid probe response in 99.16%. As a result, at least one tier satisfied its respective condition in 99.40% of records, leaving a residual neither-tier-qualified share of 0.60% (Table 5). Because this measure combines a cellular received-power criterion with GEO probe responsiveness, it represents link complementarity rather than application-level availability.
The residual gap varied substantially by voyage leg. Five legs had neither-tier-qualified shares between 0.06% and 0.57%, whereas Laem Chabang–Ho Chi Minh reached 3.11%. On that leg, a relatively low cellular-qualified fraction coincided with the lowest GEO response rate among cellular-non-qualified records. The two tiers therefore complemented one another less effectively than on the other recurring passages.
The stored GEO link-status label and the observed probe outcome were not always consistent. In 5.57% of joint-analysis records, the stored status indicated that the link was down even though a valid probe response was recorded; the opposite discrepancy was not observed. The primary analysis therefore used the probe outcome, which produced an overall GEO response share of 98.88%, compared with 93.32% when the stored status label was used. This difference demonstrates that the reported connectivity share depends on the operational state definition.
Introducing a candidate minimum VSAT SNR threshold substantially changed the joint-state partition. The share of records satisfying either the cellular criterion or the GEO criterion decreased from 99.40% with no SNR threshold to 97.80% at 5 dB, 93.30% at 6 dB, and 74.27% at 7 dB. The reduction between 6 and 7 dB occurred on every voyage leg and was largest on the offshore and Southeast Asian passages (Figure 7b). At 7 dB, the either-tier share ranged from 92.71% on Incheon–Busan to 64.50% on Laem Chabang–Ho Chi Minh.
The cellular received-power-qualified fractions in the joint-analysis window differed from the corresponding full-period values by no more than 2 percentage points for any voyage leg (Table 6). The shorter window therefore preserved the broad leg-level pattern, although it did not cover the full seasonal range of the cellular campaign. The candidate SNR thresholds should be interpreted as analytical sensitivity parameters that show how an additional satellite-quality requirement changes GEO assignment and residual store-and-forward demand.
4.7. GEO VSAT Probe-Response Delay and Packet Loss
Table 7 and Figure 8 summarize end-to-end round-trip time (RTT) and packet loss for records in which the monitored path returned a valid response. These distributions are conditional on responsive records and therefore describe observed responding-path performance rather than route-wide availability. Median RTT was 124.7 ms for LTE, 212.1 ms for WCDMA, and 684.7 ms for GEO VSAT. GEO VSAT had the highest median delay, while WCDMA showed the greatest spread: its 90th-percentile RTT reached 702.1 ms, slightly exceeding the GEO VSAT median. Median packet loss was zero for all three tiers, although non-zero loss occurred more frequently on GEO VSAT than on the responsive cellular paths (Table 7).
The tier distributions should be interpreted in light of the asymmetric monitoring design. GEO VSAT was monitored continuously as the primary WAN, whereas cellular RTT and packet-loss values were available only when the opportunistic cellular probe returned a response. The cellular and GEO paths also terminated at different public DNS endpoints. The reported RTT therefore includes delay across the onboard gateway, radio access, operator network, Internet routing, and endpoint response, and does not isolate radio-access or satellite-propagation delay.
Despite these limitations, the conditional distributions clarify the main delay trade-off considered in Section 4.8. GEO VSAT provided a responsive fallback for most records that did not satisfy the cellular received-power criterion, but with a median end-to-end RTT of approximately 685 ms. Application suitability should therefore be assessed against the latency and packet-loss tolerance of the intended maritime IoT traffic rather than inferred from fallback responsiveness alone [31].
4.8. Retrospective Evaluation of the Link-Selection Policy and Sensitivity Scenario
The link-selection policy and sensitivity scenario defined in Section 3.9 were evaluated over the 319,363 records in the joint-analysis set. The received-power-based cellular-first policy was used as the primary analysis because it could be applied consistently to all records containing the required cellular signal measurements. A gateway-status-restricted scenario was additionally examined to assess sensitivity to a stricter cellular eligibility condition. Both analyses retrospectively classified recorded link states rather than testing an implemented traffic-steering system.
Under the received-power-based policy, 28.83% of records were assigned to cellular, independent of the candidate VSAT SNR threshold . With no minimum SNR requirement, 70.57% were assigned to GEO VSAT and 0.60% to store-and-forward. Increasing progressively shifted records from GEO assignment to store-and-forward while leaving the cellular share unchanged (Table 8; Figure 9).
The largest change occurred between 6 and 7 dB. Over this interval, the store-and-forward share increased from 6.70% to 25.73%, while the GEO-assigned share decreased from 64.47% to 45.44%. This nonlinear response reflects the measured SNR distribution: 26.5% of valid VSAT responses were concentrated between 6 and 7 dB (Figure 10). Raising the threshold across this range therefore reclassified a large group of otherwise responsive GEO records as store-and-forward.
A stricter SNR threshold did not improve the conditional delay of the retained GEO records. Median GEO RTT was 685.0 ms with no threshold, 688.6 ms at 6 dB, and 711.5 ms at 7 dB. Within this dataset, receiver-reported SNR therefore acted mainly as an eligibility filter rather than as a latency-selection metric. Excluding lower-SNR responses reduced GEO assignment but did not yield a lower-delay fallback subset.
The buffering implications also depended on the temporal structure of the store-and-forward state. With no SNR threshold, 244 buffered intervals accounted for 16.7 h, and the longest interval lasted 2.02 h. At 7 dB, the number of intervals increased to 6,072, total buffered time to 716.5 h, and the longest interval to 9.86 h. At 10 dB, the longest interval reached 35.64 h (Table 8). These results show that aggregate store-and-forward share alone is insufficient for preliminary buffer-capacity assessment; interval count, total buffered duration, and maximum interval length must also be considered.
The 90th-percentile interval duration did not vary monotonically with . At some lower thresholds, it decreased because stricter criteria created many additional short buffered intervals even as total buffered time and the longest intervals increased. A single duration percentile therefore does not fully represent storage demand.
Threshold choice also affected between-voyage variation. Without an SNR threshold, the store-and-forward share across the eight voyages represented in the active VSAT period was 0.60 ± 0.62%. At 7 dB, it increased to 23.37 ± 20.29%, with voyage-level values ranging from 0.56% to 56.72%. The threshold therefore influenced not only the mean store-and-forward share but also the uncertainty relevant to pre-voyage storage planning.
The gateway-status-restricted scenario assigned only 6.79% of records to cellular because cellular selection required both received-power qualification and a reachable gateway status. It consequently produced larger GEO and store-and-forward shares than the primary policy at every tested threshold. Nevertheless, the main threshold-dependent pattern remained: increasing from 6 to 7 dB raised the store-and-forward share from 9.32% to 35.10%. The concentration of VSAT SNR values within this interval therefore affected both cellular eligibility definitions.
The policy and sensitivity scenario should not be interpreted as operational upper and lower bounds. The received-power-based policy may assign cellular without confirming IP-layer responsiveness, whereas the gateway-status-restricted scenario may reject records because of the asymmetric monitoring configuration rather than an actual path failure. Together, they show how the evidence used to qualify the cellular path changes retrospective tier allocation and buffering estimates. Table 8a summarizes tier allocation under both cellular eligibility definitions, and Table 8b reports conditional GEO RTT and buffered-interval statistics for the primary received-power-based policy. Because no operational traffic was redirected and no application queue was implemented, the results provide measurement-based evidence on threshold sensitivity and preliminary buffering implications rather than a live multi-RAT steering evaluation.
4.9. Effect of Port-Stay Records on Cellular Connectivity Statistics
Port stays were analysed separately because they represent a different operating phase from scheduled passages. Among the 122,588 port-stay records, 122,072 reported LTE, WCDMA, or an explicit no-service state. Cellular attachment was observed in 97.17% of these valid records, and 94.25% satisfied the adopted received-power criterion. The corresponding sailing fractions were 70.30% and 28.02%, respectively. This contrast shows that port-stay records should not be pooled with passage records when characterizing connectivity under way.
The schedule-based phase definition was retained because it better reflects vessel operation than a geometric port-radius rule. The scheduled port-stay category includes time spent alongside, at anchorage, or waiting near a port, whereas approach and departure records remain assigned to the corresponding passage while the vessel is under way. Under the geometric definition, high-qualification anchorage records would be reassigned to the sailing set, increasing its received-power-qualified fraction from 28.0% to 32.7%. This increase would result from reclassification of operating phases rather than from stronger offshore cellular conditions.
Combining sailing and port-stay records yields an all-phase received-power-qualified fraction of 41.65% across 592,992 valid cellular-state records. This pooled value reflects the recorded balance between the 28.02% sailing fraction and the 94.25% port-stay fraction and therefore does not characterize either phase independently. All voyage-leg and retrospective policy analyses consequently use sailing records only. Port-stay records are reported as a separate operational context. They indicate that delay-tolerant IoT data accumulated during passage may encounter substantially stronger cellular conditions during scheduled port stays, although actual backlog clearance would also depend on available uplink capacity and the duration of the stay.
5. Discussion
This section interprets the results reported in Section 4 for maritime IoT data delivery and multi-RAT link selection, examines the effects of state definitions and operating phases, considers the relevance of the findings to future terrestrial–non-terrestrial integration, and states the principal limitations of the study together with directions for future work. The discussion is confined to the measured deployment, route, and observation period and does not extrapolate to unmeasured vessels, technologies, or service configurations.
5.1. Implications for Maritime IoT Data Delivery
A commercial vessel functions as a mobile aggregation platform for heterogeneous sensing and monitoring data. The operational significance of the measured backhaul states therefore depends on the delivery requirements of the intended applications. Because the campaign did not instrument the shipboard application traffic itself, the following discussion relates the observed link states to representative maritime IoT delivery patterns rather than evaluating specific onboard applications.
The substantial gap between cellular attachment and received-power qualification shows that nominal network registration alone is insufficient for path selection. A maritime gateway should distinguish among network attachment, satisfaction of the RAT-specific received-power criterion, and observed data-path responsiveness. Delivery planning should also be voyage-leg specific because a route-wide average can obscure the weak intervals that determine the need for satellite fallback or deferred delivery.
Traffic requiring prompt or highly reliable delivery would rely more heavily on the satellite tier during weak offshore legs. GEO VSAT provided broad coverage complementarity, but its conditional end-to-end RTT was substantially higher than that of responsive cellular paths, and a residual neither-tier gap remained on some legs. The measurements therefore support the use of GEO VSAT as a coverage fallback but do not establish compliance with the latency, reliability, or throughput requirements of any specific safety-related application.
Routine telemetry, machinery logs, and environmental monitoring data are more compatible with store-and-forward delivery when their deadlines allow temporary deferral. For such traffic, preliminary buffer planning should consider the number, duration, and maximum length of buffered intervals rather than only the aggregate store-and-forward share. Stronger cellular conditions during port stays may also provide opportunities to clear accumulated data, although the required recovery time depends on backlog volume, available uplink capacity, and application deadlines, none of which were measured in this campaign.
The dataset does not support conclusions about high-rate imaging or video because continuous application throughput was not measured. Its principal design inputs are therefore the voyage-leg-specific cellular qualification pattern, the residual cellular–GEO gap, and the distribution of store-and-forward intervals. Together, these results indicate when low- and moderate-rate maritime IoT data may be transmitted under way, retained for later delivery, or require an additional access tier.
5.2. Implications for Multi-RAT Link Selection and Buffer-Capacity Planning
The results illustrate a cellular-first maritime IoT backhaul configuration in which GEO VSAT provides offshore fallback and local storage covers the remaining gap. However, the observed 99.40% either-tier condition is a measure of link complementarity rather than application-level availability because the cellular and satellite states were defined using different forms of evidence. Operational selection rules must therefore translate these measured states into application-specific requirements for delay, packet loss, throughput, and delivery deadlines.
Route dependence remains important even when overall complementarity is high. The residual neither-tier share reached 3.11% on Laem Chabang–Ho Chi Minh, compared with 0.60% across the joint-analysis set, because weak cellular qualification coincided with the lowest GEO response rate among cellular-non-qualified records. Link-selection and recovery procedures should therefore be designed with the weakest recurring passage in mind rather than relying only on the campaign-wide average.
The candidate VSAT SNR threshold had a strong effect on retrospective allocation. Increasing the threshold from 6 to 7 dB raised the store-and-forward share from 6.70% to 25.73% because many responsive GEO records were concentrated within this SNR interval. The retained GEO subset did not exhibit lower delay: median RTT increased from approximately 685 ms with no threshold to 711.5 ms at 7 dB. In this deployment, receiver-reported SNR therefore functioned primarily as an eligibility filter rather than as a latency-control variable. A stricter threshold would require independent evidence of a corresponding service benefit.
The cellular eligibility definition also affected the absolute allocation. The gateway-status-restricted sensitivity scenario shifted more records from cellular to GEO or store-and-forward than the received-power-based policy. However, the monitoring configuration could not distinguish every unavailable cellular path from a cycle in which the probe session was not maintained. The two cases therefore demonstrate sensitivity to the evidence used for cellular qualification rather than operational upper and lower bounds.
Preliminary buffer-capacity assessment must account for interruption duration as well as aggregate store-and-forward share. Under the received-power-based policy, the longest buffered interval increased from 2.02 h with no VSAT SNR threshold to 9.86 h at 7 dB and 35.64 h at 10 dB. Table 9 converts these observed maximum intervals into illustrative storage quantities for constant-rate data generation. These values are not queue-provisioning results because application traffic, protocol overhead, retransmissions, and post-recovery drainage capacity were not measured.
At a constant rate of 100 kbps, the illustrative storage quantity increases from approximately 91 MB with no SNR threshold to 444 MB at 7 dB and 1.60 GB at 10 dB. Practical buffer sizing would require additional engineering margin and sufficient post-recovery uplink capacity to clear the accumulated backlog while new data continue to arrive. These implications are derived from retrospective state assignments. No live traffic steering, queue management, or application-delivery test was performed. The results therefore inform candidate threshold selection and preliminary buffer-capacity assessment rather than demonstrate the performance of an implemented multi-RAT controller or a validated queue design.
5.3. Effects of State Definitions and Operating Phases
Maritime connectivity metrics are meaningful only when the state definition, denominator, and operating phase are explicitly specified. Network attachment, received-power qualification, and probe responsiveness represent different levels of evidence and should not be treated interchangeably as measures of availability.
The GEO status-label sensitivity analysis and the comparison between sailing and port stays show that both classification rules and phase boundaries can materially alter the reported result. Combined LTE/WCDMA qualification is likewise affected by the adopted RAT-specific thresholds and the observed serving-RAT mixture. Although threshold shifts preserved the contrast between the strongest and weakest voyage legs, they changed the relative ordering of some intermediate legs. Reproducible maritime connectivity studies should therefore report the classified state, numerical criterion, denominator, operating phase, treatment of missing records, and whether the reported metric represents radio conditions, probe responsiveness, or application-level delivery.
5.4. Relevance to Future Terrestrial–Non-Terrestrial Integration
The campaign did not evaluate IMT-2030, 5G New Radio, or standardized non-terrestrial network (NTN) procedures. Its relevance to future terrestrial–non-terrestrial integration is therefore limited to identifying operational conditions that such systems may need to accommodate, rather than validating a particular architecture or standard. First, nominal cellular attachment alone was insufficient for access selection. Steering decisions require explicitly defined evidence of radio conditions and end-to-end path responsiveness. Second, the route dependence of cellular qualification and the higher delay of GEO fallback indicate that a single access layer is unlikely to satisfy all maritime connectivity requirements. In future systems, terrestrial cellular, lower-latency non-terrestrial links such as LEO, broad-area GEO coverage, and store-and-forward delivery may serve complementary roles under different coverage and delivery conditions.
Third, access-control criteria should be evaluated together with their deferred-delivery consequences. Future multi-access control may therefore need to consider application deadlines, buffer occupancy, data-generation rate, and the expected time until the next qualifying path becomes available, rather than applying radio-quality thresholds in isolation. These observations are consistent with the ubiquitous-connectivity objectives of IMT-2030 and ongoing NTN integration efforts [20,21,22]. However, matched multi-tier measurements and live steering experiments are required to evaluate standardized implementations.
5.5. Limitations and Future Work
This study has five principal limitations. First, it examined a single container ship operating on one commercial route with one cellular subscription and terminal configuration and one GEO VSAT service. The findings therefore characterize the measured deployment and observation period rather than general maritime propagation or service-performance laws. In addition, the GEO service ended before completion of the cellular campaign, so the joint analyses cover a narrower seasonal and operational window than the cellular-only analyses.
Second, the technology and monitoring configurations constrain cross-tier comparisons. The cellular terminal supported LTE and WCDMA but not 5G New Radio. GEO VSAT was monitored continuously as the primary WAN, whereas cellular delay and packet-loss values were recorded only when the opportunistic probe returned a response. The two tiers also used different public DNS endpoints. The reported RTT values are therefore conditional end-to-end path measurements and do not isolate radio-access or propagation delay.
Third, the campaign did not measure continuous application throughput or actual shipboard IoT delivery. The retrospective policies did not control a live gateway, redirect operational traffic, or maintain application queues. The derived storage values should therefore be interpreted as illustrative buffering implications rather than as a complete queueing or capacity-provisioning model.
Fourth, the results depend on the adopted analytical definitions. The LTE, WCDMA, and VSAT thresholds are neither standardized service requirements nor calibrated to a common application objective. Allocation percentages are record weighted, missing cellular-state records were concentrated in one passage of Voyage 4, and voyage-leg aggregation does not resolve within-leg variation associated with distance from shore, serving country, or coastal infrastructure. The sensitivity analyses assess the influence of these choices but do not eliminate the underlying limitations.
Fifth, weather, sea state, vessel motion, antenna obstruction, and detailed installation losses were not recorded in a form that could be aligned consistently with the communication measurements, so these factors could not be evaluated as explanatory variables. Future work should extend the campaign to multiple vessels, routes, subscriptions, and service providers; monitor 5G, GEO, and LEO links using common endpoints and measurement procedures; and collect application traffic, queue occupancy, environmental conditions, and backlog-clearance time. Real-time link-selection experiments are also needed to determine how candidate eligibility criteria affect delivery performance in operation. Such matched measurements would support application-specific service criteria and more rigorous validation of adaptive multi-RAT control and buffer-capacity planning.
6. Conclusions
This study analysed 606,625 georeferenced monitoring records collected over 12 commercial voyages by a 1,800-TEU container ship operating between Korea and Southeast Asia. Separating sailing from port stays and using voyage legs as the primary operational unit revealed recurring route-dependent patterns that would have been obscured by route-wide or all-phase averages. During sailing, cellular attachment was reported in 70.3% of valid cellular-state records, whereas 28.0% satisfied the adopted RAT-specific received-power criteria. The qualified fraction ranged from 77.1% on Incheon–Busan to 17.3% on Shanghai–Ho Chi Minh. During the active VSAT service period, either the cellular criterion was satisfied or a valid GEO probe response was observed in 99.40% of joint-analysis records, although the residual neither-tier share reached 3.11% on Laem Chabang–Ho Chi Minh. These results describe explicitly defined monitoring states and should not be interpreted as application-level availability.
The retrospective cellular-first evaluation showed that eligibility definitions and candidate VSAT SNR thresholds materially affect tier allocation and deferred delivery. Increasing the SNR threshold from 6 to 7 dB raised the store-and-forward share from 6.70% to 25.73% without reducing the median RTT of the retained GEO records. The longest buffered interval increased from 2.02 h with no SNR threshold to 9.86 h at 7 dB and 35.64 h at 10 dB. Preliminary buffer-capacity assessment should therefore consider threshold sensitivity, interval duration, data-generation rate, and post-recovery service capacity rather than relying only on aggregate store-and-forward share.
The findings are specific to one vessel, route, cellular subscription, terminal configuration, GEO service, and observation period. In addition, the cellular and satellite tiers were monitored asymmetrically, and the candidate policies were evaluated retrospectively without live traffic steering or application queues. Within these limitations, the campaign indicates that maritime IoT backhaul studies should distinguish network attachment, received-power qualification, and monitored path responsiveness; separate operating phases; report denominators and missing-data treatment explicitly; and assess the deferred-delivery consequences of candidate link-selection criteria.
Author Contributions
Conceptualization, H.K. and C.R.; methodology, H.K.; software, H.K.; validation, H.K., C.R. and J.S.; formal analysis, H.K. and C.R.; investigation, H.K. and C.R.; data curation, H.K.; writing—original draft preparation, H.K. and C.R.; writing—review and editing, J.S.; visualization, H.K.; supervision, J.S. All authors have read and agreed to the published version of the manuscript.
Funding
This research received no external funding. The measurement platform and personnel time were provided by SyncTechno Inc.
Institutional Review Board Statement
Not applicable.
Informed Consent Statement
Not applicable.
Data Availability Statement
The raw georeferenced records are not publicly available because they contain commercially sensitive information concerning the operating vessel and communication service providers and are subject to confidentiality obligations. De-identified aggregate results and analysis procedures may be made available by the corresponding author upon reasonable request, subject to those obligations.
Acknowledgments
The authors would like to thank Ms. Hana Cho of SyncTechno Inc. for her valuable assistance with the preparation and refinement of the figures presented in this paper. The authors also gratefully acknowledge the operational support provided during the onboard measurement campaign.
Conflicts of Interest
Authors H.K. and C.R. are employees of SyncTechno Inc., which developed the multi-RAT gateway used in this study and provided the measurement platform and operational support. The authors were responsible for the study design, analysis, interpretation, and manuscript preparation. No mobile or satellite service provider had any role in the study design, analysis, interpretation, or decision to publish. The authors declare no other conflicts of interest.
Abbreviations
The following abbreviations are used in this manuscript:
| DNS | Domain Name System |
| GEO | Geostationary Earth Orbit |
| GPS | Global Positioning System |
| ICMP | Internet Control Message Protocol |
| IoT | Internet of Things |
| IP | Internet Protocol |
| LEO | Low Earth Orbit |
| LTE | Long-Term Evolution |
| MIMO | Multiple-Input Multiple-Output |
| NTN | Non-Terrestrial Network |
| RAT | Radio Access Technology |
| RSCP | Received Signal Code Power |
| RSRP | Reference Signal Received Power |
| RSRQ | Reference Signal Received Quality |
| RTT | Round-Trip Time |
| SINR | Signal-to-Interference-plus-Noise Ratio |
| SNR | Signal-to-Noise Ratio |
| TEU | Twenty-foot Equivalent Unit |
| VSAT | Very Small Aperture Terminal |
| WAN | Wide Area Network |
| WCDMA | Wideband Code Division Multiple Access |
References
- Alqurashi, F.S.; Trichili, A.; Saeed, N.; Ooi, B.S.; Alouini, M.S. Maritime Communications: A Survey on Enabling Technologies, Opportunities, and Challenges. IEEE Internet Things J. 2023, 10, 3525–3547. [Google Scholar] [CrossRef]
- Xia, T.; Wang, M.M.; Zhang, J.; Wang, L. Maritime Internet of Things: Challenges and Solutions. IEEE Wirel. Commun. 2020, 27, 188–196. [Google Scholar] [CrossRef]
- Wang, J.; Zhou, H.; Li, Y.; Sun, Q.; Wu, Y.; Jin, S.; Quek, T.Q.S.; Xu, C. Wireless Channel Models for Maritime Communications. IEEE Access 2018, 6, 68070–68088. [Google Scholar] [CrossRef]
- Hu, X.; Lin, B.; Lu, X.; Wang, P.; Cheng, N.; Yin, Z.; Zhuang, W. Performance Analysis of End-to-End LEO Satellite-Aided Shore-to-Ship Communications: A Stochastic Geometry Approach. IEEE Trans. Wirel. Commun. 2024, 23, 11753–11769. [Google Scholar] [CrossRef]
- Wang, Y.; Feng, W.; Wang, J.; Quek, T.Q.S. Hybrid Satellite-UAV-Terrestrial Networks for 6G Ubiquitous Coverage: A Maritime Communications Perspective. IEEE J. Sel. Areas Commun. 2021, 39, 3475–3490. [Google Scholar] [CrossRef]
- Xu, J.; Kishk, M.A.; Alouini, M.S. Space-Air-Ground-Sea Integrated Networks: Modeling and Coverage Analysis. IEEE Trans. Wirel. Commun. 2023, 22, 6298–6313. [Google Scholar] [CrossRef]
- Lindenbergs, A.; Muehleisen, M.; Payaró, M.; Kõrbe Kaare, K.; Zaglauer, H.W.; Scholliers, J.; Sadam, A.; Kuhi, K.; Nykänen, L. Seamless 5G Multi-Hop Connectivity Architecture and Trials for Maritime Applications. Sensors 2023, 23, 4203. [Google Scholar] [CrossRef]
- Pilvik, R.; Jairus, T.; Sadam, A.; Nõmmela, K.; Kõrbe Kaare, K.; Scholliers, J. Exploitability of Maritime Fleet-Based 5G Network Extension. Electronics 2025, 14, 2210. [Google Scholar] [CrossRef]
- Wei, T.; Feng, W.; Chen, Y.; Wang, C.X.; Ge, N.; Lu, J. Hybrid Satellite-Terrestrial Communication Networks for the Maritime Internet of Things: Key Technologies, Opportunities, and Challenges. IEEE Internet Things J. 2021, 8, 8910–8934. [Google Scholar] [CrossRef]
- Huo, Y.; Dong, X.; Beatty, S. Cellular Communications in Ocean Waves for Maritime Internet of Things. IEEE Internet Things J. 2020, 7, 9965–9979. [Google Scholar] [CrossRef]
- 3GPP. Technical Specification (TS) 22.119, V19.0.0, Release 19, 3rd Generation Partnership Project (3GPP). Maritime Communication Services over 3GPP System, Sophia Antipolis, France, 2025.
- Zhou, M.T.; Hoang, V.; Harada, H.; Pathmasuntharam, J.; Wang, H.; Kong, P.Y.; Ang, C.W.; Ge, Y.; Wen, S. TRITON: High-Speed Maritime Wireless Mesh Network. IEEE Wirel. Commun. 2013, 20, 134–142. [Google Scholar] [CrossRef]
- Campos, R.; Oliveira, T.; Cruz, N.; Matos, A.; Almeida, J.M. BLUECOM+: Cost-Effective Broadband Communications at Remote Ocean Areas. In Proceedings of the OCEANS 2016—Shanghai, Shanghai, China, April 2016; pp. 1–6. [Google Scholar]
- Beckman, C.; Garcia, J.; Mikkelsen, H.; Persson, P. Starlink and Cellular Connectivity under Mobility: Drive Testing across the Arctic Circle. In Proceedings of the 2024 Wireless Telecommunications Symposium (WTS), Oakland, CA, USA, April 2024; pp. 1–9. [Google Scholar]
- Hassan, S.S.; Kim, D.H.; Tun, Y.K.; Tran, N.H.; Saad, W.; Hong, C.S. Seamless and Energy-Efficient Maritime Coverage in Coordinated 6G Space-Air-Sea Non-Terrestrial Networks. IEEE Internet Things J. 2023, 10, 4749–4769. [Google Scholar] [CrossRef]
- Saafi, S.; Vikhrova, O.; Fodor, G.; Hosek, J.; Andreev, S. AI-Aided Integrated Terrestrial and Non-Terrestrial 6G Solutions for Sustainable Maritime Networking. IEEE Netw. 2022, 36, 183–190. [Google Scholar] [CrossRef]
- Mohan, N.; Ferguson, A.E.; Cech, H.; Bose, R.; Renatin, P.R.; Marina, M.K.; Ott, J. A Multifaceted Look at Starlink Performance. In Proceedings of the ACM Web Conference 2024 (WWW ’24), Singapore, May 2024; pp. 2723–2734. [Google Scholar]
- Koo, H.; Chae, J.; Kim, W. Design and Experiment of Satellite-Terrestrial Integrated Gateway with Dynamic Traffic Steering Capabilities for Maritime Communication. Sensors 2023, 23, 1201. [Google Scholar] [CrossRef]
- Koo, H.; Ryoo, C.; Kim, W. Simultaneous Utilization of Multiple Radio Access Networks in Ubiquitous 6G Connectivity for Autonomous Ships: Opportunities and Challenges. J. Mar. Sci. Eng. 2023, 11, 2106. [Google Scholar] [CrossRef]
- ITU-R. Recommendation M.2160-0; Framework and Overall Objectives of the Future Development of IMT for 2030 and Beyond. International Telecommunication Union: Geneva, Switzerland, 2023.
- 3GPP. Technical Report (TR) 38.811, V15.4.0, Release 15, 3rd Generation Partnership Project (3GPP). Study on New Radio (NR) to Support Non-Terrestrial Networks, Sophia Antipolis, France, 2020.
- 3GPP. Technical Specification (TS) 23.501, V20.2.0, Release 20, 3rd Generation Partnership Project (3GPP). System Architecture for the 5G System (5GS), Sophia Antipolis, France, 2026.
- Fall, K. A Delay-Tolerant Network Architecture for Challenged Internets. In Proceedings of the 2003 Conference on Applications, Technologies, Architectures, and Protocols for Computer Communications (SIGCOMM ’03), Karlsruhe, Germany, August 2003; pp. 27–34. [Google Scholar]
- Cerf, V.; Burleigh, S.; Hooke, A.; Torgerson, L.; Durst, R.; Scott, K.; Fall, K.; Weiss, H. Delay-Tolerant Networking Architecture; Internet Engineering Task Force (IETF): Fremont, CA, USA, 2007. [Google Scholar]
- Wessel, P.; Smith, W.H.F. A global, self-consistent, hierarchical, high-resolution shoreline database. J. Geophys. Res. Solid Earth 1996, 101, 8741–8743. [Google Scholar] [CrossRef]
- 3GPP. Technical Specification (TS) 36.214, V19.0.0, Release 19, 3rd Generation Partnership Project (3GPP). Evolved Universal Terrestrial Radio Access (E-UTRA); Physical Layer; Measurements, Sophia Antipolis, France, 2025.
- 3GPP. Technical Specification (TS) 25.215, V19.0.0, Release 19, 3rd Generation Partnership Project (3GPP). Universal Terrestrial Radio Access (UTRA); Physical Layer; Measurements (FDD), Sophia Antipolis, France, 2025.
- Field, C.A.; Welsh, A.H. Bootstrapping Clustered Data. J. R. Stat. Soc. Ser. B Stat. Methodol. 2007, 69, 369–390. [Google Scholar] [CrossRef]
- Efron, B.; Tibshirani, R.J. An Introduction to the Bootstrap; Chapman & Hall: New York, NY, USA, 1993. [Google Scholar]
- Davison, A.C.; Hinkley, D.V. Bootstrap Methods and Their Application; Cambridge University Press: Cambridge, UK, 1997. [Google Scholar]
- ITU-T. Network Performance Objectives for IP-Based Services; Recommendation Y.1541; International Telecommunication Union: Geneva, Switzerland, 2011. [Google Scholar]
Figure 1.
Anonymised tracks of the 12 complete voyages, with the five ports of call indicated. Points represent GPS positions sampled from sailing records; port-stay records are omitted. Coastlines are derived from the GSHHG database [25].
Figure 1.
Anonymised tracks of the 12 complete voyages, with the five ports of call indicated. Points represent GPS positions sampled from sailing records; port-stay records are omitted. Coastlines are derived from the GSHHG database [25].
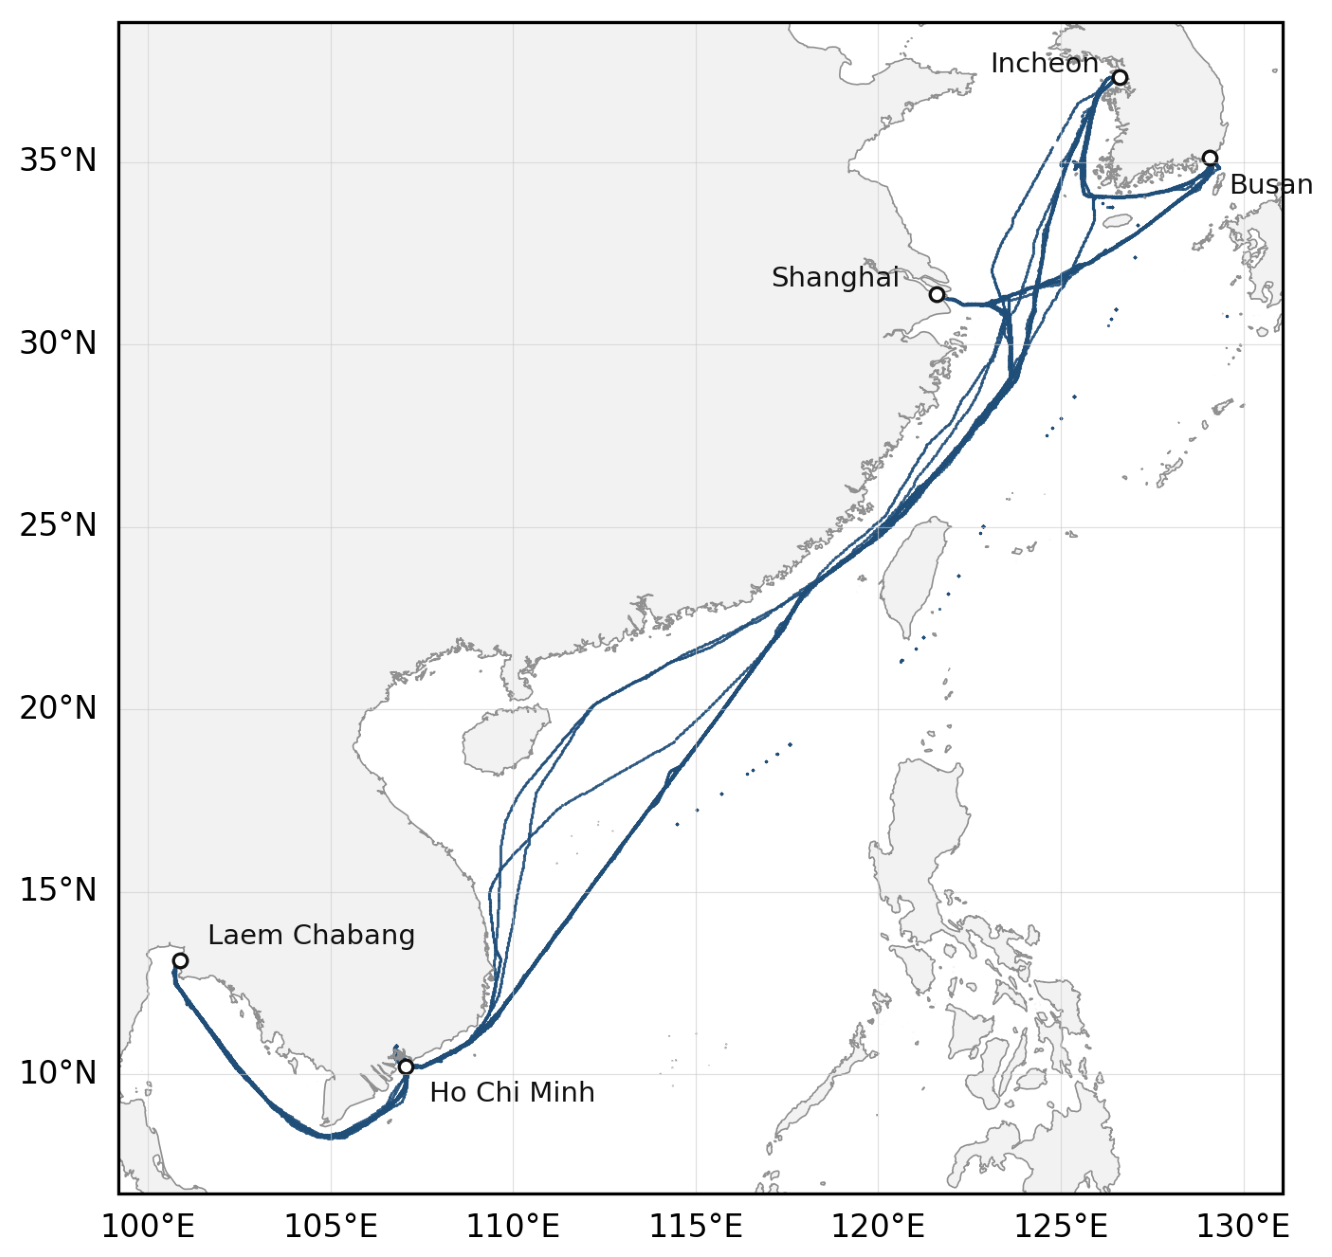
Figure 2.
Architecture of the onboard multi-RAT gateway used to aggregate shipboard sensing and monitoring data and forward it to the shore control centre over the cellular and GEO VSAT links. Blue elements denote the cellular path, purple elements the GEO satellite path, and grey segments the abstracted provider-side paths. Both paths were monitored during the period of active VSAT service.
Figure 2.
Architecture of the onboard multi-RAT gateway used to aggregate shipboard sensing and monitoring data and forward it to the shore control centre over the cellular and GEO VSAT links. Blue elements denote the cellular path, purple elements the GEO satellite path, and grey segments the abstracted provider-side paths. Both paths were monitored during the period of active VSAT service.
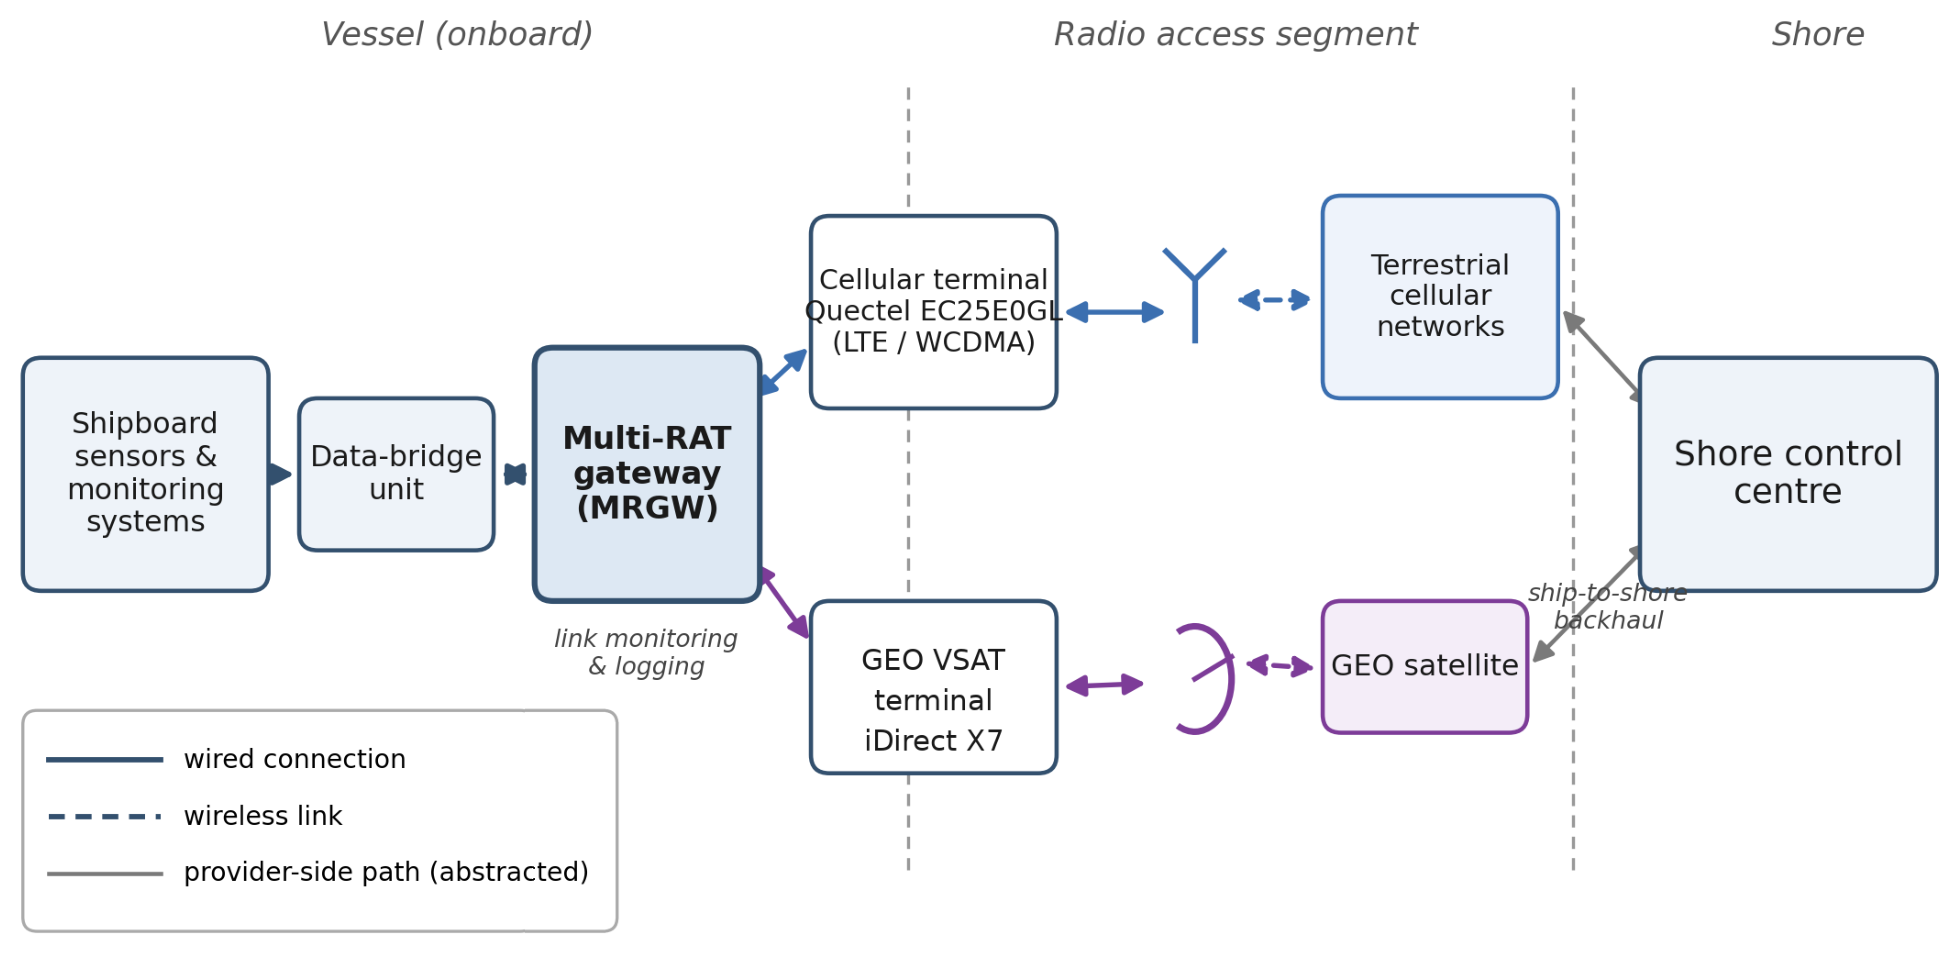
Figure 3.
Cellular connectivity states and serving-RAT composition by voyage leg, calculated over valid cellular-state sailing records. (a) Shares classified as received-power-qualified, attached below criterion, and explicit no service. (b) LTE and WCDMA shares of valid cellular-state records. Received-power qualification is based on the criteria defined in Section 3.7 and does not by itself establish end-to-end path responsiveness.
Figure 3.
Cellular connectivity states and serving-RAT composition by voyage leg, calculated over valid cellular-state sailing records. (a) Shares classified as received-power-qualified, attached below criterion, and explicit no service. (b) LTE and WCDMA shares of valid cellular-state records. Received-power qualification is based on the criteria defined in Section 3.7 and does not by itself establish end-to-end path responsiveness.
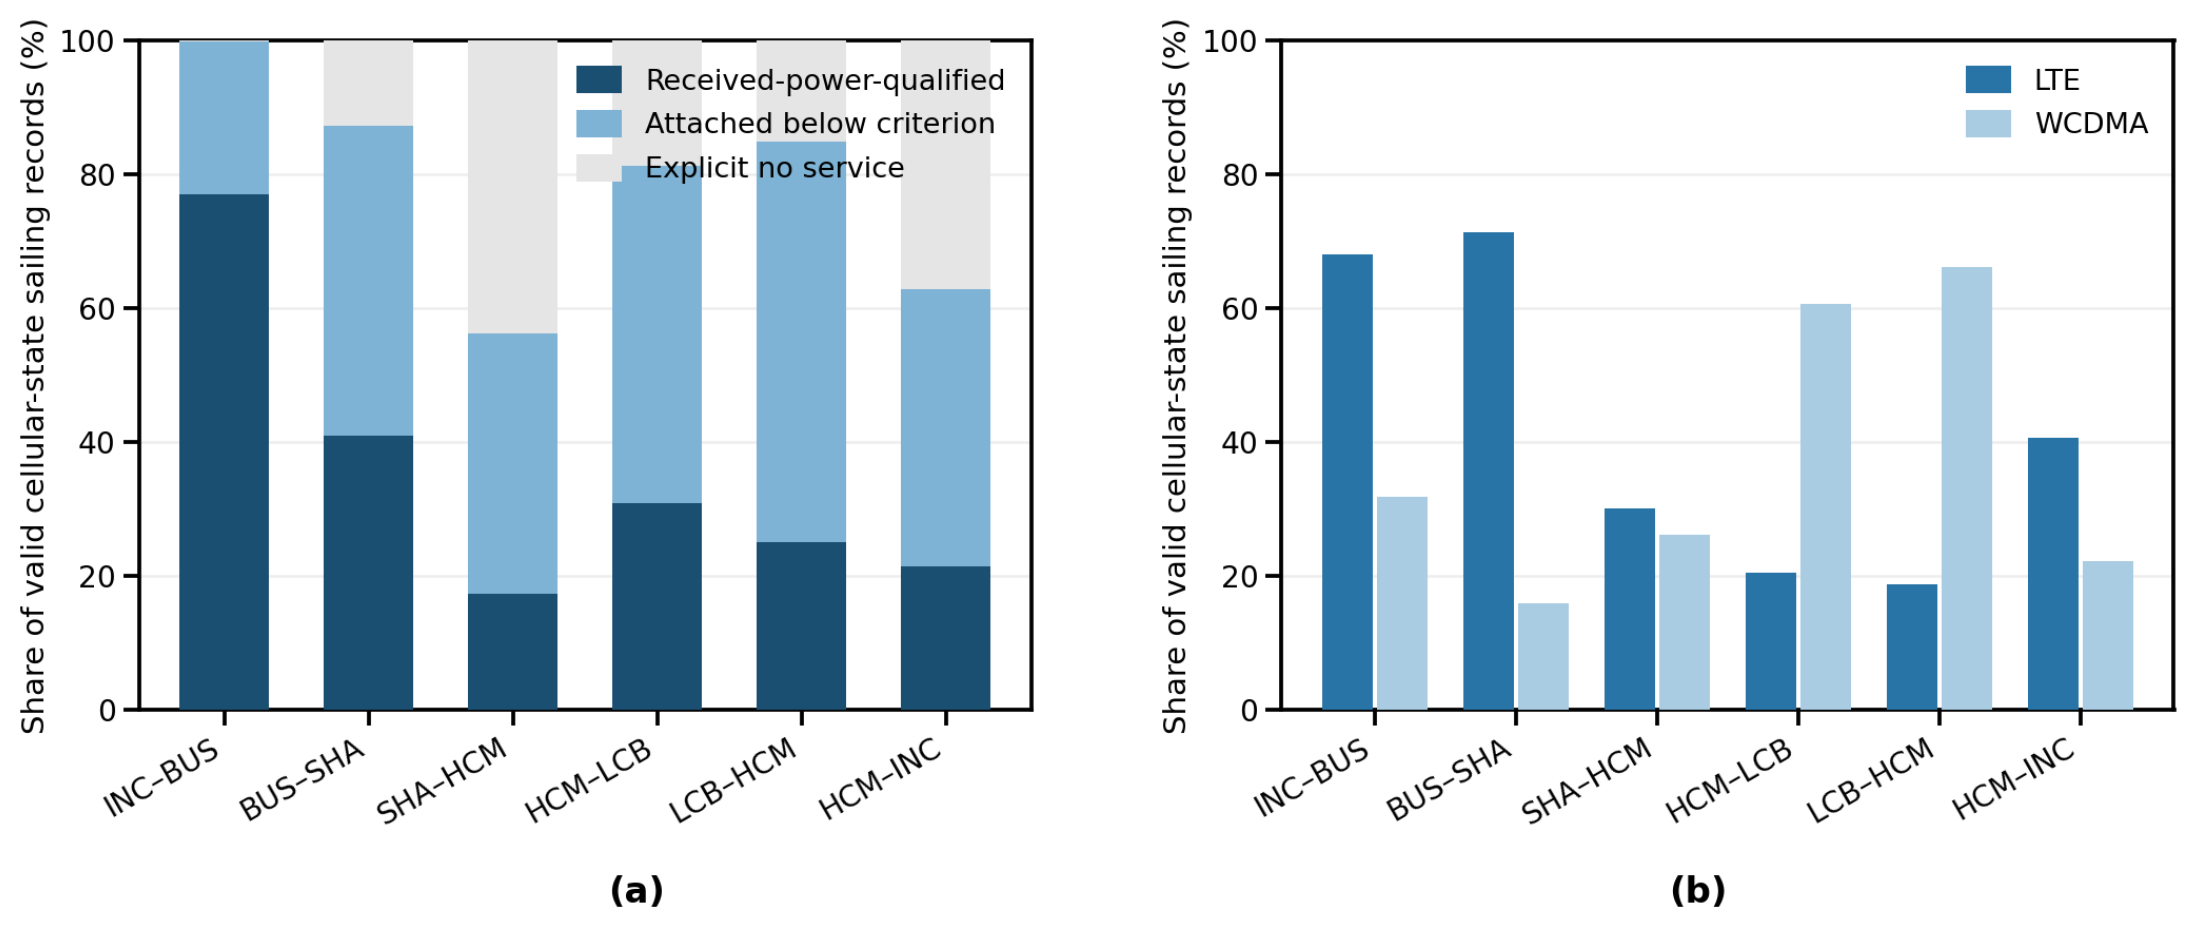
Figure 4.
Cross-voyage variation in the received-power-qualified fraction by voyage leg. Large markers indicate pooled fractions with 95% voyage-cluster bootstrap intervals, and small markers indicate the corresponding individual-voyage fractions.
Figure 4.
Cross-voyage variation in the received-power-qualified fraction by voyage leg. Large markers indicate pooled fractions with 95% voyage-cluster bootstrap intervals, and small markers indicate the corresponding individual-voyage fractions.
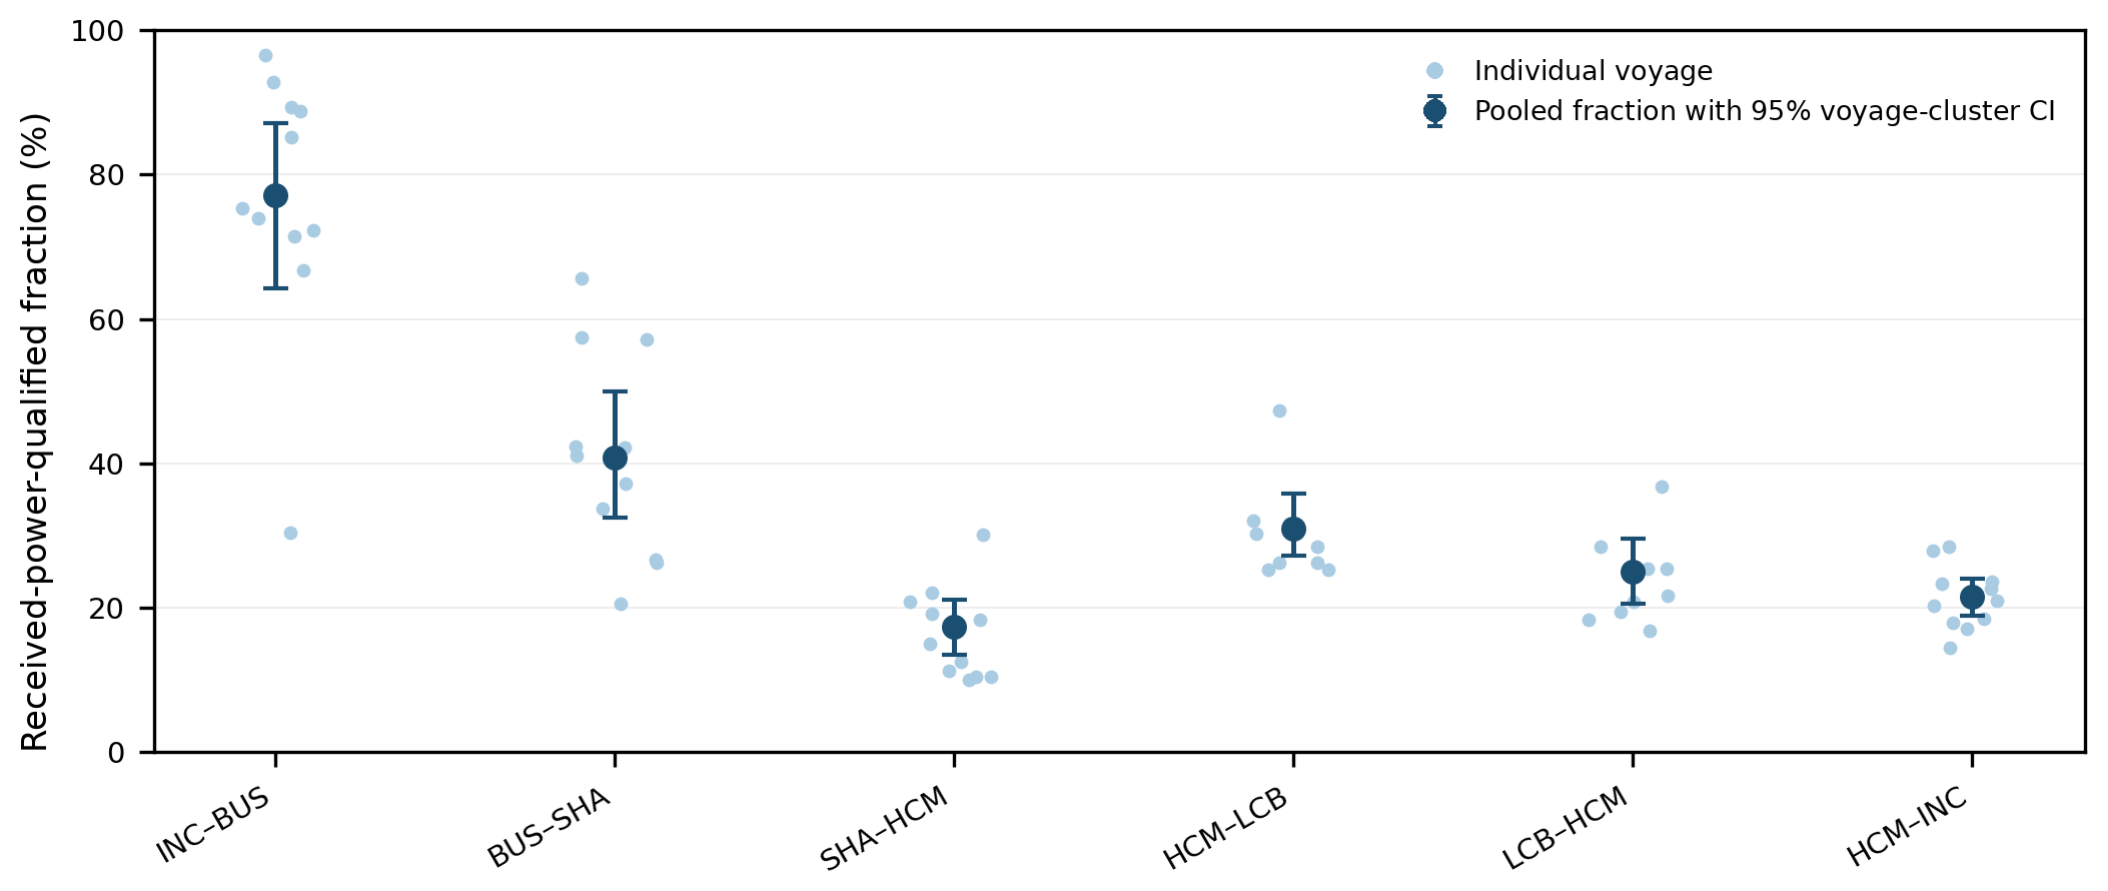
Figure 5.
Sensitivity of the received-power-qualified fraction to the LTE RSRP and WCDMA RSCP criteria. (a) Voyage-leg fractions under uniform shifts of both criteria from −5 to +5 dB relative to baseline. (b) Baseline fractions compared with separate 5 dB tightening of the LTE or WCDMA criterion.
Figure 5.
Sensitivity of the received-power-qualified fraction to the LTE RSRP and WCDMA RSCP criteria. (a) Voyage-leg fractions under uniform shifts of both criteria from −5 to +5 dB relative to baseline. (b) Baseline fractions compared with separate 5 dB tightening of the LTE or WCDMA criterion.
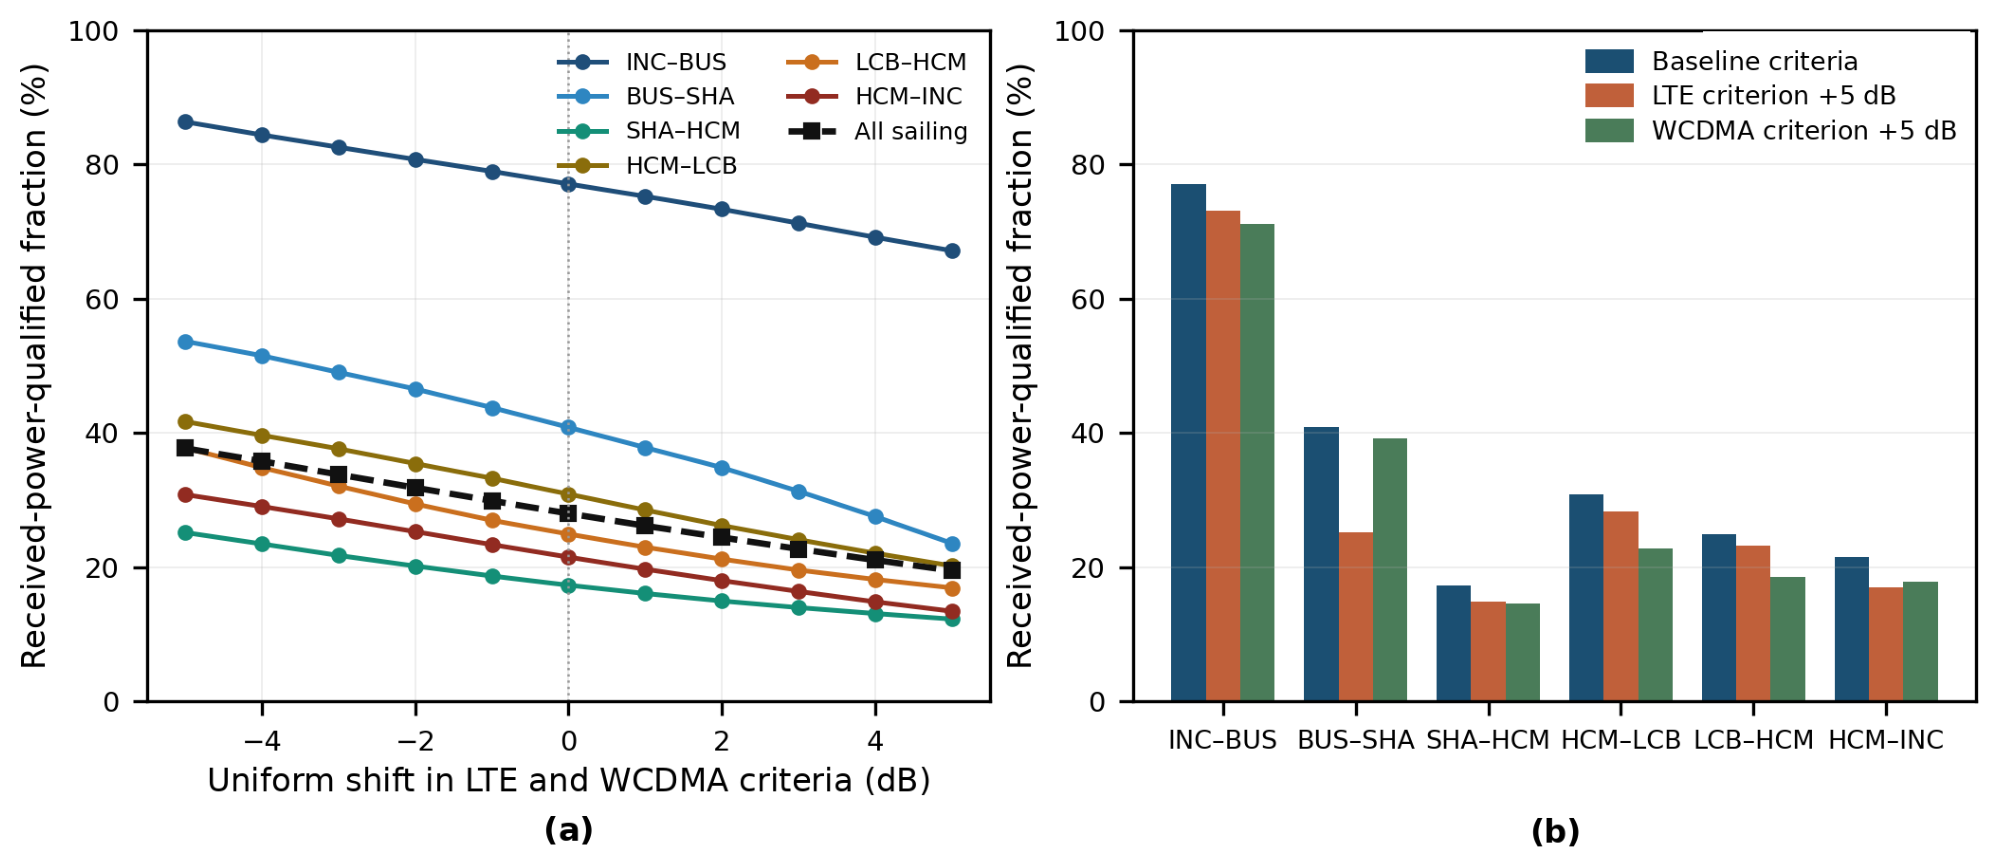
Figure 6.
Observed serving-RAT state transitions between consecutive sailing records within continuous recording sequences. (a) Recorded transitions per 1,000 sailing records by voyage leg. (b) Shares of all recorded transitions represented by confirmed service-state transition types. The displayed bars sum to 89.5% because transitions involving the missing-label state, which account for 10.5% of all recorded transitions, are omitted without renormalization. These values represent changes in recorded serving-RAT labels and should not be interpreted as protocol-level handovers.
Figure 6.
Observed serving-RAT state transitions between consecutive sailing records within continuous recording sequences. (a) Recorded transitions per 1,000 sailing records by voyage leg. (b) Shares of all recorded transitions represented by confirmed service-state transition types. The displayed bars sum to 89.5% because transitions involving the missing-label state, which account for 10.5% of all recorded transitions, are omitted without renormalization. These values represent changes in recorded serving-RAT labels and should not be interpreted as protocol-level handovers.
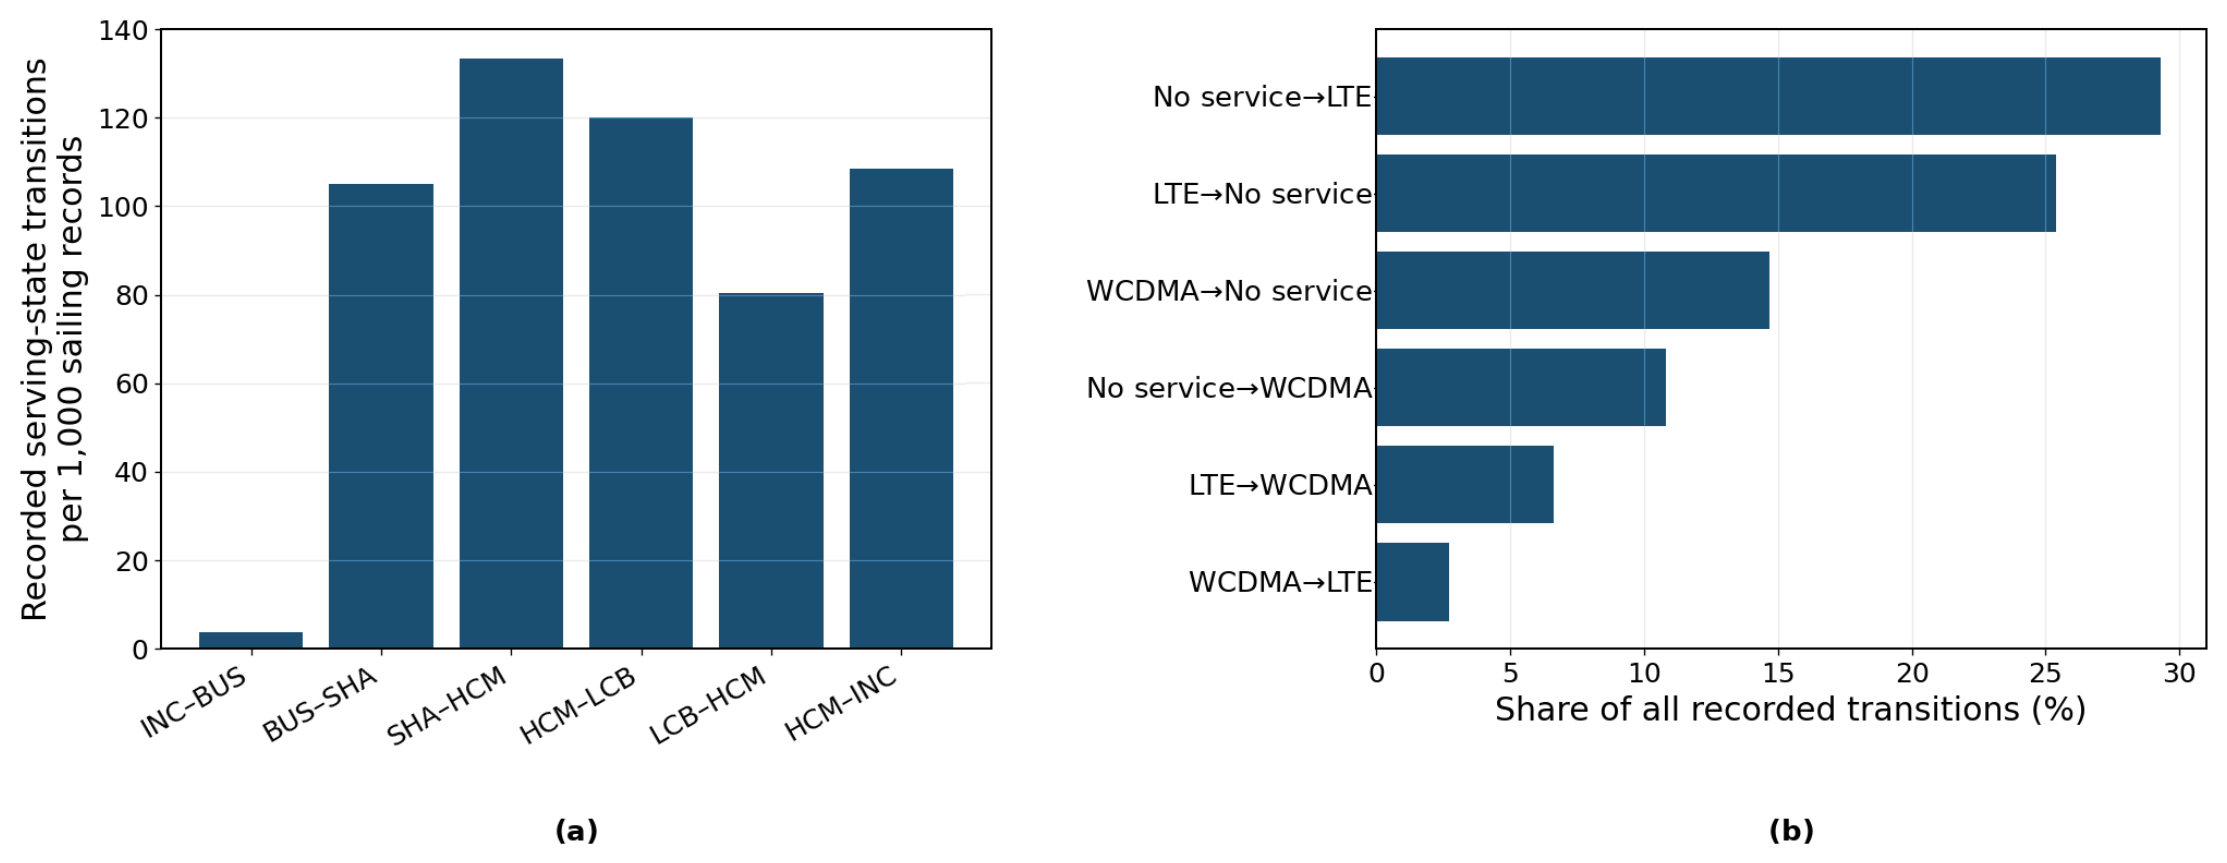
Figure 7.
Cellular–GEO VSAT complementarity by voyage leg. (a) GEO VSAT-responsive and neither-tier-qualified shares of the joint-analysis records. The vertical axis is truncated to 90–100% to make the residual share visible; cellular received-power-qualified values are reported in Table 5. (b) Share of records satisfying either the cellular received-power criterion or the GEO VSAT criterion as a function of the candidate minimum VSAT SNR threshold. The thresholds are analytical sensitivity parameters rather than standardized service requirements.
Figure 7.
Cellular–GEO VSAT complementarity by voyage leg. (a) GEO VSAT-responsive and neither-tier-qualified shares of the joint-analysis records. The vertical axis is truncated to 90–100% to make the residual share visible; cellular received-power-qualified values are reported in Table 5. (b) Share of records satisfying either the cellular received-power criterion or the GEO VSAT criterion as a function of the candidate minimum VSAT SNR threshold. The thresholds are analytical sensitivity parameters rather than standardized service requirements.
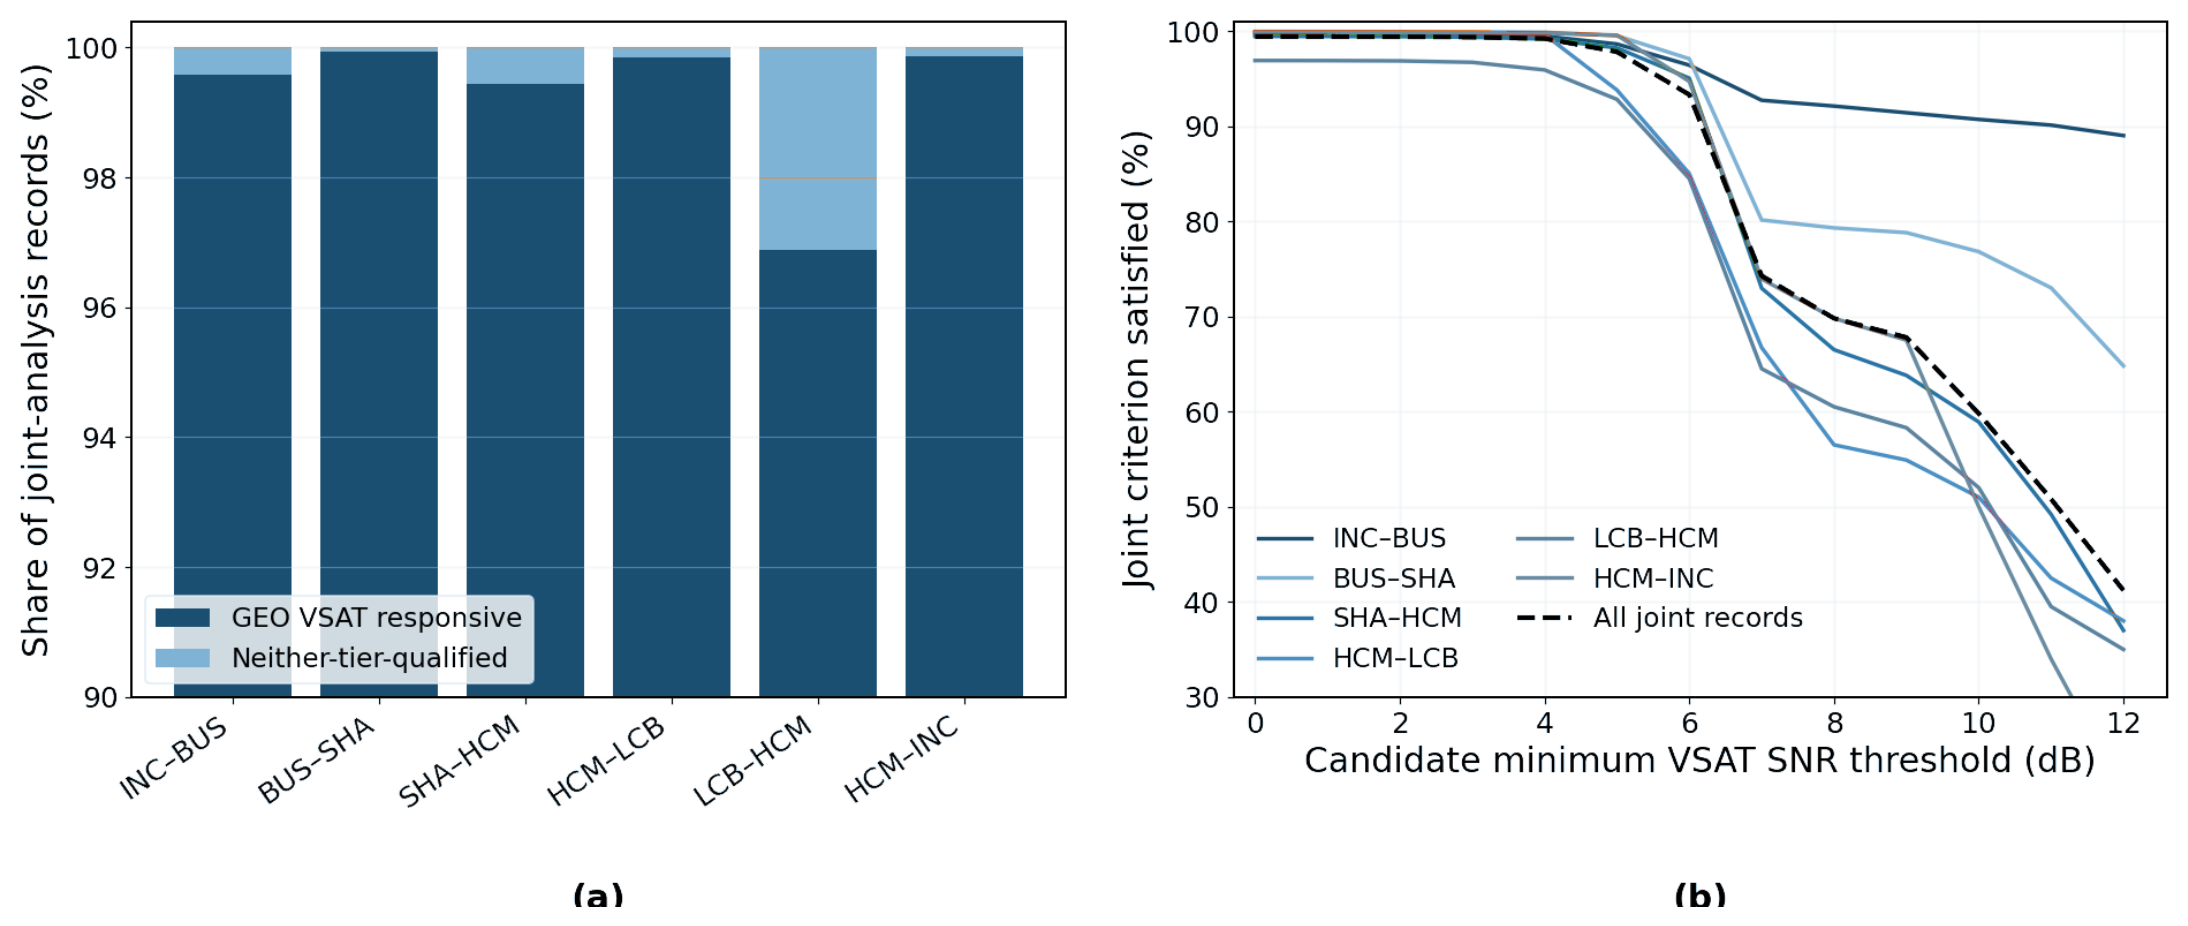
Figure 8.
Cumulative distributions of conditional end-to-end RTT for LTE, WCDMA, and GEO VSAT over records with a valid probe response. The horizontal axis uses a logarithmic scale. Differences in monitoring regime and endpoint are described in Section 3.3.
Figure 8.
Cumulative distributions of conditional end-to-end RTT for LTE, WCDMA, and GEO VSAT over records with a valid probe response. The horizontal axis uses a logarithmic scale. Differences in monitoring regime and endpoint are described in Section 3.3.
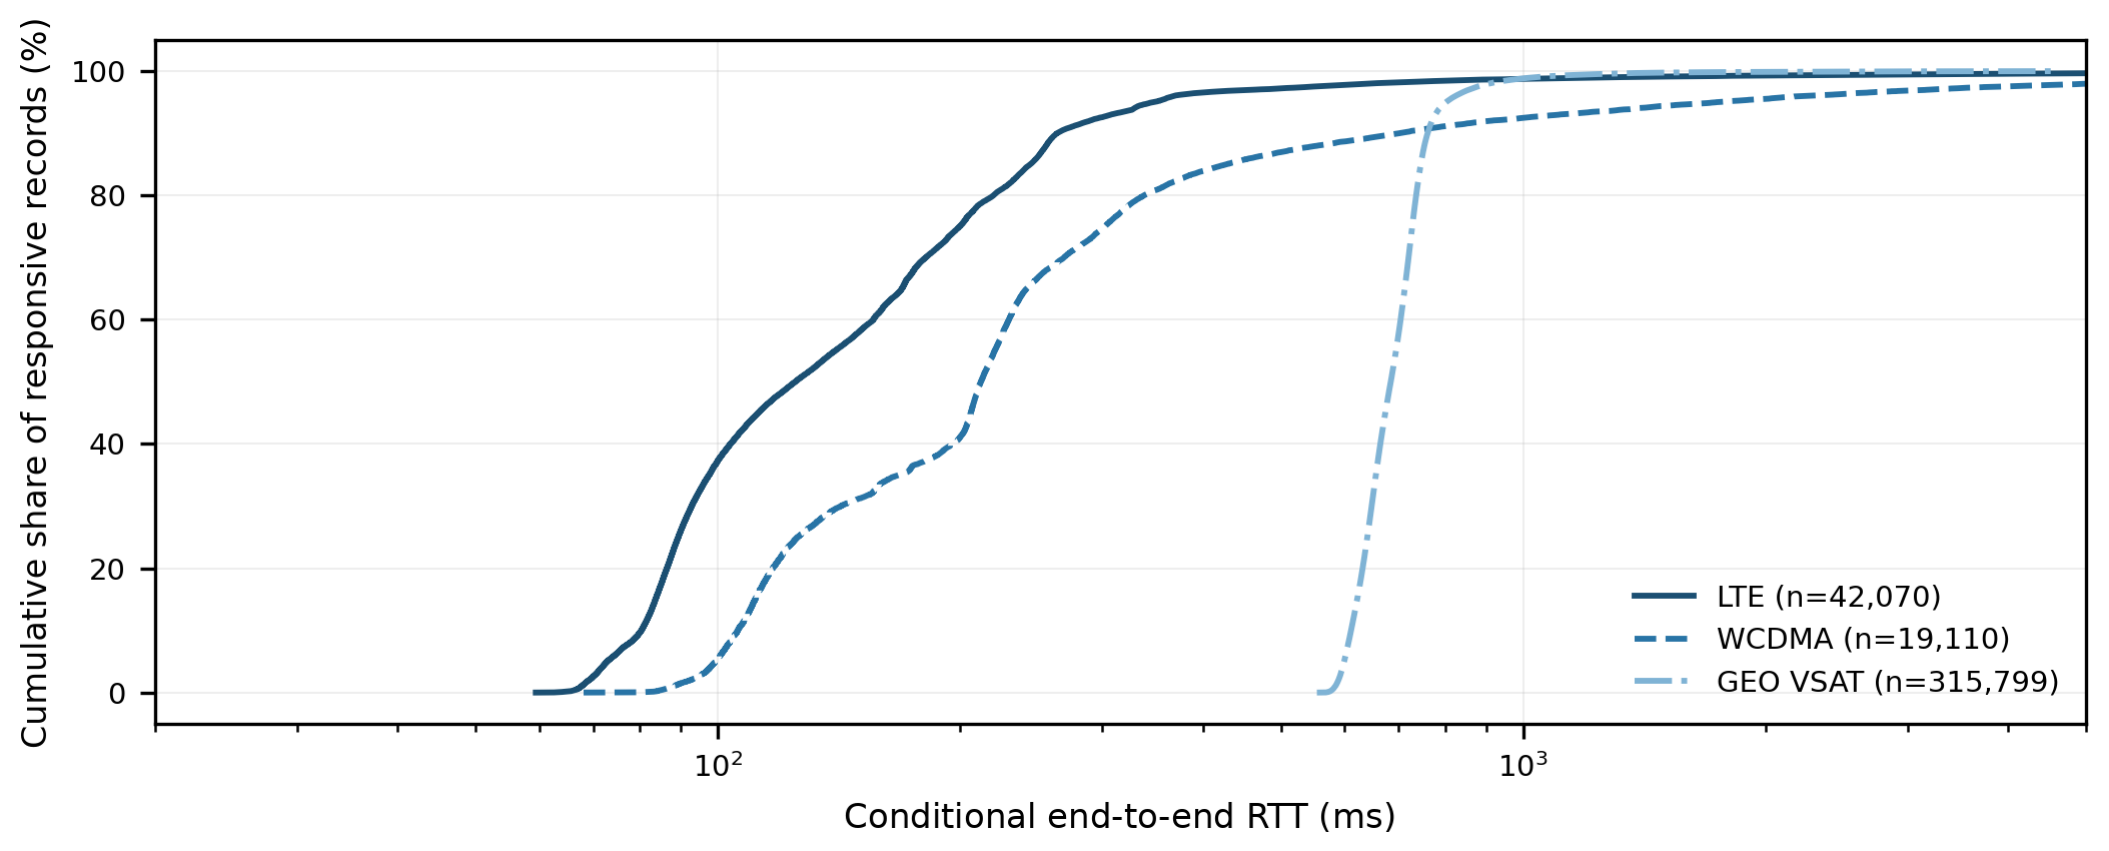
Figure 9.
Retrospective evaluation of the received-power-based cellular-first policy. (a) Tier allocation as a function of the candidate minimum VSAT SNR threshold . (b) Complementary cumulative distributions of buffered-interval duration at selected values of . Cellular assignment is independent of , while progressively stricter VSAT thresholds transfer records from GEO assignment to store-and-forward.
Figure 9.
Retrospective evaluation of the received-power-based cellular-first policy. (a) Tier allocation as a function of the candidate minimum VSAT SNR threshold . (b) Complementary cumulative distributions of buffered-interval duration at selected values of . Cellular assignment is independent of , while progressively stricter VSAT thresholds transfer records from GEO assignment to store-and-forward.
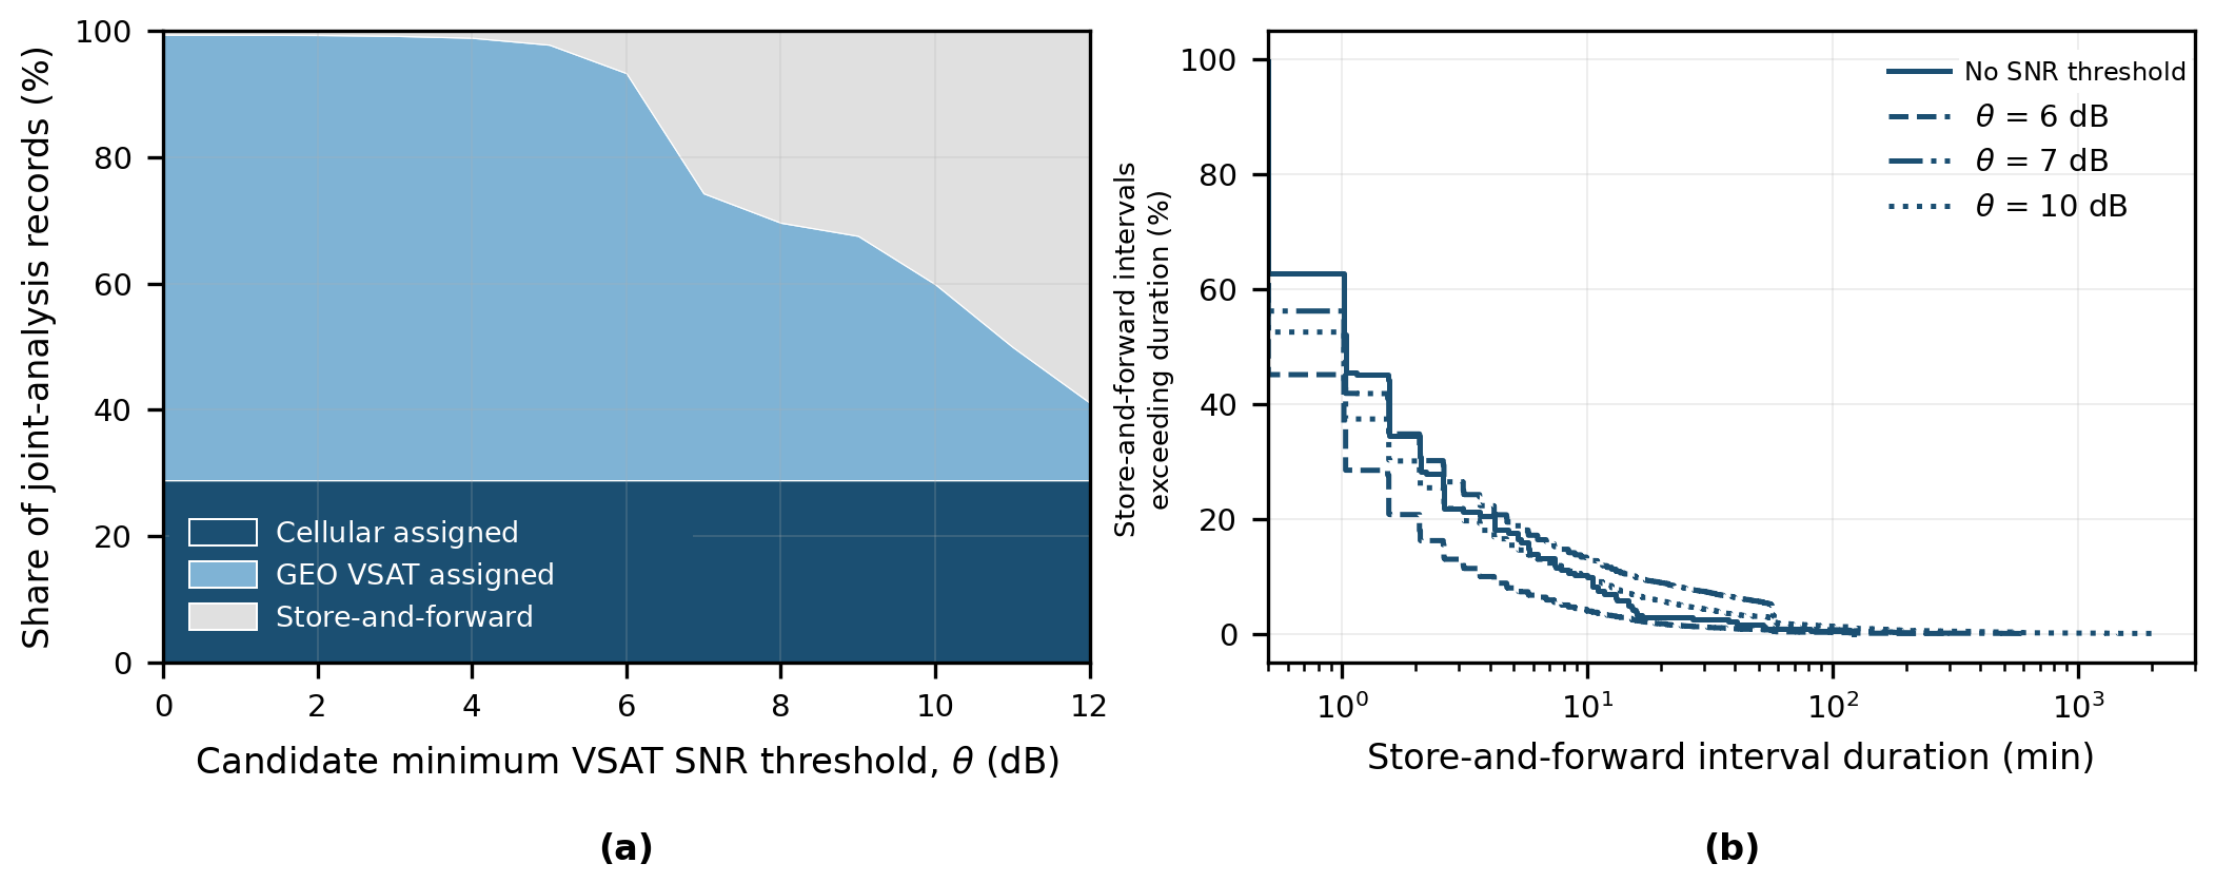
Figure 10.
Distribution of receiver-reported VSAT SNR among records with a valid probe response in the joint-analysis window. (a) Histogram with a 0.5 dB bin width; 26.5% of responsive records fall between 6 and 7 dB. (b) Fraction of responsive records meeting each candidate minimum-SNR threshold. The concentration of records between 6 and 7 dB explains the nonlinear increase in store-and-forward assignment when is raised across this interval.
Figure 10.
Distribution of receiver-reported VSAT SNR among records with a valid probe response in the joint-analysis window. (a) Histogram with a 0.5 dB bin width; 26.5% of responsive records fall between 6 and 7 dB. (b) Fraction of responsive records meeting each candidate minimum-SNR threshold. The concentration of records between 6 and 7 dB explains the nonlinear increase in store-and-forward assignment when is raised across this interval.
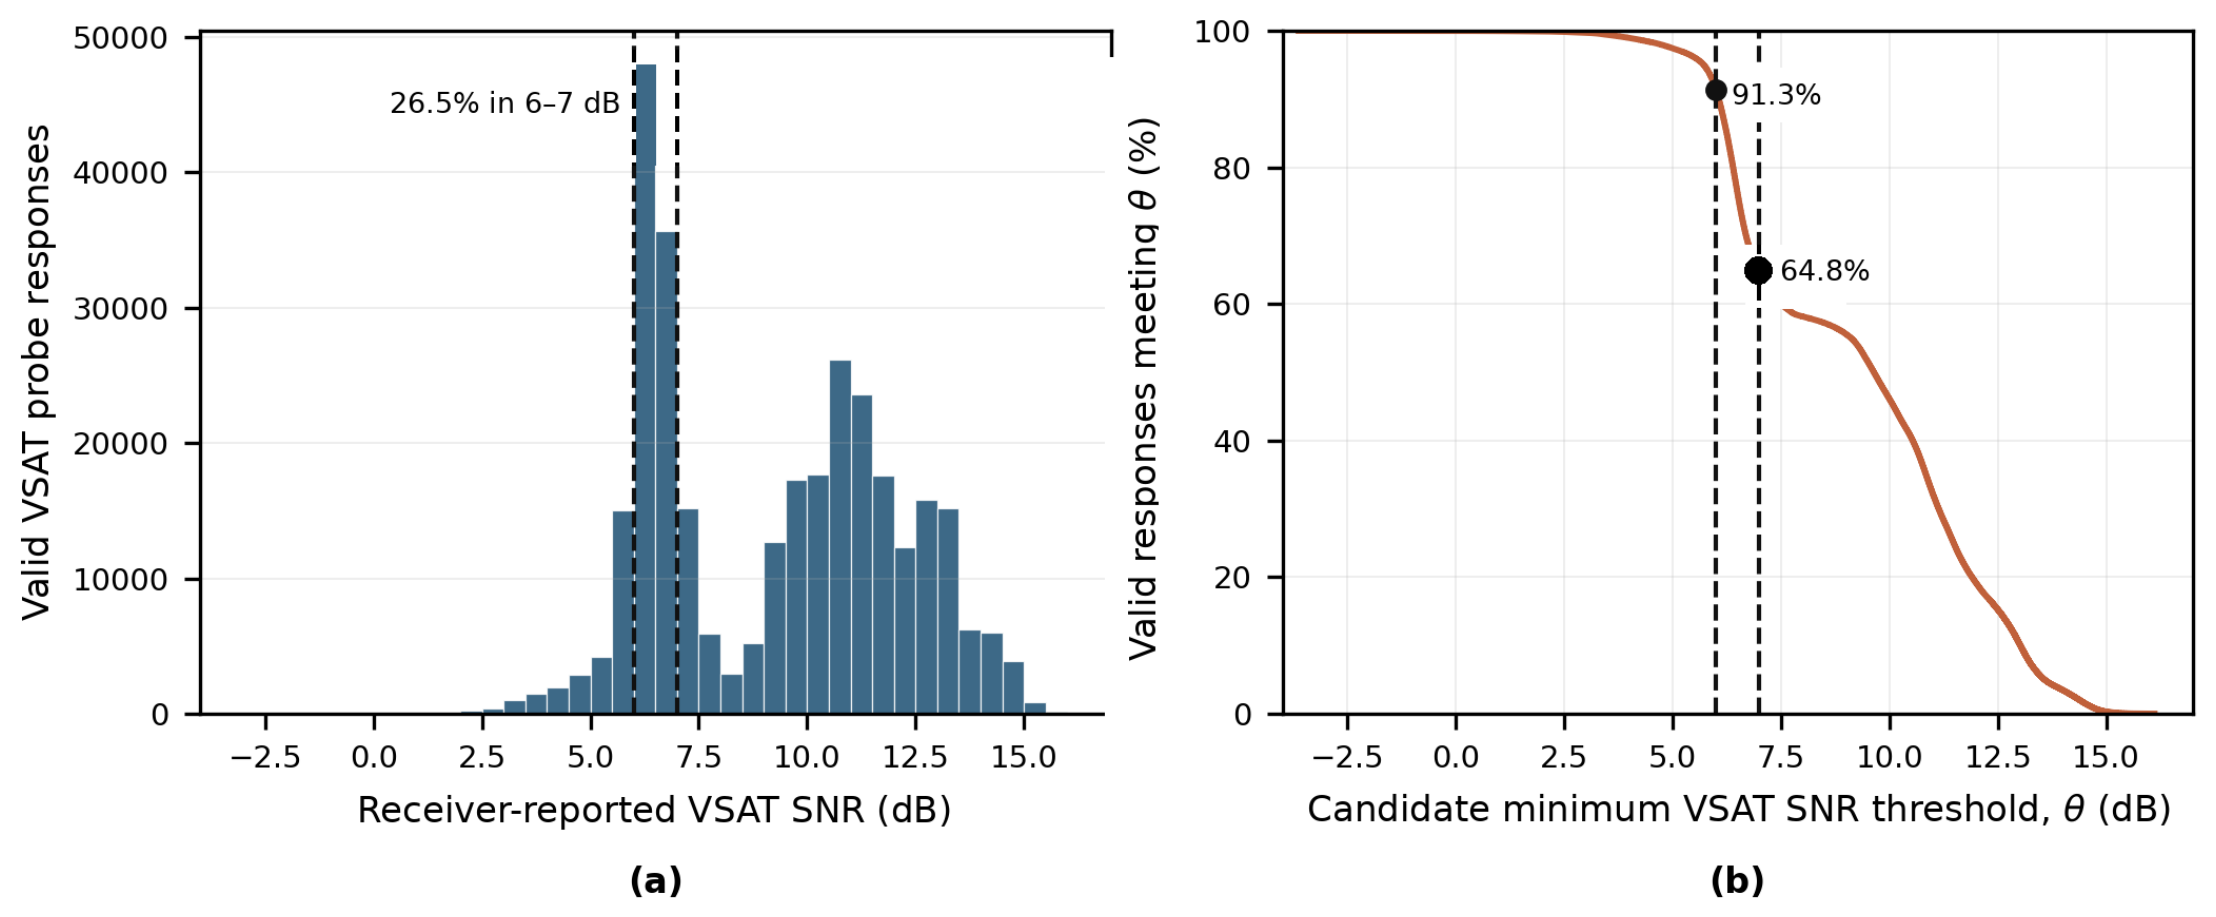

Table 1.
Analysis sets and denominators used in this study.
| Analysis set | Records | Inclusion criteria | Primary use |
|---|---|---|---|
| Complete-voyage dataset | 606,625 | Records belonging to the twelve complete voyages | Campaign overview and voyage inventory |
| Sailing record set | 484,037 | Records within scheduled passages | Separation of sailing from port stays |
| Valid cellular-state sailing set | 470,920 | Sailing records with LTE, WCDMA, or explicit no-service state | Cellular attachment, no-service, and received-power qualification |
| Joint-analysis set | 319,363 | Valid cellular-state sailing records within the active VSAT service period | Cellular–GEO complementarity, SNR-threshold analysis, and link-selection policies |
| Valid cellular-state port-stay set | 122,072 | Port-stay records with LTE, WCDMA, or explicit no-service state | Port-stay operating context |
| All-phase valid cellular-state set | 592,992 | Valid cellular-state sailing and port-stay records combined | Demonstration of phase-mixing effects only |
Table 2.
Voyage inventory for the 12 complete voyages. Duration is calculated from the first to the last record of each voyage and includes both sailing and port-stay periods. “Valid cellular-state sailing records” are sailing records reporting LTE, WCDMA, or an explicit no-service state.
Table 2.
Voyage inventory for the 12 complete voyages. Duration is calculated from the first to the last record of each voyage and includes both sailing and port-stay periods. “Valid cellular-state sailing records” are sailing records reporting LTE, WCDMA, or an explicit no-service state.
| Voyage | Period (2025–2026) | Duration (days) | Complete-voyage records | Sailing records | Valid cellular-state sailing records |
|---|---|---|---|---|---|
| 1 | 19 Jul – 10 Aug | 21.9 | 59,979 | 46,387 | 46,385 |
| 2 | 11 Aug – 31 Aug | 19.4 | 53,067 | 44,790 | 44,787 |
| 3 | 31 Aug – 22 Sep | 21.9 | 59,516 | 50,652 | 50,652 |
| 4 | 24 Sep – 21 Oct | 27.0 | 39,400 | 34,611 | 24,673 |
| 5 | 21 Oct – 11 Nov | 21.0 | 57,134 | 42,182 | 42,182 |
| 6 | 21 Nov – 03 Dec | 12.5 | 33,750 | 25,166 | 25,146 |
| 7 | 04 Dec – 26 Dec | 22.0 | 60,095 | 49,022 | 48,879 |
| 8 | 27 Dec – 21 Jan | 24.8 | 62,856 | 50,793 | 50,149 |
| 9 | 22 Jan – 12 Feb | 21.3 | 46,915 | 35,346 | 34,758 |
| 10 | 13 Feb – 01 Mar | 15.9 | 33,260 | 28,679 | 28,177 |
| 11 | 01 Mar – 23 Mar | 21.4 | 47,443 | 38,192 | 37,564 |
| 12 | 23 Mar – 17 Apr | 24.9 | 53,210 | 38,217 | 37,568 |
| Total | 606,625 | 484,037 | 470,920 |
Table 3.
Cellular connectivity states and serving-RAT composition by voyage leg.
| Voyage leg | Valid cellular-state rec. |
Voyages | Attached (%) |
Received- power-qual. (%) |
Attached below crit. (%) |
No service (%) |
LTE share (%) |
WCDMA share (%) |
LTE qual. within LTE (%) |
WCDMA qual. within WCDMA (%) |
|---|---|---|---|---|---|---|---|---|---|---|
| Incheon – Busan | 38,411 | 11 | 99.9 | 77.1 | 22.8 | 0.1 | 68.1 | 31.8 | 97.4 | 33.9 |
| Busan – Shanghai | 49,117 | 11 | 87.3 | 40.9 | 46.4 | 12.7 | 71.3 | 16.0 | 52.6 | 21.0 |
| Shanghai – Ho Chi Minh | 139,595 | 11 | 56.2 | 17.3 | 38.9 | 43.8 | 30.1 | 26.1 | 14.4 | 49.9 |
| Ho Chi Minh – Laem Chabang | 42,445 | 10 | 81.2 | 30.9 | 50.3 | 18.8 | 20.5 | 60.7 | 22.5 | 43.3 |
| Laem Chabang – Ho Chi Minh | 46,876 | 10 | 84.9 | 25.0 | 59.9 | 15.1 | 18.7 | 66.2 | 19.7 | 32.1 |
| Ho Chi Minh – Incheon | 154,476 | 11 | 62.9 | 21.5 | 41.4 | 37.1 | 40.6 | 22.2 | 34.1 | 34.5 |
| All sailing | 470,920 | 12 | 70.3 | 28.0 | 42.3 | 29.7 | 39.0 | 31.3 | 40.9 | 38.6 |
Note: Percentages are calculated over valid cellular-state sailing records. “Attached” denotes records reporting LTE or WCDMA service. “Received-power-qualified” denotes records meeting the LTE RSRP or WCDMA RSCP criterion in Section 3.7. “Attached below criterion” equals the attached share minus the received-power-qualified share. LTE- and WCDMA-qualified fractions are conditional on the corresponding serving RAT and should not be interpreted as a direct comparison between the two RATs.
Table 4.
Cross-voyage stability of the received-power-qualified fraction by voyage leg.
| Voyage leg | Received-power- qualified (%) |
Voyage-cluster bootstrap 95% CI |
Leave-one- voyage-out range |
Voyage-level SD (pp) |
|---|---|---|---|---|
| Incheon – Busan | 77.1 | [64.2, 87.1] | [74.3, 82.7] | 18.3 |
| Busan – Shanghai | 40.9 | [32.5, 50.0] | [36.5, 44.5] | 14.3 |
| Shanghai – Ho Chi Minh | 17.3 | [13.5, 21.1] | [15.8, 18.2] | 6.4 |
| Ho Chi Minh – Laem Chabang | 30.9 | [27.2, 35.8] | [28.5, 31.5] | 6.5 |
| Laem Chabang – Ho Chi Minh | 25.0 | [20.7, 29.6] | [22.4, 25.8] | 5.8 |
| Ho Chi Minh – Incheon | 21.5 | [18.9, 24.1] | [20.7, 22.3] | 4.4 |
| All sailing | 28.0 | [25.9, 30.8] | [26.8, 28.4] | 4.3 |
Note: Pooled fractions are calculated over valid cellular-state sailing records. The 95% intervals were obtained from 10,000 voyage-cluster bootstrap replicates using a fixed random seed. Leave-one-voyage-out ranges were calculated by removing one contributing voyage at a time, as described in Section 3.8. Voyage-level standard deviations are expressed in percentage points.
Table 5.
Cellular–GEO VSAT complementarity by voyage leg.
| Voyage leg | Joint- analysis records |
Cellular recv-power-qualified (%) |
VSAT responsive among cellular-non-qualified (%) |
Either-tier condition met (%) |
Neither-tier-qual. (%) | Either-tier cond. met at SNR ≥ 5 dB (%) |
At SNR ≥ 6 dB (%) |
At SNR ≥ 7 dB (%) |
|---|---|---|---|---|---|---|---|---|
| Incheon – Busan | 24,420 | 75.09 | 98.32 | 99.58 | 0.42 | 98.62 | 96.40 | 92.71 |
| Busan – Shanghai | 44,438 | 39.92 | 99.90 | 99.94 | 0.06 | 99.49 | 97.07 | 80.13 |
| Shanghai – Ho Chi Minh | 103,331 | 19.03 | 99.30 | 99.43 | 0.57 | 98.21 | 95.03 | 72.96 |
| Ho Chi Minh – Laem Chabang | 29,832 | 31.39 | 99.76 | 99.84 | 0.16 | 93.79 | 85.00 | 66.72 |
| Laem Chabang – Ho Chi Minh | 32,997 | 25.58 | 95.83 | 96.89 | 3.11 | 92.81 | 84.48 | 64.50 |
| Ho Chi Minh – Incheon | 84,345 | 21.98 | 99.82 | 99.86 | 0.14 | 99.55 | 94.69 | 73.93 |
| All sailing | 319,363 | 28.83 | 99.16 | 99.40 | 0.60 | 97.80 | 93.30 | 74.27 |
Note: Percentages are calculated over the joint-analysis set. “Cellular received-power-qualified” denotes records satisfying the LTE RSRP or WCDMA RSCP criterion defined in Section 3.7. “VSAT responsive among cellular-non-qualified records” is the fraction of cellular-non-qualified records with a valid GEO VSAT probe response. “Either-tier condition met” denotes records satisfying either the cellular criterion or the GEO response criterion. “Neither-tier-qualified” includes records for which cellular was not received-power-qualified and GEO was non-responsive or had an unknown probe outcome. The 5, 6, and 7 dB columns additionally require a valid GEO probe response with SNR at or above the candidate threshold.
Table 6.
Representativeness of the joint-analysis window.
| Voyage leg | Full-period received-power- qualified (%) |
Full-period records |
Joint-window received-power- qualified (%) |
Joint-window records |
|---|---|---|---|---|
| Incheon – Busan | 77.1 | 38,411 | 75.1 | 24,420 |
| Busan – Shanghai | 40.9 | 49,117 | 39.9 | 44,438 |
| Shanghai – Ho Chi Minh | 17.3 | 139,595 | 19.0 | 103,331 |
| Ho Chi Minh – Laem Chabang | 30.9 | 42,445 | 31.4 | 29,832 |
| Laem Chabang – Ho Chi Minh | 25.0 | 46,876 | 25.6 | 32,997 |
| Ho Chi Minh – Incheon | 21.5 | 154,476 | 22.0 | 84,345 |
| All sailing | 28.02 | 470,920 | 28.83 | 319,363 |
Note: The GEO VSAT service ended before completion of the campaign, so the joint-analysis window covers seven complete voyages and part of the voyage spanning the service boundary rather than all 12 voyages. The table compares cellular received-power-qualified fractions in the full-period valid cellular-state sailing set and the joint-analysis set.
Table 7.
Conditional round-trip time and packet loss among records with a valid probe response.
| Tier | Responsive records | Median RTT (ms) | 90th pct RTT (ms) | Records with packet loss > 0 (%) | 90th pct packet loss (%) |
|---|---|---|---|---|---|
| LTE | 42,070 | 124.7 | 263.7 | 10.9 | 1.0 |
| WCDMA | 19,110 | 212.1 | 702.1 | 13.2 | 1.0 |
| GEO VSAT | 315,799 | 684.7 | 760.9 | 21.4 | 3.0 |
Note: Cellular statistics are calculated over sailing records with a stored cellular monitoring response under the opportunistic monitoring arrangement described in Section 3.3. GEO VSAT statistics are calculated over joint-analysis records with a valid probe response. These values represent conditional responding-path distributions rather than availability measures. Median packet loss is zero for all three tiers.
Table 8.
Retrospective evaluation of the cellular-first link-selection policy and sensitivity scenario over the 319,363 joint-analysis records.
Table 8.
Retrospective evaluation of the cellular-first link-selection policy and sensitivity scenario over the 319,363 joint-analysis records.
| (a) Tier allocation under the received-power-based policy and gateway-status-restricted sensitivity scenario. | ||||||
|---|---|---|---|---|---|---|
| Cellular eligibility policy | Candidate minimum VSAT SNR threshold, (dB) |
Cellular- assigned (%) |
GEO- assigned (%) |
Store-and- forward (%) |
||
| Received-power-based | None | 28.83 | 70.57 | 0.60 | ||
| 5 | 28.83 | 68.97 | 2.20 | |||
| 6 | 28.83 | 64.47 | 6.70 | |||
| 7 | 28.83 | 45.44 | 25.73 | |||
| 10 | 28.83 | 31.04 | 40.13 | |||
| Gateway-status-restricted | None | 6.79 | 92.17 | 1.04 | ||
| 5 | 6.79 | 89.78 | 3.43 | |||
| 6 | 6.79 | 83.89 | 9.32 | |||
| 7 | 6.79 | 58.11 | 35.10 | |||
| 10 | 6.79 | 40.69 | 52.52 | |||
| Note: Under the received-power-based policy, cellular is selected when the adopted LTE or WCDMA received-power criterion is satisfied. Under the gateway-status-restricted sensitivity scenario, cellular selection additionally requires a reachable gateway status. The candidate VSAT SNR threshold is applied only to records considered for GEO assignment. | ||||||
| (b) Conditional GEO RTT and store-and-forward interval statistics under the received-power-based policy. | ||||||
| Candidate min VSAT SNR, (dB) |
Median GEO RTT among assigned (ms) |
Store-and- forward intervals |
90th-pct dur. (min) |
Longest interv. (h) |
Intervals ≥ 30 min |
Total buffered time (h) |
| None | 685.0 | 244 | 9.6 | 2.02 | 6 | 16.7 |
| 5 | 684.7 | 1,234 | 6.3 | 3.28 | 17 | 61.1 |
| 6 | 688.6 | 4,539 | 3.7 | 4.96 | 52 | 185.6 |
| 7 | 711.5 | 6,072 | 15.7 | 9.86 | 445 | 716.5 |
| 10 | 715.3 | 8,013 | 9.9 | 35.64 | 342 | 1,118.4 |
Note: Store-and-forward intervals group consecutive buffered records within the same voyage and are interrupted when the inter-record gap exceeds 90 s, as defined in Section 3.9. Interval statistics are reported only for the received-power-based policy because corresponding temporal statistics were not derived for the gateway-status-restricted scenario.
Table 9.
Illustrative storage required to retain a constant-rate maritime IoT data stream over the longest store-and-forward interval observed under selected candidate VSAT SNR thresholds.
Table 9.
Illustrative storage required to retain a constant-rate maritime IoT data stream over the longest store-and-forward interval observed under selected candidate VSAT SNR thresholds.
| Data rate | 2.02 h, no SNR threshold |
9.86 h, SNR ≥ 7 dB |
35.64 h, SNR ≥ 10 dB |
|---|---|---|---|
| 1 kbps | 0.9 MB | 4.4 MB | 16.0 MB |
| 10 kbps | 9.1 MB | 44.4 MB | 160.4 MB |
| 100 kbps | 90.9 MB | 443.7 MB | 1.60 GB |
| 1 Mbps | 909 MB | 4.44 GB | 16.04 GB |
Note: Storage is calculated by multiplying the assumed constant data rate by the longest observed interval under the received-power-based cellular-first policy. The data rates are illustrative and were not measured as application traffic during the campaign. Protocol overhead, headers, retransmissions, redundancy, database overhead, and engineering safety margins are excluded.
Disclaimer/Publisher’s Note: The statements, opinions and data contained in all publications are solely those of the individual author(s) and contributor(s) and not of MDPI and/or the editor(s). MDPI and/or the editor(s) disclaim responsibility for any injury to people or property resulting from any ideas, methods, instructions or products referred to in the content. |
© 2026 by the authors. Licensee MDPI, Basel, Switzerland. This article is an open access article distributed under the terms and conditions of the Creative Commons Attribution (CC BY) license (http://creativecommons.org/licenses/by/4.0/).
Copyright: This open access article is published under a Creative Commons CC BY 4.0 license, which permit the free download, distribution, and reuse, provided that the author and preprint are cited in any reuse.