
Submitted:
17 August 2026
Posted:
18 August 2026
You are already at the latest version
Abstract
The global food supply chain generates approximately 13.7 billion metric tons of CO₂-equivalents annually, yet accurate Product Carbon Footprint (PCF) estimation remains inaccessible to most manufacturers. Life Cycle Assessment (LCA), the recognized gold standard, imposes prohibitive data demands and costs, while increasingly stringent European Union (EU) Product Environmental Footprint requirements intensify the urgency for scalable alternatives. Machine learning (ML) offers a promising substitute by utilizing publicly accessible product attributes, but the structural diversity of the food and beverage sector generates heterogeneous emission profiles that undermine single-model approaches trained on limited per-category data. This study proposes a novel ML framework combining multi-source data integration with Gaussian Mixture Model (GMM)-based clustering. Seven publicly available datasets were harmonized into a unified corpus of 3,933 samples, and GMMs were employed to cluster products by underlying emission patterns rather than predetermined taxonomies. Cluster-specific Random Forest Regression, K-Nearest Neighbors Regression, and eXtreme Gradient Boosting models were trained on each subset, with unseen samples assigned at inference via K-Nearest Neighbors voting. Results from ten repetitions of stratified five-fold cross-validation confirm that the proposed framework significantly outperforms standard single-model counterparts across all major product categories. The findings demonstrate that the proposed framework offers a scalable, data-driven alternative to LCA, enhancing PCF transparency for manufacturers and supporting informed sustainability decisions across the food and beverage sector.
Keywords:
product carbon footprint
; life cycle assessment
; machine learning
; food and beverage
; Gaussian Mixture Model
1. Introduction
Environmental sustainability has emerged as a defining twenty-first century challenge, driving stringent emission controls for enterprises and shifting consumer preferences toward environmentally responsible products. The Product Carbon Footprint (PCF), which quantifies lifecycle greenhouse gas emissions, has become essential for regulatory compliance and informed purchasing decisions, yet persistent barriers to low-carbon technology adoption across manufacturing supply chains continue to constrain meaningful progress [1]. A critical paradox persists: despite increasing demand for PCF transparency, accurate carbon footprint information remains prohibitively difficult for manufacturers to calculate and virtually inaccessible to consumers.
1.1. Research Background
The food and beverage sector sits at the center of this challenge: the global food supply chain generates approximately 13.7 billion metric tons of CO₂-equivalents annually, representing roughly 26% of anthropogenic greenhouse gas emissions [2], yet its structural diversity across livestock rearing, processing, packaging, and distribution creates distinct emission profiles that resist standardized estimation. Carbon footprint management has become a strategic priority across manufacturing supply chains as enterprises face mounting pressure to quantify and disclose product-level emissions [3]. Regulatory pressure further intensifies the urgency; instruments such as the EU Product Environmental Footprint (PEF) framework and Corporate Sustainability Reporting Directive (CSRD) are progressively mandating product-level carbon disclosure across supply chains [4], transforming PCF estimation from a voluntary exercise into a compliance imperative for manufacturers.
Life Cycle Assessment (LCA) has long served as the gold standard methodology for PCF calculation, offering comprehensive evaluation of environmental impacts from cradle to grave [5]. While LCA provides systematic frameworks for identifying emission reduction opportunities and optimizing resource allocation, its effectiveness depends on data quality, methodological consistency, and strict adherence to evolving industry standards [6]. Conflicting frameworks such as ISO 14067 and the EU Product Environmental Footprint (PEF) [4] introduce inconsistencies that in the food and beverage sector alone produce GHG outcome variations of 12% to 69% across comparable studies [7].
These requirements create formidable adoption barriers: simplified LCAs cost €5,000–€20,000 and comprehensive assessments exceed €100,000 [8,9]. Heavy reliance on secondary data from generic databases further undermines accuracy, especially for products with complex, geographically dispersed supply chains [10]. Machine learning (ML) has accordingly attracted attention as a time- and cost-effective alternative: Jairi et al .[11] demonstrated that ML-based predictive models for environmental risk assessment match classical laboratory benchmarks while requiring a fraction of the resources, illustrating a broader pattern in which data-driven methods substantially reduce the burden of conventional compliance testing. These limitations collectively demonstrate the urgent need for simpler, more accessible methods to estimate PCFs without sacrificing accuracy.
Recognizing these constraints, researchers have explored alternative estimation approaches along three broad trajectories. First, input-output (IO) models offer economy-wide emission analysis by linking financial transactions to environmental impacts, though they often lack product-specific granularity [12]. Second, hybrid lifecycle methodologies combine process-based LCA with IO analysis to balance comprehensiveness and specificity, yet still require substantial data collection efforts [13]. Third, and most recently, ML approaches have emerged as promising alternatives, utilizing readily accessible product attributes to estimate carbon emissions with significantly reduced data requirements. Li et al. [14] employed a multi-scale transformer architecture to forecast carbon emissions across heterogeneous temporal patterns, while Dong et al. [15] demonstrated that multimodal ML models reliably predict real-time CO₂ emissions from industrial machinery under complex operating conditions. In the PCF domain specifically, Al Nuaimi et al. [16] and Delanoë et al. [17] have applied ML to estimate product-level carbon footprints from publicly accessible attributes.
1.2. Research Motivation
ML-based PCF estimation has attracted growing scholarly attention, with recent studies substantially extending its frontier while simultaneously exposing unresolved methodological challenges. Kong et al. [18] proposed an interpretable framework for real-time carbon emission estimation across heterogeneous industrial enterprises, demonstrating that data-driven models trained on multi-dimensional energy consumption data achieve accurate and high-frequency monitoring where conventional annual statistics fall short, a finding directly relevant to the heterogeneous product portfolios of the food and beverage sector. Mumtaz et al. [19] further confirmed the versatility of ensemble ML methods, applying Random Forest and XGBoost to jointly optimize compressive strength and carbon emissions in sustainable construction materials, establishing that careful feature analysis substantially improves prediction reliability across structurally diverse product groups. Liu et al. [20] applied ensemble learning to estimate carbon emissions across industrial processes, showing that feature engineering based on publicly available product attributes can yield competitive accuracy without full LCA data. However, Fiedler and Lundie [21] identified a critical methodological caveat: standard ML estimators tend to systematically underestimate actual Scope 3 emissions when trained on reported data, highlighting the importance of model calibration for reliable predictions.
Despite these advances, a fundamental challenge constrains ML-based PCF estimation: small training dataset sizes per product category often yield imprecise models. Al Nuaimi et al. [16] and Guan et al. [22] noted that ML accuracy depends heavily on the availability of sufficient training data within specific product categories. When training sets contain only a few samples per category, ML models fail to capture complex attribute–emission relationships, yielding poor generalization [23] . Furthermore, training a single model across all categories without accounting for structural differences in production processes and logistics introduces systematic biases that further degrade prediction accuracy [6] . A compounding difficulty is that attribute–emission relationships in food and beverage products are inherently non-linear: ingredients, processing methods, and packaging interact in ways that no single global model can adequately represent across structurally dissimilar product groups [6,23] . Seto et al. [25] corroborated this finding, demonstrating that Random Forest and K-Nearest Neighbors classifiers deliver substantially higher accuracy than single-model baselines when domain-specific feature subsets are carefully identified, a result that supports the cluster-specific modelling strategy adopted in the present study. Clustering algorithms offer a data-driven remedy: by grouping products according to intrinsic emission patterns, cluster-specific models trained on more homogeneous subsets achieve superior predictive accuracy [23] , and Gaussian Mixture Models (GMM) are particularly suitable because their probabilistic soft-assignment mechanism automatically identifies groups with similar emission characteristics without imposing predefined taxonomies, thereby accommodating the ambiguous category boundaries pervasive in food and beverage portfolios. This dual challenge of limited data availability and category-specific emission heterogeneity represents a fundamental obstacle to developing practical, reliable ML-based PCF estimation tools for the food and beverage sector.
Multi-source dataset integration offers a direct means of alleviating data scarcity: Meinrenken et al. [26] demonstrated that aggregating PCF records across industries and continents substantially expands the empirical basis for model training, though it simultaneously introduces heterogeneous feature sets and inconsistent measurement standards that must be harmonized during preprocessing [6]. A principled framework that concurrently resolves data scarcity through integration and emission heterogeneity through clustering therefore represents the critical methodological gap this study addresses.
1.3. Research Contributions
To address these challenges, this study proposes a novel ML framework that combines multi-source data integration with Gaussian Mixture Model (GMM)-based clustering to overcome data scarcity and category heterogeneity in PCF estimation for food and beverage products. Seven diverse data sources were integrated into a unified dataset, substantially expanding training sample size beyond what any single source provides. GMMs were then employed to cluster products based on underlying emission patterns rather than predetermined taxonomies, enabling cluster-specific models using Random Forest Regression (RFR), K-Nearest Neighbors Regression (KNNR), and eXtreme Gradient Boosting (XGBoost) to specialize in products with similar emission characteristics. Experimental results confirm that the proposed GMM-based approaches significantly outperform their standard counterparts across all major product categories, offering a scalable, data-driven alternative that enhances PCF transparency for both manufacturers and consumers.
2. The Proposed Procedure
The proposed method addresses the challenge of estimating PCF for the food and beverage sector, particularly given limited localized data, by employing machine learning algorithms. This section outlines the research approach, as illustrated in Figure 1, encompassing data collection, feature extraction, data preprocessing, model training and testing, and performance comparison.
2.1. Data Collection
Recognizing the challenge of small data sizes per product category, this study adopted a comprehensive data collection approach, aggregating diverse publicly available datasets as summarized in Table 1. The column "Data sizes" in Table 1 indicates the available data size for the food and beverage sector in each public dataset. The final dataset comprises 3,933 records drawn from seven primary sources spanning multiple regions and sectors, with a focus on food, beverage, and consumer products. The datasets include:
2.1.1. AGRIBALYSE Produits Alimentaires [27]
A French dataset from Agribalyse providing 2,518 records of LCA-based data on agricultural and food products, covering production, processing, packaging, and distribution, with detailed insights into carbon emissions and environmental impacts.
2.1.2. Carbon Catalogue Public Database [26]
Sourced from Scientific Data, this global dataset includes carbon footprint data for commercial products across eight industries and five continents, contributing 99 records. It features products from countries such as Australia, Belgium, China, France, and the USA, offering broad geographic coverage.
2.1.3. Carbon Label Product Information [27]
Obtained from Taiwan's Carbon Footprint Information Platform, this dataset contributes 288 records of certified PCF data under the National Carbon Labeling System, which incentivizes emission reductions through government procurement priorities.
2.1.4. Database Milieubelasting Voedingsmiddelen [28]
Sourced from RIVM (Netherlands), this dataset includes 237 records focused on the environmental impact of food and beverage products, with emphasis on Greenhouse Gas (GHG) emissions and other environmental indicators.
2.1.5. Emission Factor Database (Version 2) [29]
Derived from Scope 3 GHG Measurement and Reporting Protocols for Food and Drink, this dataset offers 729 records of emission factors, primarily from France and the UK, detailing emissions from production, transportation, and consumption.
2.1.6. Essay Extractions [30]
Carbon footprint data were synthesized from academic papers covering diverse consumer products, including pharmaceutical and personal care product packaging documented in Zhu et al. [30], extracting information for 44 products.
2.1.7. PCF Database (Product Carbon Footprint Database, n.d.)[31]
A UK-based resource from the Open Science Framework providing concise, reliable PCF data for various products, focusing on greenhouse gas emissions across production stages. It contributes 18 records to the study.

Table 1.
The collected datasets.
| Datasets | Covering Countries | Data sizes |
| Agribalyse 3.1.1_produits Alimentaires (AGRIBALYSE, 2025) | France | 2518 |
| The Carbon Catalogue Public Database (Meinrenken et al., 2022) | Australia, Belgium, Brazil, Canada, Chile, China, Colombia, Finland, France, Germany, Greece, Indonesia, Ireland, Italy, Japan, Lithuania, Luxembourg, Malaysia, Netherlands, South Africa, South Korea, Spain, Sweden, Switzerland, Taiwan, UK, and USA | 99 |
| Carbon Footprint Information Platform (Taiwan Ministry of Environment, 2024) | Taiwan | 288 |
| Database Milieubelasting Voedingsmiddelen v1def (Netherlands National Institute for Public Health and the Environment Ministry of Health, 2024) | Netherlands | 237 |
| Emission Factor Database v2.0 (Intergovernmental Panel on Climate Change, 2025) | France and UK | 729 |
| Essay extraction (Zhu et al., 2020) | China, Taiwan and UK | 44 |
| Product Carbon Footprint Database (Product Carbon Footprint Database, n.d.) | UK | 18 |
| Total | 3,933 | |
2.2. Feature Extraction
Three features, "Year," "Country," and "Capacity," are consistently present across all datasets. Other features, such as "Continent," "Category," "Type," "Component," "Packaging Material," "Packaging Form," and "Packaging Plastic Type," are less ubiquitous or are combined within single text fields. Customized code utilizing regular expressions was developed to programmatically extract these features from product descriptions in each dataset. The target variable, CO₂/Capacity Ratio, is calculated as carbon emissions divided by product capacity (g CO₂/g), standardizing emissions across varying product sizes to enable consistent comparisons and scalable predictions.
The unified dataset ultimately contains thirty-five features. However, feature availability varies across sources, with some datasets including detailed attributes such as production year, location, product category, weight, volume, packaging materials, and carbon emissions, while others provide only basic fields. Missing values are encoded as informative features rather than omitted. Nominal features, such as "Packaging Plastic Type," that are not mentioned are encoded as "null," while numerical features, such as sodium content, that are not mentioned are encoded as "0." This approach simulates real-world consumer scenarios where only limited product information is accessible, utilizing machine learning capability to handle incomplete data.
The unified dataset comprises four major product categories: "Animal and Plant Products" (1,897 records), "Dishes" (471 records), "Prepared Food" (1,018 records), and "Drinks" (547 records). Product types within each category are summarized in Table 2, which reveals significant variation in sample sizes across the 80 product types. Despite integrating seven data sources to increase overall data availability, some product types contain only a few samples. This data scarcity at the product type level presents a challenge for model training, as insufficient samples within specific types can lead to poor generalization and reduced prediction accuracy. This limitation underscores the need for clustering approaches that can group products based on emission characteristics rather than relying solely on predefined categorical classifications.
2.3. Data Preprocessing
Data preprocessing is essential to prepare the unified dataset for machine learning models, addressing issues of feature heterogeneity, scale disparities, and encoding inconsistencies. This stage encompasses three primary tasks: transforming nominal features to prevent misinterpretation of categorical relationships, normalizing numerical features to ensure balanced influence during model training, and clustering the target variable to address emission heterogeneity across product categories. These preprocessing steps enhance model convergence, improve prediction accuracy, and enable effective handling of the diverse feature types and emission patterns present in the integrated dataset.
2.3.1. Nominal Features
Among the thirty-five features, eight nominal features (e.g., Country, Category) are transformed via one-hot encoding into binary columns, preventing their misinterpretation as ordinal data. While this transformation increases feature count and introduces sparsity, the dataset's approximately four thousand records mitigate computational challenges, ensuring model performance remains robust.
2.3.2. Numerical Features
Numerical features (e.g., Year, Capacity) are scaled to the range [0, 1] using min-max normalization:
This normalization equalizes feature influence across different scales, enhancing model convergence and prediction accuracy.
2.3.3. Gaussian Mixture Modeling
The CO₂/Capacity Ratio, the target variable for prediction, exhibits a heavily right-skewed distribution, as shown in Figure 2. The distribution reveals a sharp peak near zero, indicating that most products have low CO₂ emissions per unit capacity, with a long tail extending to approximately 100, reflecting a smaller subset of products with significantly higher emissions. This skewness, combined with subtle irregularities in the distribution, suggests potential multimodality driven by diverse product categories and underlying factors such as ingredients, processing methods, packaging materials [32], and transportation logistics, even among similar foods or beverages. This heterogeneity justifies the use of Gaussian Mixture Models (GMM) to identify distinct emission clusters as a preprocessing step, enabling more accurate predictions by grouping products with similar emission characteristics.
To determine the optimal number of clusters for the target variable, this study employs the Bayesian Information Criterion (BIC) score. BIC, also known as the Schwarz Information Criterion, is a statistical metric used to select the best model from a set of candidates by balancing goodness of fit with model complexity. BIC is formulated as:
where is the maximum value of the likelihood function for the GMM, is the number of parameters estimated by the GMM (representing model complexity), and is the number of data points. A lower BIC score indicates a better-fitting model.
2.3.4. Cross-Validation
This study employs stratified k-fold cross-validation to evaluate the forecasting performance of machine learning models. As shown in Table 2, the unified dataset contains 80 product types across four major categories, with some product types containing only a few samples (e.g., one to five records). To ensure that all product types are adequately represented during training, k is set to 5, which satisfies the minimum requirements for cross-validation while maximizing the training data in each fold. The dataset is stratified into five subsets based on the four product categories: "Animal and Plant Products," "Dishes," "Prepared Food," and "Drinks." This stratification ensures that each fold maintains proportional representation of all four categories, preventing bias toward more abundant categories and enabling robust performance evaluation across diverse product types. In each iteration, four of the five subsets serve as the training set, while the remaining subset serves as the testing set. This process is repeated five times, with each subset serving as the testing set exactly once, ensuring that all data points are used for both training and validation.
2.4. Model Training and Testing
As shown in Figure 3, the proposed method is developed based on the clustering results from GMM. BIC is utilized to determine the optimal number of clusters for the unified dataset. Suppose the optimal cluster number is m; RFR or KNNR models are then trained separately for each of the m clusters, resulting in m distinct cluster-specific models. In the prediction process, the cluster membership of each testing sample is first determined using a KNN-based voting mechanism. Specifically, the k nearest neighbors (which are training samples with known cluster memberships) of the testing sample are identified based on feature similarity, and the testing sample is assigned to the cluster that receives the majority vote among these k neighbors. Once a testing sample is assigned to the ith cluster (where i ≤ m), the corresponding ith model is used to generate the CO₂/Capacity Ratio prediction for that sample.
2.5. Performance Comparison
Model performance is measured using the mean absolute percentage error (MAPE), which quantifies the average prediction error as a percentage of actual values. MAPE is calculated as:
where n is the number of testing samples, is the actual value, and is the predicted value of the ith sample in the testing set. The advantage of using MAPE is its ability to evaluate predictive errors across datasets with different scales, enabling fair comparison between product categories with varying emission magnitudes. However, MAPE has a limitation: it is undefined when actual values equal zero, requiring that > 0 for all samples.
To assess whether statistically significant differences exist between the performance of baseline models (RFR or KNNR) and cluster-based models (GMM-RFR or GMM-KNNR), this study employs paired t-tests with a two-tailed test. Paired t-tests are appropriate because each cross-validation fold produces paired MAPE values from the same testing data, allowing direct comparison while controlling for data variability. The null hypothesis (H₀) and alternative hypothesis (Hₐ) are formulated as:
where is the mean of the differences dⱼ, and dⱼ represents the difference between the MAPE of the baseline model (RFR or KNNR) and the MAPE of the cluster-based model (GMM-RFR or GMM-KNNR) in the jth cross-validation fold. The significance level α for the paired t-test is set to 0.05. A rejection of H₀ indicates that the cluster-based approach produces significantly different performance compared to the baseline model, with the sign of revealing whether the difference represents improvement or degradation.
3. Empirical Evaluation
The following subsections describe the experimental environment and present the experimental results.
3.1. Experimental Environment
Table 3 summarizes the key details of the experimental platform. To ensure robust evaluation, ten repetitions of stratified five-fold cross-validation were employed for all experiments, resulting in 50 total evaluation runs per model configuration. Python was used as the programming language, with the scikit-learn library (sklearn) providing implementations for preprocessing, modeling, and evaluation tasks, including min-max normalization, one-hot encoding, GMM clustering, KNNR, RFR, and performance metric calculation. XGBoost was implemented using the xgboost library. The parameter settings for GMM, KNNR, RFR, and XGBoost followed the default values specified in their respective libraries. However, adaptive adjustments were made for clusters with limited samples. Specifically, when a cluster contains fewer than five training samples (the default k value for KNN and KNNR), the k parameter is automatically reduced to the number of available samples in that cluster for both cluster assignment during prediction and model training. This ensures all clusters remain functional regardless of their sample size.
3.2. Experimental Results
In the following subsections, we will discuss the group characteristics after GMM modeling and performance comparison.
3.2.1. Group characteristics
Figure 4 illustrates the distribution of CO₂/Capacity Ratio values across the eight clusters identified by Gaussian Mixture Modeling in the training dataset. The overlapping density plots reveal distinct emission patterns among clusters, confirming the effectiveness of GMM in capturing the heterogeneity of carbon footprints across different product categories and types.
Clusters 1 through 6 exhibit relatively low emission ratios, with most samples concentrated in the range of 0 to 30 g CO₂/g, representing products with lower carbon intensities. Cluster 1 (987 records) has a tight distribution with low mean CO₂/capacity ratio, predominantly consisting of Drinks. Feature importance analysis highlights Type_water (0.095) and Component_none (0.078), confirming that water-based products dominate this group. Cluster 2 (432 records) shows low-to-moderate emissions and is influenced by Country_France (0.191), Type_fresh_fruits (0.079), and Component_cheese (0.069), suggesting a mix of dairy-based products and fruits, possibly including beverages like wine or cheese-based prepared foods. Cluster 3 (298 records) displays moderate emissions characterized by Country_Netherlands (0.216), Package_doesn't_mention (0.062), and Year (0.027), indicating regional and packaging-related emission differences with temporal trends playing a role. Cluster 4 (654 records) represents mixed products with moderate mean CO₂/capacity ratio, showing strong influence from Type_fresh_vegetables (0.290), Type_poultry_meat_processed_food (0.031), and Component_fish (0.025), reflecting a mix of low-emission vegetables and moderate-emission processed poultry and fish products, likely including prepared foods. Cluster 5 (123 records) has low mean emissions and is influenced by Type_fresh_seafood (0.076), Component_none (0.075), and Type_bar (0.059), suggesting a mix of seafood, water-based products, and snack bars. Cluster 6 (87 records) is a sparse group dominated by Type_soup (0.444) and Type_fresh_fruits (0.178), likely representing a small subset of soups and fruit-based products with specific emission profiles.
Cluster 7 displays a pronounced, narrow peak near 70 g CO₂/g (1,345 records), indicating products with consistently high emissions. This cluster is characterized by high-emission products, likely dishes, with strong influence from Component_cheese (0.127), Type_poultry_meat_processed_food (0.042), and Type_fresh_vegetables (0.043), indicating a mix of emission-intensive ingredients such as cheese and processed poultry alongside some lower-emission components like vegetables. This aligns with the high variability observed in dish categories due to diverse ingredient combinations. The exceptionally narrow and tall density peak of Cluster 7 reflects the high degree of homogeneity within this cluster: the 1,345 records exhibit very low variance in CO₂/capacity ratio, likely attributable to the standardized LCA calculation methodology applied in the source datasets for dish-type products. This concentration is a desirable outcome of GMM clustering, as it confirms that the algorithm successfully isolated a structurally coherent group, enabling the corresponding cluster-specific model to specialize on a well-defined emission profile.
Cluster 8, positioned around 50 g CO₂/g with a moderate density peak (25 records), represents products with intermediate emission profiles. This diverse group shows influential features including Year (0.039), Type_fresh_vegetables (0.044), and Component_cheese (0.019), likely including a mix of higher-emission cheese products and lower-emission vegetables, with temporal trends affecting emissions.
The clear separation between clusters, particularly the distinct positioning of Clusters 7 and 8 at higher emission levels, validates the rationale for training cluster-specific models, as products within each cluster share similar emission characteristics that differ substantially from other clusters. This heterogeneity underscores the limitations of applying a single global model across all product categories and justifies the proposed GMM-based approach. The group characteristics, supported by feature importance analysis, confirm that product type, ingredients, and geographic origin are key drivers of emission patterns, enhancing the interpretability of the GMM-based models and informing targeted sustainability strategies.
3.2.2. Performance Comparison and Discussion
Table 4 presents the Mean Absolute Percentage Error (MAPE) results from ten repetitions of stratified five-fold cross-validation, totaling 50 evaluation runs for each model configuration. The table compares three baseline machine learning models (RFR, KNNR, and XGBoost) against their GMM-enhanced counterparts (GMM-RFR, GMM-KNNR, and GMM-XGBoost). The "Group sizes" column indicates the optimal number of clusters determined by BIC for each cross-validation fold, which varied between 5 and 10 clusters across different runs.
The absolute MAPE values observed across all models, ranging from approximately 87% to 159%, reflect the intrinsic difficulty of cross-dataset PCF estimation in the food and beverage domain. The CO₂/Capacity Ratio spans several orders of magnitude across product types, from near-zero emissions in water-based beverages to values exceeding 100 g CO₂/g in high-emission dishes, creating a highly skewed and heterogeneous prediction task that amplifies percentage-based errors. Furthermore, the dataset integrates records from seven geographically and methodologically diverse sources, introducing additional variance that is not present in single-source studies. In this context, the relative improvement achieved by GMM-based models over their single-model baselines is the primary metric of interest, rather than the absolute MAPE values themselves.
The experimental results demonstrate that the proposed GMM-based clustering approach consistently improves prediction accuracy across all three machine learning algorithms. On average, GMM-RFR achieved a MAPE of 86.966%, representing a 5.572 percentage point improvement over standard RFR (92.538%). The enhancement is even more pronounced for KNNR, where GMM-KNNR achieved 95.613% MAPE compared to 158.663% for standard KNNR, yielding a substantial 63.050 percentage point reduction in prediction error. For XGBoost, GMM-XGBoost attained 92.597% MAPE, outperforming standard XGBoost (97.790%) by 5.193 percentage points.
Paired t-tests confirm that the performance improvements achieved by the GMM-based approaches are statistically significant for all three algorithms. The p-values of 0.0099 for GMM-RFR versus RFR, 0.0000 for GMM-KNNR versus KNNR, and 0.0002 for GMM-XGBoost versus XGBoost are all well below the significance level of α = 0.05, providing strong evidence that the clustering-based approach consistently enhances model performance rather than showing improvement by chance.
Examining individual fold results reveals that GMM-based models outperformed their baseline counterparts in the majority of cases. For RFR, GMM-RFR achieved lower MAPE values in 38 out of 50 folds (76%). The advantage is even more striking for KNNR, where GMM-KNNR outperformed standard KNNR in 46 out of 50 folds (92%). GMM-XGBoost showed superior performance in 36 out of 50 folds (72%). This consistency across different data partitions demonstrates the robustness of the proposed approach.
KNNR showed the most dramatic improvement from GMM clustering, reducing average MAPE by approximately 40%. This substantial enhancement can be attributed to KNNR's instance-based nature, which benefits significantly from operating within homogeneous clusters where local patterns are more consistent. In contrast, RFR and XGBoost, being ensemble methods with inherent robustness to heterogeneous data, showed more moderate but still significant improvements of approximately 6% and 5% respectively. Nevertheless, all three GMM-enhanced models demonstrate that cluster-specific training effectively addresses the data scarcity and category heterogeneity challenges identified in the problem formulation.
These results confirm that the proposed framework successfully addresses the dual challenges of limited training data per product category and emission heterogeneity across product types. By clustering products based on underlying emission patterns and training specialized models for each cluster, the approach enables more accurate PCF estimation than traditional single-model approaches. The consistent improvements across different algorithms and data partitions underscore the generalizability and practical applicability of this methodology for scalable, accurate carbon footprint estimation in the food and beverage sector.
4. Further Discussion
This section provides deeper insights into the proposed framework through two complementary analyses. First, feature importance analysis identifies the key drivers of carbon footprint predictions, revealing which product attributes most significantly influence emission estimates. Second, the impact of missing packaging information is examined to acknowledge a critical data limitation and its implications for model accuracy and future research directions.
4.1. Feature Importance Analysis
Feature importance analysis was conducted to identify the key drivers of CO₂/Capacity Ratio predictions in the GMM-RFR model. Feature importance values were computed by aggregating the contributions of each feature across all cluster-specific RFR models, weighted by the number of samples in each cluster. This analysis provides insights into which product attributes most strongly influence carbon footprint estimations across the entire unified dataset.
Figure 5 visualizes the top 10 features contributing to the model's predictions. Type_water emerges as the most influential feature with an importance of 0.062, indicating that water-based products significantly impact the CO₂/Capacity Ratio due to their characteristically low emissions. Type_carbonated_water ranks second (0.055), reinforcing the dominant influence of beverage-related product types and consistent with the tight distribution observed in drink categories. Component_cheese (0.044) highlights the emission intensity of cheese-based products, confirming the strong link between dairy ingredients and higher carbon footprints. Type_poultry_meat_processed_food (0.035) and Type_fresh_vegetables (0.027) reflect the contrasting emission profiles of processed meats and plant-based products, aligning with the heterogeneity observed in the clustering results shown in Figure 4.
Year (0.024) suggests temporal variations in emissions, possibly reflecting changes in production practices, energy sources, or data collection methodologies over time. Component_none (0.023) likely indicates water-based products without additional ingredients or may reflect data gaps in component information. Type_fresh_fruits (0.022) further emphasizes the lower emission profiles of plant-based products compared to animal-derived ingredients. Country_France (0.022) indicates the influence of geographic origin on emissions, potentially reflecting regional differences in production methods, energy grids, or transportation distances. Component_fish (0.019) rounds out the top 10, demonstrating that seafood-based products contribute distinctly to emission patterns.
These feature-importance results validate the selection of input features for the model and confirm that product type, ingredient composition, and geographic origin are the primary drivers of PCF variation in the food and beverage sector. The prominence of specific product types (water, carbonated water) and components (cheese, fish) aligns with established understanding of carbon-intensive food categories, while the influence of temporal and geographic features suggests opportunities for targeted emission reduction strategies based on production timing and location.
4.2. The impact of Missing Packaging Information
Packaging materials are widely recognized as a significant contributor to product carbon emissions, yet the unified dataset used in this study, comprising 3,933 records, largely lacks detailed information on this critical variable. This limitation constrains the ability of machine learning models to fully capture packaging's impact on the CO₂/Capacity Ratio, representing a notable gap in current PCF estimation efforts.
As described in Section 2.2, features such as Category, Component, and Capacity were systematically extracted from source datasets, with "Packaging Materials" included where available. However, most records lack specific packaging details such as plastic type, material weight, and recyclability status. Where packaging information was absent, this was encoded as an informative feature (e.g., "doesn't mention" or "null" values) to preserve the data pattern. To supplement the sparse packaging data, a small subset of products was manually verified by physically examining packaging in Taiwanese supermarkets, as local data scarcity necessitated such direct observation efforts. Despite these supplementary efforts, the manually collected packaging information represents only a minor fraction of the 3,933 records, insufficient to robustly model packaging's contribution to carbon emissions across the full dataset.
Consequently, the model performance observed in Table 4 likely reflects emission patterns driven primarily by ingredients, production processes, and product capacity rather than packaging effects. This limitation may partially explain certain performance patterns. For example, the relatively modest improvements in some product categories could relate to unmodeled packaging variations (e.g., glass bottles versus aluminum cans, single-use plastic versus biodegradable materials) that create emission differences not captured by available features.
This data gap limits the study's ability to quantify packaging's specific contribution to carbon footprints, a critical oversight given packaging's documented environmental impact. Research has shown that packaging materials can account for 10-30% of total product emissions depending on the material type and lifecycle considerations. The absence of detailed packaging data prevents the proposed models from explicitly incorporating these well-established effects, potentially underestimating emissions for products with carbon-intensive packaging or overestimating emissions for products with minimal or sustainable packaging.
Future research should prioritize integrating comprehensive packaging information into PCF datasets, including material type, material weight, packaging volume, recyclability status, and material-specific lifecycle emissions. However, collecting such detailed packaging data at scale requires coordinated efforts beyond the scope of individual research studies. Governmental agencies, NGOs, and research institutions should collaborate to establish standardized protocols for recording and reporting packaging information in publicly accessible PCF databases. Such enhancements would enable machine learning models to explicitly disentangle packaging's contribution from other emission drivers, improving estimation accuracy and supporting evidence-based sustainable packaging policies.
While this study's findings demonstrate the effectiveness of GMM-based clustering for PCF estimation even with limited feature sets, the packaging data gap underscores the broader need for richer, more comprehensive datasets to fully address all carbon footprint drivers. Addressing this limitation through collaborative data collection efforts would significantly advance the field's ability to develop scalable, actionable tools for accurate PCF estimation and informed sustainability decision-making.
5. Conclusion
This study addressed the critical challenge of estimating Product Carbon Footprints (PCFs) for food and beverage products under conditions of limited training data per product category. While Life Cycle Assessment remains the gold standard, its prohibitive complexity creates significant barriers to widespread adoption, leaving consumers without accessible carbon footprint information. Machine learning offers a promising alternative, yet small training datasets per category have historically resulted in imprecise models.
To overcome these limitations, this study proposed a novel machine learning framework integrating seven diverse data sources into a unified dataset of 3,933 samples. Gaussian Mixture Models (GMM) were employed to cluster the data into distinct groups based on underlying emission patterns, enabling development of cluster-specific models including Random Forest Regression (RFR), K-Nearest Neighbors Regression (KNNR), and eXtreme Gradient Boosting (XGBoost).
Experimental results from ten repetitions of stratified five-fold cross-validation demonstrated that GMM-based approaches significantly outperformed standard models across all major product categories. GMM-RFR achieved 86.966% average MAPE versus 92.538% for standard RFR, GMM-KNNR achieved 95.613% versus 158.663% for standard KNNR, and GMM-XGBoost achieved 92.597% versus 97.790% for standard XGBoost. Paired t-tests confirmed statistical significance (p-values < 0.05), with KNNR showing particularly dramatic improvement (63.050 percentage point reduction). Feature importance analysis revealed that product type, ingredient composition, and geographic origin are primary drivers of PCF variation.
This research makes three primary contributions. First, it demonstrates that integrating diverse data sources effectively addresses data scarcity in PCF estimation. Second, it establishes that data-driven clustering based on emission patterns enables more accurate predictions than conventional categorical approaches. Third, it provides a scalable framework requiring only readily accessible product information, making accurate PCF estimation feasible without resource-intensive LCA requirements.
The study acknowledges important limitations. The dataset largely lacks detailed packaging information, which could account for 10-30% of total emissions, constraining the models' ability to capture packaging-related variations. Future research should prioritize collaborative efforts to collect comprehensive packaging data, extend the framework to other product sectors, and develop consumer-facing applications implementing this methodology.
In conclusion, this study confirms the substantial potential of machine learning approaches to estimate PCFs with high accuracy even with limited input data. By combining data integration with GMM-based clustering, the proposed framework offers a practical, scalable alternative to traditional LCA that enhances sustainability transparency for manufacturers while empowering consumers with actionable environmental information. As global climate efforts intensify, accessible and accurate PCF estimation tools represent critical enablers of sustainable consumption patterns and informed environmental policy.
Author Contributions
Conceptualization, Thing-Yuan Chang; methodology, Chien-Chih Chen; validation, Chin-Hsien Hsu; formal analysis, Chien-Chih Chen; investigation, Thing-Yuan Chang; data curation, His-Lin Chang; writing—original draft preparation, Fong-Kin Law; writing—review and editing, Chien-Chih Chen; visualization, Chin-Hsien Hsu; project administration, Thing-Yuan Chang;
Funding
This research received no external funding.
Institutional Review Board Statement
Not applicable
Informed Consent Statement
Not applicable
Data Availability Statement
The dataset cannot be made publicly available at this time, but can be provided upon reasonable request. Interested researchers are encouraged to contact the corresponding author for access.
Conflicts of Interest
The authors declare no conflict of interest.
References
- Giri, P.; Debnath, B. K.; Paul, S. A hybrid fuzzy decision-making framework for methodological analysis of barriers to low-carbon technology adoption in net-zero manufacturing supply chains. Eng. Appl. Artif. Intell. 2025, 162, 112612. [Google Scholar] [CrossRef]
- Poore, J.; Nemecek, T. Reducing food’s environmental impacts through producers and consumers. Science 2018, 360(6392), 987–992. [Google Scholar] [CrossRef] [PubMed]
- Wang, J.; Zhou, S.; Li, M.; Ren, G.; Ren, X.; Xiong, X.; Zhang, Y. Multi-echelon inventory optimization of waste electrical and electronic equipment closed-loop supply chain based on reinforcement learning under carbon tax policy. Eng. Appl. Artif. Intell. 2025, 154, 110987. [Google Scholar] [CrossRef]
- Schutzbach, M.; Miehe, R.; Sauer, A. Simplifying life cycle assessment: Basic considerations for approximating product carbon footprints based on corporate carbon footprints. Ecol. Indic. 2025, 176, 113710. [Google Scholar] [CrossRef]
- Scrucca, F.; Barberio, G.; Fantin, V.; Porta, P. L.; Barbanera, M. Carbon Footprint: Concept, Methodology and Calculation. In Carbon Footprint Case Studies: Municipal Solid Waste Management, Sustainable Road Transport and Carbon Sequestration; Muthu, S. S., Ed.; Springer Singapore, 2021; pp. 1–31. [Google Scholar] [CrossRef]
- Romeiko, X. X.; Zhang, X.; Pang, Y.; Gao, F.; Xu, M.; Lin, S.; Babbitt, C. A review of machine learning applications in life cycle assessment studies. Sci. Total Environ. 2024, 912, 168969. [Google Scholar] [CrossRef] [PubMed]
- Espinoza-Orias, N.; Lundquist, L. Life cycle assessment of reusable food and beverage packaging systems: A proposal of good practice. J. Clean. Prod. 2025, 499, 145207. [Google Scholar] [CrossRef]
- Bianchini, M.; Michalkova, V. Data Analytics in SMEs: Trends and policies. OECD SME and Entrepreneurship Papers. 2019. [Google Scholar] [CrossRef]
- Kiemel, S.; Rietdorf, C.; Schutzbach, M.; Miehe, R. How to Simplify Life Cycle Assessment for Industrial Applications—A Comprehensive Review. Sustainability 2022, 14(23), 15704. [Google Scholar] [CrossRef]
- Alghieth, M. Sustain AI: A Multi-Modal Deep Learning Framework for Carbon Footprint Reduction in Industrial Manufacturing. Sustainability 2025, 17(9), 4134. [Google Scholar] [CrossRef]
- Jairi, I.; Rekbi, A.; Ben-Othman, S.; Hammadi, S.; Canivet, L.; Zgaya-Biau, H. Enhancing particulate matter risk assessment with novel machine learning-driven toxicity threshold prediction. Eng. Appl. Artif. Intell. 2025, 139, 109531. [Google Scholar] [CrossRef]
- Crawford, R. H.; Bontinck, P.-A.; Stephan, A.; Wiedmann, T.; Yu, M. Hybrid life cycle inventory methods – A review. J. Clean. Prod. 2018, 172, 1273–1288. [Google Scholar] [CrossRef]
- Agez, M.; Muller, E.; Patouillard, L.; Södersten, C.-J. H.; Arvesen, A.; Margni, M.; …; Majeau-Bettez, G. Correcting remaining truncations in hybrid life cycle assessment database compilation. J. Ind. Ecol. 2022, 26(1), 121–133. [Google Scholar] [CrossRef]
- Li, X.; Chu, L.; Li, Y.; Ding, F.; Quan, Z.; Qu, F.; Xing, Z. Multi-scale patch transformer with adaptive decomposition for carbon emissions forecasting. Eng. Appl. Artif. Intell. 2025, 146, 110153. [Google Scholar] [CrossRef]
- Dong, Z.; Wang, X.; Zhang, J.; Yu, P.; Cai, Z. Multimodal interval prediction of carbon dioxide emissions from heavy construction machinery: a missing-data robust inverted-transformer model considering sensors failure in complex construction environment. Eng. Appl. Artif. Intell. 2025, 162, 112658. [Google Scholar] [CrossRef]
- Al Nuaimi, H. S.; Acquaye, A.; Mayyas, A. Machine learning applications for carbon emission estimation. Resour. Conserv. Recycl. Adv. 2025, 27, 200263. [Google Scholar] [CrossRef]
- Delanoë, P.; Tchuente, D.; Colin, G. Method and evaluations of the effective gain of artificial intelligence models for reducing CO2 emissions. J. Environ. Manag. 2023, 331, 117261. [Google Scholar] [CrossRef] [PubMed]
- Kong, X.; Zhang, R.; Gao, B.; Liu, G.; Fang, K.; Duan, M. An interpretable privacy-preserving real-time carbon emission estimation approach for heterogeneous industrial enterprises. Eng. Appl. Artif. Intell. 2025, 158, 111420. [Google Scholar] [CrossRef]
- Mumtaz, A.; Yan, L.; Fu, B.; Ahmad, K.; Ali, M. B.; Ali, A. Multi-objective optimization of sustainable fly ash cement bricks considering compressive strength and carbon emission. Eng. Appl. Artif. Intell. 2026, 165, 113502. [Google Scholar] [CrossRef]
- Liu, X.; Yu, H.; Liu, H.; Sun, Z. Multi-Factor Carbon Emissions Prediction in Coal-Fired Power Plants: A Machine Learning Approach for Carbon Footprint Management. Energies 2025, 18(7), 1715. [Google Scholar] [CrossRef]
- Fiedler, G. B.; Lundie, S. Adapting machine-learning estimators to account for the downward bias of reported greenhouse gas Scope 3 emissions. J. Clean. Prod. 2025, 519, 145781. [Google Scholar] [CrossRef]
- Guan, K.; Jin, Z.; Peng, B.; Tang, J.; DeLucia, E. H.; West, P. C.; …; Yang, S.-J. A scalable framework for quantifying field-level agricultural carbon outcomes. Earth-Sci. Rev. 2023, 243, 104462. [Google Scholar] [CrossRef]
- Li, D.-C.; Lin, W.-K.; Chen, C.-C.; Chen, H.-Y.; Lin, L.-S. Rebuilding sample distributions for small dataset learning. Decis. Support Syst. 2018, 105, 66–76. [Google Scholar] [CrossRef]
- Seto, E.; Li, X.; Zeng, Y.; Liu, J. Machine learning-based corrosion prediction in supercritical carbon dioxide transport pipelines: Model evaluation and experimental validation. Eng. Appl. Artif. Intell. 2026, 172, 114294. [Google Scholar] [CrossRef]
- AGRIBALYSE. Discover the Environmental Impact for Food Consumed Products. 2025. etrieved February 23, 2026, from https://agribalyse.ademe.fr/.
- Meinrenken, C. J.; Chen, D.; Esparza, R. A.; Iyer, V.; Paridis, S. P.; Prasad, A.; Whillas, E. The Carbon Catalogue, carbon footprints of 866 commercial products from 8 industry sectors and 5 continents. Sci. Data 2022, 9(1), 87. [Google Scholar] [CrossRef] [PubMed]
- Taiwan Ministry of Environment. Carbon footprint of products in Taiwan. 2024. Available online: https://data.moenv.gov.tw/en/dataset/detail/CFP_P_01.
- Netherlands National Institute for Public Health and the Environment Ministry of Health. Database milieubelasting voedingsmiddelen 2024. 2024. Retrieved February 23, 2026, from https://www.rivm.nl/documenten/database-milieubelasting-voedingsmiddelen-2024.
- Intergovernmental Panel on Climate Change. Emission Factor Database. 2025. Retrieved February 23, 2026, from https://www.ipcc-nggip.iges.or.jp/EFDB/main.php.
- Zhu, F.; Yao, Z.; Ji, W.; Liu, D.; Zhang, H.; Li, A.; …; Zhou, Q. An efficient resin for solid-phase extraction and determination by UPLCMS/MS of 44 pharmaceutical personal care products in environmental waters. Front. Environ. Sci. Eng. 2020, 14(3), 51. [Google Scholar] [CrossRef]
- Product Carbon Footprint Database Open Science Framework. n.d. Retrieved February 23, 2026, from https://osf.io/eufgw/.
- Deng, J.; Hu, T.; Han, M.; Liu, Y.; Duan, Y.; Gu, D.; …; Lu, J. Optimization strategies for the carbon footprint of aluminum-plastic materials under low-carbon targets. J. Clean. Prod. 2025, 498, 145182. [Google Scholar] [CrossRef]
Figure 1.
The process of the proposed procedure.
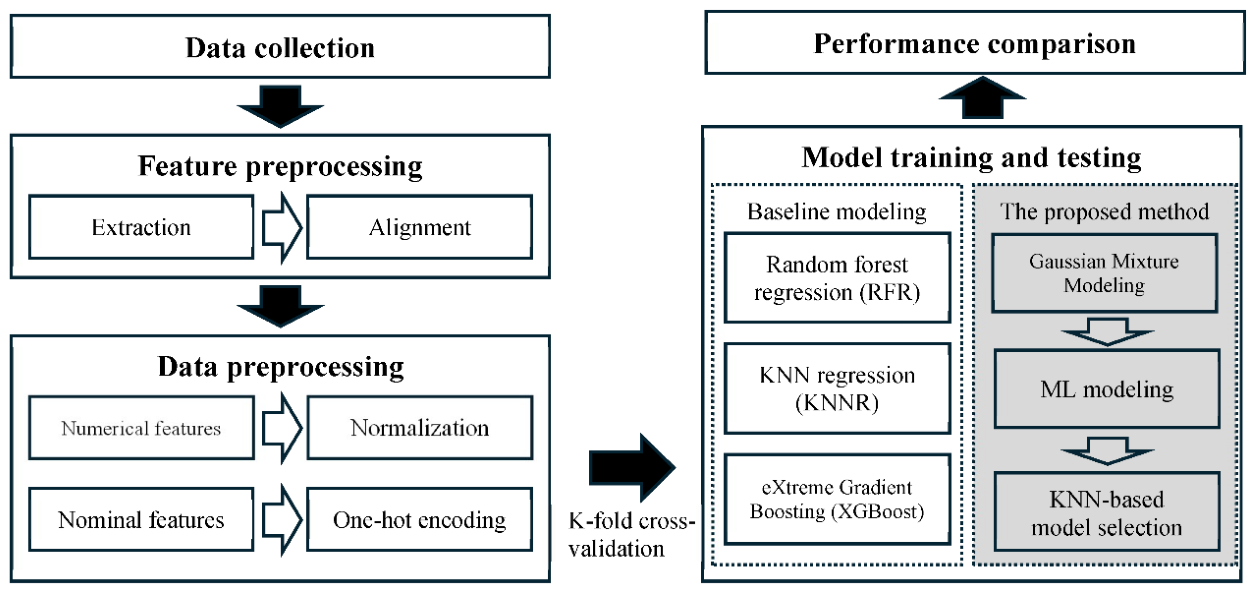
Figure 2.
Density plot of the target variable (CO2/capacity ratio) in the unified dataset.
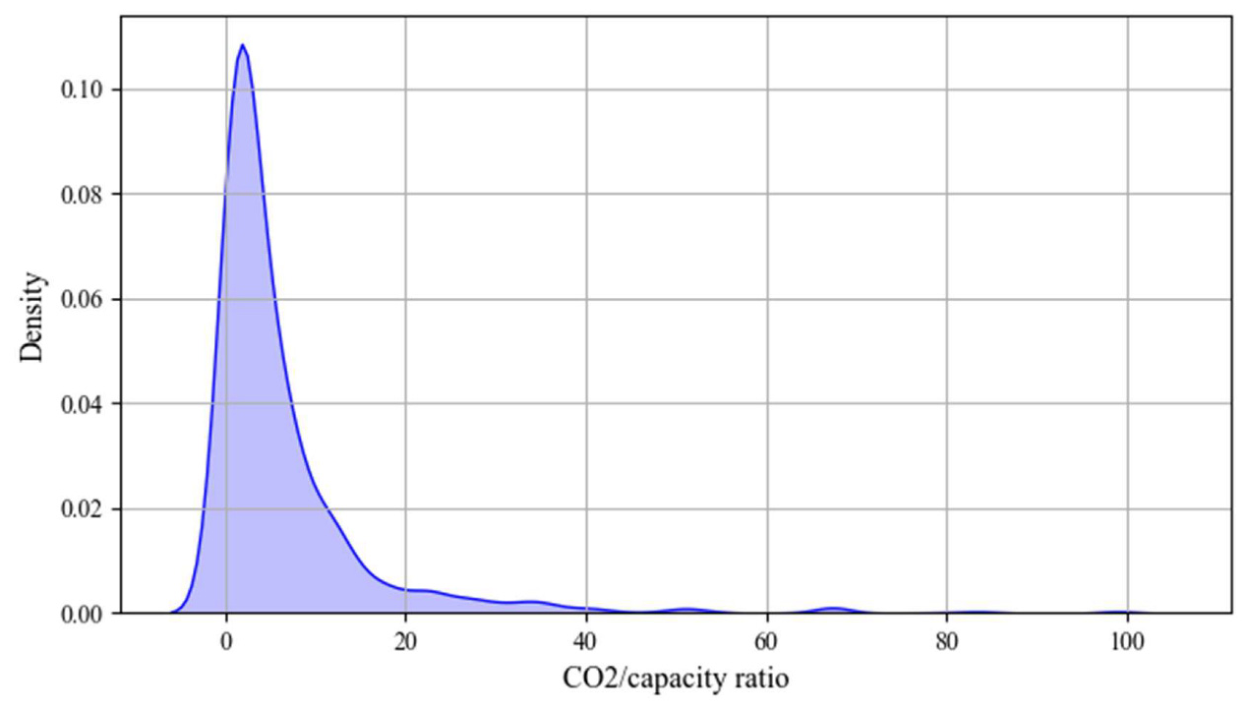
Figure 3.
The proposed method.
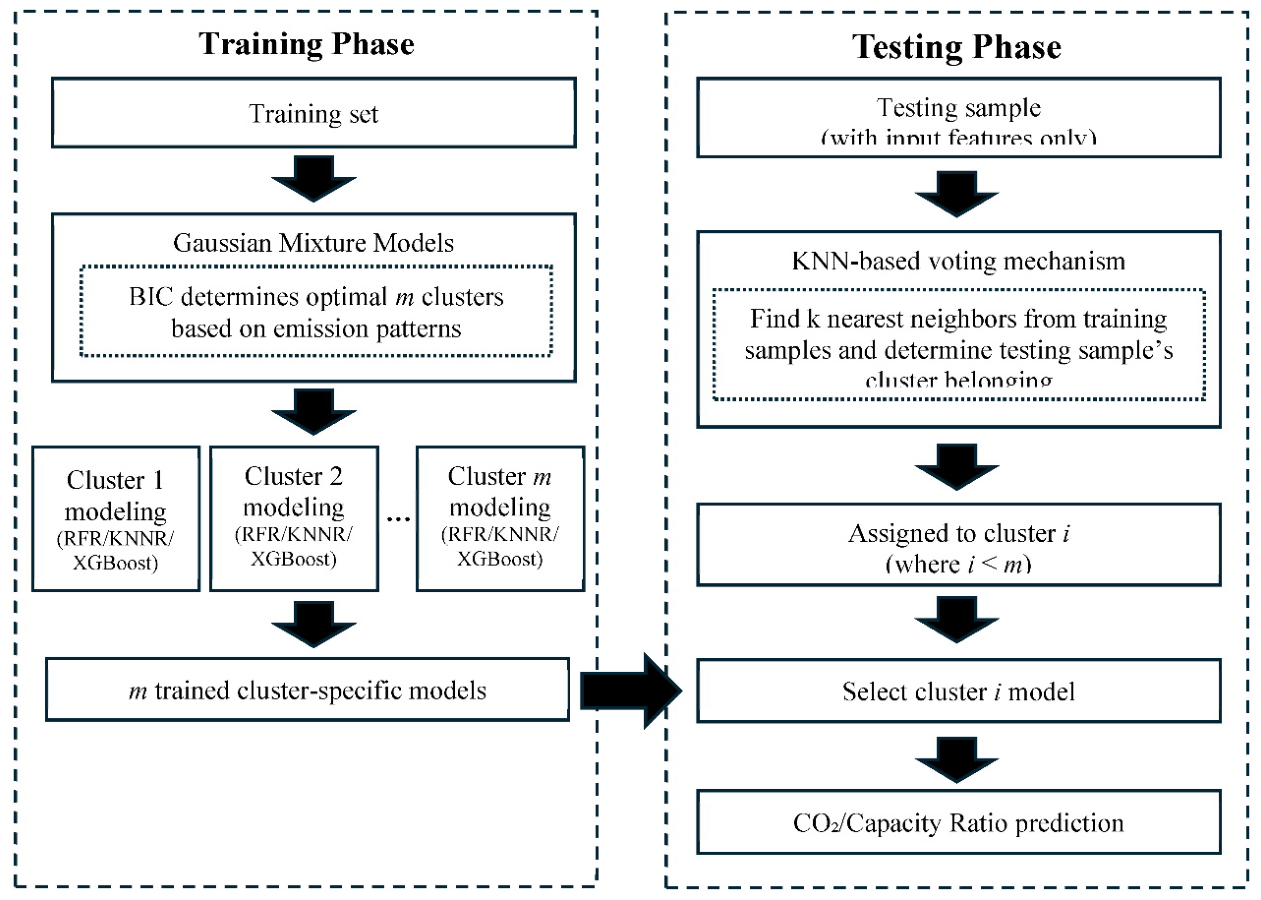
Figure 4.
Distribution of CO₂/Capacity Ratio across eight GMM clusters.
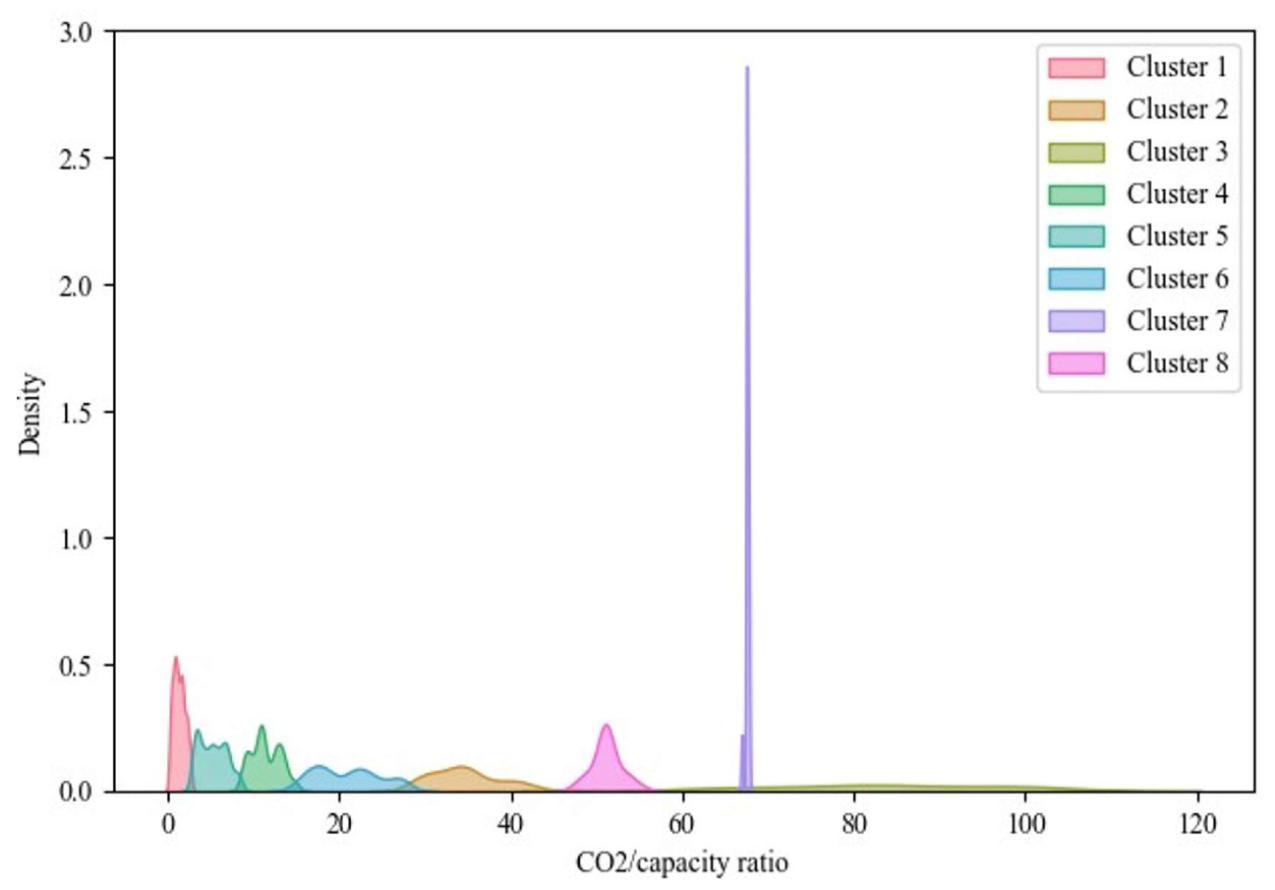
Figure 5.
Top 10 feature importances in GMM-RFR model (unified training dataset).
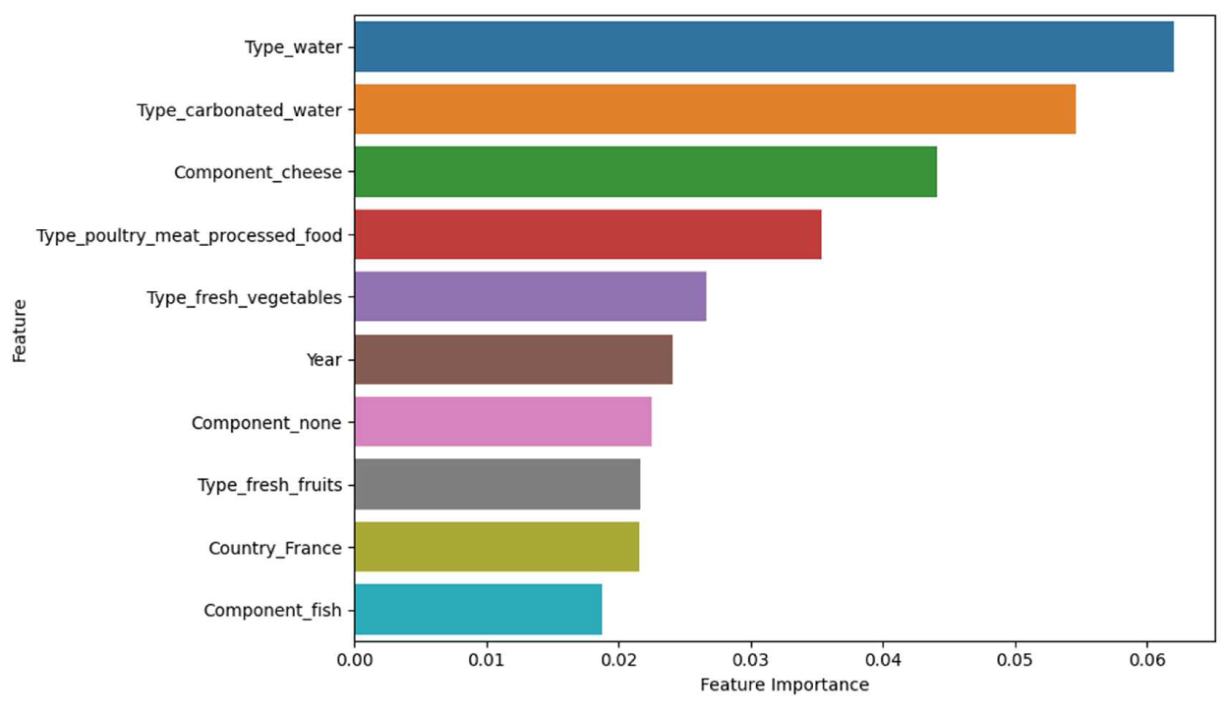
Table 2.
Data sizes in product categories and their types.
| Product Category | Product Type | Data Size | Product Category | Product Type | Data Size |
| Animal and Plant Products (1,897 records) |
Coffee powder | 25 | Drinks (547 records) |
Beer | 25 |
| Cream and milk fat | 318 | Carbonated water | 108 | ||
| Edible animal fats and oils and their blends | 2 | Chocolate | 9 | ||
| Edible plant-based ground products | 61 | Coffee | 14 | ||
| Fresh eggs | 37 | Grain drinks | 36 | ||
| Fresh fruits | 129 | Honey | 3 | ||
| Fresh meat | 308 | Juice | 74 | ||
| Fresh nut | 38 | Milk | 72 | ||
| Fresh organ | 38 | Tea | 24 | ||
| Fresh seafood | 306 | Vegetables extracts | 3 | ||
| Fresh vegetables | 413 | Water | 76 | ||
| Grain | 4 | Wine | 64 | ||
| Insect | 2 | Yogurt | 39 | ||
| Oatmeal | 70 | Prepared Food (1,018 records) |
Algae | 14 | |
| Poultry and aquatic animal extracts | 3 | Bake cake | 43 | ||
| Rice | 33 | Bar | 44 | ||
| Seeds | 22 | Biscuit | 82 | ||
| Vegetable oil | 69 | Bread | 106 | ||
| Wheat | 19 | Candy | 4 | ||
| Dishes (471 records) |
Burger | 14 | Chocolate powder | 3 | |
| Cooked eggs | 16 | Doughnut | 4 | ||
| Cooked meat | 91 | Edible plant-based ground products | 1 | ||
| Cooked noodles | 5 | Glass noodles | 8 | ||
| Cooked oatmeal | 1 | Grain | 3 | ||
| Cooked organ | 17 | Ice cream | 17 | ||
| Cooked rice | 6 | Meatballs | 6 | ||
| Cooked seafood | 40 | Milk powder | 12 | ||
| Cooked vegetables | 107 | Pet food | 15 | ||
| Dessert | 31 | Poultry meat processed food | 101 | ||
| Meatballs | 1 | Pre-processed fruits | 16 | ||
| Mixed dishes | 51 | Pre-processed meat | 34 | ||
| Pizza | 23 | Pre-processed noodles | 39 | ||
| Poultry meat processed food | 19 | Pre-processed nut | 12 | ||
| Pudding | 11 | Pre-processed organ | 2 | ||
| Sandwich | 38 | Pre-processed seafood | 31 | ||
| Pre-processed vegetables | 67 | ||||
| Puffed food | 24 | ||||
| Sauce made from plants | 107 | ||||
| Seasoning | 22 | ||||
| Seeds | 4 | ||||
| Snack | 27 | ||||
| Soup | 46 | ||||
| Stuffed pastries | 91 | ||||
| Tart | 23 | ||||
| Wheat | 10 |
Table 3.
The experimental platform.
| Items | Values |
| Evaluation approach | Ten repetitions of stratified five-fold cross-validation |
| Performance metric | Mean Absolute Percentage Error (MAPE) |
| Programming language | Python |
| Machine learning libraries | scikit-learn (sklearn) |
| Cross-validation | sklearn.model_selection.StratifiedKFold |
| Performance metric | sklearn.metrics.mean_absolute_percentage_error |
| Numerical feature preprocessing | sklearn.preprocessing.MinMaxScaler |
| Nominal feature preprocessing | sklearn.preprocessing.OneHotEncoder |
| Clustering (GMM) | sklearn.mixture.GaussianMixture |
| Random Forest Regression | sklearn.ensemble.RandomForestRegressor |
| K-Nearest Neighbors Regression | sklearn.neighbors.KNeighborsRegressor |
| XGboost | xgboost |
Table 4.
Experimental results (MAPEs).
| Runs | Folds | RFR | GMM-RFR | KNNR | GMM-KNNR | XGB | GMM-XGB | Group sizes |
| 1 | 1 | 96.299% | 79.622% | 165.932% | 82.290% | 100.812% | 101.721% | 10 |
| 2 | 81.524% | 65.895% | 148.793% | 73.701% | 87.345% | 85.307% | 10 | |
| 3 | 92.773% | 76.608% | 161.530% | 90.255% | 97.341% | 109.021% | 7 | |
| 4 | 101.643% | 94.865% | 162.768% | 103.911% | 104.943% | 119.274% | 9 | |
| 5 | 91.028% | 83.655% | 152.709% | 89.153% | 100.524% | 90.888% | 10 | |
| 2 | 1 | 101.239% | 80.777% | 171.004% | 86.429% | 104.519% | 87.888% | 9 |
| 2 | 80.876% | 58.302% | 137.903% | 69.111% | 86.495% | 83.093% | 9 | |
| 3 | 87.227% | 82.194% | 143.465% | 91.111% | 94.619% | 82.662% | 9 | |
| 4 | 96.135% | 67.725% | 172.034% | 74.247% | 100.238% | 96.935% | 9 | |
| 5 | 97.063% | 91.467% | 161.967% | 98.942% | 101.217% | 84.184% | 9 | |
| 3 | 1 | 90.569% | 105.182% | 161.829% | 120.678% | 94.755% | 92.955% | 10 |
| 2 | 109.376% | 94.843% | 171.283% | 100.150% | 110.451% | 97.922% | 9 | |
| 3 | 80.506% | 64.344% | 150.858% | 69.414% | 86.933% | 80.395% | 10 | |
| 4 | 84.342% | 75.000% | 135.758% | 80.044% | 87.417% | 78.800% | 7 | |
| 5 | 103.607% | 68.729% | 169.806% | 81.819% | 105.266% | 100.750% | 10 | |
| 4 | 1 | 87.725% | 86.183% | 149.081% | 96.784% | 91.837% | 87.139% | 10 |
| 2 | 80.099% | 81.692% | 149.428% | 89.198% | 83.933% | 81.885% | 10 | |
| 3 | 99.556% | 93.887% | 156.695% | 104.158% | 104.400% | 94.391% | 10 | |
| 4 | 89.123% | 114.554% | 158.522% | 128.202% | 97.975% | 115.582% | 10 | |
| 5 | 94.902% | 81.416% | 183.507% | 88.667% | 96.577% | 81.657% | 9 | |
| 5 | 1 | 98.634% | 89.083% | 166.788% | 92.713% | 99.470% | 89.126% | 10 |
| 2 | 85.133% | 76.975% | 154.649% | 85.506% | 90.088% | 77.549% | 9 | |
| 3 | 101.448% | 113.044% | 167.938% | 131.601% | 108.089% | 114.339% | 9 | |
| 4 | 91.567% | 90.367% | 153.662% | 95.496% | 100.791% | 90.265% | 10 | |
| 5 | 82.517% | 77.648% | 139.313% | 89.058% | 86.746% | 78.247% | 9 | |
| 6 | 1 | 88.959% | 78.905% | 146.565% | 80.763% | 90.683% | 81.281% | 10 |
| 2 | 93.775% | 86.476% | 150.953% | 93.675% | 96.836% | 108.190% | 10 | |
| 3 | 107.239% | 149.092% | 177.338% | 158.971% | 117.622% | 93.603% | 10 | |
| 4 | 86.565% | 102.295% | 157.288% | 114.161% | 94.589% | 96.244% | 10 | |
| 5 | 88.657% | 76.433% | 159.902% | 87.627% | 91.787% | 86.707% | 10 | |
| 7 | 1 | 77.428% | 79.190% | 147.125% | 90.402% | 81.980% | 79.354% | 9 |
| 2 | 89.047% | 91.652% | 155.250% | 103.633% | 94.208% | 93.261% | 9 | |
| 3 | 110.769% | 98.071% | 174.706% | 104.035% | 116.400% | 98.155% | 9 | |
| 4 | 91.041% | 88.930% | 150.044% | 98.321% | 97.069% | 89.839% | 10 | |
| 5 | 93.558% | 93.443% | 168.669% | 96.825% | 98.734% | 94.207% | 10 | |
| 8 | 1 | 104.932% | 98.465% | 171.918% | 113.147% | 108.950% | 113.033% | 9 |
| 2 | 80.892% | 72.403% | 148.081% | 79.092% | 85.575% | 85.933% | 10 | |
| 3 | 89.785% | 87.902% | 148.114% | 98.959% | 102.103% | 87.084% | 10 | |
| 4 | 85.846% | 60.820% | 159.467% | 66.655% | 92.976% | 82.470% | 9 | |
| 5 | 94.554% | 73.907% | 163.849% | 84.557% | 95.170% | 101.695% | 9 | |
| 9 | 1 | 98.834% | 136.955% | 193.120% | 140.014% | 105.975% | 99.389% | 7 |
| 2 | 96.211% | 75.593% | 167.800% | 84.304% | 97.201% | 107.295% | 9 | |
| 3 | 88.805% | 72.130% | 145.479% | 88.839% | 97.805% | 82.024% | 5 | |
| 4 | 89.791% | 78.840% | 143.715% | 82.097% | 93.666% | 83.436% | 9 | |
| 5 | 100.459% | 101.147% | 151.290% | 110.681% | 110.079% | 110.431% | 10 | |
| 10 | 1 | 83.536% | 84.732% | 146.240% | 88.947% | 88.987% | 84.790% | 10 |
| 2 | 99.981% | 89.140% | 168.469% | 94.322% | 107.888% | 89.710% | 10 | |
| 3 | 104.587% | 98.921% | 173.324% | 108.657% | 107.278% | 98.991% | 10 | |
| 4 | 88.887% | 79.873% | 164.210% | 87.014% | 98.573% | 79.960% | 10 | |
| 5 | 87.876% | 98.918% | 153.002% | 112.307% | 94.583% | 100.789% | 8 | |
| Averages | 92.538% | 86.966% | 158.663% | 95.613% | 97.790% | 92.597% | ||
| P-values | 0.0099 | 0.0000 | 0.0002 | |||||
Disclaimer/Publisher’s Note: The statements, opinions and data contained in all publications are solely those of the individual author(s) and contributor(s) and not of MDPI and/or the editor(s). MDPI and/or the editor(s) disclaim responsibility for any injury to people or property resulting from any ideas, methods, instructions or products referred to in the content. |
© 2026 by the authors. Licensee MDPI, Basel, Switzerland. This article is an open access article distributed under the terms and conditions of the Creative Commons Attribution (CC BY) license (http://creativecommons.org/licenses/by/4.0/).
Copyright: This open access article is published under a Creative Commons CC BY 4.0 license, which permit the free download, distribution, and reuse, provided that the author and preprint are cited in any reuse.