
Submitted:
17 August 2026
Posted:
18 August 2026
You are already at the latest version
Abstract
In recent years, Wireless Sensor Networks (WSN) have skilled quick development and great growth due to its extensive uses across a range of industries, such as healthcare, manufacturing, military, and so on. WSN most commonly utilizes mobile sinks for reducing the energy-hole problem during collection of data from the randomly dispersed sensor nodes. The mobile sinks in WSN should be placed in such a way that it extends the lifetime of WSNs. This paper proposes a model named Deep Q Net is utilized for the placement of mobile sink. Initially, the cell network is transformed by the Voronoi partition, and the network is partitioned into various clusters. Then Cluster Head (CH) is selected by employing Deep Embedded Clustering (DEC). The optimal placement of the mobile sink is carried out using the adjacency-based cell score, which effectively places the mobile sink using the constrained factors Afterward, to detect the location of the mobile sink, an adjacency-based cell score is utilized, which is done by employing various factors, like fairness, distance, and predicted energy. Next, energy prediction for the detection of mobile sink is performed using Deep Q Net. Furthermore, Proposed Deep Q Net obtained a minimum distance with the value of 26m whereas normalized fairness, energy, normalized throughput, and network lifetime acquired a maximum value of 67, 0.006J, 81, and 92S respectively.
Keywords:
wireless sensor network
; Deep Q Net
; energy prediction
; mobile sink placement
; adjacency-based cell score
1. Introduction
The great number of low-cost sensors that are compactly and randomly organized in the region to be monitored is called the sensor network [1]. WSN comprises numerous mobiles as well as static sensors that are arranged in a multi-hop self-organizing fashion [2]. WSN includes numerous nodes and comprises several data collection points called sinks. In general, sensor nodes are very small electronic components with minimal resources, like processing energy, and memory [3]. Moreover, in order to collect precise data through multi-hop interaction with the Base Station (BS), such nodes are constructed frequently. The main purpose of the sink node is to receive the collected information [4].Every WSN is constrained by low data rates, energy reservations, and usually a many-to-one communication pattern [5].Wireless sensor networks have attracted significant attention because of the large number of new applications in home automation, environmental monitoring, military operations, health services, and other commercial environments [6].A WSN which optimizes energy usage and provides high system performance must be planned by the network designer based on various criteria. Furthermore, distinctive circumstances for large-scale WSNs comprise of multiple sinks and multiple sources. Compared to a single sink, multiple sinks provide a better manageability of WSNs [7].
In WSN, the terminal node forwards the information to the sink node through multi-hop [8]. However, multi-hop data transmission causes an energy hole. As the nodes situated around the sinkhole take many tasks to forward the data, the nodes may exhaust or consume a lot of energy, and this will damage the network connectivity in WSN [9]. Due to the collision caused by frequent data transmission and communication between nodes, the multi-hop transmission produces communication overhead [10]. Initially, mobile sinks are utilized for determining the optimal sink location, after that the stationary sinks are employed for gathering data packets from sensor nodes by multi-hop communication. When sinks and sensor nodes are improperly deployed it becomes hard to manage an operational network, which has an adverse effect on system performance and energy consumption. For a random-based deployment process of a WSN, the sink placement becomes an important criterion for the network designer to increase the network lifetime and system [11]. One way to balance the load over the network is to deploy more nodes in areas closer to the sink [12]. Achieving maximum lifetime in stationary WSNs by optimally using the energy within sensor nodes has been the subject of significant research in the last recent years [13]. Furthermore, the main difficulty is in estimating the optimal location of BS. Here, the distribution of WSNs is executed in a structured or planned method in a semi-random pattern [14].
Wireless Sensor Network (WSN) is an emerging and exigent technology being used in various applications such as health monitoring, GPS tracking, security, environmental monitoring etc. In WSN, numerous cost-effective and energy-constrained sensor nodes are typically used. The mobile sinks gather the information from the sensors deployed in the environment periodically, in such a way to avoid the energy-crisis and hotspot issues. Moreover, the use of mobile sinks in a WSN can effectively improve the network performance and it has been exploited in numerous schemes to prolong the lifetime of WSNs. In this work, an effective strategy is developed to detect the location of a mobile sink and energy prediction of WSN. The optimal placement of the mobile sink is achieved using the adjacency-based cell score in such a way that the lifespan of the network is extended and the energy consumed by the nodes is reduced based on the factors, like the location of the sink, fairness, energy, and Euclidean distance.
This work implements a method for mobile sink placement using the proposed Deep Learning (DL) method-based energy prediction in WSN. The cell network is transformed by Voronoi partition and then various clusters are formed. From each cluster, the CH is selected utilizing DEC. Then, the location of mobile sink is identified based on adjacency-based cell score computed using several factors such as distance, fairness, and predicted energy. The Deep Q Net is employed for energy prediction.
The contribution of the work is mentioned below,
- Optimized Mobile Sink Placement using Deep Q Net: The proposed model utilizes Deep Q Net for the optimal placement of mobile sinks in Wireless Sensor Networks (WSN), ensuring that the mobile sink is strategically positioned to extend the network's lifetime and reduce the energy-hole problem effectively.
- Cluster Formation with Voronoi Partition and Deep Embedded Clustering: The approach incorporates Voronoi partitioning to transform the cell network and divides it into various clusters. It also employs Deep Embedded Clustering (DEC) for the efficient selection of Cluster Heads (CH), enhancing data collection and energy efficiency within the WSN.
- Enhanced Network Performance Metrics: The work presents a novel approach for optimizing the placement of mobile sinks in Wireless Sensor Networks (WSNs) using Deep Q Net. By employing Voronoi partitioning to transform the network into clusters and leveraging Deep Embedded Clustering (DEC) for Cluster Head (CH) selection, the approach ensures efficient data collection and enhanced energy management.
The organization of the residual sections is mentioned as. part 2 elucidates existing techniques for mobile sink placement in the WSN network, part 3 elaborates on the proposed work, its outcome along with the analysis is discussed in part 4, and last, the conclusion is elaborated in part 5.
2. Motivation
Wireless Sensor Networks (WSNs) have become increasingly vital in various applications, such as environmental monitoring, healthcare, military operations, and industrial automation. A significant challenge in WSNs is the "energy-hole problem," where sensor nodes closer to the sink deplete their energy more rapidly than those farther away, leading to early network failure and reduced overall network lifetime. Mobile sinks offer a promising solution to this issue by relocating dynamically to balance energy consumption among nodes. However, achieving optimal placement of mobile sinks is complex and challenging. Many existing techniques rely on heuristic or static strategies that fail to adapt to the dynamic nature of WSNs, leading to suboptimal sink positions, uneven energy use, and limited network efficiency. Additionally, some methods are too complex or do not scale well, making them impractical for real-world applications. Moreover, these techniques often inadequately account for the changing conditions within the network, such as varying node energy levels and fluctuating topologies, further complicating the placement process. This research is motivated by the need to address these challenges by developing a robust and adaptive approach for mobile sink placement. By leveraging advanced techniques like Deep Q Net, Voronoi partitioning, and Deep Embedded Clustering (DEC), this work aims to ensure that mobile sinks are positioned optimally, reducing energy consumption and significantly extending network lifetime, thereby overcoming the limitations of existing methods.
2.1. Literature Review
Before exploring the proposed solution, it is crucial to review the existing literature on mobile sink placement in Wireless Sensor Networks (WSNs). Numerous strategies have been developed to address the energy-hole problem and extend network lifetime, yet many fall short in adapting to the dynamic nature of WSNs. This review will examine these methods, highlighting their limitations and the gaps that motivate the need for more robust and adaptive solutions.
Kaur, C., et al. [1] introduced Deep Maxout Network (DMN) to detect the position of mobile sink. It solved the optimization issues and it enhanced the performance, and network lifetime. However,it was unsuccessful in ensuring the upper bound of the estimation ratio. A tree-based heuristic data dissemination method called Tuft was devised by Busaileh, O., et al. [10] for increasing the regularity of energy consumption in network. This method increased the success ratio and network lifetime was prolonged in all situations. Nevertheless, it suffered from high energy consumption and time complexity.El-Fouly, F.H., et al. [11] developed an Integer Linear Programming (ILP) for Energy and Environment-Aware Path Planningin WSN. This technique was more effective and the delivery time was less. However, it took more computation time as this method required more realistic parameters.The dynamic Mobility and Energy Aware Algorithm (DMEAAL) technique was presented by Thomson, C., et al. [12] for balancing the energy consumption across individual nodes. This approach was successful in both controlling and forming grid networks which improved the lifetime of the network. Nevertheless, there was no guarantee to energy at the same rate, and this approach failed to perform in practical applications.
Zhang, L. and Wan, C [16,17] introduced a dynamic mobile sink node moving path planning algorithm (DPPMSBT) for intensive WSN in order to collect the periodic data from the whole network. It generated the burst data from a single area. It gained more advantage in terms of packet loss rate, network lifetime, and path length. It degraded the performance in the view of dropped packets. Chauhan, V. and Soni, S [18] developed a mobile sink-based energy-aware clustering (MSEAC) protocol to solve the issues of energy hole in order to increase the lifetime of the network. It outperformed the existing methods in terms of residual energy, packet delivery ratio, delay, and lifespan of the network.
Amar Kaswan et al. [19] developed a model named as, multi-objective particle swarm optimization (MOPSO), for the mobile sink placement. This method was used to select the best global and local solutions in the search space, which offered better results in statistical significance. The optimization of multiple mobile sinks was the major drawback of this method. Praveen Kumar et al. [20] proposed a method for the path determination of mobile sink based on the Ant Colony Optimization (ACO). This method offered better results in energy consumption and network lifetime. Anyhow, handling of multiple mobile sinks with non-uniform data constraints were difficult.
Saunhita Sapre, and S. Mini [21] developed an optimization algorithm, named Differential Moth Flame Optimization (DMFO), in which traversal strategy was used for the mobile sink placement. This method offered better results in energy consumption and network lifetime but failed to calculate the data latency and throughput. Elie T. Fute et al. [22] proposed an instantaneous clustering algorithm (ICP) for the determination of the target points from the mobile sink. The main aim of this method was to reduce the clustering time and increasing the network's lifetime. The communication overhead was the major disadvantage of this method.
Challenges noted from the review are listed below;
In [10], the Tuft method was effective in reducing energy consumption and maintaining a stable network lifetime. However, it faced challenges with a decreased success ratio and high delivery delays, which resulted in increased overhead costs. The Integer Linear Programming (ILP) approach described in [11] was praised for its reliability, energy efficiency, and applicability in real-time applications, achieving environment-aware routing. Nonetheless, it struggled with ensuring consistent data transmission, which contributed to increased end-to-end delays. The Dynamic Mobility and Energy Aware Algorithm (DMEAAL) presented in [12] demonstrated enhanced efficiency, but it was prone to delays and data loss. Additionally, nodes were unable to implement the DMEAAL approach effectively until the message was fully established. Despite various approaches being employed for mobile sink placement to minimize energy consumption and reduce communication delays, existing methods often fell short in delivering precise performance, particularly when sink nodes were situated in void areas.
3. Proposed Deep Q Net-Based Energy Prediction for Mobile Sink Placement in WSN
To place the mobile sink optimally in WSN without degrading the network lifetime and energy consumption poses a major challenging task. Hence, an adjacency-based cell score is formed in this research to perform the mobile sink placement optimally. Initially, the nodes are simulated in the WSN and they are transformed into the cell. This part describes the developed Deep Q Net-based energy prediction for the placement of mobile sink in WSN.
The developed model is implemented by considering the following steps. Primarily, the cell network is altered by the Voronoi partition, where the network is transformed into various clusters. The CH is then selected using DEC [13], and subsequently, the adjacency-based cell score is employed to identify the location of the mobile sink using factors such as predicted energy, distance, and fairness. The energy prediction for the identification of the mobile sink is executed using the Deep Q Net [14]. The diagram that illustrates the proposed Deep Q Net-based energy prediction model for mobile sink placement in WSN is shown in Figure 1, and Table 1 displays the list of abbreviations.
3.1. Transformation of Cell Network Using Voronoi Partition
Primarily, nodes in WSN are clustered, for transforming the nodes in cell network. Moreover, Voronoi partition is utilized for transforming the simulated nodes into different cells. The Voronoi partition is chiefly employed for optimal division of cells in WSN. The clusters of different cell regions are signified as , where, , andstands for the count of divided cell regions in WSN. These divided cell regions are formed based on nodes like . Once the transformation of the cell network is accomplished, and the transformed cell is exposed to CH selection process.
3.2. Deep Embedded Clustering for Effective CH Selection
DEC [13] is commonly utilized because of its improved performance and scalability. Moreover, DEC comprises two stages, like parameter initialization and parameter optimization. In parameter initialization, deep autoencoder is employed whereas in parameter optimization, an iterative process is performed among Kullback–Leibler (KL) divergence and auxiliary target distribution. Here, a group ofis partitioned into clusters and it is described through a cluster centroid , . To change the data latent feature space , DEC employs non-linear mapping , where learnable parameters are represented as , and DNN is utilized to parameterize .
3.2.1. Clustering with KL Divergence
An unsupervised approach exchanges between two stages, and is utilized for enhancing the clustering with a value of and. In first stage, soft assignment is assessed among embedded points and cluster centroids. In second stage, deep mapping is updated and high-confidence assignments are learned by employing auxiliary target distribution. Moreover, these two stages are performed repeatedly until convergence is obtained.
a) Soft assignment
To determine the relations among centroid and embedded point by utilizing the student’s t-distribution which is demonstrated as
where, the degree of freedom is designated as , soft assignment is specified as by assigning the sample to the cluster , related to after embedding.
b) KL divergence reduction
In order to process the clusters constantly, an auxiliary target distribution is employed that relies on learned data. Moreover, soft assignments are coordinated to target distribution to train the approach. The equation of loss in KL divergence is formulated as,
where, the loss is indicated as , which shows loss between and , target distribution is mentioned as , and soft assignments are symbolized as .To evaluate the value of , the expression is given as,
Here, the soft clusters are represented by . To reduce the loss in KL divergence, fine-tuning is done after pre-training, hence the nodes are efficiently partitioned using DEC into various clusters and the CH is selected. However, the algorithmic steps involved in DeepQNet_MobileSink_Placement Algorithm 1.
| Algorithm 1 DeepQNet_MobileSink_Placement |
| Input: SensorNodeLocations[] // Array of sensor node coordinates NetworkDimensions // Dimensions of the network area Output: OptimalMobileSinkLocation // Position of the mobile sink PerformanceMetrics // Metrics including distance, fairness, energy, throughput, and lifetime 1. Initialize Network: Initialize SensorNodeLocations Initialize NetworkDimensions 2. Network Partitioning: VoronoiPartition = VoronoiPartition(NetworkDimensions, SensorNodeLocations) Clusters[] = PartitionNetwork(VoronoiPartition) 3. Cluster Head Selection: For each Cluster in Clusters: CH = DeepEmbeddedClustering(Cluster) Add CH to ClusterHeadList[] 4. Mobile Sink Placement: For each potential MobileSinkLocation in NetworkDimensions: AdjacencyScore = ComputeAdjacencyBasedCellScore(MobileSinkLocation, ClusterHeadList, SensorNodeLocations) Store AdjacencyScore for MobileSinkLocation OptimalMobileSinkLocation = SelectLocationWithHighestScore(AdjacencyScore) 5. Energy Prediction: EnergyPrediction = DeepQNetPredict(OptimalMobileSinkLocation, SensorNodeLocations) 6. Evaluation: MinimumDistance = CalculateMinimumDistance(OptimalMobileSinkLocation, SensorNodeLocations) NormalizedFairness = ComputeNormalizedFairness() EnergyConsumption = ComputeEnergyConsumption() NormalizedThroughput = ComputeNormalizedThroughput() NetworkLifetime = ComputeNetworkLifetime() 7. Output Results: Output OptimalMobileSinkLocation Output PerformanceMetrics (MinimumDistance, NormalizedFairness, EnergyConsumption, NormalizedThroughput, NetworkLifetime) End Algorithm |
3.3. Optimal Placement of the Mobile Sink
Once CH is chosen by DEC, the finest position for the mobile sink is selected by the WSN. The location of the mobile sink is selected such that less energy is consumed and the life of the network is lengthened[23,24]. To fulfill the above requirement, adjacency-based cell score method is employed using distance, fairness, and predicted energy.
Let, count of cells in the network be , then the CHs in the WSN are denoted by
The position of the mobile sink relies on adjacency-based cell score, which is signified by
Here, is the distance, and are expressed as,
Here,denotes the Euclidian distance. The denotes the spot of cell from BS, and denotes location of cell from BS.
Fairness is given by
where,denotes the highest number of nodes that uniformly allocate the resources, number of cells is indicated as . Moreover, the energy predicted is mentioned as , which is predicted by utilizing Deep Q Net [25,26].
3.3.1. Deep Q Net Architecture
The Deep Q-Network (DQN) architecture represents a groundbreaking advancement in reinforcement learning, seamlessly integrating Q-learning with deep neural networks to tackle complex decision-making problems. Its significance is underscored by its ability to handle high-dimensional state spaces, such as visual inputs, through the use of convolutional neural networks (CNNs) which automatically extract meaningful features from raw data, eliminating the need for manual feature engineering. DQN also introduces experience replay, a technique that stores and samples past experiences randomly to break the correlation between consecutive experiences, thereby stabilizing and enhancing the learning process. Additionally, the architecture employs a target network, which provides a stable target for Q-value updates by using a periodically updated copy of the main network, thus addressing the issue of value function overestimation and contributing to more reliable training. This combination of features not only improves convergence and stability but also demonstrates remarkable versatility and scalability across various domains, including video games, robotics, and autonomous driving. As a result, DQN has significantly expanded the potential applications of reinforcement learning by enabling effective policy learning in complex and high-dimensional environments.
Deep Q Net [27] is a popular deep reinforcement learning method, and the input is considered as . The Deep Q Net employs a Convolutional Neural Network (CNN) for approximating the Q value. The Reinforcement learning could be unstable in few instances. To conquer this instability, Deep Q Net uses the action replay method. Furthermore, expression of the agent’s experience for performing experience replay is formulated as,
where,is termed as replay memory, and the loss function equation is given below,
Here, the discount factor is denoted as , signifies network parameter which is employed for evaluating the target at iteration, and reward is specified as , mentions the network constraint at iteration. To improve the reliability of convergence, DQN acquires a neural fixed Q approach [28]. Moreover, at target is estimated asin a particular period, and the output of Deep Q Net is indicated as, and architecture of Deep Q Net is represented in Figure 2.
Deep Q Net successfully predicted the energy of sink node based on which the adjacency-based cell score is computed. This, optimal location of mobile sink is identified considering the adjacency-based cell score.
4. Result and Discussion
The outputs of newly established Deep Q Net are illustrated for predicting the energy during mobile sink placement.
4.1. Experimental Setup
The proposed Deep Q Net-based mobile sink placement is implemented in the Matlab tool using simulation is represented in Table 2.
4.2. Evaluation Measures
The performance improvement of Deep Q Net-based mobile sink placement is estimated by utilizing evaluation measures, namely energy, normalized throughput, normalized fairness, network lifetime, and distance.
4.2.1. Normalized Throughput
The overall data packets transmitted to the required target through the nodes at a specified time. Moreover, normalized throughput is articulated as,
where, overall amount of node counts is symbolized as , normalized throughput is specified as , and time taken by the nodes is characterized as
4.2.2. Residual Energy
The residual energy existing in nodes after the dissemination of data packets is termed as residual energy. Here, residual energy is modeled as,
where, represents the consumed energy and residual energy is signified as .
4.2.3. Distance
It is defined as the distance between and , which is expressed by the equation given below.
Here, distance is denoted as .
4.2.4. Network Lifetime
It is evaluated by examining the execution of sensor node, which demonstrates the capability of the method to extend the network lifetime during the transmission of data.
4.2.5. Network Fairness
It is defined as the amount of applications and users having system resources fairly. Moreover, fairness is regularly qualified for resource allocation and sharing in wireless networks.
4.3. Comparative Methods
4.4. Comparative Analysis
The comparative analysis of Deep Q Net-based mobile sink placement in relation to performance measures is estimated by varying numbers of rounds for 100 nodes and 200 nodes.
(i) Analysis based on 100 nodes
Figure 3 depicts the assessment of Deep Q Net-based mobile sink placement by utilizing various measures based on 100 nodes. In Figure 3(a), valuation of Deep Q Net by varying number of rounds is illustrated. When number of rounds is 1000, distance computed by Deep Q Net is 11m and other methods such as DMN, Tuft, ILP and DMEAAL obtained the distance of 23m,19m,26m, and 16m. Figure 3(b) deliberates the analysis of Deep Q Net by varying number of rounds. By considering a number of rounds as 500, residual energy acquired by DMN is 0.600J, Tuft is 0.644J, ILP is 0.712, DMEAAL is 0.738J and Deep Q Net is 0.874J. The assessment of Deep Q Net by changing the number of rounds and it is indicated in Figure 3(c). At 1500 rounds, normalized fairness acquired by DMN, Tuft, ILP, DMEAAL, and proposed Deep Q Net are 68, 71,73,76, and 79. Figure 3(d) shows the graph between network time and number of rounds. At number of rounds 500, network lifetime obtained by other models like DMN, Tuft, ILP, and DMEAAL are 81S,83S,88S, and 86S. Moreover, the newly developed Deep Q Net acquired a network life time of 92S. In Figure 3(e), the assessment between the number of rounds and normalized throughput is demonstrated. For a number of rounds 2000, Deep Q Net acquired the normalized throughput of about 83 whereas, the other techniques, like DMN, Tuft, ILP, and DMEAAL obtained the normalized fairness of 68, 70, 74, and78respectively.
(ii) Analysis based on 200 nodes
The valuation of Deep Q Net-based mobile sink placement by employing various performance measures based on 200 nodes is portrayed in Figure 4. Figure 4(a) shows graph among distance and number of rounds. If the round is 500 the distance obtained by existing methods like DMN, Tuft, ILP and DMEAAL are 17m,14m, 12m, and 11m. Moreover, the newly developed Deep Q Net acquired a distance of 7m. In Figure 4(b), assessment of Deep Q Net by varying number of rounds is illustrated. When number of rounds is 1000, energy figured by Deep Q Net is 0.576J and other methods such as DMN, Tuft, ILP and DMEAAL obtained the residual energy of 0.389J, 0.399J, 0.418J, and 0.467J. In Figure 4(c), the graph between the number of rounds and normalized fairness is demonstrated. For number of rounds 2000, Deep Q Net attained the normalized fairness of about 77 whereas, the other techniques, like DMN, Tuft, ILP, and DMEAAL obtained the normalized fairness of 53, 59, 64, and 67. The assessment of Deep Q Net is determined by altering number of rounds and it is indicated in Figure 4(d). At 1500 rounds, network lifetime acquired by DMN, Tuft, ILP, DMEAAL, and proposed Deep Q Net is 65S, 70S, 69S,73S, and 76S. Figure 4(e) deliberates investigation of Deep Q Net by altering number of rounds. By considering number of round 500, normalized throughput acquired by DMN is 89, Tuft is 90, ILP is 93, DMEAAL is 95 and Deep Q Net is 97.
(ii) Analysis based on 300 nodes
The valuation of Deep Q Net-based mobile sink placement by employing various performance measures based on 300 nodes is delineated in Figure 5. Figure 5(a) displays graph between distance and number of rounds. If the round is 1000 the distance obtained by existing methods like DMN, Tuft, ILP and DMEAAL are 26m, 23m, 21m, and 19m. Moreover, the newly developed Deep Q Net acquired a distance of 14m. In Figure 5(b), assessment of Deep Q Net by varying number of rounds is illustrated. When number of rounds is 1500, energy attained by Deep Q Net is 0.056J and other methods such as DMN, Tuft, ILP and DMEAAL obtained the residual energy of 0.032J, 0.032J, 0.035J, and 0.038J. In Figure 5(c), the graph between the number of rounds and normalized fairness is demonstrated. For a number of rounds 1000, Deep Q Net attained the normalized fairness of about 85 whereas, the other techniques, like DMN, Tuft, ILP, and DMEAAL obtained the normalized fairness of 73, 78, 84, and 82. The assessment of Deep Q Net is determined by varying number of rounds and it is indicated in Figure 5(d). At 500 rounds, network lifetime acquired by DMN, Tuft, ILP, DMEAAL, and Deep Q Net is 81S, 83S, 88S,86S, and 92S. Figure 5(e) deliberates analysis of Deep Q Net by changing number of rounds. By considering number of rounds 1500, normalized throughput acquired by DMN is 76, Tuft is 78, ILP is 80, DMEAAL is 81 and Deep Q Net is 92.
(ii) Analysis based on 400 nodes
The valuation of Deep Q Net-based mobile sink placement by employing various performance measures based on 400 nodes is delineated in Figure 6. Figure 6(a) displays graph between distance and number of rounds. If the round is 1000 the distance obtained by existing methods like DMN, Tuft, ILP and DMEAAL are 38m, 32m, 31m, and 27m. Moreover, the newly developed Deep Q Net acquired a distance of 21m. In Figure 6(b), assessment of Deep Q Net by varying number of rounds is illustrated. When number of rounds is 1000, energy attained by Deep Q Net is 0.746J and other methods such as DMN, Tuft, ILP and DMEAAL obtained the residual energy of 0.283J, 0.322J, 0.322J, and 0.336J. In Figure 6(c), the graph between the number of rounds and normalized fairness is demonstrated. For a number of rounds 1000, Deep Q Net attained the normalized fairness of about 95 whereas, the other techniques, like DMN, Tuft, ILP, and DMEAAL obtained the normalized fairness of 82, 87, 94, and 92. The assessment of Deep Q Net is determined by varying number of rounds and it is indicated in Figure 6(d). At 1000 rounds, network lifetime acquired by DMN, Tuft, ILP, DMEAAL, and Deep Q Net is 69S, 74S, 77S, 86S, and 89S. Figure 6(e) deliberates analysis of Deep Q Net by changing number of rounds. By considering number of rounds 1500, normalized throughput acquired by DMN is 91, Tuft is 93, ILP is 94, DMEAAL is 95 and Deep Q Net is 96.
4.5. Comparative Discussion
The comparative analysis of the proposed and the existing system is depicted in Table 2. The analysis is carried out by considering the 100,200, 300, and 400 nodes, in which the best performance occurs at 250 rounds .The comparative discussion of the Deep Q Net-based mobile sink placement is deliberated in Table 2. For 300 node, distance of Deep Q Net acquired 26m and other methods like DMN, Tuft, ILP and DMEAAL obtained the distance of 41m, 39m, 34m, and 30m. Moreover, the residual energy attained by Deep Q Net is 0.006J, normalized lifetime is 67S, normalized fairness is 92 and normalized throughput is 91. Moreover, the residual energy acquired by DMN is 0.021J, Tuft is 0.002J, ILP is 0.002J, and DMEAAL is 0.004J. The normalized fairness attained by these existing approaches, like DMN, Tuft, ILP, and DMEAAL is57, 59, 62, and 63. The lifetime of network obtained by the above-mentioned techniques are 81S, 83S, 88S, and 86S. Lastly, normalized throughput attained by DMN is 66, Tuft is 71, ILP is 73, and DMEAAL is 76. Furthermore, the Deep Q Net attained good generalization capability in predicting the energy, which also enhanced the overall performance during mobile sink placement leading to superior results.

Table 2.
Comparative discussion.
| Nodes | Metrics | DMN | Tuft | ILP | DMEAAL | Proposed Deep Q Net |
|---|---|---|---|---|---|---|
| 100 |
Distance (m) |
42 | 37 | 32 | 28 | 24 |
| Residual energy (J) | 0.003 | 0.003 | 0.003 | 0.003 | 0.004 | |
| Normalized fairness | 58 | 61 | 63 | 64 | 68 | |
| Network lifetime (S) | 53 | 56 | 60 | 54 | 64 | |
| Normalized throughput | 68 | 70 | 74 | 78 | 83 | |
| 200 |
Distance (m) |
46 | 42 | 38 | 32 | 28 |
| Residual energy (J) | 0.004 | 0.004 | 0.004 | 0.005 | 0.005 | |
| Normalized fairness | 53 | 59 | 64 | 67 | 77 | |
| Network lifetime (S) | 51 | 56 | 60 | 64 | 68 | |
| Normalized throughput | 66 | 69 | 72 | 76 | 85 | |
| 300 |
Distance (m) |
44 | 39 | 34 | 30 | 26 |
| Residual energy (J) | 0.021 | 0.002 | 0.002 | 0.004 | 0.006 | |
| Normalized fairness | 57 | 59 | 62 | 63 | 67 | |
| Network lifetime (S) | 81 | 83 | 88 | 86 | 92 | |
| Normalized throughput | 66 | 71 | 73 | 76 | 81 | |
| 400 |
Distance (m) |
38 | 32 | 31 | 27 | 21 |
| Residual energy (J) | 0.283 | 0.322 | 0.336 | 0.656 | 0.746 | |
| Normalized fairness | 82 | 87 | 94 | 92 | 95 | |
| Network lifetime (S) | 69 | 74 | 77 | 88 | 89 | |
| Normalized throughput | 91 | 93 | 94 | 95 | 96 |
In the proposed method, the network is transformed into various cells using Voronoi partition, which determines the optimal partitioning of cells in the WSN environment. Also, the CH selection is carried out using sparse FCM, which is derived with the inclusion of the FCM algorithm with sparse regularization. The optimal placement of the mobile sink is achieved using the adjacency based cell score, which effectively places the mobile sink using the constrained factors, such as energy, Euclidean distance, and Normalized throughput by using this, the lifespan of the network is extended and the energy consumed by the nodes is reduced. Also, this method uses the minimum distance, which leads to reduce energy consumption. Thus, the proposed method offers better results, than the existing methods.
5. Conclusions
WSN comprises huge amount of sensor nodes which acquire an unusual supply of energy. Moreover, to lessen consumption of energy, and to enhance network lifetime, this work introduced a Deep Q Net for predicting the energy, and a adjacency-based cell score is used for identifying the position of mobile sink. For that, firstly, by utilizing Voronoi partition the cell networks are transformed, in which the network is transformed into numerous clusters. After this, the CHs are selected by employing DEC. Consequently, in order to recognize the position of the mobile sink, an adjacency-based cell score is utilized with some factors, namely distance, predicted energy, and fairness. Moreover, the proposed Deep Q Net is utilized for predicting the energy in WSN. Furthermore, Deep Q Net acquired maximum energy, normalized fairness, network lifetime, and normalized throughput of 0.006J, 67, 92S, and 81 and obtained a minimum distance of 26m. Future work aims to improve Deep Q Net to incorporate data with various delay requirements, which can lengthen the network's lifetime and lower the packet loss rate.
6. Future Scope
The future scope of the proposed Deep Q Net model for mobile sink placement in Wireless Sensor Networks (WSNs) includes several potential enhancements and extensions. Future research could focus on improving the scalability of the model for large-scale WSN deployments and adapting it to dynamic environments with varying node mobility and environmental factors. Integrating the model with other optimization algorithms and incorporating security mechanisms could further enhance its efficiency and resilience. Additionally, exploring energy harvesting capabilities and the use of multiple mobile sinks could extend network lifetime and improve overall performance. Real-world testing and implementation would validate the model's effectiveness, while adaptive learning techniques could allow the model to continuously optimize its performance in response to changing network conditions. These advancements could significantly broaden the applicability and robustness of the Deep Q Net model in diverse WSN applications.
References
- Kaur, C.; Hassen, S.M.; Boush, M.S.A.; Anandaram, H. “Energy Prediction for Mobile Sink Placement by Deep Maxout Network in WSN”. J. Adv. Inf. Technol. 2023, vol.14(no.1). [Google Scholar] [CrossRef]
- Poe, W.Y.; Schmitt, J.B. “Self-organized sink placement in large-scale wireless sensor networks”. In proceedings of 2009 IEEE International Symposium on Modeling, Analysis & Simulation of Computer and Telecommunication Systems; IEEE, September 2009; pp. 1–3. [Google Scholar]
- Papadimitriou, I.; Georgiadis, L. “Maximum lifetime routing to mobile sink in wireless sensor networks”. Proc. SoftCOM 2005. [Google Scholar] [CrossRef]
- Poe, W.Y.; Schmitt, J.B. “Sink placement without location information in large-scale wireless sensor networks”. In Proceedings of the 4th Asian Internet Engineering Conference, November 2009; pp. 69–76. [Google Scholar]
- Slama, I.; Jouaber, B.; Zeghlache, D. “Multiple mobile sinks deployment for energy efficiency in large scale wireless sensor networks”. proceedings of e-Business and Telecommunications: International Conference, ICETE 2008, Revised Selected Papers. Porto, Portugal, July 26-29, 2008; Springer Berlin Heidelberg, 2009; pp. 412–427. [Google Scholar]
- Alsalih, W.; Hassanein, H.; Akl, S. “Placement of multiple mobile data collectors in wireless sensor networks”. Ad. Hoc Netw. 2010, vol.8(no.4), 378–390. [Google Scholar] [CrossRef]
- AR, A.; Chakravarthi, R. “Optimal Placement of Mobile Sink in Wireless Sensor Network Using Adjacency-Based Cell Score Factor”. Int. J. Intell. Eng. Syst. 2021, vol.14(no.2). [Google Scholar] [CrossRef]
- Snigdh, I.; Gosain, D.; Gupta, N. “Optimal sink placement in backbone assisted wireless sensor networks”. Egypt. Inform. J. 2016, vol.17(no.2), 217–225. [Google Scholar] [CrossRef]
- Neogi, P.P.G. “IWD-based Mobile Sink Route Determination for WSN under Non-Uniform Data Constraints”. In proceedings of 2019 International Conference on Computer Communication and Informatics (ICCCI); IEEE, January 2019; pp. 1–6. [Google Scholar]
- Busaileh, O.; Hawbani, A.; Wang, X.; Liu, P.; Zhao, L.; Al-Dubai, A. “Tuft: Tree based heuristic data dissemination for mobile sink wireless sensor networks”. IEEE Trans. Mob. Comput. 2020, vol.21(no.4), 1520–1536. [Google Scholar] [CrossRef]
- El-Fouly, F.H.; Altamimi, A.B.; Ramadan, R.A. “Energy and environment-aware path planning in wireless sensor networks with mobile sink”. Sensors 2022, vol.22(no.24), 9789. [Google Scholar] [CrossRef] [PubMed]
- Thomson, C.; Wadhaj, I.; Tan, Z.; Al-Dubai, A. “Towards an energy balancing solution for wireless sensor network with mobile sink node”. Comput. Commun. 2021, vol.170, 50–64. [Google Scholar] [CrossRef]
- Xie, J.; Girshick, R.; Farhadi, A. “Unsupervised deep embedding for clustering analysis”. International conference on machine learning, June 2016; PMLR; pp. 478–487. [Google Scholar]
- Sasaki, H.; Horiuchi, T.; Kato, S. “A study on vision-based mobile robot learning by deep Q-network”. In proceedings of 2017 56th annual conference of the society of instrument and control engineers of Japan (SICE); IEEE, September 2017; pp. 799–804. [Google Scholar]
- Mourad, H.M.; Kaur, D.; Aarif, M. “Challenges Faced by Big Data and Its Orientation in the Field of Business Marketing”. Int. J. Mech. Prod. Eng. Res. Dev. (IJMPERD) 2020, vol.10(no.3), 8091–8102. [Google Scholar]
- Vijayashree, R.; Suresh Ghana Dhas, C. ‘Energy efficient data collection with multiple mobile sink using artificial bee colony algorithm in large-scale WSN’. Automatika 2019, 60(5), 555–563. [Google Scholar] [CrossRef]
- Zhang, L.; Wan, C. ‘Dynamic Path Planning Design for Mobile Sink with Burst Traffic in a Region of WSN’. Wireless Communications and Mobile Computing, 2019. [Google Scholar]
- Chauhan, V.; Soni, S. ‘Mobile sink-based energy efficient cluster head selection strategy for wireless sensor networks’. J. Ambient Intell. Humaniz. Comput. 2019, 1–14. [Google Scholar]
- Kaswan, A.; Singh, V.; Jana, P. K. ‘A multi-objective and PSO based energy efficient path design for mobile sink in wireless sensor networks’. Pervasive Mob. Comput. 2018, 46, 122–136. [Google Scholar] [CrossRef]
- Kumar, D. P.; Tarachand, A.; Chandra, A.; Rao, S. ‘ACO-based mobile sink path determination for wireless sensor networks under non-uniform data constraints’. Appl. Soft Comput. 2018, 69, 528–540. [Google Scholar] [CrossRef]
- Sapre, S.; Mini, S. ‘A differential moth flame optimization algorithm for mobile sink trajectory’. Peer-To-Peer Netw. Appl. 2020, 49. [Google Scholar]
- Elie, T.; Aline, Z.; Tonye, E. ‘A Reliable and Efficient Path Discovery Method for Mobile Sink based Wireless Sensor Networks’. Int. J. Comput. Appl. 2020, 176(25), 17–22. [Google Scholar] [CrossRef]
- Karpurasundharapondian, P.; Selvi, M. A comprehensive survey on optimization techniques for efficient cluster based routing in WSN. Peer-To-Peer Netw. Appl. 2024, 1–14. [Google Scholar]
- Chen, K.; Lang, J.; Li, J.; Chen, D.; Wang, X.; Zhou, J.; Liu, X.; Song, Y.; Dong, M. Integration of Image and Sensor Data for Improved Disease Detection in Peach Trees Using Deep Learning Techniques. Agriculture 2024, 14(6), 797. [Google Scholar] [CrossRef]
- Serrano, S.; Scarpa, M. A Petri net model for cognitive radio internet of things networks exploiting GSM bands. Future Internet 2023, 15(3), 115. [Google Scholar] [CrossRef]
- He, L.; Li, Q.; Zhang, J.; Deng, X.; Wu, Z.; Wang, Y.; Chan, P.W.; Li, N. Enhanced Tropical Cyclone Precipitation Prediction in the Northwest Pacific Using Deep Learning Models and Ensemble Techniques. Water 2024, 16(5), 671. [Google Scholar] [CrossRef]
- Guo, Y.; Fei, R.; Li, J.; Wan, Y.; Yang, C.; Zhao, Z.; Khan, M.H.; Li, M. CBHQD: A channel state information-based passive line-of-sight human queue detection. Digit. Signal Process. 2024, 154, 104687. [Google Scholar] [CrossRef]
- Aziz, M.A.; Rahman, M.H.; Sejan, M.A.S.; Tabassum, R.; Hwang, D.D.; Song, H.K. Deep Recurrent Neural Network Based Detector for OFDM with Index Modulation. IEEE Access. 2024. [Google Scholar] [CrossRef]
Figure 1.
Block diagram of Deep Q Net-based energy prediction model for mobile sink placement in WSN .
Figure 1.
Block diagram of Deep Q Net-based energy prediction model for mobile sink placement in WSN .
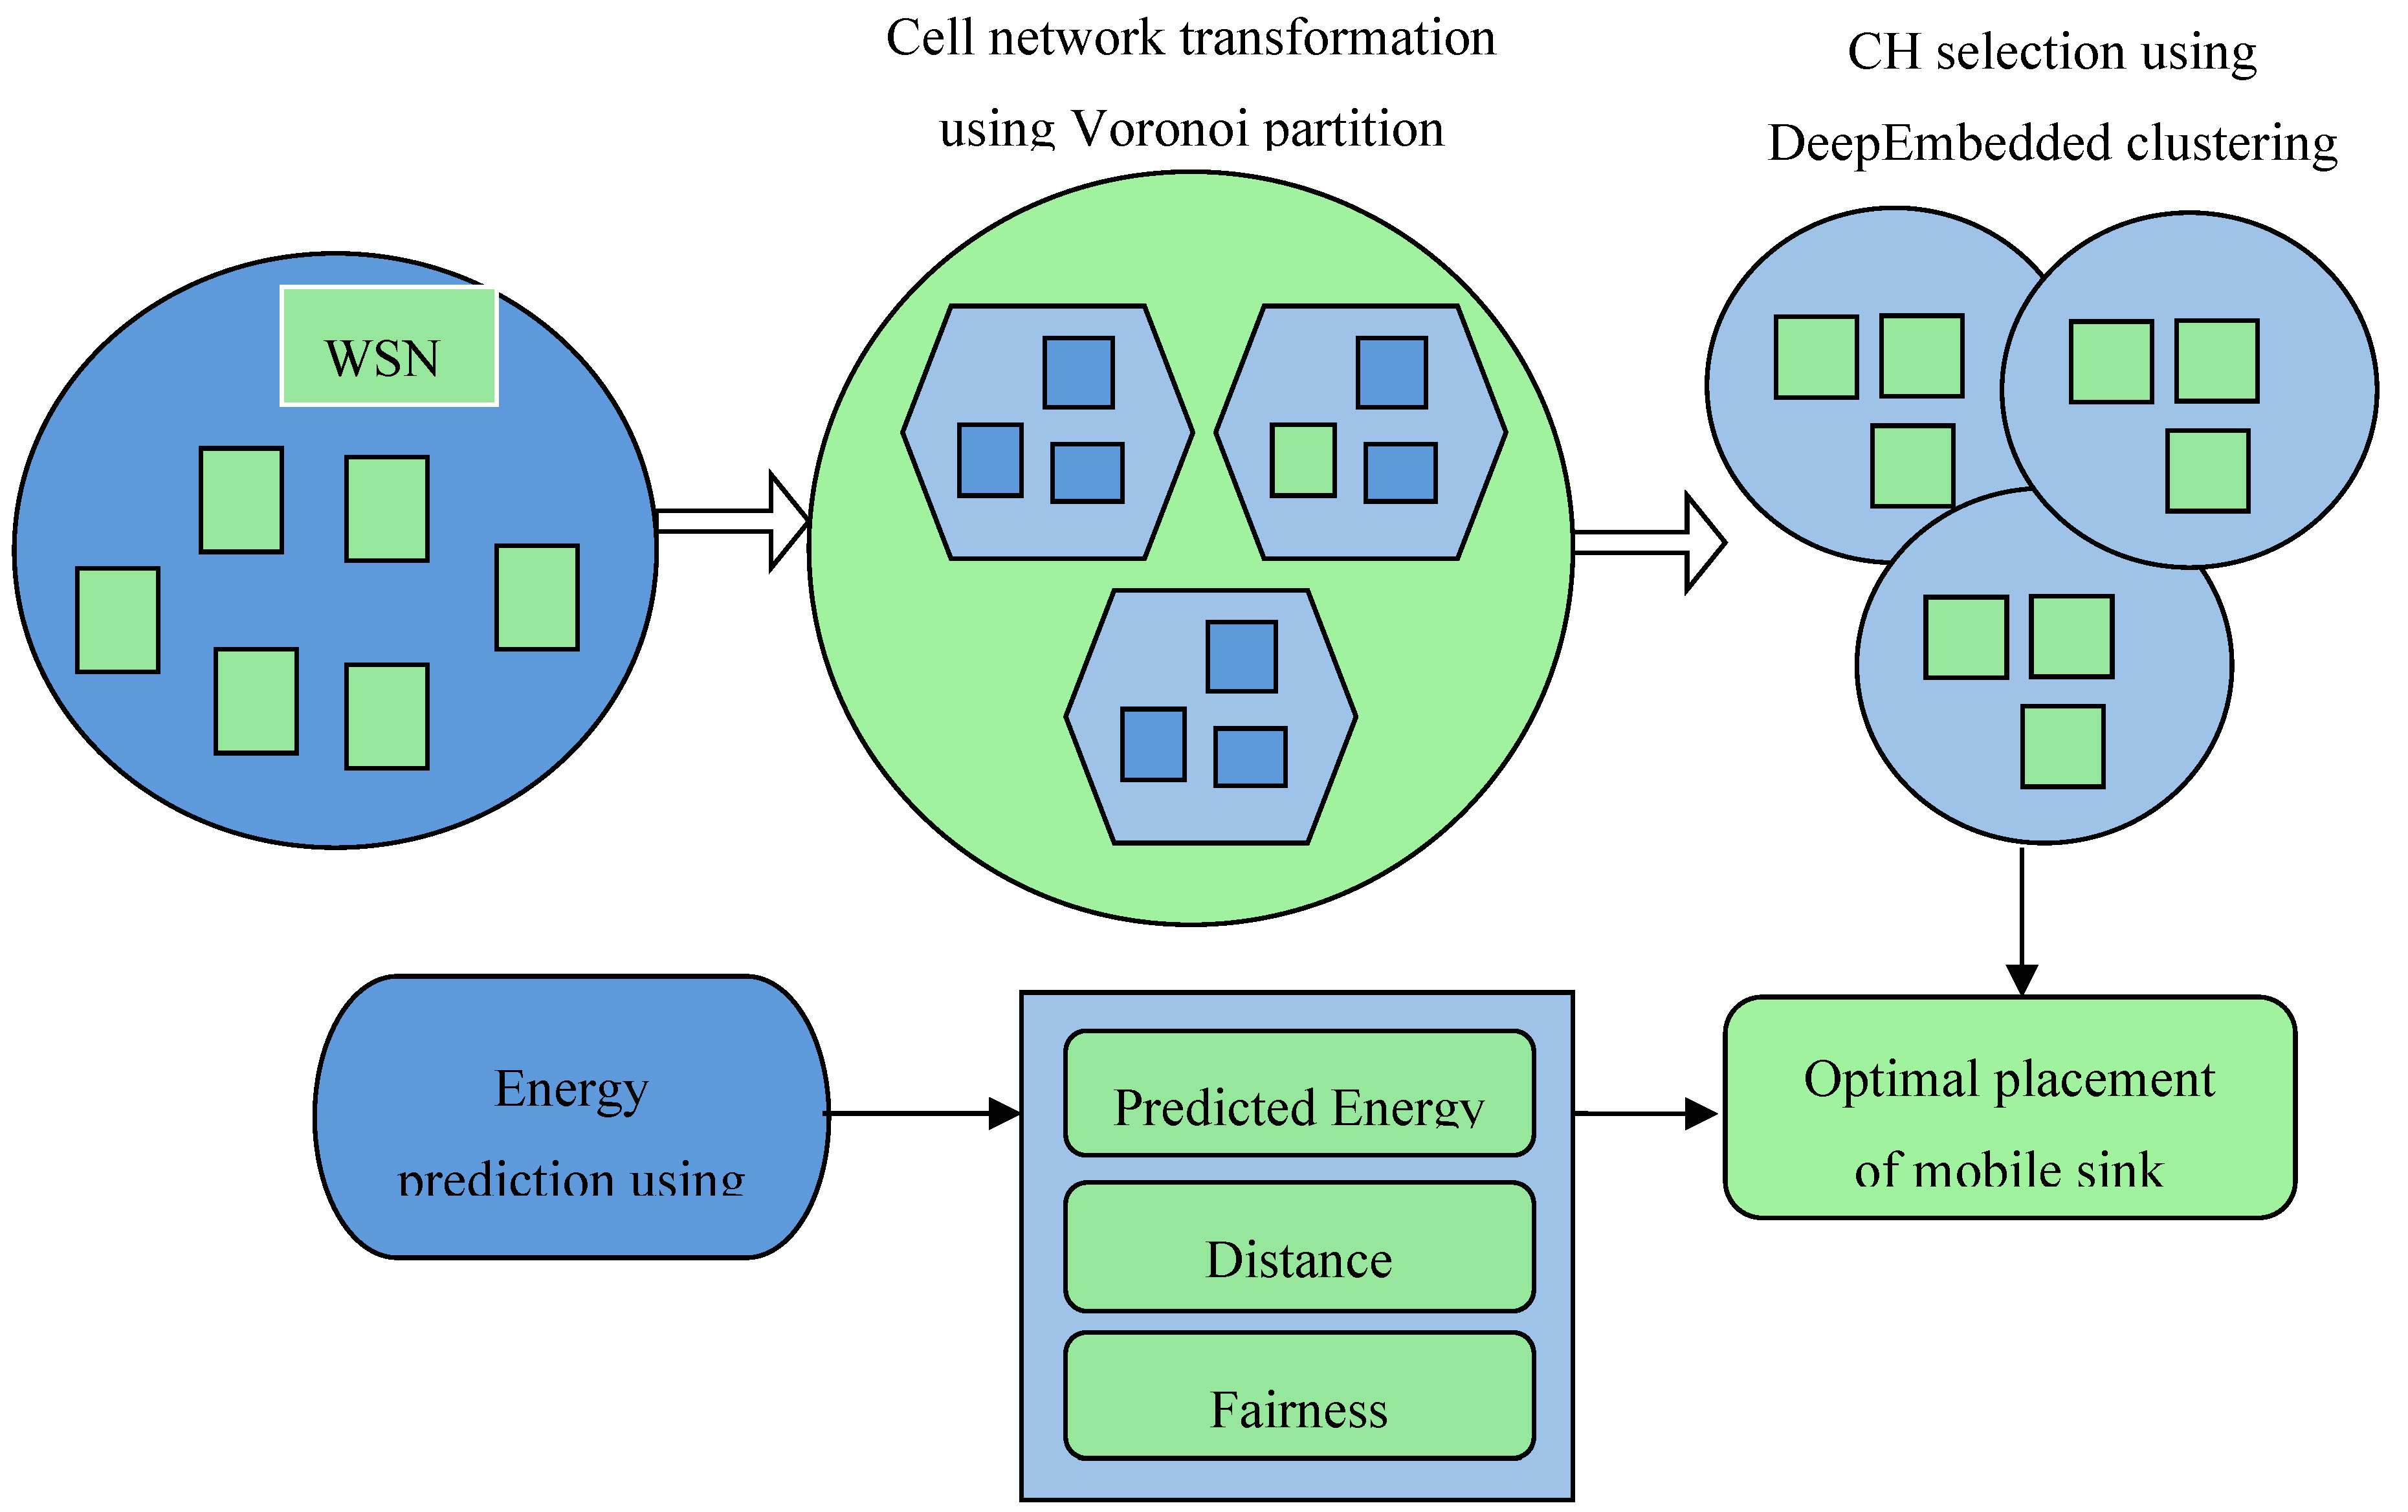
Figure 2.
Architecture of Deep Q Net.
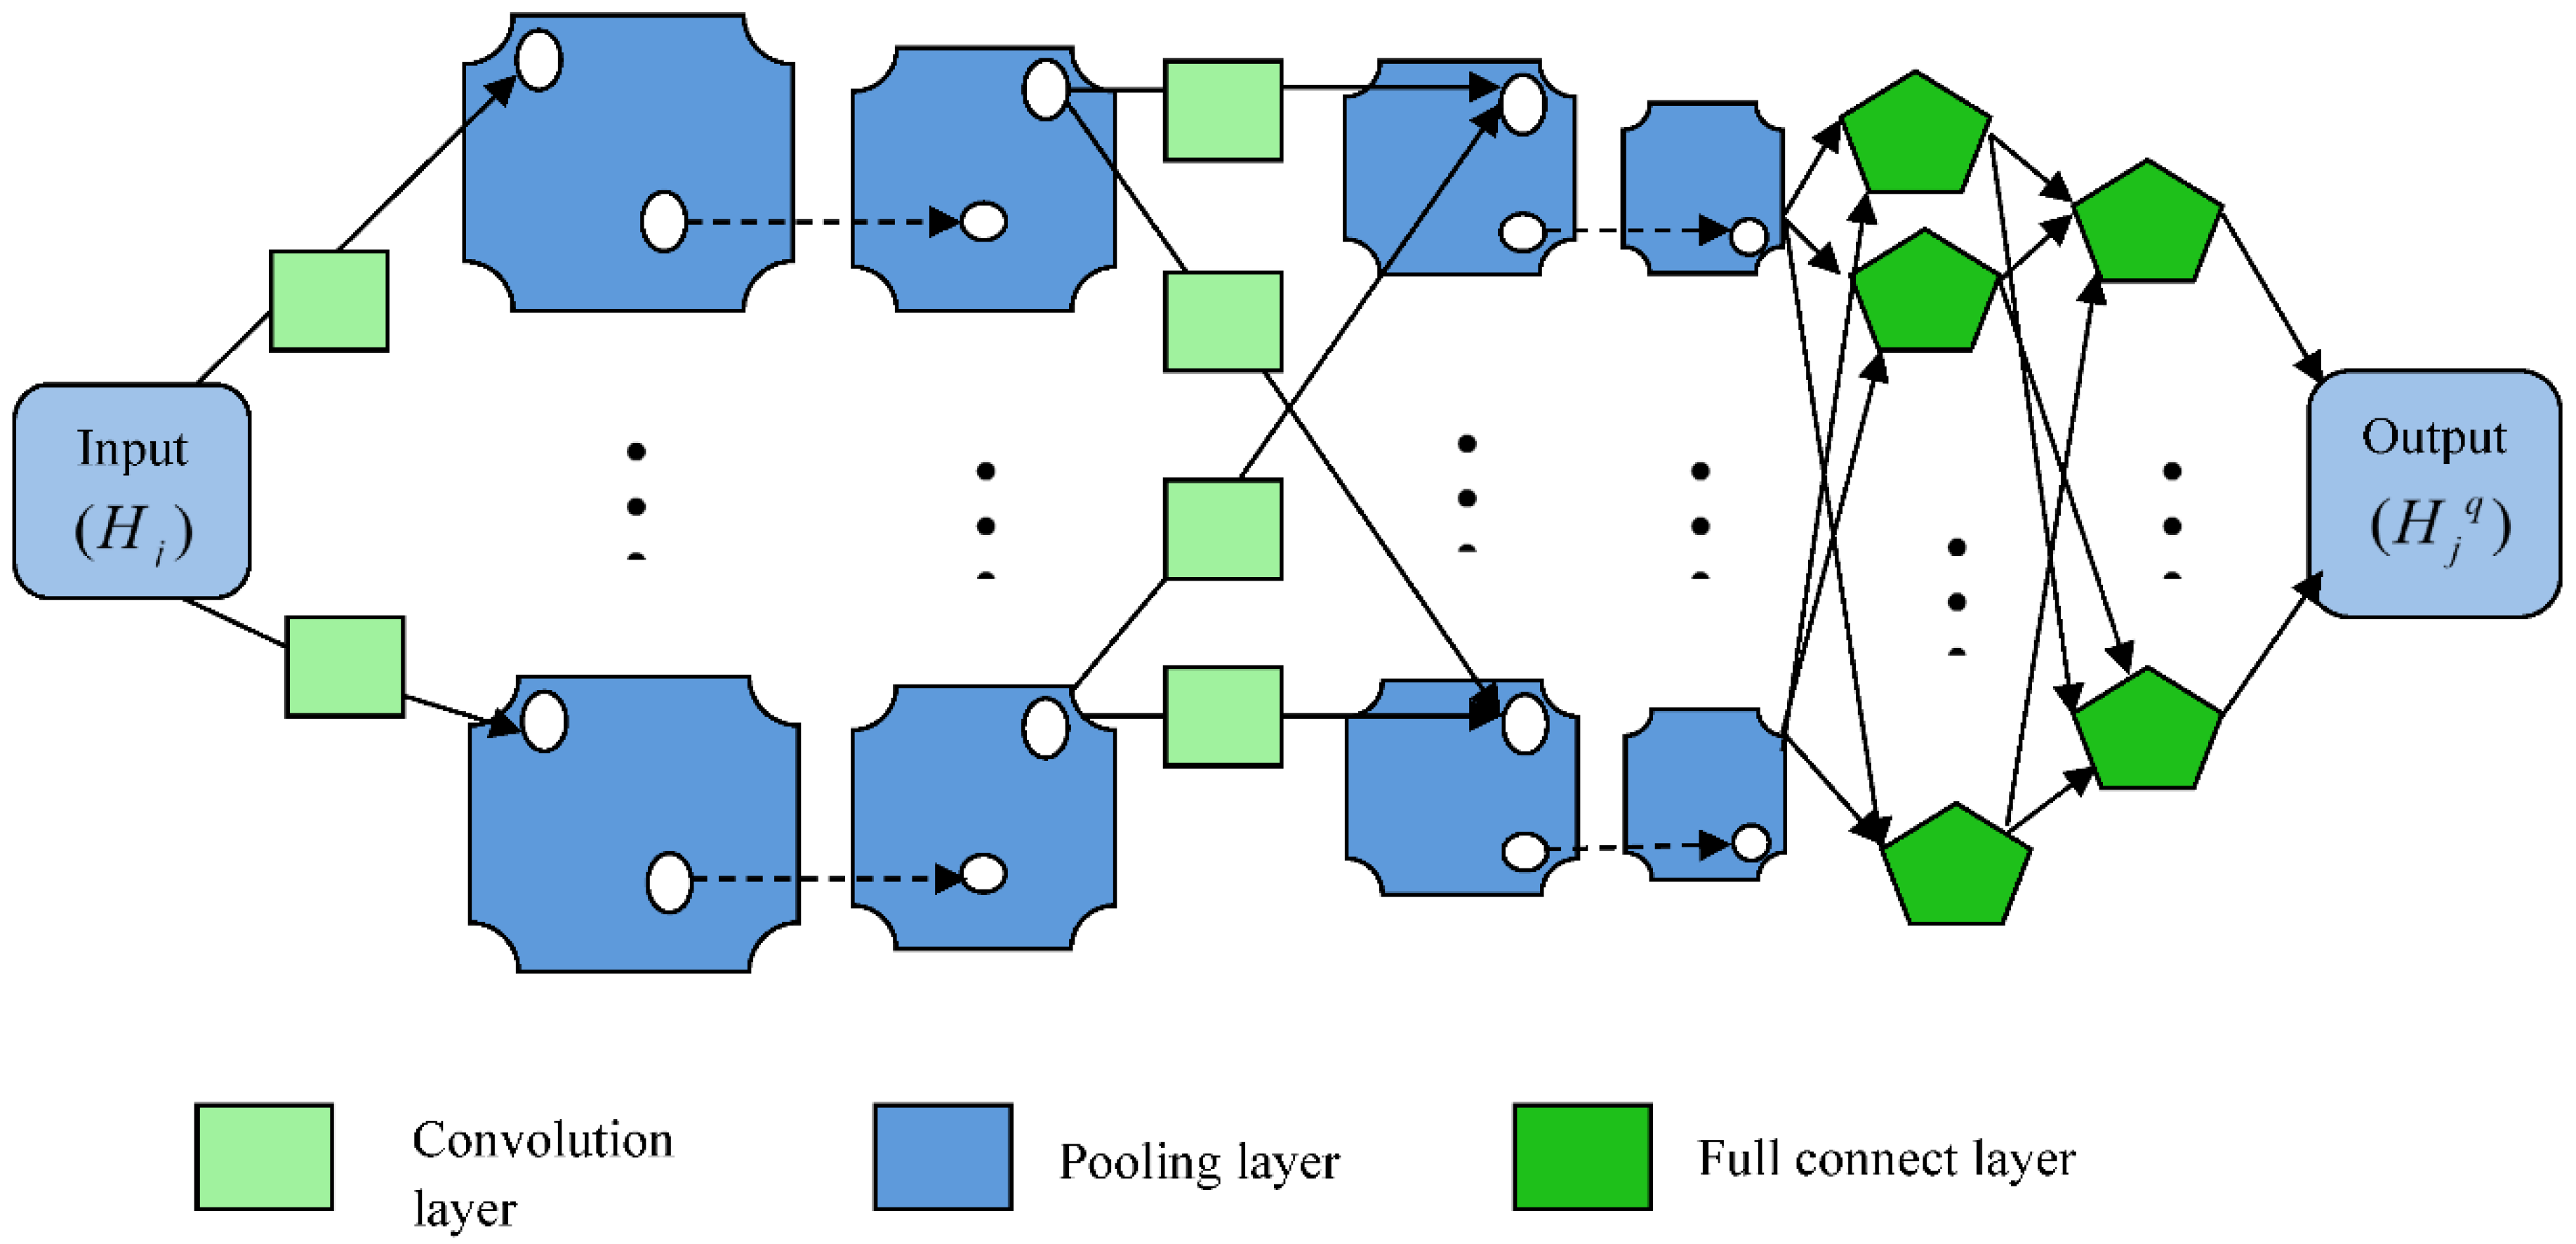
Figure 3.
Valuation regrading 100 nodes for (a) Distance, (b) Residual energy, (c) Normalized fairness, (d) Network lifetime, and (e) Normalized throughput.
Figure 3.
Valuation regrading 100 nodes for (a) Distance, (b) Residual energy, (c) Normalized fairness, (d) Network lifetime, and (e) Normalized throughput.

Figure 4.
Valuation concerning 200 nodes for (a) Distance, (b) Residual energy, (c) Normalized fairness, (d) Network lifetime, and (e) Normalized throughput.
Figure 4.
Valuation concerning 200 nodes for (a) Distance, (b) Residual energy, (c) Normalized fairness, (d) Network lifetime, and (e) Normalized throughput.
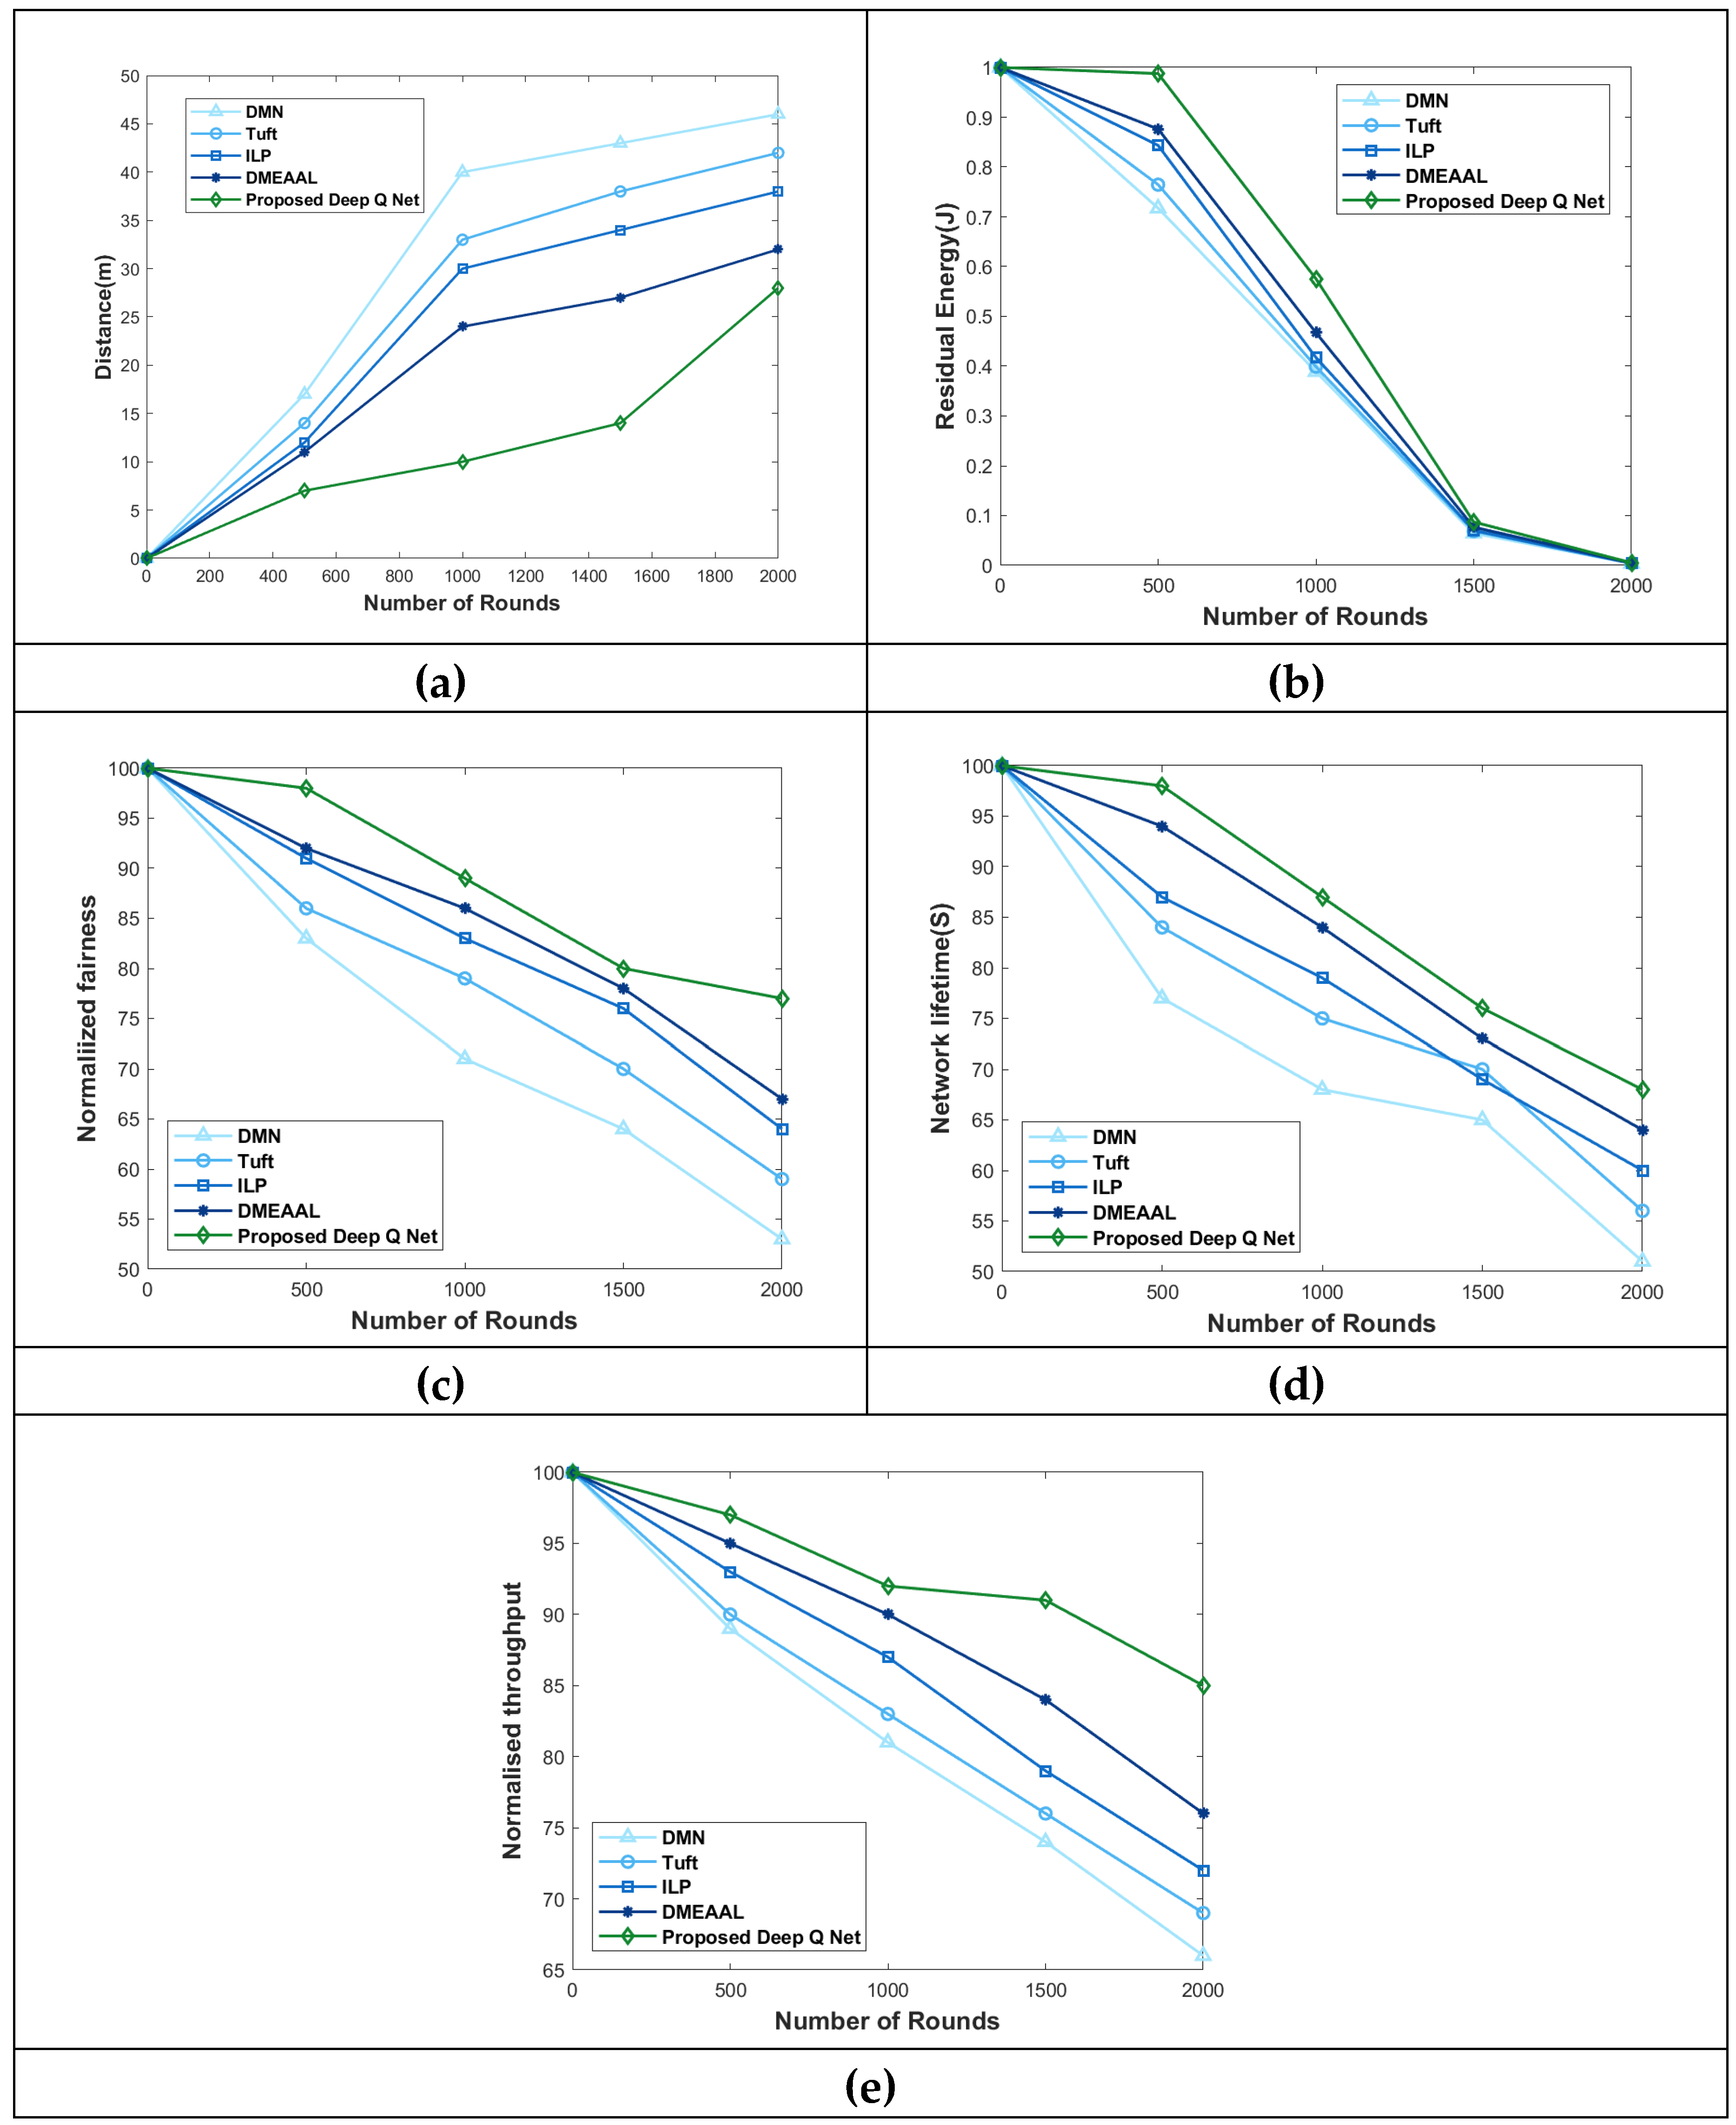
Figure 5.
Valuation regrading 300 nodes for (a) Distance, (b) Residual energy, (c) Normalized fairness, (d) Network lifetime, and (e) Normalized throughput.
Figure 5.
Valuation regrading 300 nodes for (a) Distance, (b) Residual energy, (c) Normalized fairness, (d) Network lifetime, and (e) Normalized throughput.
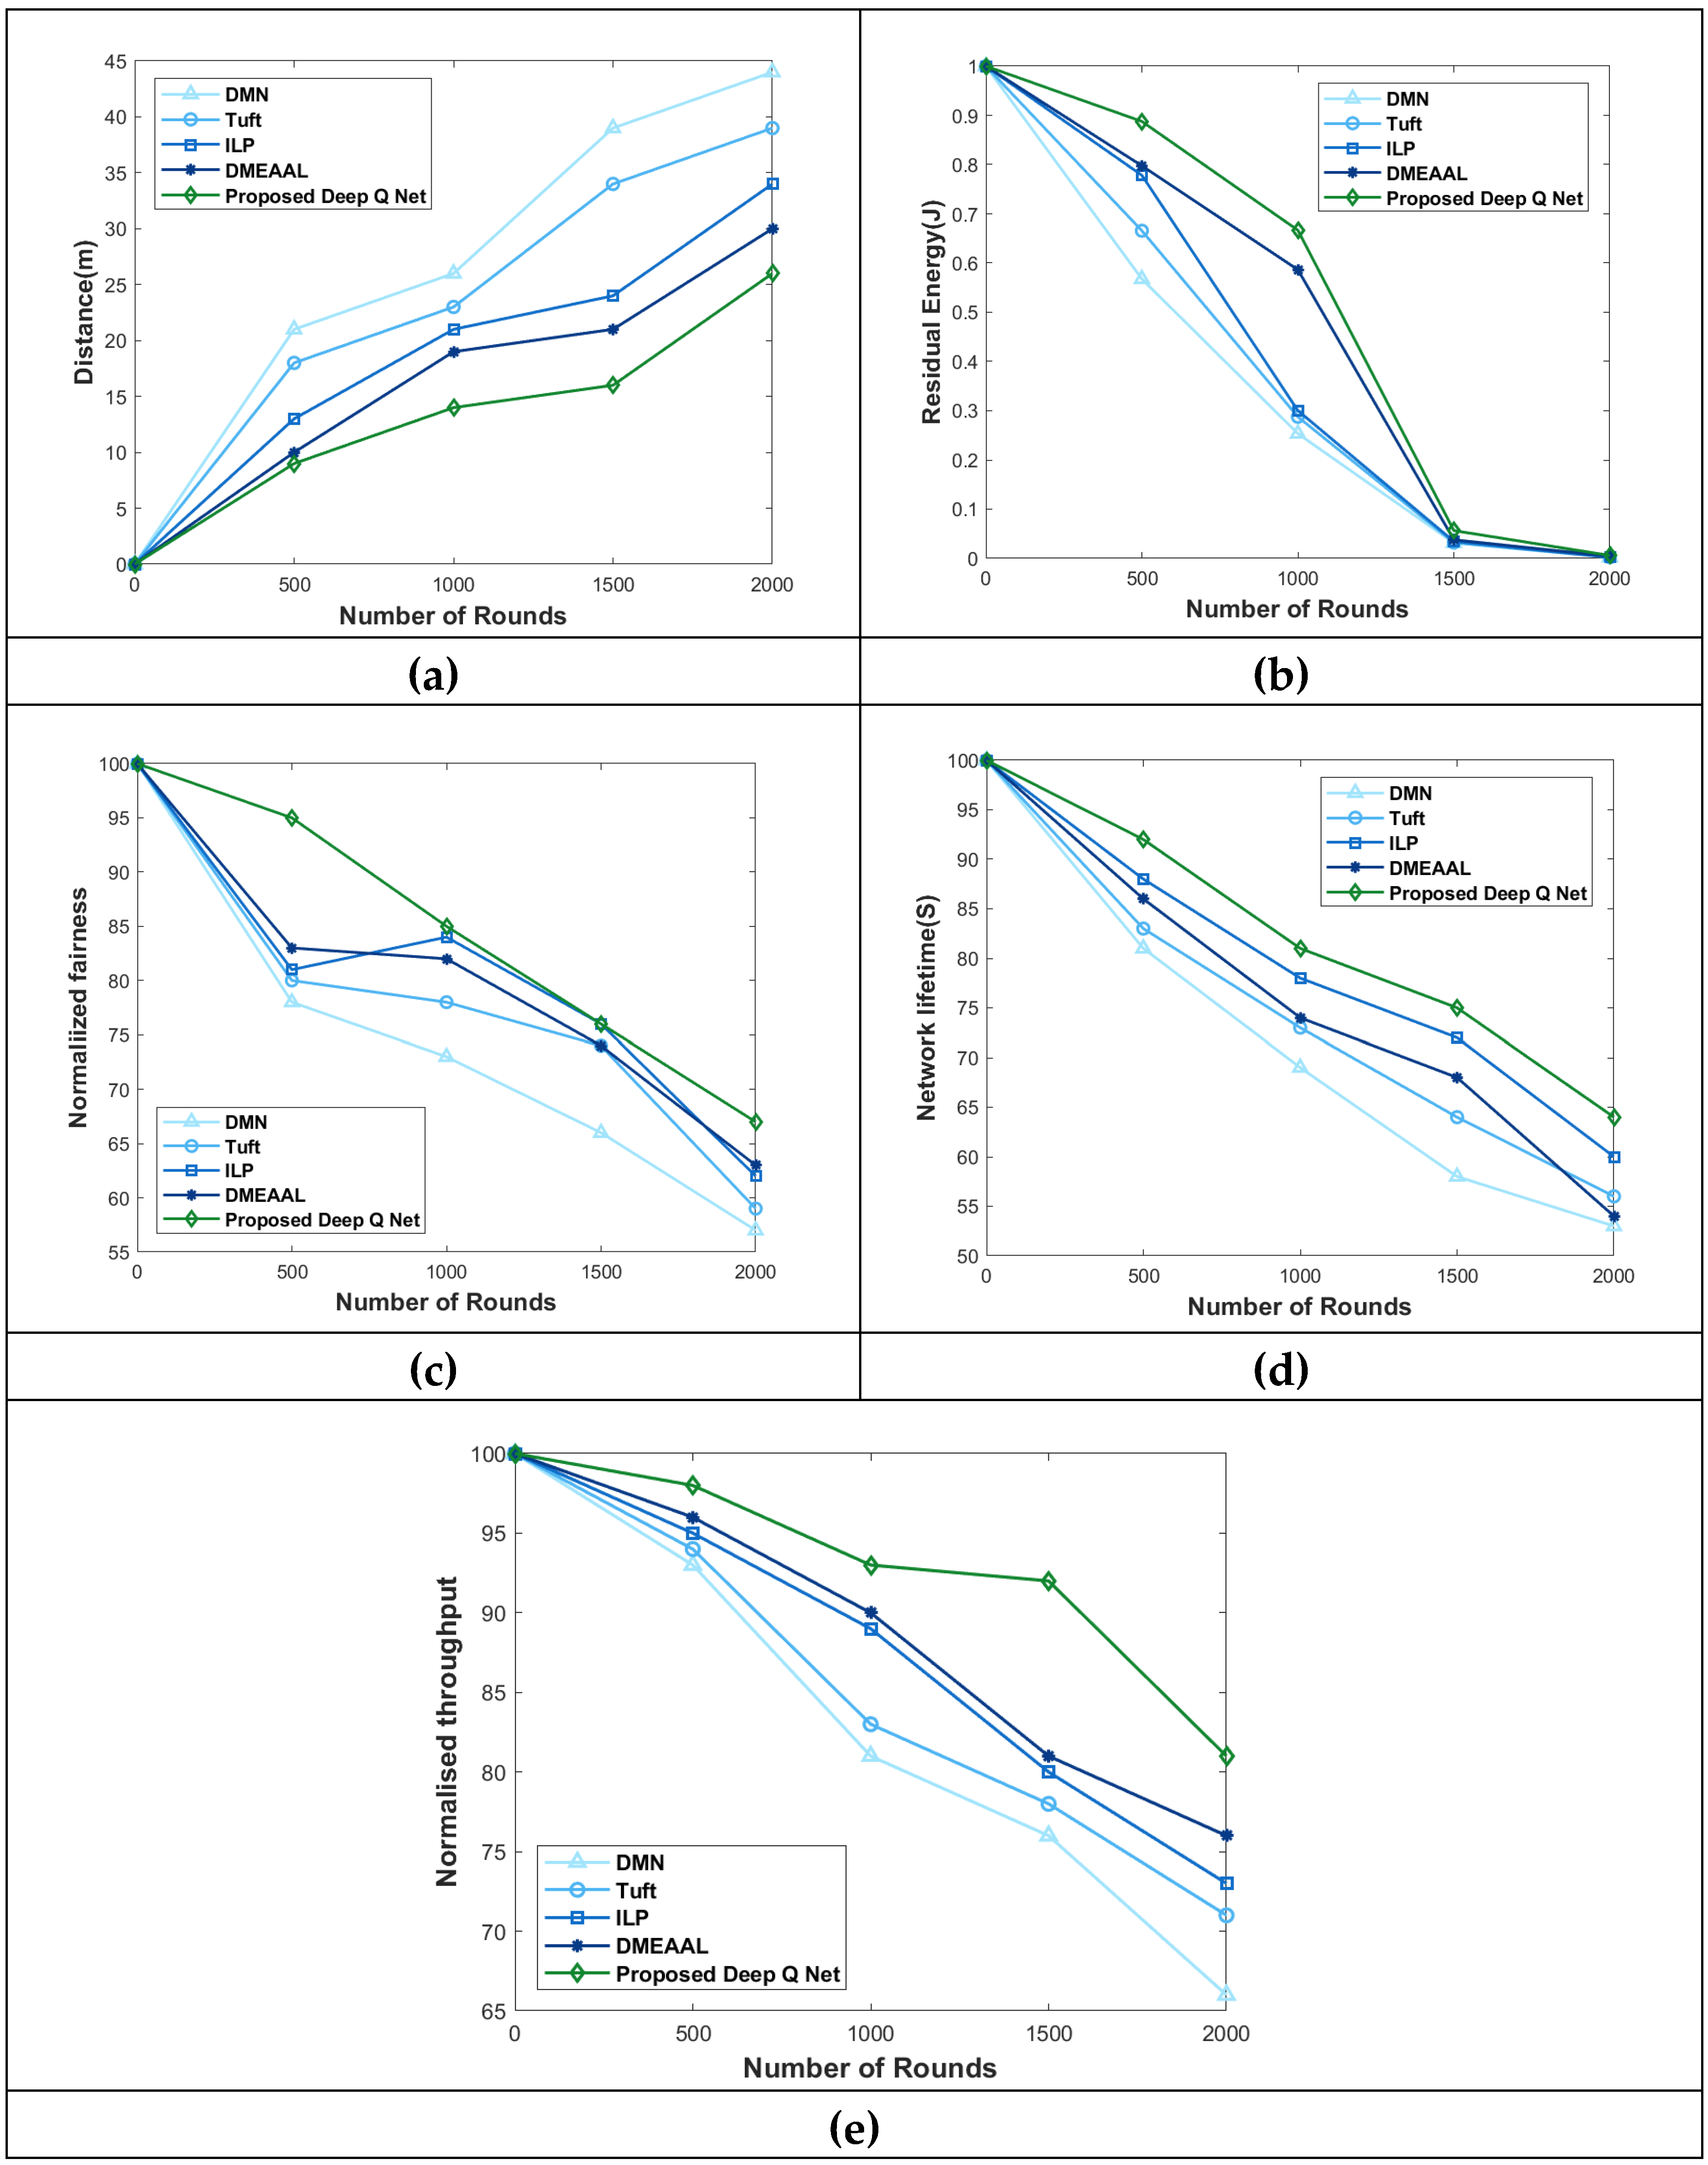
Figure 6.
Valuation regrading 400 nodes for (a) Distance, (b) Residual energy, (c) Normalized fairness, (d) Network lifetime, and (e) Normalized throughput.
Figure 6.
Valuation regrading 400 nodes for (a) Distance, (b) Residual energy, (c) Normalized fairness, (d) Network lifetime, and (e) Normalized throughput.

Table 1.
List of abbreviations.
| WSN | Wireless Sensor Networks |
| CH | Cluster Head |
| DEC | Deep Embedded Clustering |
| DL | Deep Learning |
| DMN | Deep Maxout Network |
| ILP | Integer Linear Programming |
| BS | Base Station |
| DMEAAL | Dynamic Mobility and Energy Aware Algorithm |
| KL | Kullback–Leibler |
Table 2.
Simulation Setup.
| Parameter | Values |
| Number of nodes | 100, 200,300, 400 |
| Number of simulation rounds | 2000 |
| Communication radius | 50 m |
| Node initial energy | 40 J |
| Transmit energy | 0.6 J |
| Receiving Energy | 0.03 J |
| Network Topology | Mesh |
| Area | 250x250 m |
Disclaimer/Publisher’s Note: The statements, opinions and data contained in all publications are solely those of the individual author(s) and contributor(s) and not of MDPI and/or the editor(s). MDPI and/or the editor(s) disclaim responsibility for any injury to people or property resulting from any ideas, methods, instructions or products referred to in the content. |
© 2026 by the authors. Licensee MDPI, Basel, Switzerland. This article is an open access article distributed under the terms and conditions of the Creative Commons Attribution (CC BY) license (http://creativecommons.org/licenses/by/4.0/).
Copyright: This open access article is published under a Creative Commons CC BY 4.0 license, which permit the free download, distribution, and reuse, provided that the author and preprint are cited in any reuse.