

Submitted:
16 August 2026
Posted:
18 August 2026
You are already at the latest version
Abstract
Agribusiness groups need to connect fast-moving markets, long production cycles, operating indicators, and financial results. In practice, these data often sit in different systems and use different periods, units, and organizational definitions. This article develops a finance-led digital intelligence framework from the experience of building a platform for a multi-unit Chinese agribusiness organization. The analysis identifies breaks between data, calculations, screens, review, and day-to-day operation. It then compares three record structures with four fixed examples and five clear design criteria. The resulting framework has five connected elements: a clear management question, a common data language, interpretable analysis, managerial review, and continuous operation. At its center is a \emph{governed analytical value}. Put simply, the system records a calculated value, each time that value is released, and each review of that release as separate but linked records. This keeps the meaning, accounting basis, method, access rights, release status, and review history traceable. A legacy financial screen borrowed only the indicator-grouping and risk-level ideas of Wei and Wang (2024). It used a separate fixed-rule screen and did not reproduce that study's factor-analysis and logistic-regression model. The article contributes a practical design framework and three propositions that later studies can test.
Keywords:
agribusiness
; digital intelligence
; finance transformation
; management accounting
; decision support
; financial risk early warning
; practice-informed design
; data governance
1. Introduction
Agribusiness finance deals with results whose causes often appear long before they reach the ledger. Commodity prices may move within days, while procurement, biological growth, production, sales, and collection follow different cycles. Feed, pig farming, animal health, and seed businesses also have different cost structures and operating rhythms. A decline in quarterly profit may therefore begin with an earlier change in raw-material prices, herd structure, survival rate, feed conversion ratio, capacity use, inventory, customer mix, or payment behavior. Financial statements show the accumulated outcome, but they do not automatically explain how the change traveled through the business.
Digital-agriculture research covers sensors, farm-management systems, machine learning, and data-based decision support [1,2,3,4,5,6]. It also shows why technology alone is not enough. Systems must exchange data, ownership and responsibility must be clear, and people must know how to use the information [7,8,9]. Digital agriculture therefore involves governance and accountable decisions as well as automation and sustainable production [10]. China’s digital-economy plan and national smart-agriculture action plan make similar points [11,12]. They emphasize data resources, integration with established industries, data governance, and decision support. These needs are especially visible in a group company, where market data, operating records, and consolidated financial data often come from different systems and follow different definitions.
Research on enterprise transformation reaches the same broad conclusion. Digital transformation changes strategy, processes, capabilities, and the way an organization creates value. It is more than installing an application [13,14,15]. Digital innovation can also reshape the roles of products, processes, and participants [16]. Likewise, analytics creates value through organizational capabilities, not simply through more data or more software [17,18]. Management-accounting research shows that business intelligence becomes useful when people use information to define problems, reach a shared understanding, and make decisions [19,20,21]. Finance digitalization therefore brings together automation, analysis, controller effectiveness, and the business-partner role [22,23,24]. It also changes who holds knowledge and decision authority [25]. Faster and more visible accounting does not automatically produce better judgment [26].
In this article, digital intelligence does not simply mean using artificial intelligence. It means connecting well-governed data with methods that people can understand. The aim is to explain change, direct attention, and support action while keeping the evidence, decision authority, and review status visible. Under this definition, informatization creates reliable records, digitalization connects and standardizes them, and digital intelligence uses those connections to support traceable management judgment. Data governance is therefore part of the analysis, not a separate administrative task [27].
Existing research says less about one practical problem: how can a finance department connect external market signals, internal operations, financial results, and management review in the same working environment? Different systems usually hold different parts of this chain. Enterprise systems store transactions, production systems record operations, market-data services provide external reference points, and business-intelligence tools provide charts and calculations. This article focuses on the links between those parts. A result cannot be reviewed properly if its entity, organization, period, metric, unit, source, or version becomes unclear along the way. Table 1 shows how this narrower problem relates to established research.
This article asks two design questions. The first concerns the links among different kinds of information. RQ1: What must be connected when a finance-led agribusiness platform brings together market, operating, and financial information without forcing them into one model? The second concerns the record that remains after a result is released. RQ2: What information must stay linked to a released result so that different departments can review it responsibly? This information includes its meaning, accounting basis, method, access rights, release status, and review history. Productization is discussed separately as a future direction.
The contribution is a design and governance framework, not a new algorithm. The framework has five elements and introduces the idea of a governed analytical value. In simple terms, a calculated value, each release of that value, and each review of the release are stored as separate but linked records. This makes it possible to follow a result from an industry signal to financial interpretation, authorization, and review. The article also explains exactly how a published financial-risk model influenced one warning module without being reproduced. The framework is intended for testing and refinement in other settings.
2. Research Design and Methods
2.1. Research Approach
This is a conceptual design study based on implementation experience and structured reflection by the author. Case research helps explain choices that depend on their setting [37]. Design science helps separate the management problem, the proposed design, its implementation, and its evaluation [35,36]. These ideas guide the study, but the article does not present a replicated case study or a complete design-science cycle. The framework is checked against five questions. Are the main records clearly identified? Can the structure show one-to-many relationships? Can states that change separately remain separate? Does a correction preserve the earlier record? Is responsibility for review clear? These questions are used to assess the logic, scope, boundaries, and testability of the framework.
The analysis covers the first finance-oriented version of the platform and its later maintenance. It examines management questions, data definitions, calculations, interfaces, warning rules, review paths, operating steps, and the boundary between organization-specific functions and reusable product features. The purpose is to understand how these parts depend on one another. The study does not count how often a feature or problem appeared.
2.2. Research Setting and Analytical Scope
The setting is the first version of a digital intelligence platform for a multi-unit Chinese agribusiness organization. The organization remains anonymous. The setting is useful because the platform had to serve several agribusiness segments, connect external and internal information, and turn finance requirements into data, analysis, and product features.
The analysis follows a result from the original management question through data definition, calculation, display, review, and continued operation. It uses differences among expected behavior, calculation logic, screen state, operating steps, and later changes to identify design problems. These examples explain the framework; they are not used to estimate frequency or causal effects. All numerical examples are synthetic. Table 2 states what each part of the analysis can and cannot support.
The setting is used to explain design relationships and practical boundaries. Questions that require audited results, a validation dataset, or before-and-after measures are left for later studies.
2.3. Framework Construction and Analytical Procedure
The analysis followed four steps. First, six starting areas were drawn from the full analytical chain and related literature: the management question, data meaning, analytical method, user interaction and review, operating lifecycle, and product boundary. Second, the analysis looked for breaks between adjacent steps. An input needs a definition; a definition needs a calculation; a calculation needs a displayed result; and a released result needs a review and operating status. Third, each statement was placed in one of three groups: an arrangement that could be described, a control suggested by a missing link, or a proposition for future study. A visible feature was not treated as proof of use. Likewise, a formula that could be checked was not treated as proof that the method worked. Fourth, three possible record structures were compared with the same five design criteria. Four examples were set in advance. One value may be released more than once, and one release may lead to several reviews. A correction must preserve the earlier result. Approval, circulation, and validity may also change separately. A structure failed if it had to overwrite history, copy one record to stand in for another, or combine states that need separate control. Productization was kept outside the five-element framework and treated as a future direction.
The same rules were used throughout. A design problem was included only if it crossed at least two steps in the question–data–calculation–release–review chain and changed the meaning, authority, valid use, or lifecycle of a result. Visual preferences and commercial matters were excluded. Each problem was described through five items: the analytical object, the link that should exist, what the design could show, what was missing or inconsistent, and the strongest reasonable statement. A current arrangement had to be visible in a calculation, interface behavior, or defined operating step. A needed control had to address a specific missing link. A future proposition had to go beyond the setting studied here. When two pieces of information conflicted, the weaker one limited the claim. For example, a warning screen may show its inputs, but this does not prove that a complete review and closure record exists. Table 4 applies these rules to five pathways. Table 5 compares the three record structures.
Figure 1 summarizes the procedure. The framework combines arrangements that can be described with controls proposed for missing links. Claims that need more evidence remain future propositions. The same rule distinguishes borrowing an idea from a published study from reproducing or validating its model.
Table 3 gives the interpretive rules used throughout the study. They distinguish the presence of a design feature from stronger conclusions about implementation, use, or effect.

Table 3.
Interpretive rules for platform features and research claims.
| Platform status | Permitted interpretation | Interpretation deliberately excluded |
|---|---|---|
| Conceptual requirement | A function, definition, indicator, or interaction belongs to the intended design | Full release, actual use, or acceptance |
| Inspectable calculation or interface | The calculation or interaction can be described and its internal logic can be examined | End-to-end correctness, security, scalability, or effectiveness |
| Defined operating path | Acquisition, ingestion, calculation, release, refresh, or correction has an assigned place in the workflow | Successful completion of every production run |
| Synthetic interface example | The information hierarchy and analytical relationship can be explained without real values | Live authentication, production data, or verified operating performance |
| Proposed safeguard | The control would be needed for responsible future use | Complete implementation of that control in the setting |
Table 4 presents the five central problem-to-control pathways. Each pathway links a design problem to a response and states what the study does not conclude.
Table 4.
Problem-to-control pathways used to elaborate the proposed framework.
| Pathway | Design problem | Design response | Boundary |
|---|---|---|---|
| E1: question | A menu or chart can exist without a defined user, object, period, comparison, or follow-up action | Define the management question before selecting the analytical form | Actual use and decision effects are not inferred |
| E2: meaning | Organization, period, metric, unit, and accounting basis can change the meaning of the same displayed value | Preserve a common data language with the value | Complete semantic consistency is not assumed |
| E3: method | A score or forecast can appear complete while its inputs, sample, transformation, or version remain unclear | Make the method and its limits open to review | Accuracy and measurement validity are not inferred |
| E4: review | A warning can attract attention without recording authority, review decision, closure, or reopening | Connect the output to an accountable review record | Adoption and behavioral effects are not inferred |
| E5: operation | A valid design can become stale when data arrival, calculation, release, or correction is interrupted | Treat continued operation as part of the analytical design | Production reliability is not inferred |
Together, E1–E5 define a sequence that can be reviewed. A question cannot support comparison when its meaning is unstable. Common definitions are not enough when the method hides important assumptions. An analytical result cannot assign responsibility without review. Even a reviewed result can become unsafe when later operation leaves it out of date. These dependencies, rather than any single function, form the basis of the framework.
Table 5 reports the conceptual stress test. The comparison does not score software products. It asks whether each candidate structure can handle the fixed examples without confusing separate records, losing history, combining independent states, or obscuring responsibility.
Table 5.
Conceptual stress test of alternative record structures.
| Candidate structure | What it represents clearly | Failure under fixed counterexamples | Conceptual assessment |
|---|---|---|---|
| Displayed-value record | Meaning and calculation of one displayed result | Cannot distinguish repeated circulation, several reviews, or the decision attached to a particular release | Fails relationship, temporal-integrity, and responsibility criteria |
| Single lifecycle record | One simple sequence from preparation to closure | Requires duplication or mutation when one value has several releases, one release has several reviews, or approval, circulation, and validity diverge | Fails the identity clarity and independent state criteria |
| Linked value, release, and review identities | One-to-many relationships, independent state dimensions, immutable correction history, and accountable review | Adds identifiers and transition rules that must be governed consistently | Retained as the proposed structure; passes the conceptual criteria but remains untested empirically |
2.4. Researcher Role and Bias Controls
The sole researcher participated in the implementation from requirements coordination through development management, analytical implementation, and delivery. This position provides detailed technical and managerial understanding, but it also creates a risk of interpreting the researcher’s own design choices too favorably. The synthesis was therefore conducted retrospectively and was kept separate from claims of project acceptance or success.
Four controls were applied. First, conceptual design, described function, operational use, and measured effect were treated as different states. Second, when two sources supported different states, the less certain state set the limit of the claim. The difference was not resolved by assuming implementation success. Third, unresolved definitions, missing validation, incomplete operating controls, and unsupported entity types remained visible as gaps. A gap could justify a proposed control, but it could not be reported as an achieved capability. Fourth, every candidate structure was tested with the same examples and criteria. Passing this comparison showed only that the structure was internally coherent; it did not show that the structure was necessary in practice. No independent second analyst or participant validation was available. Another explanation therefore remains possible: the five elements may partly reflect the researcher’s project-management role and finance vocabulary. The framework is presented as a design analysis informed by practice and reflection on the researcher’s role, together with propositions for later testing. It is not presented as a set of independently replicated conditions.
2.5. Analytical Figure Design
The interface figures are original analytical schematics created to explain functional relationships. For example, they show movement from a trend to a decomposition or from a warning to its components. They were designed specifically for this article rather than reproducing an operating interface, and every displayed label and value is synthetic.
This design gives readers a concrete view of how the analytical framework can be translated into an interface. The figures explain information hierarchy and question flow; they do not serve as evidence of production operation or measured effects.
2.6. Scoring Logic and Governance Boundaries
The scoring illustrations use only synthetic values. Let index indicator groups or components and index raw indicators within group h. For an observed value for entity-period observation i, with reference bounds and , the positive and negative min–max transformations are
The group score used configurable within-group weights :
For example, suppose three synthetic normalized scores are 0.50, 0.30, and 0.20, with weights 8, 1, and 1. The group score is then 45. This example only shows how a management-set weight works; it is not a case result. The calculation requires finite weights with and , as well as . If a required indicator is missing, the score should not be released unless an approved rule already explains how to select and reweight the remaining indicators. Silently dropping an indicator changes what the score measures. Values outside raise another choice. They may be capped, retained, winsorized, or rejected, but each choice produces a different result. The chosen rule must therefore be stated and versioned. Target-range indicators also need a clear transformation before they can enter the score.
At the next level, the Criteria Importance Through Intercriteria Correlation (CRITIC) method weights the q group scores. It does not apply a second weight directly to each raw indicator. Let be a reference set chosen in advance from comparable entity-period observations. After applying the stated rule for out-of-range values, define and . The calculation requires . The normalized group score is . Here, is the sample standard deviation of in . The term is the Pearson correlation between groups h and k in the same reference set. The higher-level weights are
The resulting aggregate score was therefore
This follows the original CRITIC method [38]. It keeps two kinds of weights separate. Managers set the weights within each group, while the data determine the weights across groups. A group score can be read on a common 0–100 scale only when three conditions hold. All indicators must point in the same practical direction, every transformation must be defined, and the rule for out-of-range values must keep between 0 and 1. If any condition fails, aggregation should stop or use another clearly defined common scale. A target-range indicator cannot enter the total until its transformation is specified.
Before a CRITIC score is released, q must be at least 2. The calculation also needs one valid reference set, a documented rule for missing values, finite dispersions and correlations, and . The correlation matrix must be finite, symmetric, and calculated from the same reference set. It must also be numerically positive semidefinite. Although Pearson correlation can be calculated from two nonconstant observations, the result must be either or . Such a sample is too small for a defensible operational score. A minimum sample size should instead be chosen through a stability study or a stated application rule. Before current results are examined, the method should also specify how stability will be tested and how much change in weights or rankings is acceptable. A constant component or an undefined correlation makes the stated calculation undefined; it should not be silently assigned . The release gate is therefore straightforward: check the data, sample size, common scale, correlation matrix, and weight stability; apply the approved exclusion rule; and confirm that the denominator is positive. If a check fails, withhold the score. A fallback weight set may be used only if it was approved and locked before the current results were seen. These are proposed safeguards.
A CRITIC weight shows variation and overlap within the chosen reference set. It does not show accounting materiality, risk severity, causal importance, or management priority. Changing the reference set can therefore change the weights even when the underlying business has not changed. The platform did not always state whether the reference set used entities from one period, pooled observations from several periods, or another sample. It also did not always retain the refresh date or a comparison with the previous weights. Future operation therefore needs clear rules for the observation unit, minimum sample, sample definition, refresh timing, cross-period comparison, fallback weights, and sensitivity checks.
The platform also had a separate financial-warning function. It used ten accounting and market inputs, previous-period total assets, six fixed-rule components, and four display levels. Several inputs resemble those in the classic Altman distress screen, including working capital, retained earnings, an earnings measure, market value of equity, and revenue scaled by assets [39]. However, this is not an Altman model. It uses average assets, a nonstandard earnings numerator, and an added operating-cash-flow component. The sources of its coefficients and thresholds are also unclear. It is likewise different from the factor-analysis and logistic-regression model of Wei and Wang (2024). Let denote total assets and . Table 6 explains the accounting relationships and where they can be used. The parameters are included only to show why a research model, an engineering screen, and a management review must be treated as different things.
The six weighted values were summed and mapped to four legacy interface labels. Because parameter provenance and case-specific validity were not established, the result is described only as an unvalidated fixed-rule screening signal. It is not an estimated probability, credit rating, audit conclusion, or confirmed adverse event. A score should be withheld rather than extrapolated when a required denominator is zero, an input is missing or unreconciled, the consolidation basis is inconsistent, or market value is unavailable. An open reporting period also requires the system to withhold the score. The only exception is a pre-approved provisional-reporting rule. That rule must define the estimation basis, display a clear provisional label, limit the permitted use, and require recalculation after close. Until parameter provenance, entity applicability, local validation, and abstention rules are explicit and verified, the safe operating choice is to disable the screen or use it only in a sandbox. It should not be used for routine decisions. A complete user-facing abstention policy was not implemented; it is a prerequisite for future use, not an existing capability.
3. Design Findings and Framework Elaboration
To keep platform description separate from recommendations, each subsection reports three levels where relevant: the platform arrangement, its design boundary, and the resulting design principle. These principles are design conclusions drawn from practice. They do not show that the functions operated effectively in production.
3.1. From Fragmented Reporting to a Connected Finance Question
Platform arrangement. The platform problem could not be defined as `putting reports online’. The central design challenge was to connect changes that occurred at different times and in different parts of the business. In feed operations, market prices and procurement timing affect cost, product mix and volume affect margin, and receivables and inventory affect cash. In pig farming, herd structure, biological performance, feed conversion ratio, mortality, weight, selling price, and cost create a longer and less direct route to financial outcomes. Animal health and seed operations introduce other product, channel, research, regulatory, and seasonal factors.
Figure 2 shows the analytical order. External conditions provide context. Operating facts show how a change moved through the business. Financial results show its accumulated effect. Management review checks the data and explanation, then decides what to do. Review may also uncover seasonality, missing or incorrect data, an outdated rule, or a wrong period or organization mapping. The feedback path therefore matters as much as the forward path.
Design principle. Finance does not own every operating fact, but it is well placed to organize reporting periods, entity boundaries, calculation conventions, reconciliation, and cross-unit comparison. Business teams explain operating causes, while data and technology teams maintain acquisition, mapping, computation, and access. The useful design target is therefore a shared review environment rather than a finance-only reporting system.
3.2. A Common Workspace with Separate Analytical Views
Platform arrangement. Integration did not require every function to become one model. The platform placed sector analysis, financial analysis, capability evaluation, customer analysis, reports, and dashboards in one workspace, while each retained a distinct question and method. Sector analysis asks how the external environment is changing. Financial analysis asks how results and structures have changed. Capability evaluation asks which operating dimensions deserve attention. Warning functions ask whether a defined condition is strong enough to trigger review.
Figure 3 shows the arrangement through redrawn interface schematics. Shared navigation places related questions near one another, while separate pages keep the methods distinct. A user can move from an external trend to financial results and then to operating capability. This does not mean that one model produced all three outputs.
Design boundary and principle. A shared workspace did not establish a shared validation standard. Descriptive, diagnostic, predictive, and screening functions require different validation conditions. A trend chart can be checked against its source series; a decomposition against its formula; a forecast requires a cutoff, horizon, error measure, and model version; and a warning requires a defined object, boundary, and review action. Integration is therefore reviewable only when the common workspace preserves these function-specific boundaries.
3.3. The Common Data Language as the Platform’s Core
Platform arrangement. The synthesis treated the common data language, rather than a specific chart or model, as the most reusable structure for keeping a value interpretable as it moved from source to analysis and then to a report. The platform used seven core semantic fields: entity, organization, period, metric, unit, source, and version.
An entity identifies the legal or reporting subject. An organization identifies the group, business unit, division, or lower-level unit and states whether the value was submitted directly or aggregated. A period distinguishes date, month, quarter, year, single-period flow, cumulative flow, and point-in-time balance. A metric includes its definition, formula, direction, and valid range. Unit includes physical unit, currency, and scale. The source field records data origin and update status. Version records the definition and calculation used when the result was produced.
Design boundary. Data upload made these definitions operational. Moving a spreadsheet into a database was not enough: duplicate headers, incomplete periods, inconsistent units, or ambiguous organization names could suppress or overwrite values before an algorithm ran. Organization hierarchy created a related problem. A directly submitted division total could not safely be added again to the values of its subordinate companies. The platform did not consistently carry every consolidation, elimination, policy, currency, scenario, close, and restatement attribute needed for unrestricted group-finance comparison.
Figure 4 shows how this semantic layer connects data, analytics, and applications. Organization mapping and data-asset views are not administrative extras. They determine whether a number shown in a chart still refers to the correct unit, period, and definition.
Design principle. A governed analytical value uses three linked records instead of placing every control field in one record. The first record is the analytical value itself. It has a stable identity and keeps the meaning, accounting basis, and analytical context of the calculation.
The second record is a release of that value. It records the data cutoff, approval, applicable access policy, audience, channel, circulation, validity, and any earlier release that it replaces. Approval can be not required, pending, approved, or rejected. Circulation can be draft, review-only, or released. Validity can be current, withdrawn, superseded, or expired. These are separate questions and should not be compressed into one status field.
A draft has not yet entered controlled circulation. A review-only release goes only to named reviewers and is not a broad release. Where formal authorization is required, approval must come before release. Withdrawal and supersession are two different outcomes after release; they are not consecutive steps. A superseded release must point to its successor. If the data, reporting perimeter, accounting policy, access rights, or validity period changes, the earlier approval does not carry forward automatically.
The third record is a review case linked to a release. It keeps the reviewers, evidence, conclusion, action, closure, and any later reopening. One analytical value may have several releases, and one release may lead to several review cases. Access rights belong to a relationship among a person, role, resource, and time. The release therefore stores the applicable policy ID rather than treating permission as part of the value itself. Stable IDs and parent–child links preserve the history. A correction creates a new value ID or version instead of overwriting the old one. When a release is withdrawn or replaced, linked review cases must also be checked.
Table 7 lists the minimum identifiers and the extra accounting or review fields needed in some settings. Seven fields form the semantic core: entity, organization, period, metric, unit, source, and version. Technical lineage explains where a value came from and how it changed. The governed analytical value adds three practical questions: on what accounting basis can the value be compared, under which release did it circulate, and what happened during review? It is not simply a database row, a dashboard page, a data product, an audit opinion, or a management decision. It adds a result-level link to existing ideas in data governance, provenance, data products, access control, and model documentation [27,28,29,30,32,33,40,41,42].
Peer benchmarking created another semantic dependency. The design used different comparison pools for feed, pig farming, seed, and animal-health businesses and allowed both internal-unit and listed-company comparison. A comparison set was therefore an analytical input, not a cosmetic filter. Its sector fit, entity status, period coverage, data availability, inclusion rule, and version needed to remain visible; otherwise, a score or trend could change simply because the reference group changed.
Table 8 illustrates the complete sequence with a fully synthetic feed-business scenario. It is not a record of case performance or a complete consolidation checklist. The example shows why an external signal cannot move directly into a financial conclusion: each step changes the relevant period, unit, organizational scope, accounting treatment, or review responsibility. Deferred-tax effects, allocation to non-controlling interests, and elimination-batch or posting versions are added only when the transaction and reporting basis require them.
The construct also requires a minimum control model. Table 9 separates roles and controlled actions from the record that follows them and states whether the control was present in part or inferred from an unresolved gap. It is a proposed minimum for the construct, not a claim that every listed control was implemented. A release should be classified as higher risk under pre-approved criteria such as financial materiality, breadth of circulation, model uncertainty, entity applicability, and whether the reporting period is closed. For those releases, rule preparation and approval, result preparation and release approval, and exception initiation and closure should be assigned to different roles. Where a small organization cannot fully separate them, an independent after-the-fact review, log inspection, or higher-level approval is needed as a compensating control [40,41,42,43,44].
3.4. An Analytical Workbench That Supports Follow-Up Questions
Platform arrangement. Interpretability concerned continuity of inquiry. The platform was designed so that a user could move from a result to the next reasonable question. A trend view addressed what changed and when. Financial decomposition showed how profitability, turnover, and capital structure contributed to return. Capability evaluation showed which operating dimension influenced a summary score. Customer analysis provided another route from financial results back to transaction behavior.
Figure 5 combines three representative views. The value of this arrangement lies in continuity of inquiry, not in the number of charts. A user should be able to ask what changed, which factors may be associated with it, which source value produced the result, and who should review it. Business-intelligence research similarly treats value as something produced through organizational use and shared knowing, rather than through system availability alone [19,20].
Design principle. Uploaded and saved data, personal dashboards, report generation, downloading, and sharing turn an analysis into a review object that can move across people and meetings. The traceability information should therefore retain filters, comparison set, data cutoff, calculation version, permission, release status, and review status instead of treating every generated view as suitable for unrestricted circulation.
Design boundary. The forecasting function exposed a tension between displaying a future path and preserving the conditions under which it could be judged. Candidate outputs and error calculations existed, but complete rolling back-testing, production monitoring, and a stable release history were not established. A forecast could therefore appear complete while its cutoff, horizon, realized-value comparison, error definition, or model version remained unavailable to the next reviewer. Lagged association created a related risk: a visible relationship at a selected lag could be mistaken for a causal transmission mechanism.
Design principle. Analytical functions may share a workspace and semantic identifiers, but their validation records must remain function-specific. A descriptive structure requires reconciliation to source totals; a segmentation requires a declared observation window and assignment rule; a forecast requires time-separated evaluation and error context; and a warning requires an event definition, review capacity, and closure record. The setting illustrates why these validation objects should remain separate; it does not establish the validity of every function present in the workspace.
3.5. Industry-Specific Capability Evaluation
Platform arrangement. Sector knowledge entered the platform through configurable indicator structures. Feed evaluation emphasized sales, operations, supply chain, production, costs, growth, returns, solvency, cash flow, and financing. Pig-farming evaluation placed more weight on capacity use, piglet and finishing costs, herd structure, biological performance, mortality-related measures, output, and financial results. A generic financial-ratio library could not represent both operating mechanisms adequately.
The design classifies indicators as positive, negative, or target-range measures. Thresholds, weights, and warning conditions can be configured. Direction is not a cosmetic setting because normalization and direction choices can change a multi-criteria comparison [45]. A recent simulation study also shows that untreated negative indicators can cancel, destabilize, or reverse rankings when their practical direction is unclear [46]. Indicators should therefore be placed in the same practical direction before they are combined.
Design boundary. The scoring design combined reference-boundary distance with CRITIC weighting. Equations (1)–(4) show the calculation logic. Positive and negative measures could be placed on a comparable scale, and CRITIC assigned more weight to components that varied more and duplicated less information [38]. This data-dependent weight is not a measure of accounting materiality, risk severity, causal influence, or management priority; weight changes caused by a different reference set should not be read as operating changes. Target-range indicators were included, but no single transformation for them was consistently established. The platform also did not consistently version the CRITIC observation set, refresh cycle, out-of-bounds handling rule, or fallback for missing and constant data.
Design principle. Domain assumptions should remain open to review rather than being left inside expert intuition or hidden technical implementation. Indicator definition, direction, threshold, within-group weight, higher-level CRITIC weight, applicable business, reference sample, and version should travel with a released score. This is also a data-governance requirement because ownership of definitions and decision rights over changes affect the meaning of every released score [27].
The indicator system also became narrower over time. Later revisions concentrated attention on a smaller group of measures with clearer management value and stronger data availability. This suggests that a useful indicator system is not the largest possible catalog. It is a maintained agreement about which signals matter, how they are calculated, and how a user can return from a summary result to the underlying facts.
3.6. Two Warning Mechanisms and Their Research Boundary
Platform arrangement. The platform contained two distinct warning mechanisms. Indicator-level warnings checked a particular operating or financial measure against its configured direction, threshold, target range, or repeated-change rule. They answered: which specific indicator deserves review? A separate legacy financial-screening module combined ten accounting and market inputs and lagged assets into the six fixed-rule components shown in Table 6, then mapped the composite result to four interface labels. It answered only whether a broad financial signal should initiate a more complete review.
Figure 6 connects the risk overview, component explanation, rule settings, and human review. A warning is not a confirmed event. It may reflect a real business change, but it may also come from seasonality, missing data, an incorrect organization or period mapping, or an outdated rule. The first screen should therefore make review easy. It should identify the entity and period, show the inputs and rule, and display related indicators. A full review record should answer four simple questions: who prepared and reviewed the result, what evidence they considered, what they decided, and what happened next. The detailed record can include the trigger time, responsible roles, evidence, conclusion, action owner, due date, escalation, exception reason, closure, and reopening condition. For high-risk signals, rule preparation and approval should be separate. Result preparation and release approval should also be separate, as should raising and closing an exception. If a small team cannot separate these roles, another reviewer should perform a compensating check.
Wei and Wang developed a financial early-warning model for Chinese enterprises using data from listed companies [47]. They began with eight quantitative indicators and two candidate qualitative variables, then used standardization, factor analysis, logistic regression, probability estimates, and four risk levels. The model was estimated with 320 company observations from 2020. The study also reported a validation sample of 60 companies from 2019. Because 2019 comes before the estimation year, this article calls it a historical holdout rather than a forward-looking out-of-time test. The platform borrowed only two ideas: organizing indicators into understandable groups and showing the signal in levels. It did not reproduce the full model.
Design boundary. The platform used a separate fixed-rule screen. It did not deploy the published study’s sample standardization, factor-score coefficients, logistic equation, estimated probabilities, calibration, or validation procedure unchanged. Parameter provenance, applicability to internal or non-listed entities, and a complete abstention policy were also not established. Table 10 states the relationship precisely.
Design principle. A warning should start a review; it should not be treated as proof that a risk event has occurred. Responsible use needs a clear local event definition, a time horizon, authorized inputs, time-based testing, coverage of the business cycle, rules for missing and revised data, calibration checks, and thresholds that match the team’s review capacity. The system should return no result when key inputs are missing, the entity type is unsupported, the data cannot be traced, or the rule has expired. Until these safeguards are in place, the legacy screen should remain disabled or be used only in a controlled sandbox.
3.7. The Five-Element Framework
Table 4 links problems to controls, and Table 5 compares the record structures. Together they lead to the five-element framework in Figure 7. The framework is a review cycle. First, the management question states who needs the result, what it concerns, which period and comparison apply, and what action may follow. Second, a common data language makes the facts comparable. Third, interpretable analysis keeps the calculation visible. Fourth, managerial review can confirm, question, return, or accept the result as an exception and assign the next action. Fifth, continuous operation keeps the data, rules, permissions, releases, and monitoring up to date. A later review may send the process back to a revised question or definition.
Continuous operation is a chain, not an update button. The chain may include obtaining external data, loading it locally, synchronizing a test environment, calculating results, releasing them under control, and recalculating dependent financial indicators. A break anywhere can leave an old result on a page that still looks credible.
Three gates help prevent that problem. Technical checks cover the data structure, types, keys, completeness, and batch totals. Semantic checks cover the entity, organization, period, unit, version, and mapping. Financial checks cover reconciliation to the ledger or trial balance, close status, reporting perimeter, eliminations, and adjustments. Whether a period must be closed depends on the intended use. A provisional result needs its own versioned rule, clear label, limited scope, and later recalculation. Completing a calculation is not enough to approve or publish it. If a period is reopened, a statement is restated, or the reporting perimeter changes, earlier releases may need to be withdrawn or replaced. Related reviews may need to reopen, and downstream results may need to be recalculated. Data engineering becomes financial control when it keeps a released result current, traceable, authorized, and visible to the right reviewer.
4. Discussion
4.1. Contribution to Digital Agriculture
A prominent stream of the cited digital-agriculture literature begins near production: sensors, animal monitoring, farm information systems, or predictive models. This study focuses on the next translation problem. Selected operating facts must enter financial comparison, capital-efficiency analysis, and management review without losing their time, unit, organizational boundary, or source. The resulting platform does not replace production systems. It provides an interpretive layer through which finance and business users can connect production-related signals to financial questions.
The design analysis also supports a broader view of responsible digital agriculture. Technology design should address ownership, accountability, access, and unintended consequences while the system is being built, not after it is deployed [8]. In a finance setting, this means that provenance, permission, correction, and human review belong inside the analytical design.
4.2. Contribution to Management Accounting and Business Intelligence
The article adds an industry-specific account of how analytics can enter management-accounting work. Prior research argues that analytics changes accounting when it becomes part of decision practice [21,48,49]. The synthesis accordingly proposes clear period types, explicit organization levels, traceable formulas, visible component scores, and review paths that involve both finance and operations as design requirements rather than measured effects.
The self-service layer extends this account. Uploading data, selecting a peer group, saving a view, generating a report, and sharing it are analytically consequential actions because each can change the evidence seen by the next reviewer. Treating the output as a versioned and permission-aware review object connects self-service business intelligence with accountability instead of equating self-service with unrestricted access.
The individual methods in the platform are not new. Trend analysis, DuPont decomposition, weighted scoring, factor analysis, logistic regression, forecasting, and dashboards are all established. The contribution lies in how the framework connects them to data meaning, sector indicators, financial interpretation, warning limits, interfaces, and operating controls. It follows operating facts into group finance, identifies the controls attached to one analytical value, and treats permission, review outcome, closure, and reopening as part of the analytical record. This supports the wider finding that technology creates value only when organizational capabilities and working practices put it to use [17,18,20,23,24].
4.3. Relationship to Adjacent Frameworks and Boundary Conditions
The five elements are familiar, but the way they depend on one another is the proposed addition. Existing research provides the building blocks. Data governance assigns decision rights and responsibility [27,28,40]. Data and decision provenance trace how information moves through a process [30,31,32]. Data-product research explains how data can be packaged for governed reuse [33]. Other work covers role-based access [41], model documentation [42], accounting records [50], and continuous assurance [43,44]. Sociotechnical research connects technology with people, tasks, ownership, and consequences [7,8,34]. Design science separates the problem, the designed artifact, and its evaluation [35,36].
The governed analytical value makes a narrower claim. Technical lineage explains where data came from and how it changed. Decision provenance follows information into a decision. A data product packages data for reuse. The proposed construct adds a clear separation among three records.
The value record answers, “What was calculated and on what basis?” The release record answers, “What was sent, when, to whom, and under which authority?” The review record answers, “How was that release checked, decided, acted on, closed, or reopened?” One value may have many releases, and one release may have many reviews. A correction creates a successor instead of overwriting history. Approval, circulation, and validity also remain separate.
Table 5 shows why one displayed-value record or one lifecycle record cannot handle all four examples. The article does not claim that every existing provenance or workflow system lacks similar fields; it states why these links should be explicit.
The five elements form a proposed dependency cycle, not a checklist. A clear question is of little use if definitions differ. Common definitions are not enough if the analysis hides its assumptions. An analytical result cannot assign responsibility without review. Review can still fail if later operation leaves an old result in use. Two alternatives were considered. If the management question sits outside the cycle, the framework cannot show how review may lead people to redefine the object or comparison. If managerial review is absorbed into continuous operation, the distinct authority to confirm, question, return, accept an exception, and assign action becomes unclear. The five-element structure keeps problem definition, evidence, interpretation, decision authority, and ongoing maintenance separate. This explains the design choice but does not claim that it is the only possible grouping.
The setting illustrates these dependencies when operating and financial facts have different clocks, business units use different physical and accounting measures, and group-level aggregation can change the meaning of a number. The framework is most relevant to multi-unit organizations with heterogeneous data and a finance-led review process. Its incremental value may be limited in a single-purpose, single-unit system with stable definitions, no cross-functional circulation, or a fully automated decision governed by a different validation and accountability regime. A competing explanation is that the cycle reflects the participating researcher’s finance-control and project-management perspective; comparative research is required to determine which dependencies recur independently.
The framework leads to three propositions for later comparative research. Each configuration must be classified before results are examined. DP1 requires shared identifiers for data meaning, plus separate versions for each function’s method and validation rules. DP2 requires enforced links among the value, release, and review records, including their source, calculation, comparison set, version, access policy, and review conclusion. DP3 requires separate technical, semantic, financial, calculation, circulation, validity, and downstream-refresh states, with clear transition rules. A partial setup must remain a separate category. It cannot be counted as complete simply because some result fields are filled in. Future comparisons should use similar workflows or fixed time windows and consider exposure, complexity, close status, financial materiality, and review capacity. Table 11 gives one main outcome for each proposition and states what result would not support it.
For DP1, the person who decides whether an error is material must be independent of the operational reviewer who may have detected it. An error not detected before observation ends is treated as right-censored, meaning that its detection time is known only to exceed the observation window. For DP2, a required review case that was never opened remains in the denominator and counts as unsupported. Role assignment and timeliness are additional checks rather than parts of the primary outcome. For DP3, a release still shown as current when observation ends is also right-censored; a compliant read-only historical archive is not a failure. All censoring rules, matching variables, materiality groups, minimum sample requirements, and acceptable ranges for the additional checks should be fixed before outcomes are examined. An improvement in the primary outcome would not support the proposition if a pre-specified additional check deteriorated materially.
4.4. Productization as a Future Design Direction
Productization is separate from the two research questions and the five-element framework. A customized system could first become a repeatable single-tenant product. This would require clear and reusable definitions, mappings, parameters, tests, deployment steps, and operating routines. The common core could then be separated from sector packages and organization-specific settings. Multi-tenant isolation, metering, service governance, recovery, and authorized use of external data should be considered only after repeatable delivery has been shown.
The platform already had common data objects, modular analysis, configurable indicators, reports, and update procedures. It did not establish multi-tenancy, billing, service-level performance, disaster recovery, or operation across many clients. It is therefore not described as mature software as a service. A future service would need explicit controls in several areas. These include tenant access, key isolation, data location, audit logs, configuration changes, rule rollback, recovery targets, data deletion and exit, and rights to redistribute market data. Access, tenant separation, auditability, and recovery should be tested rather than assumed [41,51]. Modular productization is a reasonable direction [13,16], but these requirements still need testing in other implementations.
4.5. Practical Implications
For practitioners, the main implication is to organize the roadmap around decision paths rather than menu counts. A management question should be written before a feature specification. Each critical metric should have a documented data definition. Each analytical result should have a trace from displayed value to definition, source, calculation, and version. Each warning should have a review owner, evidence record, review decision, due date, escalation route, closure state, and reopening rule.
Implementation should use clear release gates. Technical checks cover the data structure, types, keys, completeness, and batch totals. Semantic checks cover the entity, organization, period, unit, version, and mapping. Financial checks cover reconciliation, close status, reporting perimeter, eliminations, and adjustments. The intended use determines whether the period must be closed or whether a versioned provisional rule is enough. Benchmarking needs a controlled comparison set. Evaluation needs visible boundaries, weights, and sensitivity checks. Forecasting needs a cutoff, horizon, error definition, and release status. Reports and dashboards need saved filters, permissions, and review status. A result can be approved only after every applicable gate passes. The system should then confirm separately that dependent results have been refreshed.
The framework operationalizes the distinction introduced in the Introduction. Informatization creates reliable records. Digitalization connects and standardizes those records. Digital intelligence uses governed connections to explain change, direct attention, and support accountable action. Adding a model to unstable definitions does not create intelligence; it conceals unresolved data problems behind a score.
4.6. Limitations and Future Research
This study has five main limitations. First, it draws design propositions from one organizational setting and one implementation trajectory. The framework may be analytically transferable but is neither statistically generalizable nor an empirically demonstrated set of necessary conditions. Second, the researcher participated in the implementation and conducted the analysis alone. The separation of design, implementation, use, and effect reduces but does not remove hindsight and selection bias. No second analyst or participant validation was available; consequently, the completeness and classification of E1–E5 cannot be independently verified within this study. This limitation arises from the researcher’s direct participation, not merely from a general possibility of bias. Third, the study does not include longitudinal interviews, complete use logs, or before-and-after performance measures. It therefore elaborates design requirements rather than effectiveness or user sufficiency.
Fourth, end-to-end security, reliability, scalability, and service-level performance were not independently tested. Fifth, warning and forecasting functions were not retrained or independently validated in the implementation setting. The legacy financial screen has unresolved parameter provenance, accounting comparability, and entity-applicability questions, so its accuracy, calibration, false-positive rate, economic return, and production stability remain unknown.
Future research could add interviews with finance and operating users, traceable warning reviews, time-based model tests, controlled usability studies, and before-and-after process measures. Comparisons across feed, pig farming, animal health, and seed operations could show which parts of the framework remain stable. Sector studies could also examine biological-asset stages, animal transfers, mortality losses, internal feed trades, transfer prices, and the bridge between management and statutory consolidation. These factors may change how operating facts enter group finance. Independent studies would further strengthen the conclusions.
5. Conclusions
This article explains how a finance-led digital intelligence platform can connect market conditions, operating facts, financial results, and management review. For RQ1, it proposes a five-part cycle: management question, common data language, interpretable analysis, managerial review, and continuous operation. For RQ2, it links three records: the calculated value, each release of that value, and each review of the release. This keeps the meaning, accounting basis, method, access rights, release status, and review history separate but traceable.
Five problem-to-control pathways make these answers practical. Upload templates and organization mappings can act as data-quality gates. Peer groups should be versioned inputs. CRITIC weights and reference sets should remain visible. Forecast pages should show both error information and release context. Saved data, dashboards, and reports should retain filters, access-policy versions, review conclusions, and closure status. Together, these controls determine whether a result can support a traceable management review.
The warning module shows why precise wording matters. Wei and Wang (2024) informed the grouping of indicators and the use of risk levels. The platform nevertheless used a different fixed-rule screen and did not reproduce their factor-analysis and logistic-regression model. The legacy screen should remain disabled or sandbox-only when the entity is unsupported, the period is incomplete, or the parameters cannot be traced. Productization has a similar boundary. Customized software may be the starting point for a repeatable industry product, but mature software as a service also needs proven tenant isolation, service governance, recovery, and multi-client operation.
The main conclusion is practical. In agribusiness finance, useful intelligence means noticing a change, understanding why it matters, checking the evidence, stating what is still uncertain, and turning the result into accountable and traceable action.
Author Contributions
Conceptualization, H.W.; methodology, H.W.; software (analytical implementation and calculation logic), H.W.; formal analysis, H.W.; resources, H.W.; writing—original draft preparation, H.W.; writing—review and editing, H.W.; visualization, H.W.; project administration, H.W. H.W. served as project lead and senior algorithm specialist and was responsible for stakeholder and requirements coordination, research and development management, analytical implementation, and product delivery. The author has read and agreed to the published version of the manuscript.
Funding
This work received institutional and employment-related support from the Data Intelligence Branch, Enterprise Financial Management Association of China; grant number: not applicable. The author was affiliated with and supported by this organization during the relevant work. No separate research grant was awarded. The organization did not review the manuscript or determine its conclusions or submission decision.
Institutional Review Board Statement
Not applicable. This retrospective organizational design study did not involve interviews, surveys, observation of individuals, personnel-performance records, personal data, or intervention with humans or animals. Final confirmation that the study is exempt or does not constitute human-subject research remains subject to the policy of the submitting institution or target journal.
Informed Consent Statement
Not applicable.
Data Availability Statement
No research dataset was generated or analyzed for statistical estimation or qualitative coding. The organizational setting informed the conceptual design analysis, but the article does not present it as independently reproducible empirical evidence. The definitions, formulas, claim boundaries, synthetic examples, problem-to-control pathways, and proposed framework needed to examine the conceptual argument are reported in the article. Public scholarly and policy sources are listed in the references; all numerical values displayed in the figures are synthetic.
Conflicts of Interest
Employment and institutional support created a professional and financial relationship with the implementation context. This relationship is disclosed as a competing interest. Explicit claim boundaries and the exclusion of unsupported outcome statements were used to reduce interpretive bias. The organization is anonymized and did not review or endorse the manuscript.
Abbreviations
The following abbreviations are used in this manuscript:
| BI | Business intelligence |
| CDAC | China Data Analysis Committee |
| CRITIC | Criteria Importance Through Intercriteria Correlation |
| DP | Design proposition |
| RQ | Research question |
| SaaS | Software as a service |
References
- Wolfert, S.; Ge, L.; Verdouw, C.; Bogaardt, M.J. Big Data in Smart Farming—A Review. Agric. Syst. 2017, 153, 69–80. [Google Scholar] [CrossRef]
- Liakos, K.G.; Busato, P.; Moshou, D.; Pearson, S.; Bochtis, D. Machine Learning in Agriculture: A Review. Sensors 2018, 18, 2674. [Google Scholar] [CrossRef] [PubMed]
- Kamilaris, A.; Prenafeta-Boldu, F.X. Deep Learning in Agriculture: A Survey. Comput. Electron. Agric. 2018, 147, 70–90. [Google Scholar] [CrossRef]
- Fountas, S.; Carli, G.; Sorensen, C.G.; Tsiropoulos, Z.; Cavalaris, C.; Vatsanidou, A.; Liakos, B.; Canavari, M.; Wiebensohn, J.; Tisserye, B. Farm Management Information Systems: Current Situation and Future Perspectives. Comput. Electron. Agric. 2015, 115, 40–50. [Google Scholar] [CrossRef]
- Norton, T.; Chen, C.; Larsen, M.L.V.; Berckmans, D. Review: Precision Livestock Farming: Building `Digital Representations’ to Bring the Animals Closer to the Farmer. Animal 2019, 13, 3009–3017. [Google Scholar] [CrossRef] [PubMed]
- Neethirajan, S. The Role of Sensors, Big Data and Machine Learning in Modern Animal Farming. Sens. Bio-Sens. Res. 2020, 29, 100367. [Google Scholar] [CrossRef]
- Klerkx, L.; Jakku, E.; Labarthe, P. A Review of Social Science on Digital Agriculture, Smart Farming and Agriculture 4.0: New Contributions and a Future Research Agenda. NJAS Wagening. J. Life Sci. 2019, 90–91, 100315. [Google Scholar] [CrossRef]
- Eastwood, C.; Klerkx, L.; Ayre, M.; Dela Rue, B. Managing Socio-Ethical Challenges in the Development of Smart Farming: From a Fragmented to a Comprehensive Approach for Responsible Research and Innovation. J. Agric. Environ. Ethics. First published online in 2017. 2019, 32, 741–768. [Google Scholar] [CrossRef]
- Birner, R.; Daum, T.; Pray, C. Who Drives the Digital Revolution in Agriculture? A Review of Supply-Side Trends, Players and Challenges. Appl. Econ. Perspect. Policy 2021, 43, 1260–1285. [Google Scholar] [CrossRef]
- Basso, B.; Antle, J. Digital Agriculture to Design Sustainable Agricultural Systems. Nat. Sustain. 2020, 3, 254–256. [Google Scholar] [CrossRef]
- State Council of the People’s Republic of China. The 14th Five-Year Plan for Digital Economy Development, 2022. (accessed on 14 August 2026).
- Ministry of Agriculture and Rural Affairs of the People’s Republic of China. National Smart Agriculture Action Plan (2024–2028), 2024. (accessed on 14 August 2026).
- Bharadwaj, A.; El Sawy, O.A.; Pavlou, P.A.; Venkatraman, N. Digital Business Strategy: Toward a Next Generation of Insights. MIS Q. 2013, 37, 471–482. [Google Scholar] [CrossRef]
- Vial, G. Understanding Digital Transformation: A Review and a Research Agenda. J. Strateg. Inf. Syst. 2019, 28, 118–144. [Google Scholar] [CrossRef]
- Verhoef, P.C.; Broekhuizen, T.; Bart, Y.; Bhattacharya, A.; Dong, J.Q.; Fabian, N.; Haenlein, M. Digital Transformation: A Multidisciplinary Reflection and Research Agenda. J. Bus. Res. 2021, 122, 889–901. [Google Scholar] [CrossRef]
- Nambisan, S.; Lyytinen, K.; Majchrzak, A.; Song, M. Digital Innovation Management: Reinventing Innovation Management Research in a Digital World. MIS Q. 2017, 41, 223–238. [Google Scholar] [CrossRef]
- Mikalef, P.; Boura, M.; Lekakos, G.; Krogstie, J. Big Data Analytics Capabilities and Innovation: The Mediating Role of Dynamic Capabilities and Moderating Effect of the Environment. Br. J. Manag. 2019, 30, 272–298. [Google Scholar] [CrossRef]
- Wamba, S.F.; Gunasekaran, A.; Akter, S.; Ren, S.J.f.; Dubey, R.; Childe, S.J. Big Data Analytics and Firm Performance: Effects of Dynamic Capabilities. J. Bus. Res. 2017, 70, 356–365. [Google Scholar] [CrossRef]
- Shollo, A.; Galliers, R.D. Towards an Understanding of the Role of Business Intelligence Systems in Organisational Knowing. Inf. Syst. J. First published online in 2015. 2016, 26, 339–367. [Google Scholar] [CrossRef]
- Trieu, V.H. Getting Value from Business Intelligence Systems: A Review and Research Agenda. Decis. Support Syst. 2017, 93, 111–124. [Google Scholar] [CrossRef]
- Rikhardsson, P.; Yigitbasioglu, O. Business Intelligence and Analytics in Management Accounting Research: Status and Future Focus. Int. J. Account. Inf. Syst. 2018, 29, 37–58. [Google Scholar] [CrossRef]
- Möller, K.; Schäffer, U.; Verbeeten, F. Digitalization in Management Accounting and Control: An Editorial. J. Manag. Control 2020, 31, 1–8. [Google Scholar] [CrossRef] [PubMed]
- Boerner, X.; Wiener, M.; Guenther, T.W. Controllership Effectiveness and Digitalization: Shedding Light on the Importance of Business Analytics Capabilities and the Business Partner Role. Manag. Account. Res. 2025, 66, 100904. [Google Scholar] [CrossRef]
- Bedford, D.S.; Derichs, D.; Hoozée, S.; Malmi, T.; Messner, M.; Sinha, V.K.; Van der Kolk, B.; Verbeeten, F. Digitalization of the Finance Function: Automation, Analytics, and Finance Function Effectiveness. Manag. Account. Res. 2025, 67, 100942. [Google Scholar] [CrossRef]
- Knudsen, D.R. Elusive Boundaries, Power Relations, and Knowledge Production: A Systematic Review of the Literature on Digitalization in Accounting. Int. J. Account. Inf. Syst. 2020, 36, 100441. [Google Scholar] [CrossRef]
- Quattrone, P. Management Accounting Goes Digital: Will the Move Make It Wiser? Manag. Account. Res. 2016, 31, 118–122. [Google Scholar] [CrossRef]
- Abraham, R.; Schneider, J.; vom Brocke, J. Data Governance: A Conceptual Framework, Structured Review, and Research Agenda. Int. J. Inf. Manag. 2019, 49, 424–438. [Google Scholar] [CrossRef]
- Zhang, Q.; Sun, X.; Zhang, M. Data Matters: A Strategic Action Framework for Data Governance. Inf. Manag. 2022, 59, 103642. [Google Scholar] [CrossRef]
- Karkošková, S. Data Governance Model to Enhance Data Quality in Financial Institutions. Inf. Syst. Manag. 2023, 40, 90–110. [Google Scholar] [CrossRef]
- Werder, K.; Ramesh, B.; Zhang, R. Establishing Data Provenance for Responsible Artificial Intelligence Systems. ACM Trans. Manag. Inf. Syst. 2022, 13, 1–23. [Google Scholar] [CrossRef]
- Guitton, F.; Oehmichen, A.; Bossé, É.; Guo, Y. Honest Computing: Achieving Demonstrable Data Lineage and Provenance for Driving Data- and Process-Sensitive Policies. Data Policy 2024, 6, e84. [Google Scholar] [CrossRef]
- Singh, J.; Cobbe, J.; Norval, C. Decision Provenance: Harnessing Data Flow for Accountable Systems. IEEE Access 2019, 7, 6562–6574. [Google Scholar] [CrossRef]
- Blohm, I.; Wortmann, F.; Legner, C.; Köbler, F. Data Products, Data Mesh, and Data Fabric. Bus. Inf. Syst. Eng. 2024, 66, 643–652. [Google Scholar] [CrossRef]
- Bostrom, R.P.; Heinen, J.S. MIS Problems and Failures: A Socio-Technical Perspective. MIS Q. 1977, 1, 11–28. [Google Scholar] [CrossRef] [PubMed]
- Hevner, A.R.; March, S.T.; Park, J.; Ram, S. Design Science in Information Systems Research. MIS Q. 2004, 28, 75–105. [Google Scholar] [CrossRef]
- Peffers, K.; Tuunanen, T.; Rothenberger, M.A.; Chatterjee, S. A Design Science Research Methodology for Information Systems Research. J. Manag. Inf. Syst. 2007, 24, 45–77. [Google Scholar] [CrossRef]
- Eisenhardt, K.M. Building Theories from Case Study Research. Acad. Manag. Rev. 1989, 14, 532–550. [Google Scholar] [CrossRef]
- Diakoulaki, D.; Mavrotas, G.; Papayannakis, L. Determining Objective Weights in Multiple Criteria Problems: The CRITIC Method. Comput. Oper. Res. 1995, 22, 763–770. [Google Scholar] [CrossRef]
- Altman, E.I. Financial Ratios, Discriminant Analysis and the Prediction of Corporate Bankruptcy. J. Financ. 1968, 23, 589–609. [Google Scholar] [CrossRef]
- Khatri, V.; Brown, C.V. Designing Data Governance. Commun. ACM 2010, 53, 148–152. [Google Scholar] [CrossRef]
- Sandhu, R.S.; Coyne, E.J.; Feinstein, H.L.; Youman, C.E. Role-Based Access Control Models. Computer 1996, 29, 38–47. [Google Scholar] [CrossRef]
- Mitchell, M.; Wu, S.; Zaldivar, A.; Barnes, P.; Vasserman, L.; Hutchinson, B.; Spitzer, E.; Raji, I.D.; Gebru, T. Model Cards for Model Reporting. In Proceedings of the Proceedings of the Conference on Fairness, Accountability, and Transparency, 2019; pp. 220–229. [Google Scholar] [CrossRef]
- Kogan, A.; Sudit, E.F.; Vasarhelyi, M.A. Continuous Online Auditing: A Program of Research. J. Inf. Syst. 1999, 13, 87–103. [Google Scholar] [CrossRef]
- Alles, M.G.; Kogan, A.; Vasarhelyi, M.A. Feasibility and Economics of Continuous Assurance. Audit. A J. Pract. Theory 2002, 21, 125–138. [Google Scholar] [CrossRef]
- Vafaei, N.; Ribeiro, R.A.; Camarinha-Matos, L.M. Data Normalisation Techniques in Decision Making: Case Study with TOPSIS Method. Int. J. Inf. Decis. Sci. 2018, 10, 19–38. [Google Scholar] [CrossRef]
- Wei, H. Negative Indicators and Ordering Stability in Exploratory Factor Analysis: A Sign-Orientation Theory with Reproducible Simulation Evidence. Preprints 2026, version 1. [Google Scholar] [CrossRef]
- Wei, H.; Wang, X. Financial Risk Management Early-Warning Model for Chinese Enterprises. J. Risk Financ. Manag. 2024, 17, 255. [Google Scholar] [CrossRef]
- Appelbaum, D.; Kogan, A.; Vasarhelyi, M.; Yan, Z. Impact of Business Analytics and Enterprise Systems on Managerial Accounting. Int. J. Account. Inf. Syst. 2017, 25, 29–44. [Google Scholar] [CrossRef]
- Moll, J.; Yigitbasioglu, O. The Role of Internet-Related Technologies in Shaping the Work of Accountants: New Directions for Accounting Research. Br. Account. Rev. 2019, 51, 100833. [Google Scholar] [CrossRef]
- Geerts, G.L.; McCarthy, W.E. An Ontological Analysis of the Economic Primitives of the Extended-REA Enterprise Information Architecture. Int. J. Account. Inf. Syst. 2002, 3, 1–16. [Google Scholar] [CrossRef]
- Subashini, S.; Kavitha, V. A Survey on Security Issues in Service Delivery Models of Cloud Computing. J. Netw. Comput. Appl. 2011, 34, 1–11. [Google Scholar] [CrossRef]
Figure 1.
Conceptual design procedure. The study identifies broken links, limits each statement to what the design can show, and compares three record structures with the same examples and criteria.
Figure 1.
Conceptual design procedure. The study identifies broken links, limits each statement to what the design can show, and compares three record structures with the same examples and criteria.
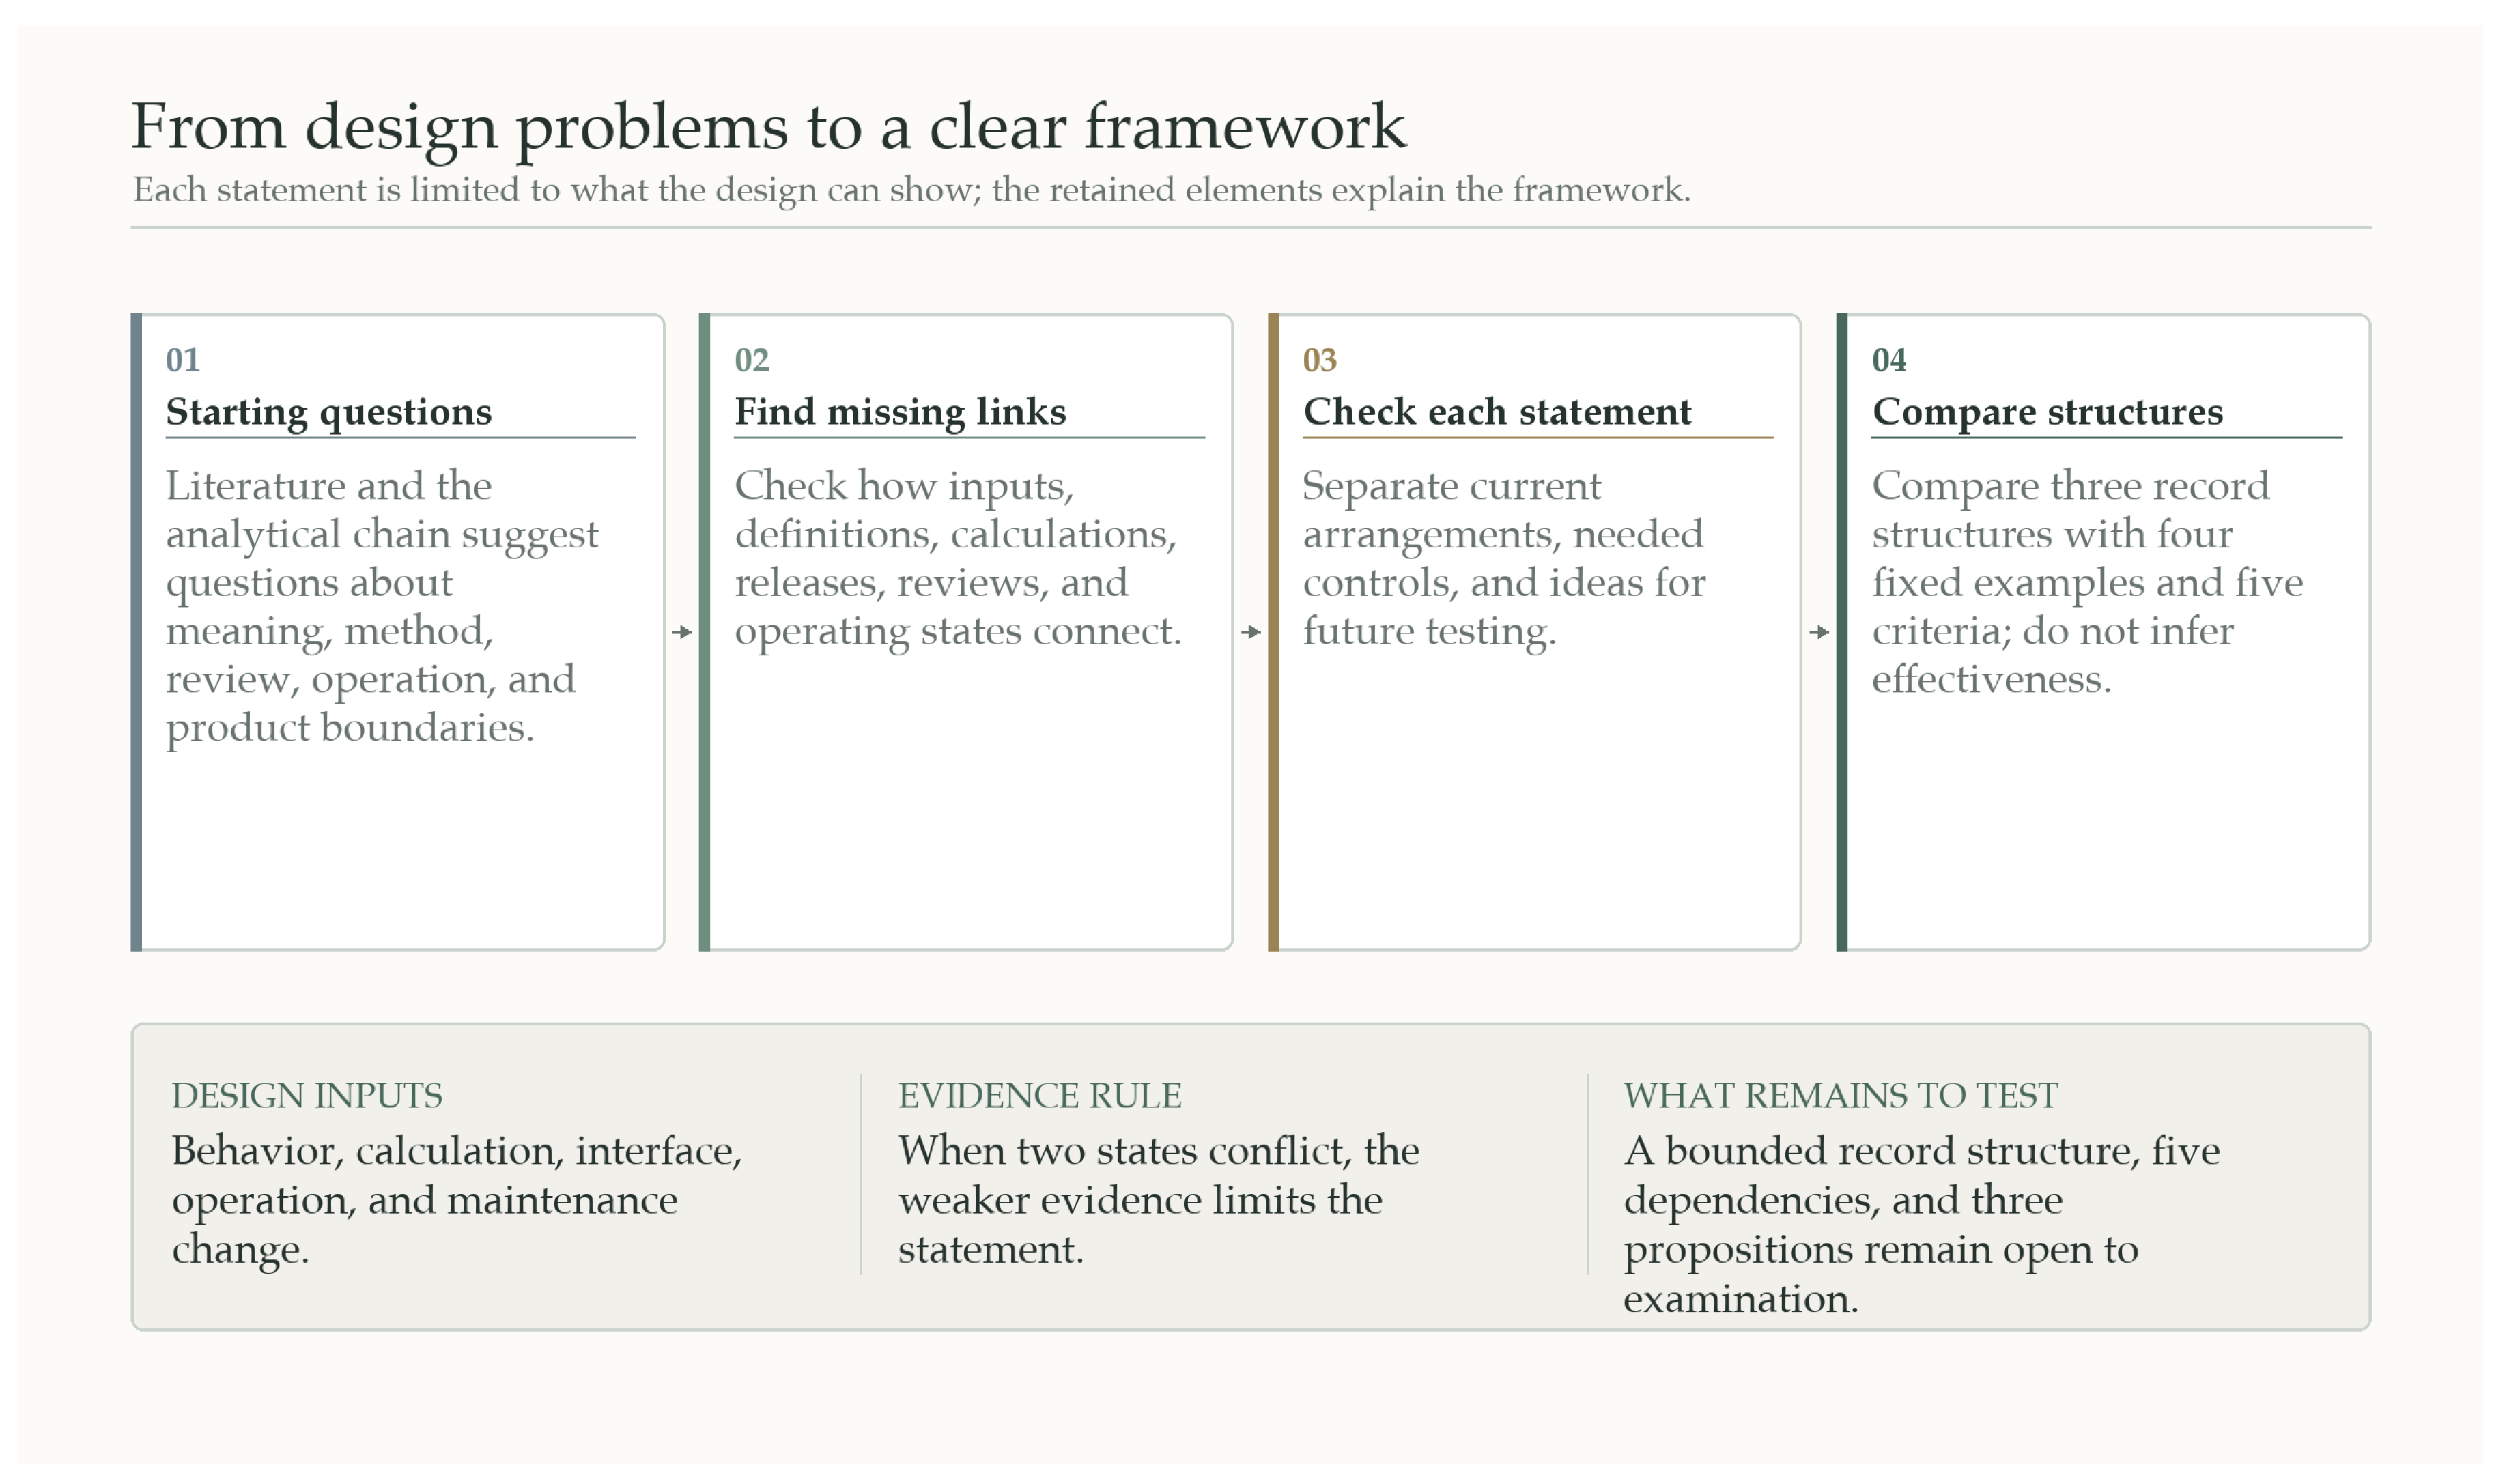
Figure 2.
Analytical chain from external change to management review. The sequence organizes inquiry and does not represent an estimated causal model.
Figure 2.
Analytical chain from external change to management review. The sequence organizes inquiry and does not represent an estimated causal model.
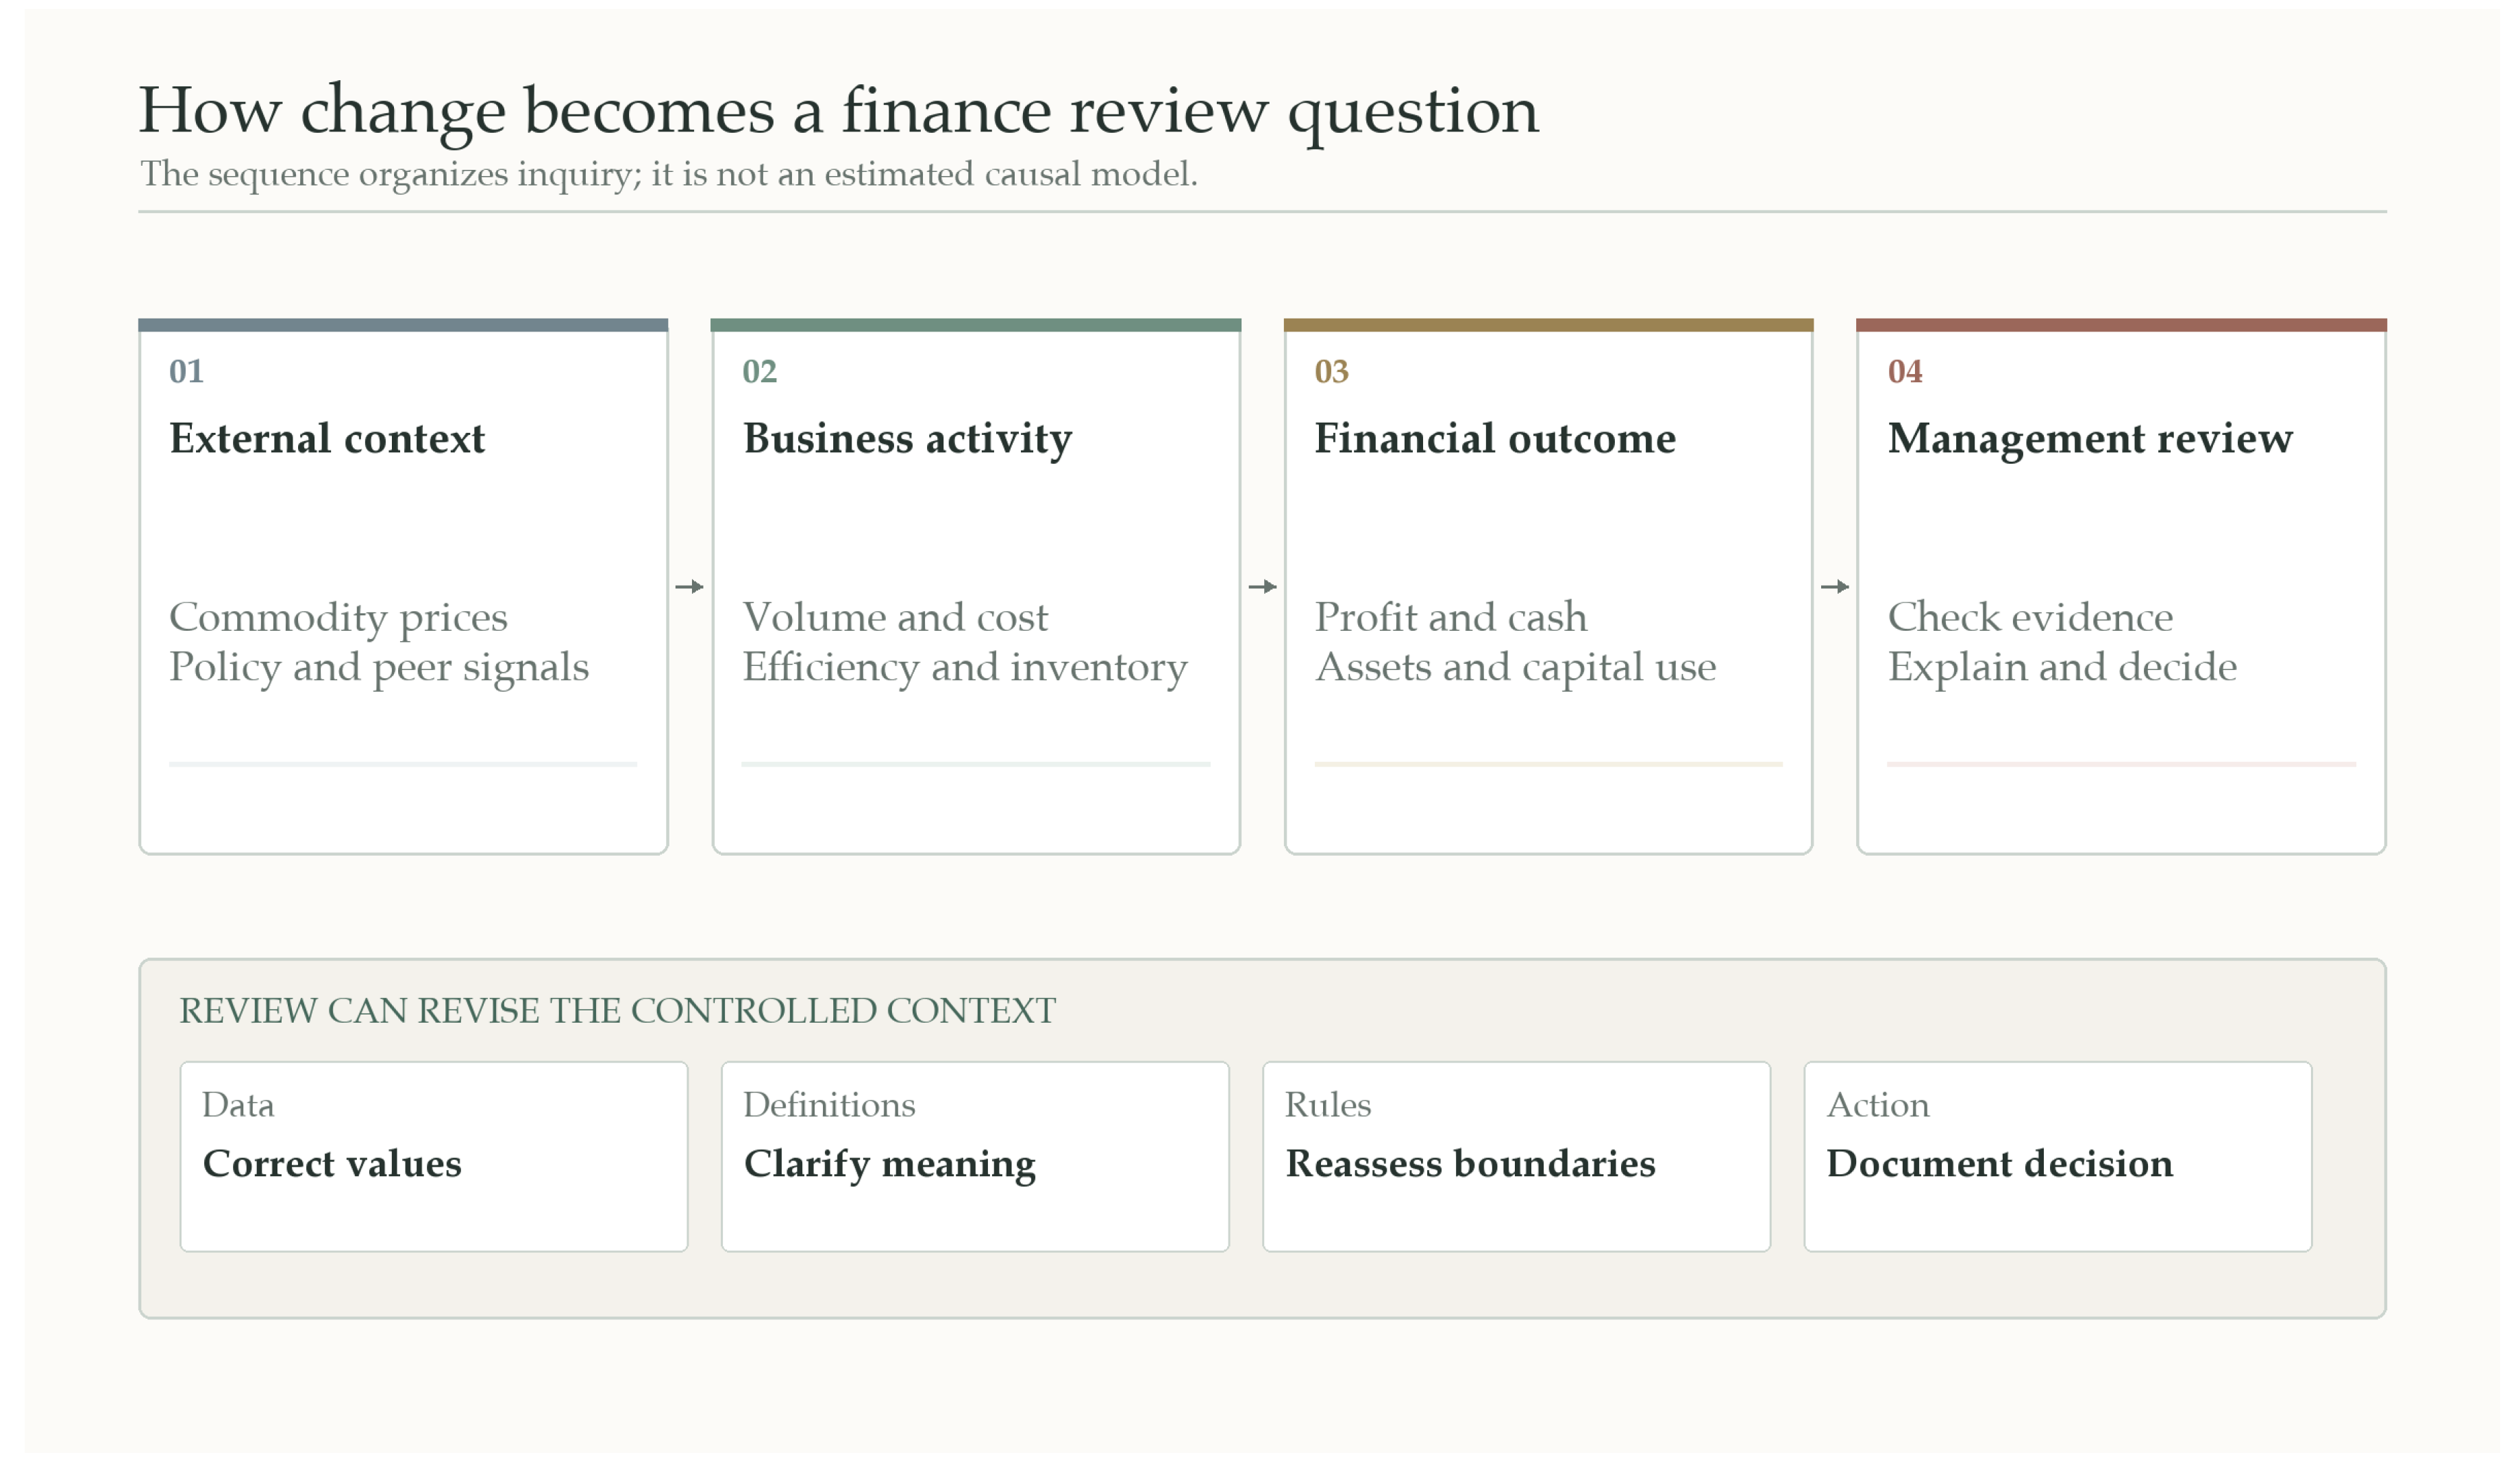
Figure 3.
Analytical schematic of the shared workspace. The redrawn views preserve functional relationships, not the original interface geometry; labels and values are synthetic.
Figure 3.
Analytical schematic of the shared workspace. The redrawn views preserve functional relationships, not the original interface geometry; labels and values are synthetic.
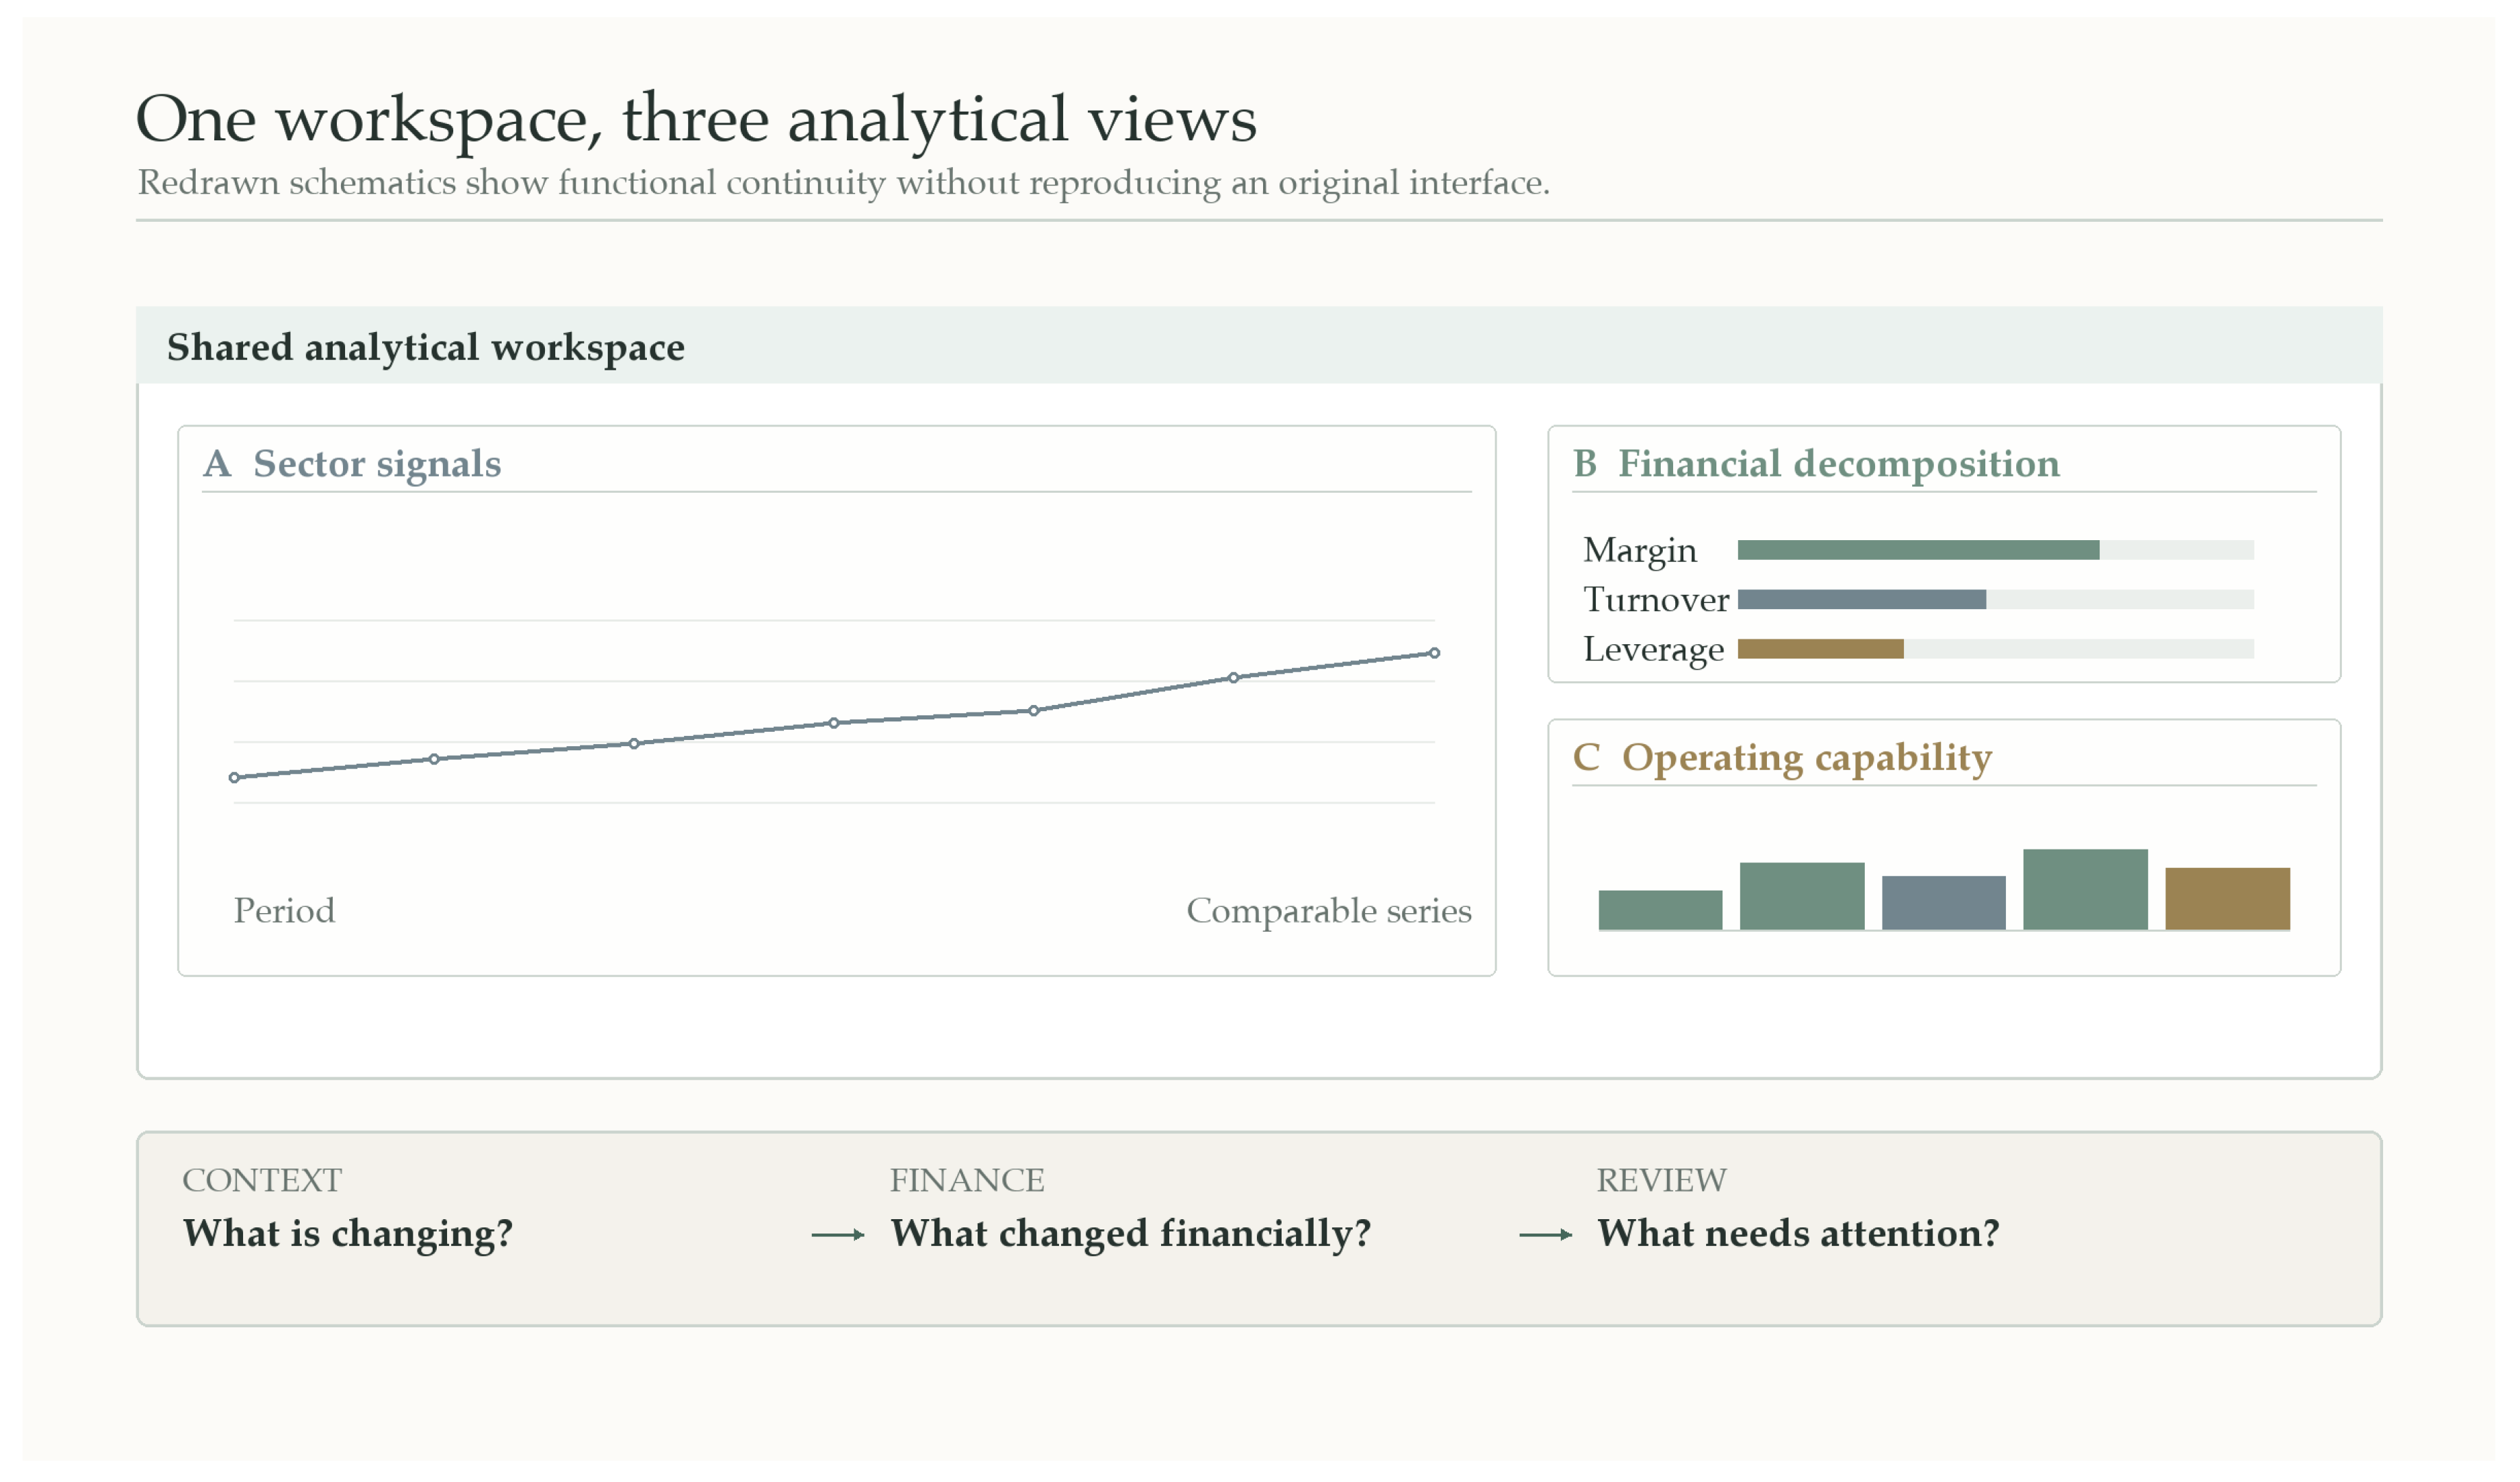
Figure 4.
Three-layer structure of a governed analytical value. The release layer preserves approval, circulation, and validity as separate state dimensions while stable links connect each value, release, and review case.
Figure 4.
Three-layer structure of a governed analytical value. The release layer preserves approval, circulation, and validity as separate state dimensions while stable links connect each value, release, and review case.
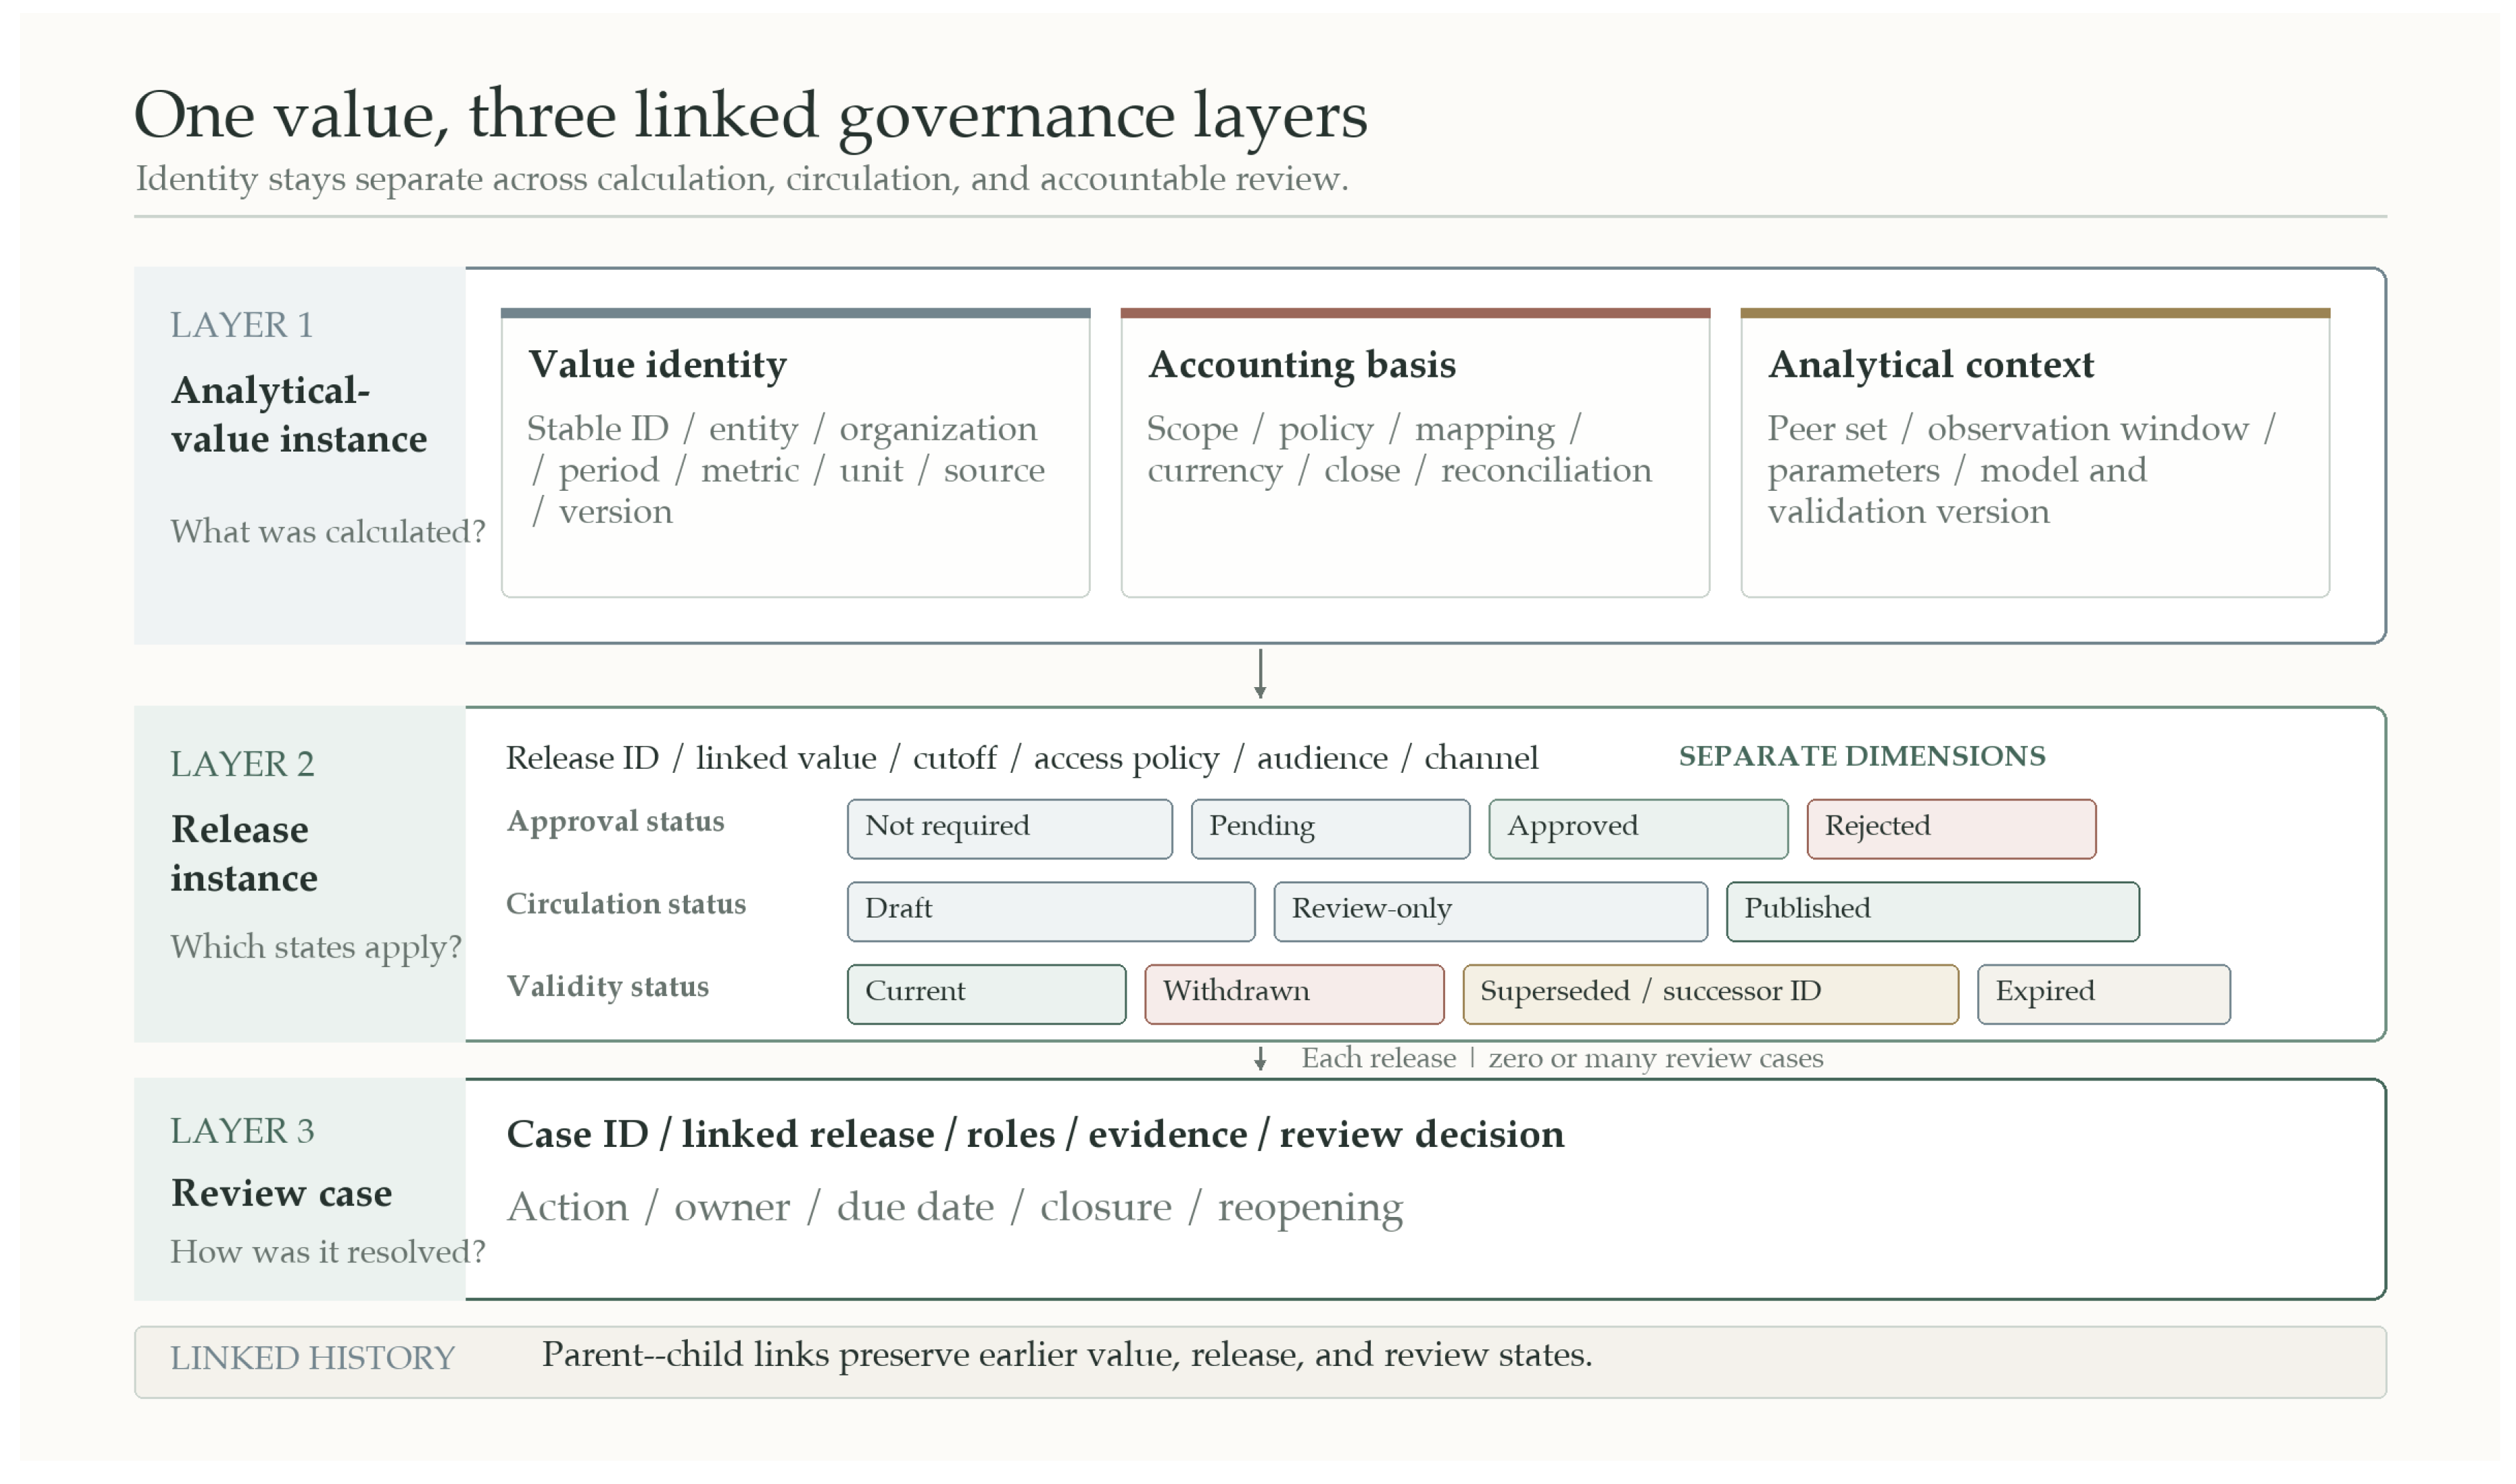
Figure 5.
Analytical schematic linking trend, financial decomposition, and capability explanation. Values are synthetic and illustrate question flow rather than performance.
Figure 5.
Analytical schematic linking trend, financial decomposition, and capability explanation. Values are synthetic and illustrate question flow rather than performance.
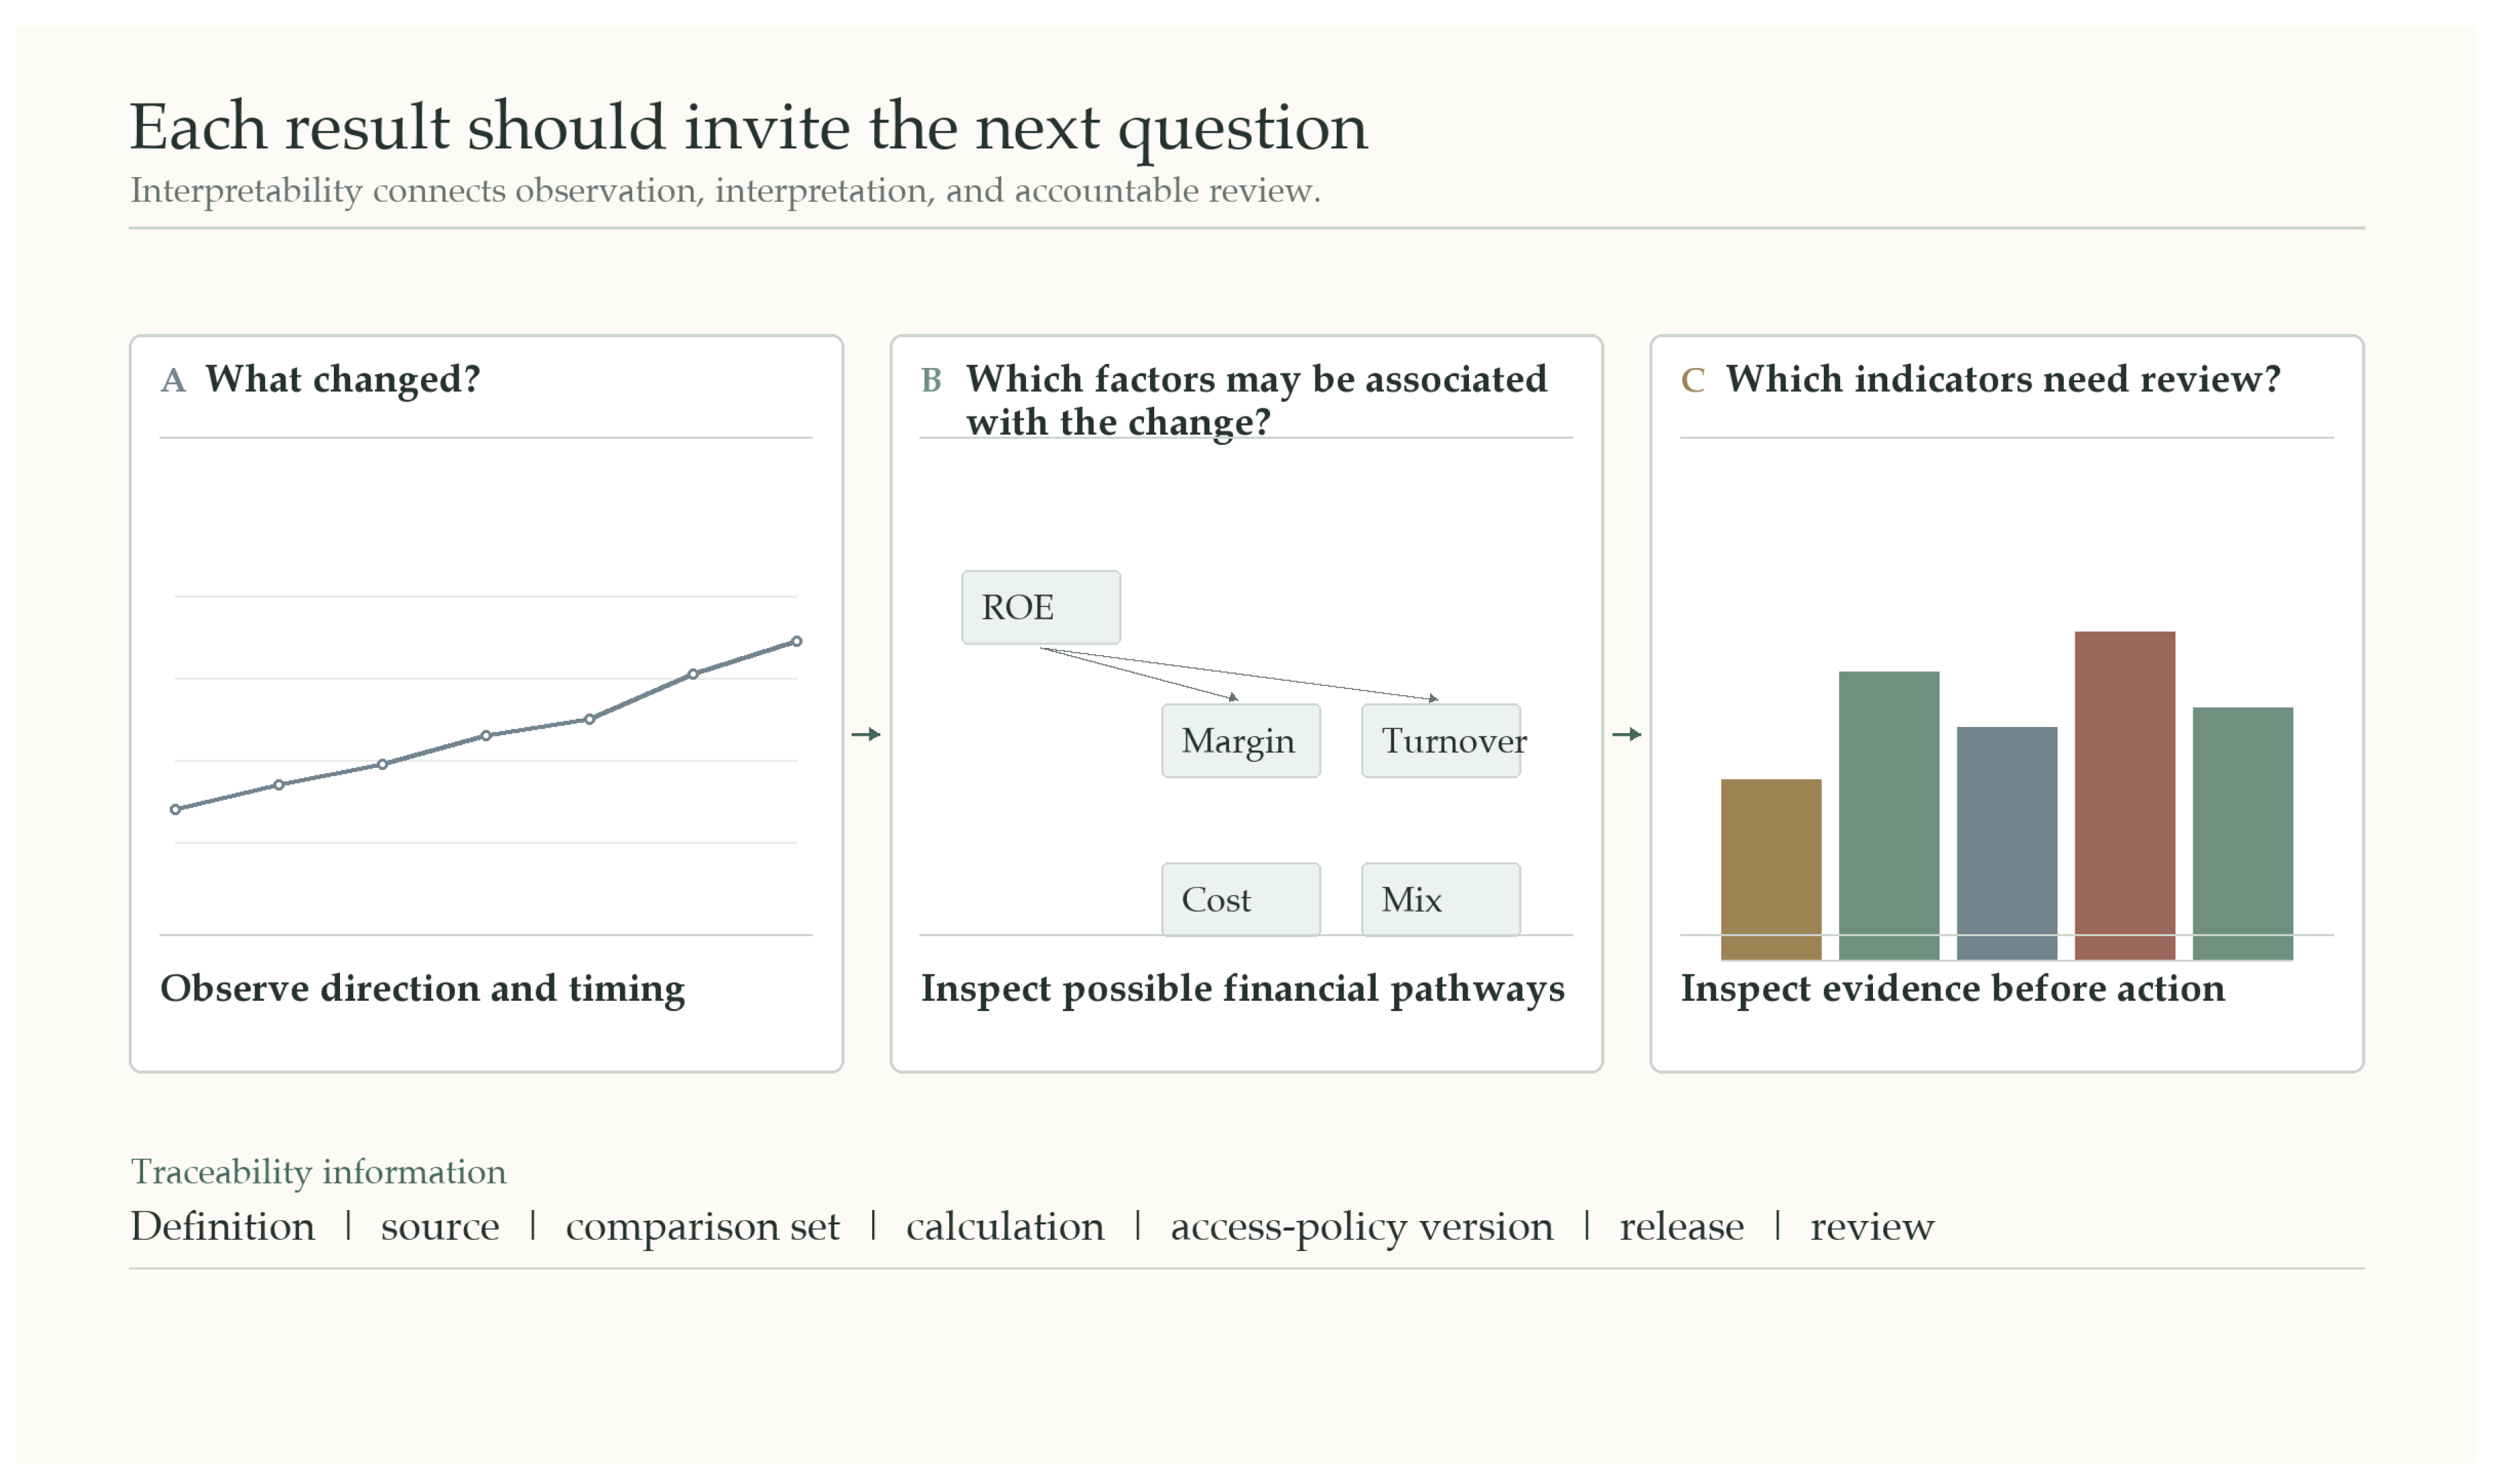
Figure 6.
Analytical schematic of the warning review path. It separates the unvalidated legacy screen, component inspection, indicator rules, and the human-review boundary.
Figure 6.
Analytical schematic of the warning review path. It separates the unvalidated legacy screen, component inspection, indicator rules, and the human-review boundary.
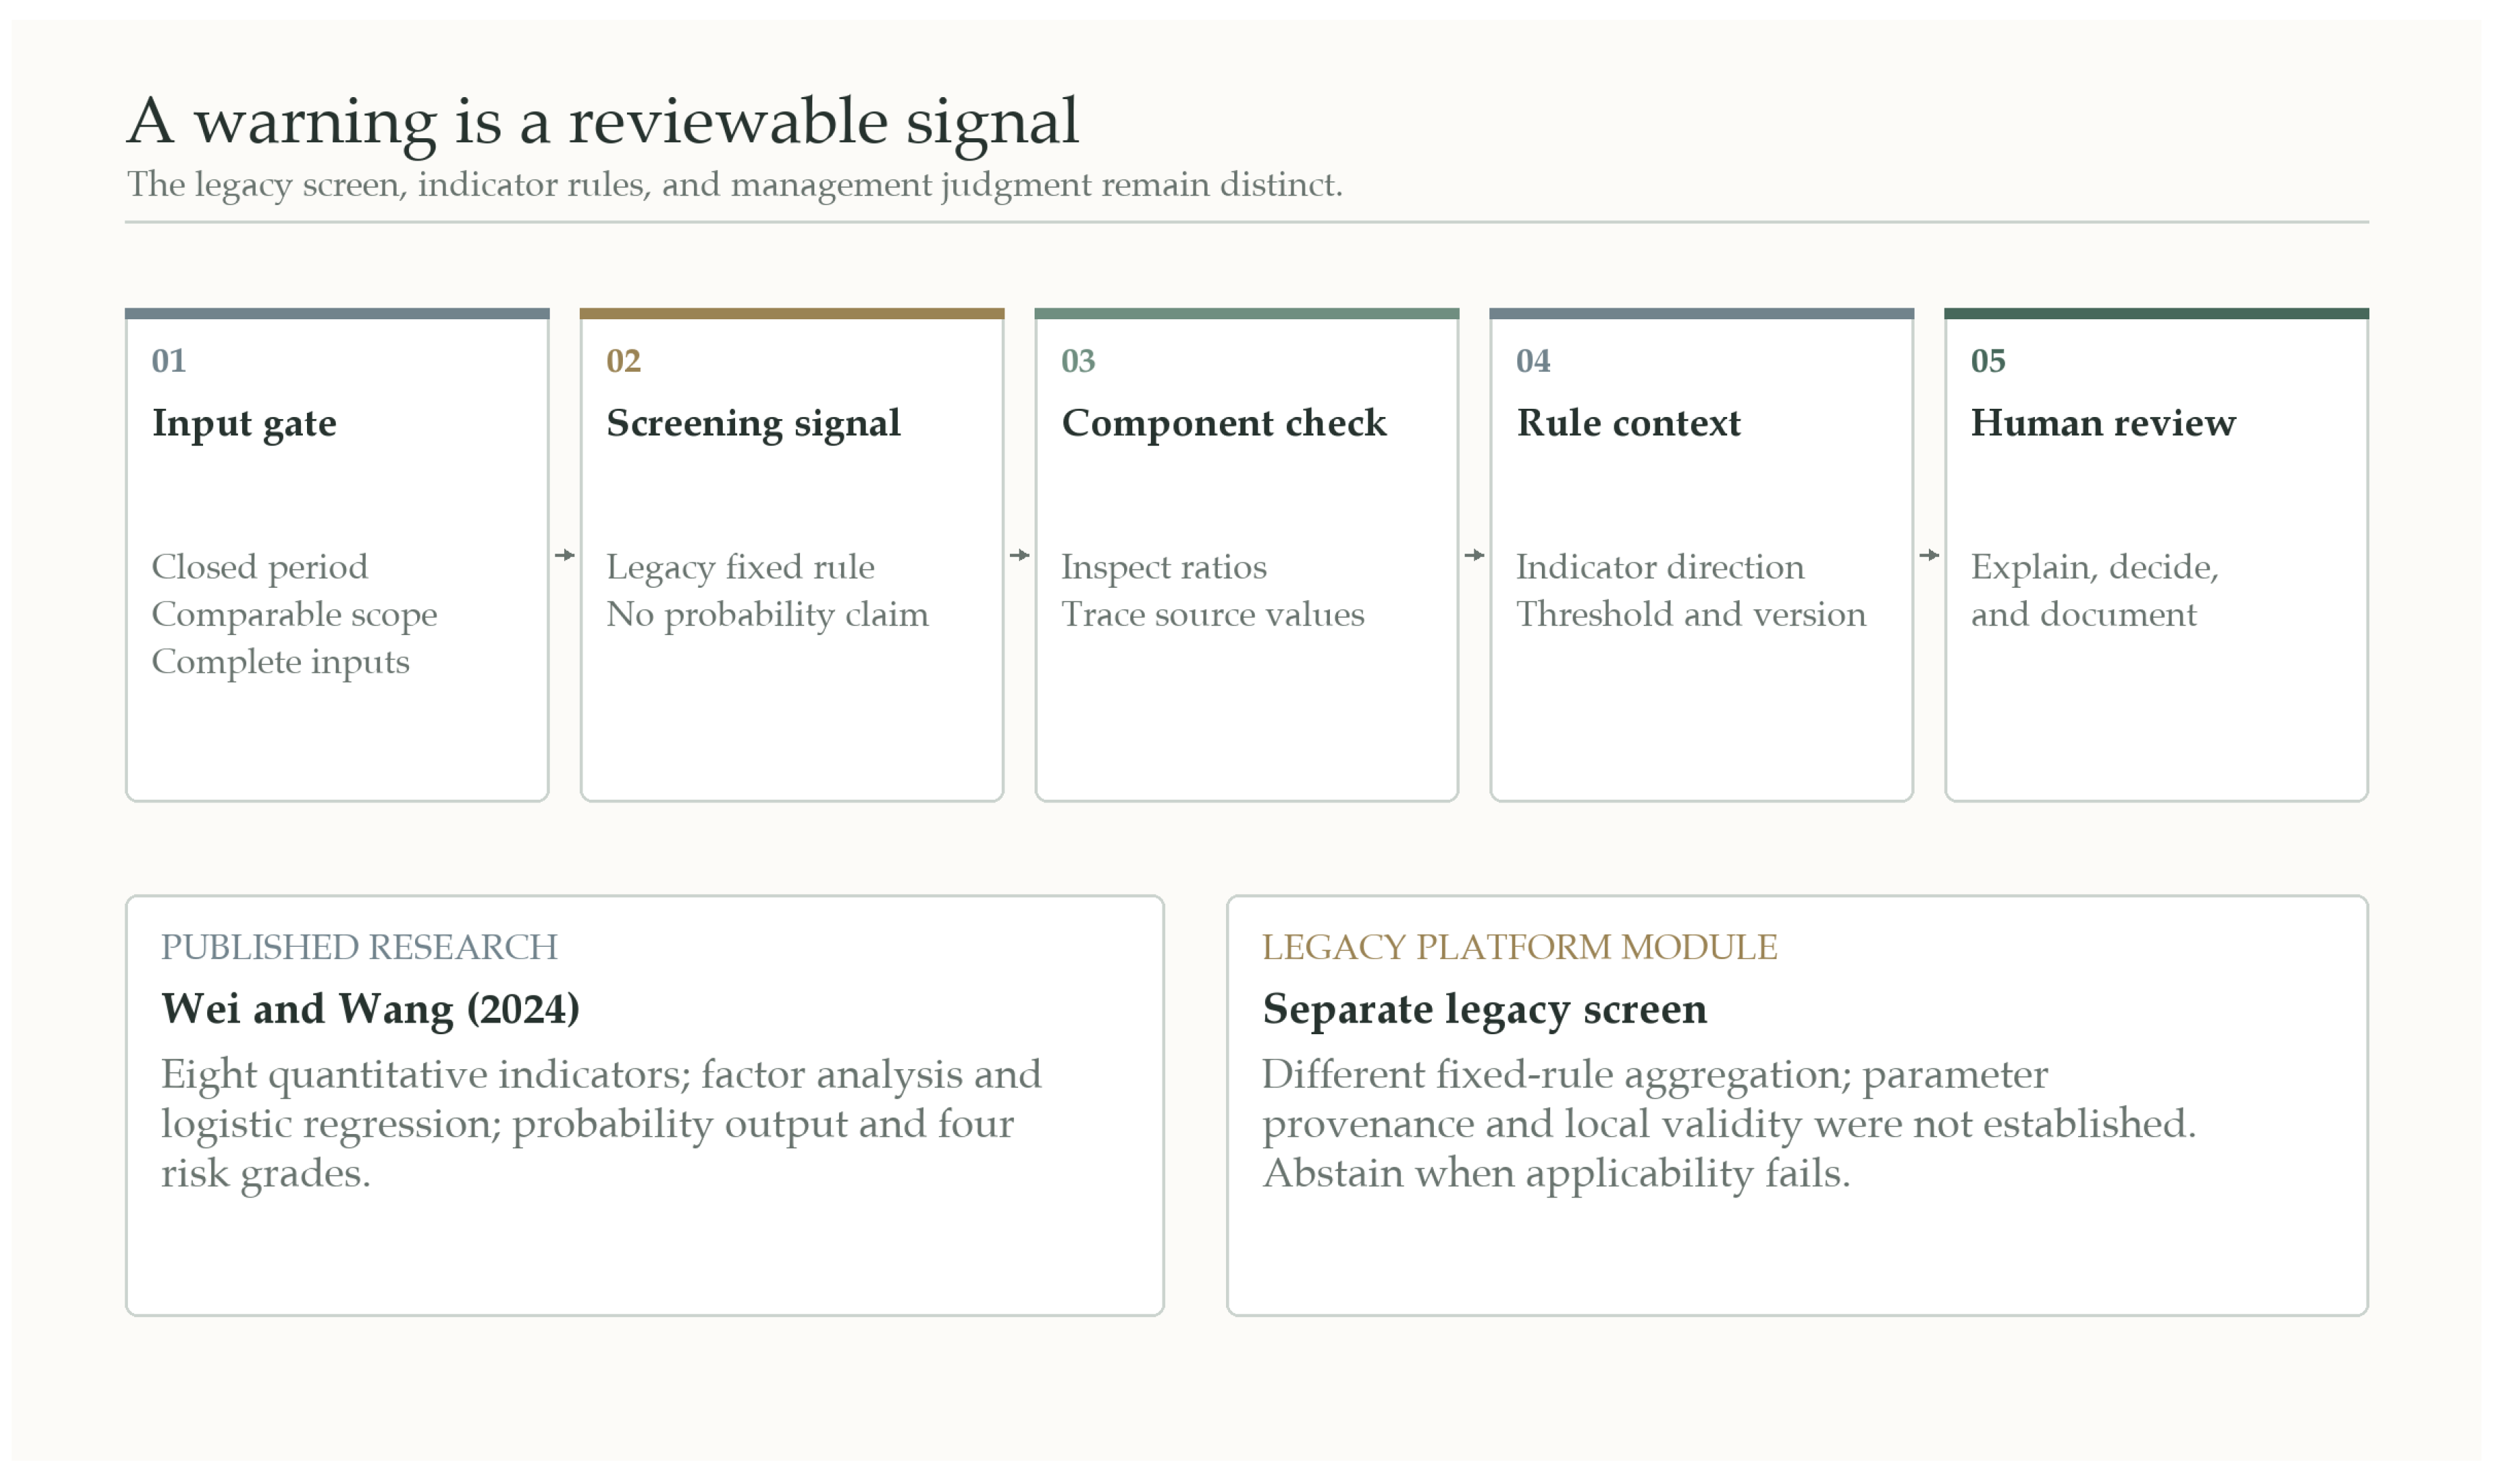
Figure 7.
Five-element review cycle. “Present” means the arrangement could be described, “partial” means only part was present, and “needed” marks a control proposed for a missing link. Productization remains a separate future direction.
Figure 7.
Five-element review cycle. “Present” means the arrangement could be described, “partial” means only part was present, and “needed” marks a control proposed for a missing link. Productization remains a separate future direction.
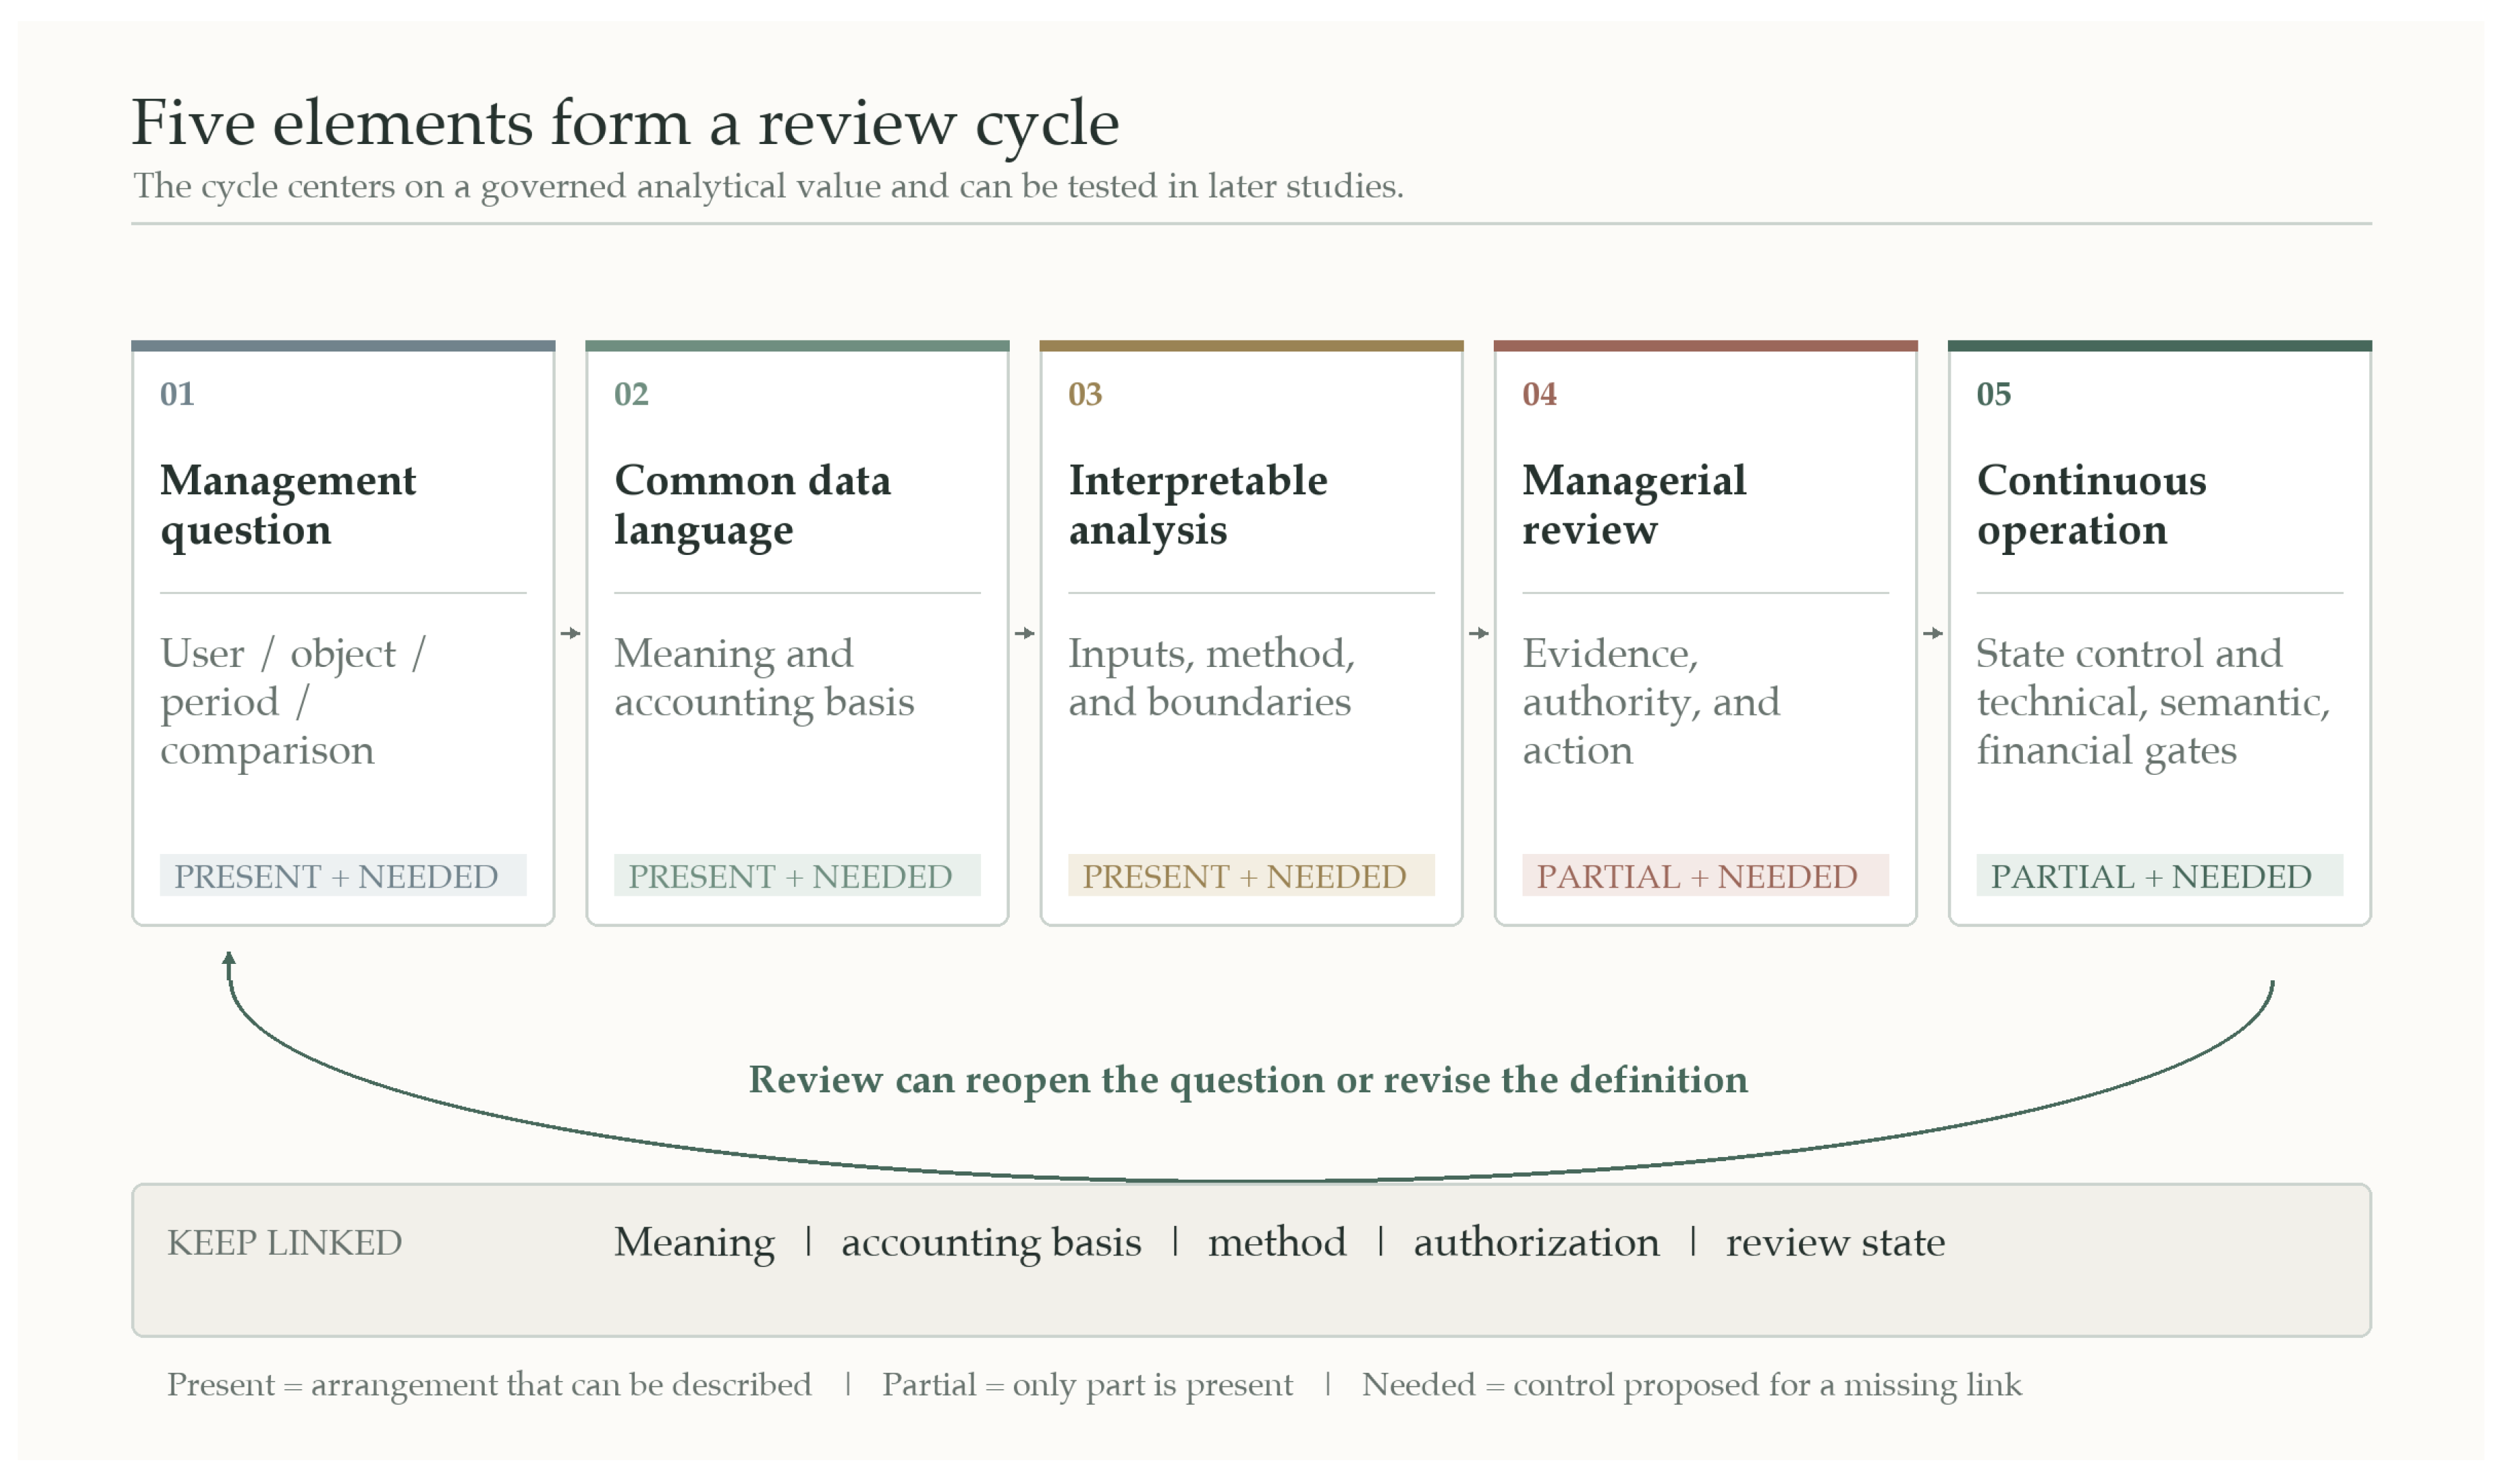
Table 1.
Relationship between the proposed framework and closely related established constructs.
| Adjacent construct | Established emphasis | Contribution and boundary in this article |
|---|---|---|
| Responsible digital agriculture | Production sensing, farm systems, ownership, access, and responsible innovation | Follows selected operating facts into group-finance interpretation; it does not evaluate production technology or sustainability outcomes |
| Data governance and information quality | Decision rights, accountability, definitions, quality, and strategic action at dataset or organizational level [27,28,29] | Specifies the accounting and review states that must remain attached to one released analytical value; it does not propose an enterprise-wide governance standard |
| Data lineage and provenance | Reconstruction of data origin, transformation, responsibility, and demonstrable process history [30,31] | Extends lineage from technical transformation to comparison set, permission, release, review decision, and reopening; it does not claim cryptographic or automated provenance |
| Decision provenance and data products | Accountable reconstruction of decision-related data flows and packaging data for governed reuse [32,33] | Keeps separate records for a calculated value, each circulation of that value, and each resulting review; it does not propose a general data-product architecture |
| Management accounting and BI | Decision practice, shared understanding, analytical use, controller capability, and changing finance work [21,22,23,24] | Connects a displayed result to its accounting basis, method, authority, and closure record; it does not estimate finance-function or performance effects |
| Design science and sociotechnical systems | Problem–artifact alignment, evaluation, and interaction among technology, task, and organization [7,8,34,35,36] | Uses design problems to propose a clear dependency cycle while separating current arrangements from ideas that still need testing |
Table 2.
Analytical scope and excluded inferences.
| Dimension | Question addressed | Inference excluded |
|---|---|---|
| Management question | Who needs the result, for which object and period, compared with what, and for which follow-up action? | Actual adoption or decision quality |
| Data semantics | Which entity, organization, period, metric, unit, source, version, and accounting basis give a value its meaning? | Complete enterprise-wide data governance |
| Analytical method | How are inputs transformed, weighted, compared, decomposed, forecast, or screened? | Accuracy, causal validity, or model effectiveness |
| Interaction and review | How can a user check a result, its components, applicable rule, authority, and review decision? | Completed review, acceptance, or behavioral change |
| Operating lifecycle | How do arrival, validation, calculation, release, refresh, correction, and reopening connect? | Continuous production reliability or service-level performance |
| Product boundary | Which functions could be standardized and which remain organization-specific? | Multi-client scalability or software-as-a-service maturity |
Table 6.
Accounting review of the legacy fixed-rule financial screen.
| Displayed component | Reconstructed relationship | Accounting or applicability boundary |
|---|---|---|
| Liquidity proxy | Working capital divided by average total assets | Not the current ratio; requires comparable current-asset and current-liability definitions |
| Accumulated-earnings proxy | Retained earnings divided by average total assets | Depends on equity and appropriation conventions |
| Earnings-related proxy | Profit before tax plus income-tax expense, divided by average total assets | The numerator is not a standard profit concept and requires separate justification |
| Market-equity-to-liabilities proxy | Market value of equity divided by total liabilities | Not naturally available for an internal or non-listed entity; no validated substitute was identified |
| Turnover proxy | Revenue divided by average total assets | Requires consistent revenue recognition, consolidation scope, and asset timing |
| Operating-cash-flow proxy | Operating cash flow divided by current liabilities | Requires a nonzero denominator and aligned reporting periods |
Table 7.
Three linked layers and field groups of a governed analytical value.
| Layer and field group | Question to answer | Typical error prevented |
|---|---|---|
| Layer 1: analytical-value instance—stable identity and interpretation | ||
| Identity and semantics | Which stable value ID, entity, organization, period, metric, unit, source, and definition version apply? | Confusing similarly named values, periods, units, or reporting levels |
| Accounting basis | Which consolidation conclusion and basis, ownership percentage, effective date of inclusion in or removal from the reporting perimeter, accounting policy, account mapping, currency basis, scenario, and close or restatement state apply? Where relevant, is the relationship control, joint control, significant influence, or another applicable basis? | Comparing values prepared under different recognition, mapping, currency, or group-perimeter rules |
| Reconciliation and adjustment | To which ledger, trial balance, or report version was the value reconciled; which difference, elimination, consolidation adjustment, or manual adjustment remains? | Treating an unreconciled or manually adjusted amount as controlled final evidence |
| Analytical context | Which peer set, observation window, reference boundary, parameter set, model version, and validation context produced the result? | Attributing a changed score to operations when the analytical context changed |
| Layer 2: release instance—controlled circulation of a value | ||
| Release ID and status | Which release ID, linked value ID, cutoff, effective date, and approval status (not required, pending, approved, or rejected) apply? Which circulation status (draft, review-only, or released) and validity status (current, withdrawn, superseded, or expired) apply? Which release time, withdrawal reason, and successor release ID apply when relevant? | Treating controlled review as broad release, inheriting approval after a material change, or circulating stale, provisional, withdrawn, superseded, or expired output as current evidence |
| Access and circulation | Which access-policy version, intended audience, recipient or channel, download or sharing restriction, and expiry apply? | Treating access as a permanent property of the number or losing circulation accountability |
| Layer 3: review case—challenge, action, and closure | ||
| Review ID and roles | Which case ID and release ID apply; who prepared the result, reviewed finance, confirmed business facts, approved an exception, and owns action? | Treating a displayed alert as an accountable decision or obscuring role separation |
| Evidence and review decision | What triggered review, which evidence was considered, and was the result confirmed, challenged, returned for correction, or accepted as an exception? | Recording review as automatic confirmation and losing the basis for challenge |
| Action and lifecycle | What action, owner, due date, escalation, override reason, closure evidence, retention period, and reopening condition apply? | Closing unresolved matters, overwriting history, or losing follow-up accountability |
Table 8.
Synthetic end-to-end example of a governed analytical value in agribusiness.
| Step | Illustrative change | Meaning that must remain attached | Review question |
|---|---|---|---|
| External context | A maize benchmark rises | Market, quotation basis, currency, unit, date, source, and update status | Is the change comparable with the purchasing region and planning window? |
| Procurement | Purchase unit cost changes | Supplier and sourcing scope, delivered quantity, freight, tax treatment, and inventory receipt period | Is the difference a market effect, timing effect, or sourcing change? |
| Production | Feed unit cost changes | Formula, material issue period, yield, loss, plant, and physical-unit conversion | Did input price, recipe, efficiency, or measurement cause the movement? |
| Financial result | Margin, inventory, and cash use change | Revenue and cost-recognition policy, close state, currency, account mapping, and reconciliation status | Has the operating change reached the ledger on a comparable basis? |
| Group adjustment | Internal feed transfers affect segment and consolidation views | Management versus statutory basis, counterparty, scope version, effective date of inclusion in or removal from the reporting perimeter, transfer price, elimination of internal revenue, cost, receivables, payables, and unrealized inventory profit; where applicable, related deferred tax, non-controlling-interest allocation, and elimination-batch or posting version | After internal balances, flows, and unrealized profit are eliminated, what remains at group level and where is it recognized? |
| Management review | Finance and operations assess the released result | Value, release, and review IDs; evidence considered; roles; review decision; action; due date; closure; and reopening condition | Is the result confirmed, challenged, returned for correction, or accepted as an exception, and what action follows? |
Table 9.
Minimum control matrix for a governed analytical value.
| Control object | Roles and controlled actions | Record retained | Status in synthesis |
|---|---|---|---|
| Metric and semantic definition | Finance or data-definition owner creates, approves, changes, and retires definitions | Version, effective date, approver, and reason | Core fields existed; approval history still needed |
| Organization and account mapping | Finance data steward maps, tests, approves, and dates hierarchy or account rules | Mapping version, scope, test, approval, and effective date of the mapping, hierarchy, or account rule | Mapping existed; complete effective dates still needed |
| Close, reconciliation, and adjustment | Accounting owner closes periods, reconciles source totals, approves differences, and controls manual or consolidation adjustments | Close state, control totals, difference, adjustment ID, preparer, reviewer, and posting state | Some states existed; a complete adjustment workflow still needed |
| Model, parameter, or threshold | Method owner prepares while finance approver tests, releases, suspends, rolls back, or expires rules | Version, reference set, validation, approval, release, and rollback point | Configuration existed; release controls still needed |
| Access, release, and circulation | Preparing analyst and access owner apply approved policy; a separate approver authorizes high-risk release | Cutoff, policy version, audience, channel, approval, expiry, and release status | Interaction existed; regular access and circulation review still needed |
| Operational chain and incident | Data or service owner monitors arrival, validation, calculation, release, refresh, rerun, and escalation | Control totals, timestamps, failure, rerun, incident owner, resolution, and recovery state | Update paths existed; monitoring by state still needed |
| Review, exception, and closure | Finance reviewer, business confirmer, exception authority, and action owner challenge, decide, assign, close, or reopen | Evidence, review decision, owner, due date, escalation, override, closure, and reopening | Minimum future control inferred from the review gap |
| Retention and immutable history | Records owner retains value, release, review, and supersession links without overwriting prior states | Stable IDs, parent links, timestamps, retention rule, archive, and deletion state | Some versioning existed; complete lifecycle history still needed |
Table 10.
Relationship between the published model and the legacy platform module.
| Aspect | Wei and Wang (2024) | Legacy platform module |
|---|---|---|
| Research object | Enterprise financial-risk classification in listed-company samples | Management screening within a finance-oriented platform |
| Inputs | Eight quantitative financial indicators and two candidate qualitative variables; the latter were excluded from the final model | Ten accounting and market inputs and lagged assets grouped into six components |
| Method | Standardization, factor analysis, and logistic regression | Fixed-rule component aggregation with unverified parameter provenance |
| Output | Estimated probability and four risk grades | Screening signal, component view, and four legacy interface labels |
| Validation | Model estimated on 320 observations from 2020; a historical holdout of 60 companies from 2019, whose validation year preceded the estimation year, was reported rather than prospective out-of-time validation | No local retraining, calibration, time-separated evaluation, or effectiveness validation was established |
| Appropriate claim | Published research model with study-reported validation | Engineering adoption of indicator organization and tiered communication |
Table 11.
Design propositions derived from the five-element framework.
| Proposition | Statement | Unit, comparison, and primary outcome | Non-supporting result and additional checks |
|---|---|---|---|
| DP1 | Cross-functional integration is expected to be more reviewable under the complete DP1 configuration. | All review items in one sampling frame; compare complete and otherwise-matched incomplete configurations. Primary outcome: time to detect a material error confirmed by an independent assessor under a pre-specified materiality rule. | No improvement in the primary outcome fails to support DP1. Additional checks: false-positive escalation, invalid escalation, and unresolved disagreement between assessors. |
| DP2 | Analytical outputs are expected to be more accountable under the complete DP2 configuration. | Every release meeting a pre-specified review trigger; compare matched releases by materiality or severity. Primary outcome: proportion with an evidence-supported review decision that can be independently reproduced from the governed record. | No improvement fails to support DP2. Additional checks: missing accountable role, overdue action, unresolved-case age, and reopening after closure. |
| DP3 | Financial digital intelligence is expected to be more operationally controlled under the complete DP3 configuration. | Every release affected by a validity trigger; compare matched pipelines or pre-specified windows. Primary outcome: time until the release is no longer presented as current to its original audience. | No improvement fails to support DP3. Additional checks: downstream inconsistency, incomplete recalculation, and recovery time; withdrawal itself is not failure. |
Disclaimer/Publisher’s Note: The statements, opinions and data contained in all publications are solely those of the individual author(s) and contributor(s) and not of MDPI and/or the editor(s). MDPI and/or the editor(s) disclaim responsibility for any injury to people or property resulting from any ideas, methods, instructions or products referred to in the content. |
© 2026 by the authors. Licensee MDPI, Basel, Switzerland. This article is an open access article distributed under the terms and conditions of the Creative Commons Attribution (CC BY) license (http://creativecommons.org/licenses/by/4.0/).
Copyright: This open access article is published under a Creative Commons CC BY 4.0 license, which permit the free download, distribution, and reuse, provided that the author and preprint are cited in any reuse.