

Submitted:
15 August 2026
Posted:
18 August 2026
You are already at the latest version
Abstract
Reliable structural monitoring for smart buildings and construction sites requires more than sensor acquisition; it requires sensing and communication paths that remain traceable, recoverable, and compatible with platform-side data processing under heterogeneous field constraints. This study presents a dual-path IoT sensing and communication framework that deliberately separates high-data-rate vibration monitoring from low-data-rate inclination-status monitoring while maintaining common requirements for timestamp integrity, data-source identification, and backend interpretability. The smart-building path integrates an ADXL355 triaxial accelerometer, ESP32-S3, Power over Ethernet (PoE), and Message Queuing Telemetry Transport (MQTT) for 200 Hz vibration acquisition, together with a second-order 10 Hz low-pass filter, 40-record batching, and a Flash LittleFS-based store-and-recovery mechanism that interleaves live and replayed records after reconnection. The construction-site path combines an SCL3300-D01 inclinometer with LoRaWAN, baseline-referenced relative-angle estimation, and a hysteresis state machine with distinct alarm and recovery thresholds. In a 24-hour validation, four vibration nodes delivered all 69,120,000 expected records, and four forced-outage trials recovered all offline records while live transmission continued. Frequency-domain analysis confirmed attenuation of high-frequency components while retaining the dominant low-frequency response. The inclination path demonstrated quantifiable angle accuracy, correct alarm/recovery transitions, continuous LoRaWAN frame delivery over the observed interval, and correct backend decoding. The results show that path-specific communication design, combined with a common traceability concept, can provide an interruption-resilient front-end data foundation for smart-building, construction-site, and future digital-twin-oriented monitoring applications.
Keywords:
Internet of Things
; building vibration monitoring
; construction-site inclination monitoring
; ADXL355 accelerometer
; SCL3300-D01 inclinometer
; MQTT
; LoRaWAN
; disconnection recovery
; digital twin
1. Introduction
Civil structures and temporary construction facilities are continuously exposed to dynamic and quasi-static disturbances arising from traffic, machinery, wind, earthquakes, thermal effects, foundation movement, and construction operations. Conventional visual inspection remains essential for identifying observable defects such as cracking, seepage, surface deterioration, and gross deformation, but it is inherently intermittent and strongly affected by accessibility, viewing conditions, environmental constraints, and inspector experience. Consequently, inspection alone cannot capture the time-resolved structural response associated with transient or progressive events. Structural health monitoring (SHM) addresses this limitation by converting physical responses into persistent digital records through sensing, data acquisition, and subsequent analysis, thereby enabling temporal comparison and engineering assessment [1,2].
The emergence of smart buildings, connected construction sites, and digital-twin-oriented engineering systems has shifted the monitoring requirement from isolated sensor measurements toward continuous and platform-consumable data streams. In such systems, the value of a measurement depends not only on its physical accuracy but also on whether its origin, measurement time, processing history, transmission state, and decoded meaning can be preserved across the end-to-end data path. Sensors, edge controllers, communication protocols, timestamping, payload definitions, disconnection handling, and backend parsing therefore constitute a critical front-end sensing and communication layer. Weaknesses at this layer propagate directly to higher-level functions such as dashboards, BIM/GIS mapping, state synchronization, alarm management, and maintenance decision support. A reliable and traceable data path is thus a prerequisite for, rather than a by-product of, future digital-twin integration.
A central systems challenge is that structural-monitoring scenarios are heterogeneous. Building vibration monitoring produces relatively high-rate time-series data and must preserve short-duration dynamic responses, whereas construction-site inclination monitoring is dominated by lower-rate state variation, threshold-based event reporting, and wireless deployment constraints related to cabling, power availability, and communication distance. MEMS sensors and IoT communication technologies make distributed deployment increasingly practical, but low-cost acquisition alone does not guarantee usable engineering data. The usefulness of the resulting records depends on timestamp integrity, packet delivery, offline preservation, payload consistency, frame continuity, and explicit experimental verification [3,4,5].
This study addresses this heterogeneity through a dual-path IoT sensing and communication framework for two representative scenarios: smart-building vibration monitoring and construction-site inclination monitoring. Rather than imposing a single communication architecture on fundamentally different data characteristics, the framework assigns each scenario a path matched to its temporal resolution, connectivity, and deployment constraints, while retaining common principles for traceability and backend interpretation. The objective is to transform heterogeneous physical measurements into verifiable, platform-readable data sources that can subsequently support visualization, abnormal-condition tracking, and decision-support functions.
The first path, implemented as the Smart Building Structural Health Monitoring System, combines an ADXL355 triaxial MEMS accelerometer with an ESP32-S3 edge controller, PoE/Ethernet connectivity, and MQTT to acquire triaxial acceleration at 200 . The node couples sensor-side high-pass filtering with an MCU-side 10 Hz second-order Butterworth low-pass filter and packages 40 samples into each MQTT message. To address a failure mode that is particularly consequential for continuous waveform monitoring, the node also implements a Flash LittleFS-based offline-preservation mechanism. When communication is restored, live records and Flash-resident recovery records are transmitted in an interleaved manner, so historical data can be recovered without suspending current acquisition and transmission.
The second path, implemented as the Construction-Site Inclination Monitoring System, combines an SCL3300-D01 triaxial MEMS inclinometer, ESP32, SX1276-based LoRa communication, a LoRaWAN gateway, and backend reception/decoding. In addition to inclination, the payload reports temperature, battery status, and alarm state. A startup baseline is established and subsequent measurements are expressed as relative changes with respect to that reference. A rule-based hysteresis mechanism uses separate alarm and recovery thresholds together with consecutive-sample criteria to convert continuous inclination measurements into stable NORMAL/ALARM state records. This design emphasizes low-data-rate wireless status delivery and deterministic backend interpretation rather than high-rate waveform transport.
Figure 1 summarizes the two engineering contexts and highlights the separation of their sensing and communication paths.
The evaluation is organized around end-to-end data usability rather than sensor output alone. Four capabilities are examined. First, the ADXL355 path is tested for long-duration sampling completeness under the implemented filtering and 40-sample MQTT batching scheme. Second, the Flash LittleFS mechanism and live/flash interleaving strategy are tested under forced communication interruptions to determine whether offline records can be preserved and subsequently replayed without abandoning live transmission. Third, the SCL3300-D01 path is evaluated for baseline-referenced relative-angle measurement and deterministic NORMAL/ALARM switching under the configured hysteresis rules. Fourth, LoRaWAN frame-counter continuity and 30-byte payload decoding are verified to determine whether transmitted field records remain traceable and correctly reconstructable at the backend.
The resulting architecture is intentionally positioned as a front-end sensing and communication foundation rather than as a complete digital twin. Its role is to establish the trustworthy physical-to-digital entry point required by higher-level platform functions. By preserving vibration records, inclination states, measurement-time information, communication-source markers, and backend-decodable payloads, the framework provides data objects that can later be mapped to BIM/GIS assets, synchronized with virtual representations, visualized on dashboards, and consumed by alarm or maintenance modules. Future platform-level work can therefore focus on power and coverage optimization, large-scale deployment, state freshness, cross-scenario schema consistency, BIM/GIS mapping, finite-element-model updating, and decision-support performance without first having to resolve basic sensing-data continuity and traceability.
The technical contribution is threefold. First, the study introduces a path-specific architecture that separates PoE/Ethernet/MQTT vibration transport from LoRaWAN inclination-status transport according to data rate and field constraints, while retaining a common traceability objective. The novelty therefore lies in coordinating heterogeneous sensing paths at the data-layer level rather than forcing both scenarios into a one-size-fits-all network. Second, the ADXL355 path integrates edge filtering, 40-record MQTT batching, remote control, Flash LittleFS-based disconnection preservation, and live/flash interleaved replay; this combination is validated through long-duration sampling, frequency-domain examination, and repeated forced-outage tests. Third, the SCL3300-D01 path integrates startup baseline estimation, relative-angle computation, hysteresis-based alarm/recovery logic, a fixed 30-byte LoRaWAN payload, frame-counter tracking, and backend decoding; its operation is validated through angle, state-transition, packet-continuity, and codec tests.
Collectively, these experiments evaluate the framework through directly observable and parsable records rather than through conceptual architecture alone. The results characterize data acquisition, edge processing, transmission continuity, outage recovery, state reporting, and decoding across both paths. This evidence supports the proposed positioning: an experimentally validated sensing and communication framework that provides a practical data-layer foundation for smart-building monitoring, construction-site structural monitoring, and subsequent digital-twin-oriented integration.
2. Related Work and Functional Positioning
Existing commercial monitoring systems commonly emphasize integrated platform delivery, field installation, and long-term operation, whereas academic studies frequently concentrate on a particular sensing modality, communication technology, diagnostic method, or upper-layer digital-twin function [6,7,8,9]. These perspectives are individually important, but a dual-scenario deployment introduces a different integration problem: high-rate building vibration data and low-rate construction-site inclination states have different requirements for bandwidth, power, storage, outage handling, and transport semantics. The present work therefore focuses on the architectural boundary at which heterogeneous field measurements are converted into reliable and platform-readable records.
Vibration-based SHM extracts information from structural responses in the time, frequency, or modal domains [3]. Common time-domain descriptors include peak amplitude, root mean square (RMS), peak factor, and event duration, whereas FFT-based analyses reveal dominant frequencies, spectral-energy distributions, and changes in frequency content. Wireless sensing has also been extensively investigated because it can reduce installation cost and improve deployment flexibility. Nevertheless, packet loss, power management, time synchronization, and communication reliability remain recurring implementation concerns, particularly when sensing data must be retained as an auditable engineering record [5,10,11].
At the sensing-node level, MEMS devices have been studied as practical alternatives for structural and engineering monitoring. Di Nuzzo et al. evaluated MEMS monitoring nodes against reference instrumentation and modal measurements [4], while Murray-Bergquist et al. investigated calibration, noise, spectral characteristics, and temperature effects in six-degree-of-freedom sensors [12]. For inclination monitoring, Green and Jaspan analyzed historical inclinometer sequences for anomaly detection and prediction [13]. Together, these studies indicate that the engineering utility of a sensing node depends on the complete acquisition chain—sampling, calibration, processing, communication, parsing, and validation—rather than on the sensing element in isolation.
Digital-twin-oriented monitoring extends this requirement further because field observations must be associated with physical assets, virtual representations, visualization interfaces, and decision-support processes. Prior work has addressed physical-to-digital information flow, semantic relationships among assets, and purpose-oriented digital-twin models [14,15,16,17,18,19,20]. The present study does not claim to implement these upper-layer functions. Instead, it targets the prerequisite sensing and communication layer that supplies traceable, interpretable, and verifiable records to such platforms.
Accordingly, Figure 2 positions this work between field sensing nodes and higher-level monitoring/digital-twin applications. The specific emphasis is on path-specific node implementation, communication design, preservation and replay of data during disconnection, packet-level traceability, backend decoding, and experimental verification. This positioning distinguishes the proposed framework from both sensor-only studies and complete application platforms.
3. Materials and Methods
3.1. Design Principles
The dual-path design follows a requirements-driven principle. The building-vibration path uses the ADXL355 triaxial MEMS accelerometer, ESP32-S3, PoE/Ethernet, and MQTT to acquire and transport triaxial records at 200 . It targets dynamic vibration and earthquake-response monitoring, for which measurement-time stability, sustained throughput, continuous acquisition, and preservation of data during network interruption are primary requirements. In contrast, the construction-site inclination path uses the SCL3300-D01 triaxial MEMS inclinometer, ESP32, SX1276, SenseCAP M2 gateway, LoRaWAN, ChirpStack, and backend codec processing. Its design prioritizes installation flexibility, low-volume wireless uplink, packet traceability, and robust state reporting rather than continuous waveform transmission.
Although the physical quantities and communication technologies differ, both paths follow a common data-governance model. Each record retains source identity and measurement-time information so that an observation can be traced to the originating node and the time at which the physical state was measured. The backend explicitly distinguishes live MQTT data, Flash-replayed vibration data, and LoRaWAN uplinks so that reception time is not conflated with measurement time and recovered records are not mistaken for newly sampled records. In addition, firmware behavior, payload definitions, and backend decoders are treated as a coupled interface whose consistency is necessary for reproducible validation. These common rules provide semantic continuity across otherwise heterogeneous communication paths and form the basis for later platform integration.
3.2. Overall Architecture
The overall implementation consists of two independent but conceptually coordinated monitoring systems. In the smart-building path, the physical monitoring point is connected through an ESP32-S3 controller and PoE/Ethernet to an MQTT broker and backend database [21]; this path is optimized for sustained transport and storage of high-rate vibration records. In the construction-site path, an ESP32 and SX1276 transceiver send inclination measurements through a SenseCAP M2 LoRaWAN gateway to ChirpStack, after which a payload codec and MQTT worker reconstruct and forward the application-level data. This path is optimized for low-rate status, alarm, and packet information.
The backend preserves the distinction between the two data sources and parses each according to its corresponding transport and payload definition. After decoding and storage, the vibration and inclination records can be delivered independently to their visualization or application interfaces. This separation prevents transport-specific assumptions from leaking across scenarios while still allowing both streams to participate in a common platform-level monitoring workflow.
3.3. Functional Division of the Two Paths

Table 1.
Functional division of the two sensing and communication paths
| Item | ADXL355 accelerometer vibration path | SCL3300-D01 inclinometer path |
|---|---|---|
| Application scenario | Building vibration monitoring | Construction-site inclination monitoring |
| Main physical quantity | Triaxial dynamic acceleration | Triaxial inclination angle |
| Target time scale | Milliseconds to seconds | Seconds to hours |
| Sampling/update | 200 Hz | Test version updates approximately every 600 ms |
| Edge processing | two-stage filtering and MQTT batches containing 40 samples | Baseline, delta values, hysteresis, and consecutive samples |
| Communication method | PoE/Ethernet/MQTT | LoRaWAN AS923 |
| Offline strategy | Flash LittleFS-based disconnection recovery and live/flash interleaved recovery | RTC state and LoRaWAN session preservation |
| Main validation | 24-hour completeness and disconnection recovery | Angle, alarm, PDR, and codec |
3.4. ADXL355 Accelerometer Node
The smart-building node comprises an ADXL355 three-axis MEMS accelerometer, an ESP32-S3 controller, a W5500 Ethernet controller, and a PoE power module. The ESP32-S3 provides dual-core processing capability, enabling sensing and network workloads to be separated so that communication activity does not unnecessarily interfere with periodic acquisition [22]. The W5500 integrates the TCP/IP stack, Ethernet MAC, and PHY required for deterministic wired connectivity to the backend network [23].
During initialization, the firmware establishes communication with the ADXL355 and configures the measurement parameters before acquisition begins. The accelerometer range is set to , and the 20-bit two’s-complement output is converted using 256000 LSB/g. At the sensor level, the built-in first-order high-pass filter is enabled, the output data rate is configured to 250 Hz, and the low-pass setting is 62.5 Hz. After these settings are applied, the device enters measurement mode and supplies the input stream for the MCU-side processing chain [24].
The ESP32-S3 reads the three acceleration axes every 5 ms, producing the target node-level sampling rate of 200 Hz. Each axis is then processed independently by an MCU-side second-order Butterworth low-pass filter with a 10 Hz cutoff. This stage is intended to retain the low-frequency structural response of interest while suppressing higher-frequency components before transmission. The implemented difference equation is
The filter uses a cutoff frequency of 10 Hz and a quality factor of . Its coefficients are generated at firmware startup through a bilinear-transform formulation using the actual sampling rate. For the coefficients implemented in this study, the theoretical amplitude attenuation at 60 Hz is approximately -37.56 dB, providing an analytical reference for the frequency-domain check reported in Section 4.
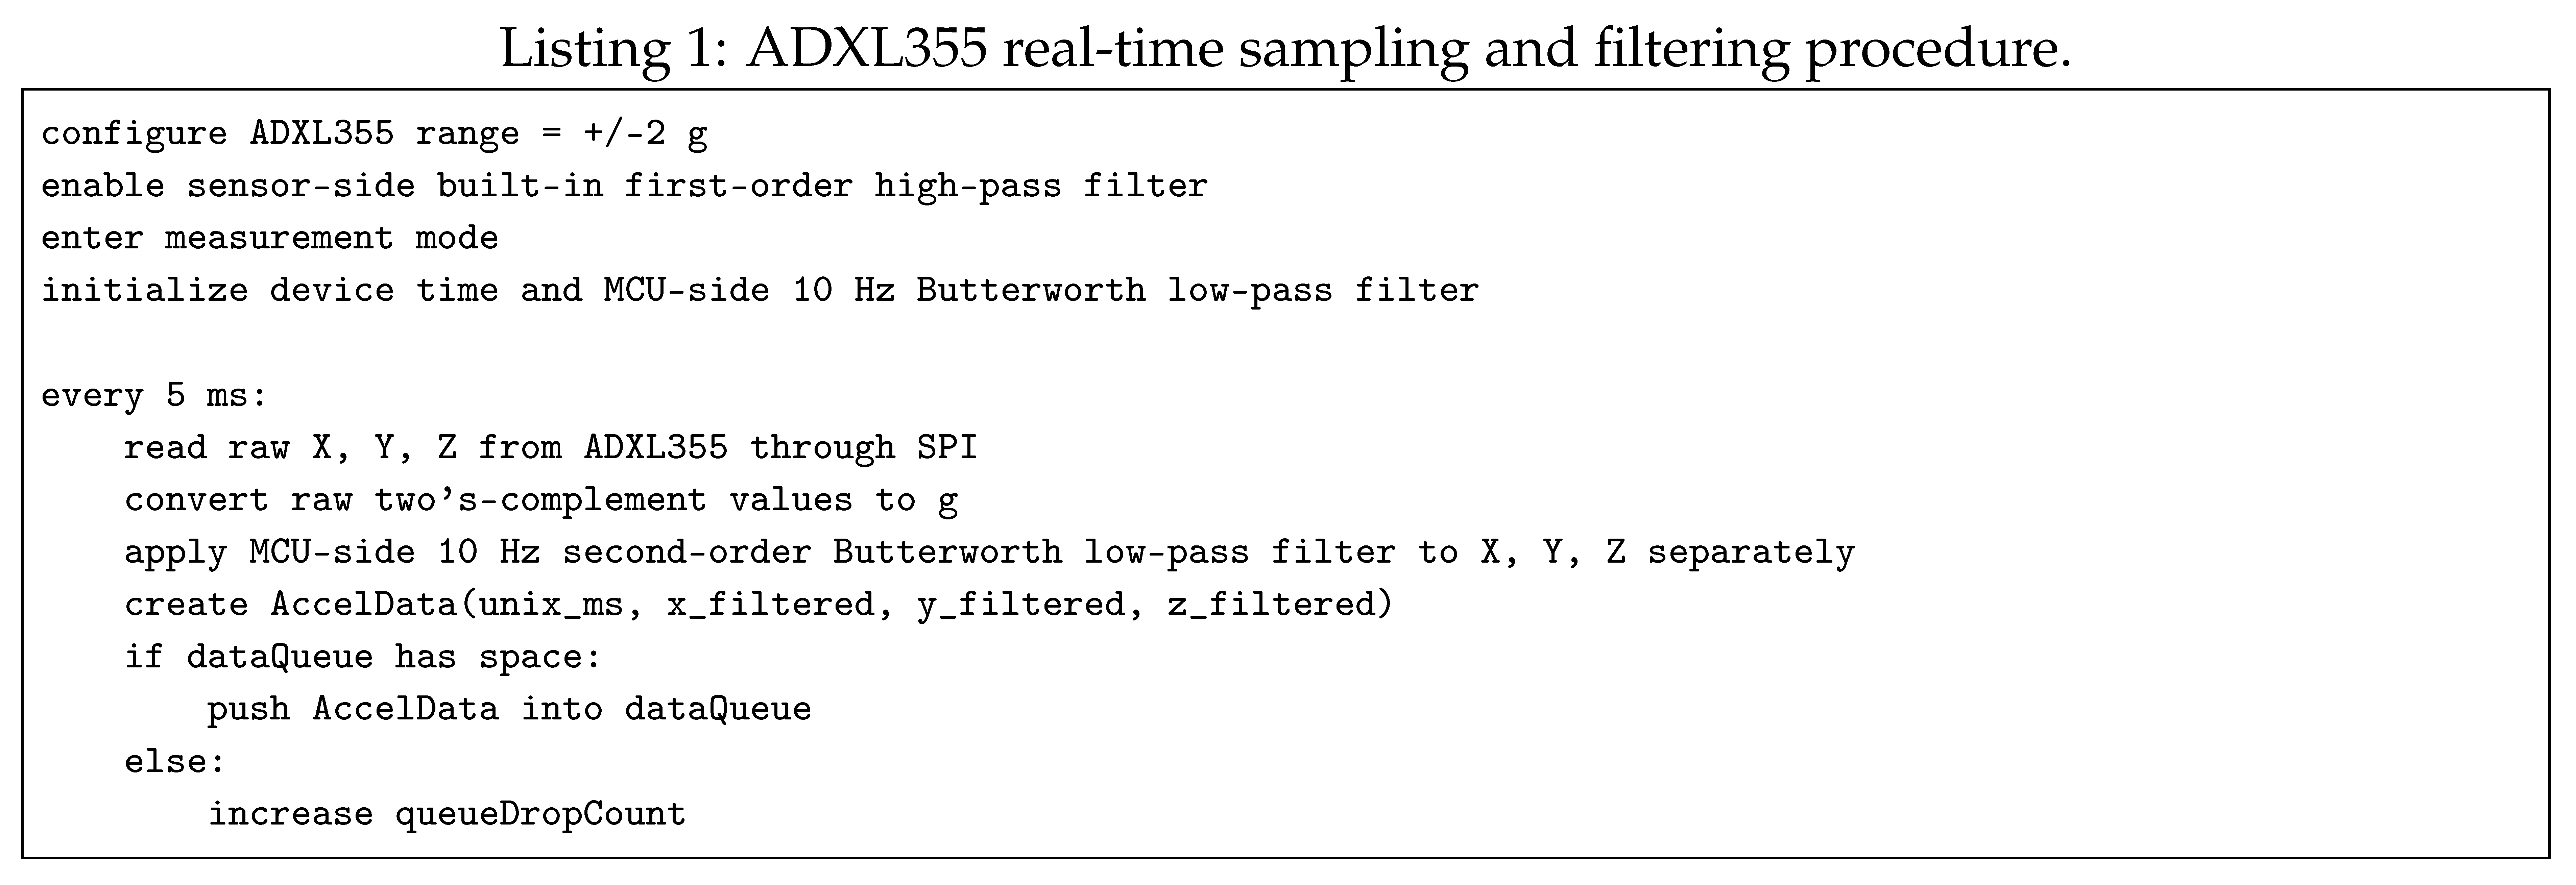
For network transmission, 40 consecutive samples are aggregated into one MQTT publication. At 200 Hz, a batch represents approximately 0.2 s of vibration data. This batching strategy reduces publication frequency and backend message-handling overhead relative to record-by-record transmission while preserving an explicit sequence of time-stamped measurements inside each batch.
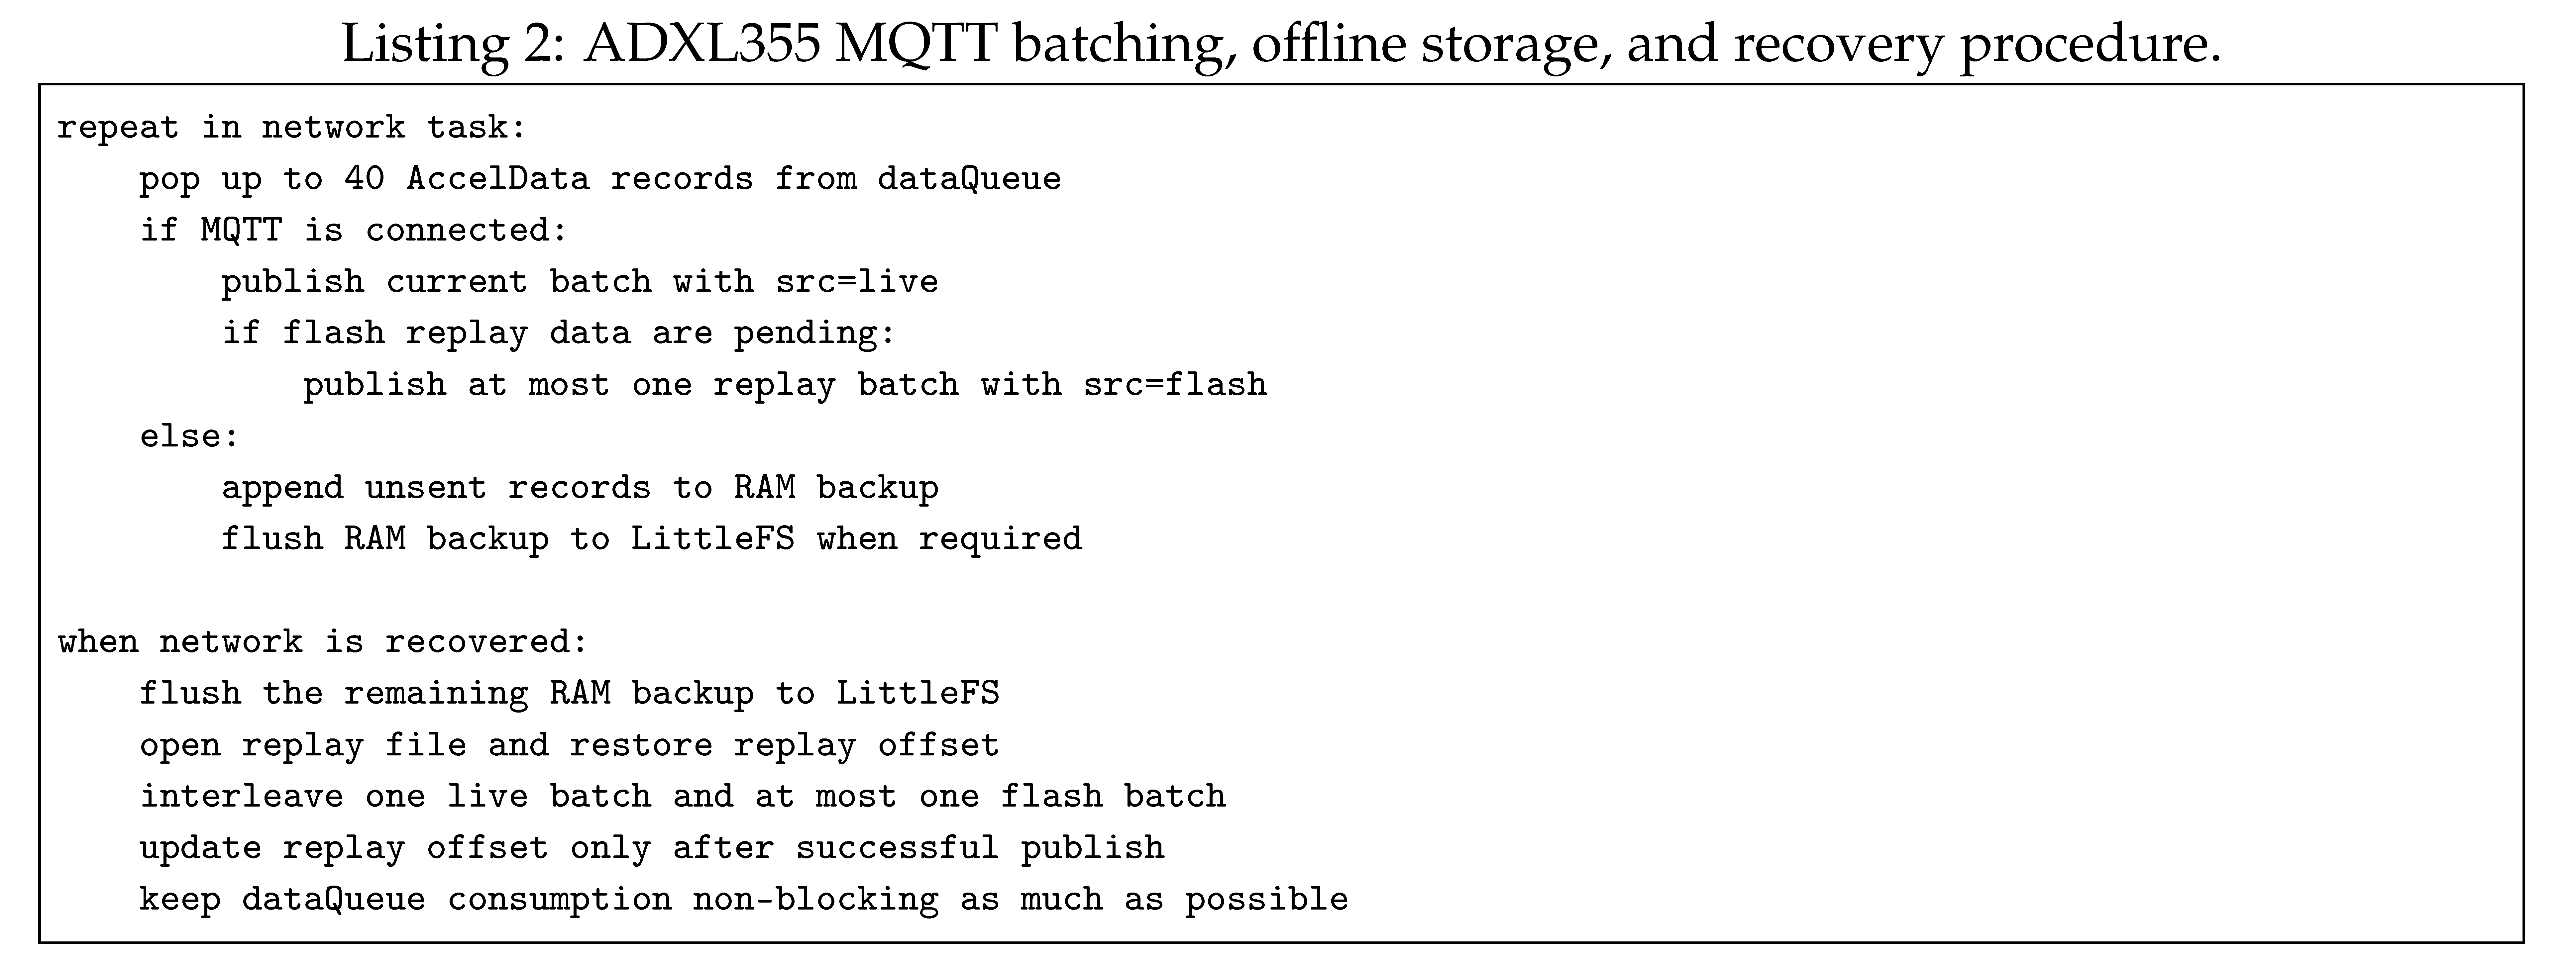
Communication failure is handled as a data-preservation problem rather than as a simple reconnect operation. When Ethernet connectivity, broker connectivity, or MQTT publication is unavailable, unsent records are first buffered in RAM, which can hold 1000 records. As the RAM buffer fills, records are appended in binary form to a LittleFS file in Flash. Before replay begins, any remaining RAM-resident records are consolidated into Flash so that the recovery stream has a persistent source. After reconnection, Flash records are read sequentially and transmitted as replay data. Crucially, replay is interleaved with current live batches, allowing recovery to progress without blocking ongoing measurement and minimizing the risk that restoration of historical data creates a second gap in the live stream. Figure 4 summarizes this data path.
3.5. SCL3300-D01 Inclinometer Node
The construction-site node comprises an SCL3300-D01 three-axis MEMS inclinometer, an ESP32 controller, an SX1276 LoRa transceiver, and a MAX17043 fuel gauge. The ESP32 acquires triaxial acceleration, triaxial inclination, and temperature through SPI; the SX1276 provides the LoRa physical link used by the LoRaWAN stack; and the MAX17043 supplies battery-state information for inclusion in the transmitted status. At startup, the firmware follows the SCL3300-D01 initialization sequence and enters the configured angle-measurement mode [25].
Raw SCL3300-D01 outputs are converted to engineering units using the scale factors associated with the selected measurement mode. The implemented acceleration, angle, and temperature conversions are
To remove dependence on the absolute mounting orientation, the node establishes a local reference after power-up. Five valid measurements are acquired and averaged to form the initial baseline, as defined in Equation 5:
Subsequent observations are expressed relative to this startup reference. For each update, the current value is subtracted from the baseline according to Equation 6:
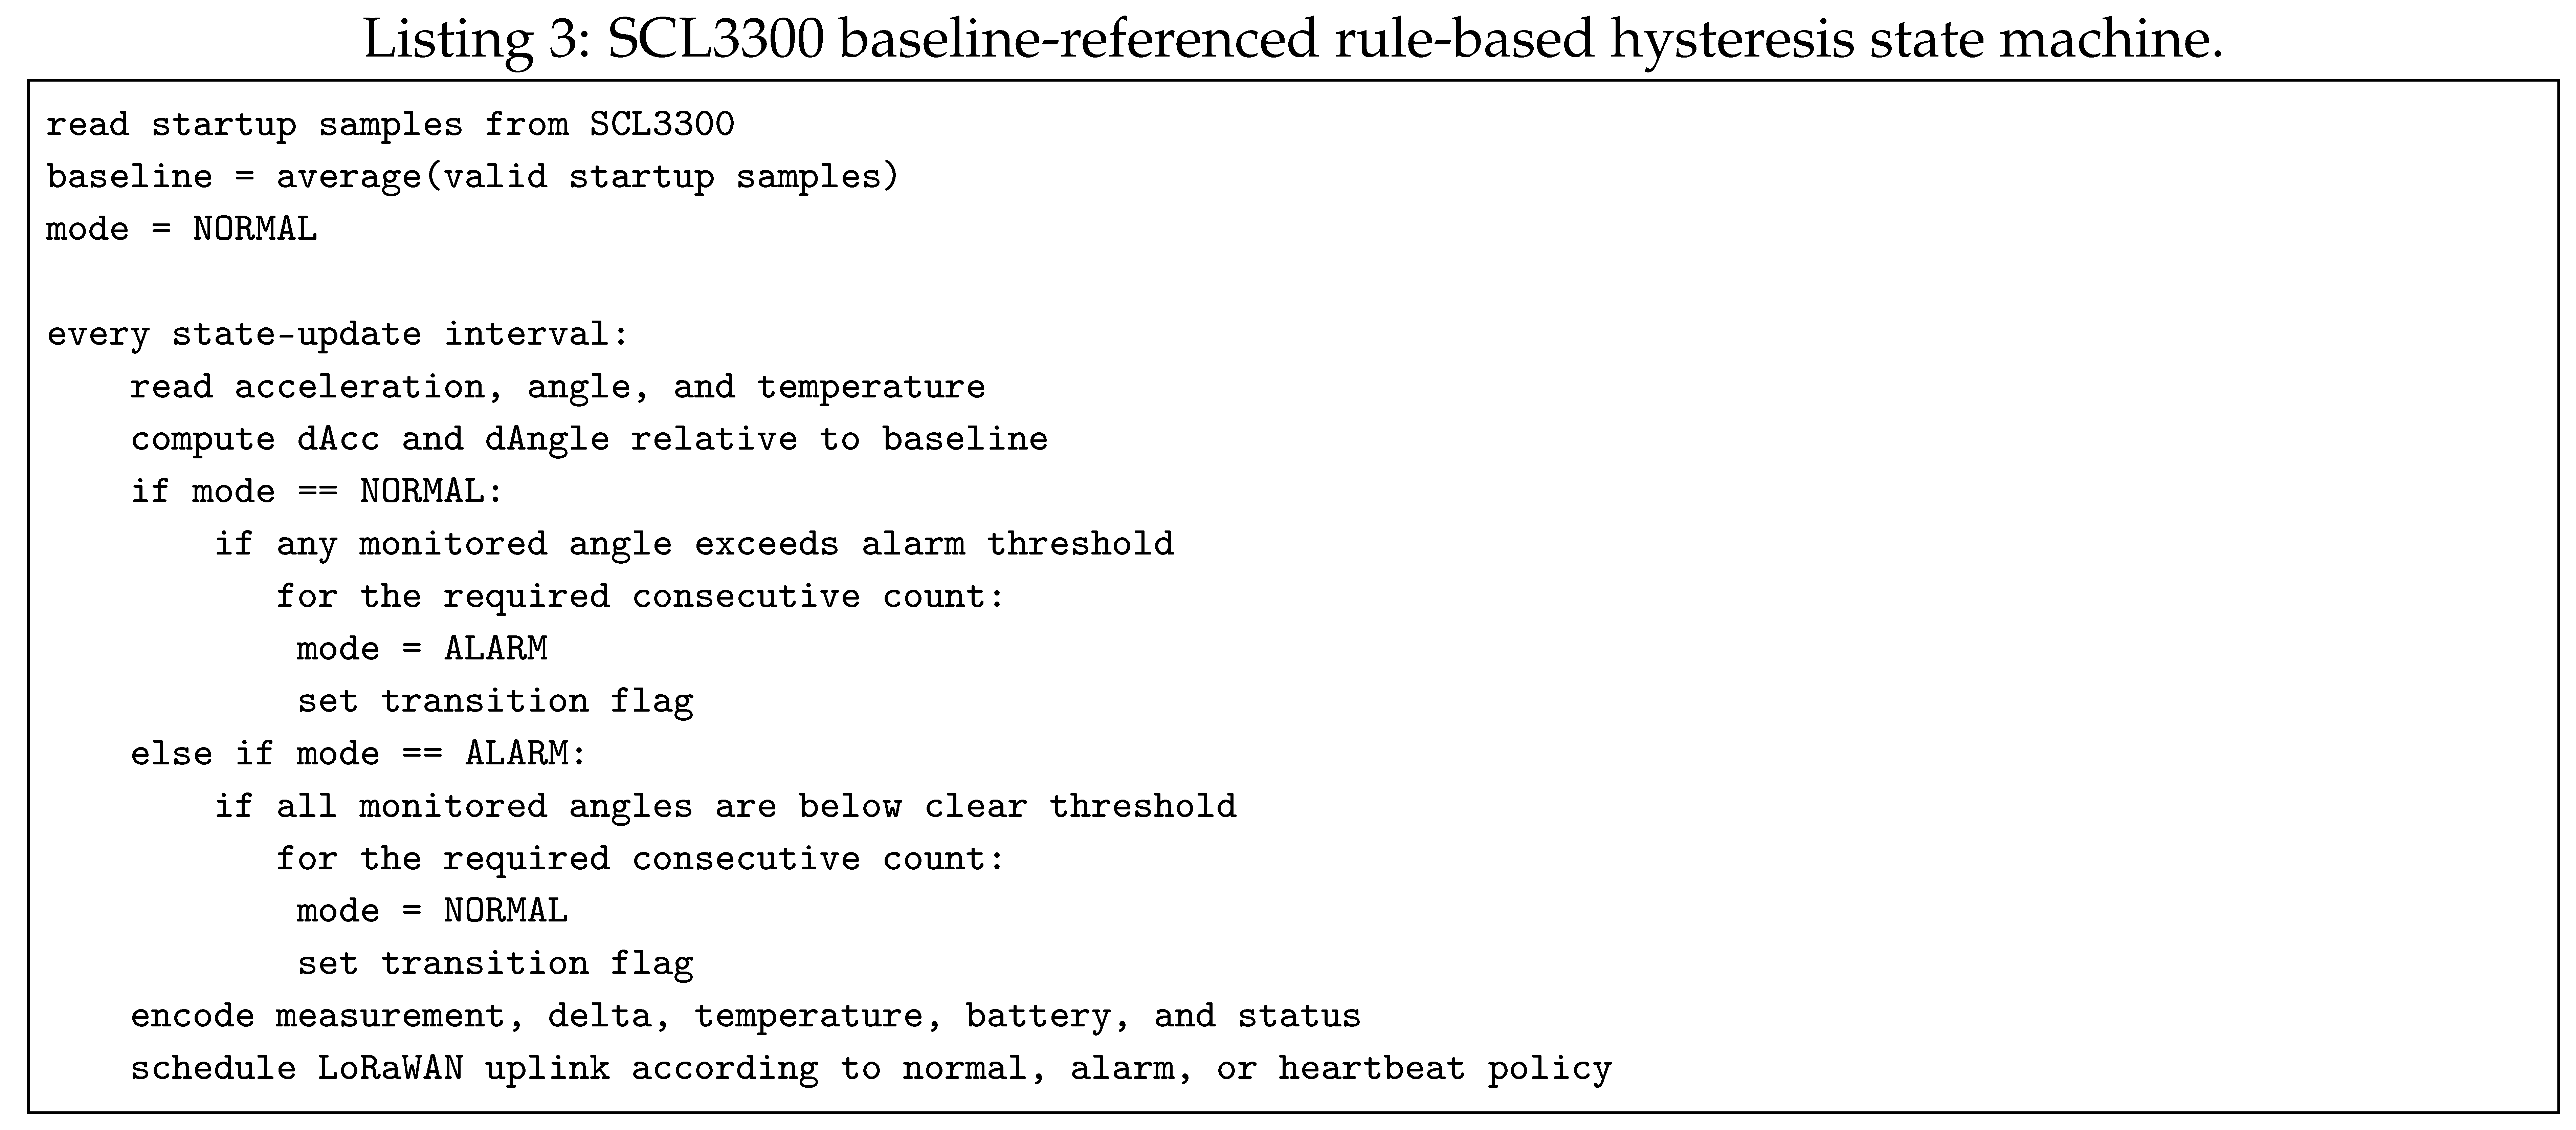
These baseline-referenced changes feed a rule-based hysteresis state machine for NORMAL/ALARM switching. Separate thresholds are used for entering and clearing the alarm state, with the recovery threshold constrained below the alarm threshold as in Equation 7. Together with consecutive-sample requirements, this separation reduces rapid state toggling when measurements fluctuate near a single decision boundary.
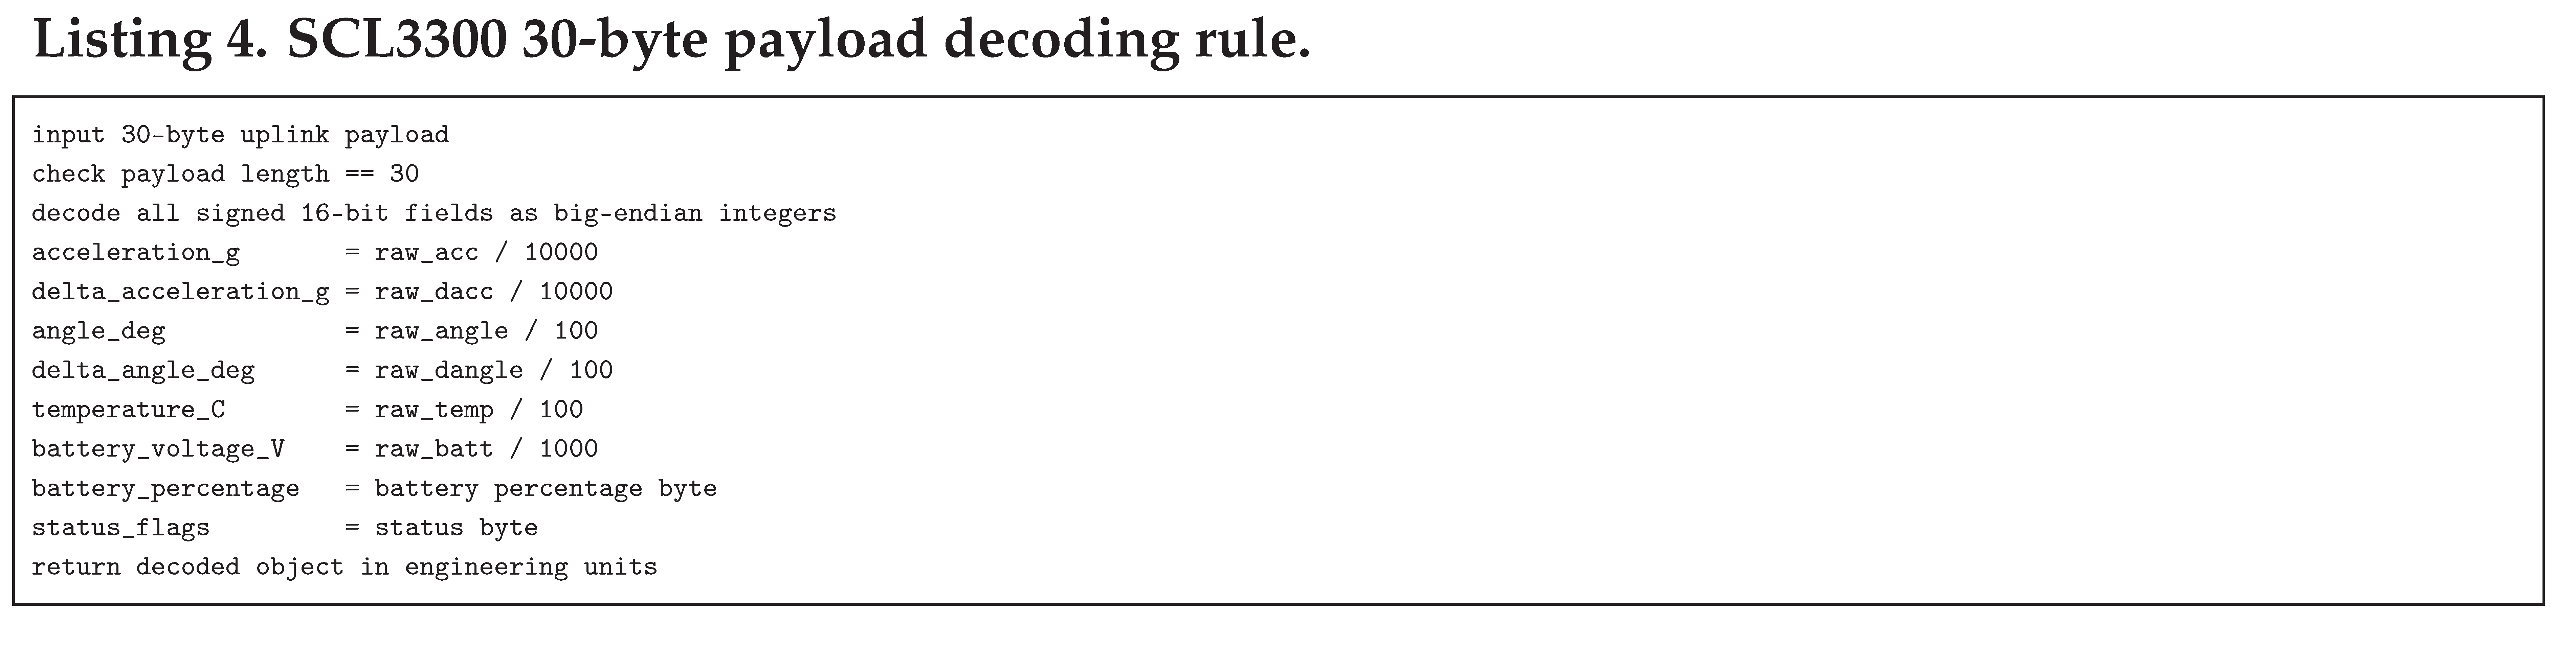
The LoRaWAN uplink distinguishes measurement/status traffic from periodic liveness confirmation through the FPort field [26]. General sensing records are transmitted on FPort 1 using the fixed 30-byte structure shown in Table 2, whereas FPort 2 carries a one-byte 0xA5 heartbeat. The fixed payload explicitly encodes acceleration, inclination, baseline-referenced differences, temperature, battery state, and status flags, enabling deterministic reconstruction at the backend.
Figure 5 summarizes the acquisition, baseline processing, state determination, LoRaWAN transmission, and backend decoding sequence for the SCL3300-D01 path.
3.6. Experimental Validation Method
Validation of the SCL3300-D01 path was designed to test both measurement behavior and data-path behavior. Specified-angle stationary measurements were used to quantify baseline-referenced angle error, repeated alarm/recovery trials were used to verify state-transition logic, LoRaWAN frame counters were used to assess packet continuity over the observation interval, and known payloads were used to verify backend decoding. For a reference angle and measured angle , the error is defined as
The aggregate angular error is summarized using the root mean square error (RMSE),
LoRaWAN packet delivery over the observed interval is evaluated from the continuity of the frame counter. Given the first and last FCnt values, the packet delivery ratio (PDR) is computed as
4. Results
4.1. ADXL355 Accelerometer 24-Hour Sampling Results
Four ADXL355 nodes were operated continuously for 24 hours. At the configured 200 Hz sampling rate, each node was expected to generate 17,280,000 records, corresponding to 69,120,000 records across all four nodes. The backend received exactly these counts for every node and for the aggregate data set, yielding a measured sample-completeness rate of 100% for the test interval. The per-node results are reported in Table 3.
4.2. ADXL355 Accelerometer Disconnection-Recovery Results
Four forced network-interruption trials were used to evaluate the ADXL355 preservation and replay mechanism. Across the trials, 52,200 records were expected and all 52,200 were received after recovery, corresponding to an overall recovery rate of 100%. Of these records, 50,840 were explicitly labeled src=flash, confirming replay from persistent storage, while 1,360 were labeled src=live, confirming that current data continued to be transmitted during the recovery process. Table 4 and Figure 6 summarize the four trials.
4.3. ADXL355 Accelerometer Frequency-Domain Check
Welch power spectral density (PSD) estimates were used to inspect the effect of the MCU-side 10 Hz second-order Butterworth low-pass filter. The Raw curves represent the unfiltered measurements, whereas the Offline LP10 curves represent the corresponding signals after application of the implemented 10 Hz filter. Across the displayed data, spectral energy above the cutoff is substantially reduced, with progressively stronger attenuation at higher frequencies, while the dominant low-frequency content below 10 Hz remains visible. Figure 7 presents the before/after PSD comparisons.
4.4. SCL3300-D01 Inclinometer Angle Results
The SCL3300-D01 angle evaluation was performed separately for the X and Y axes. For the X axis, five runs comprising 50 specified-angle stationary points produced an RMSE of and a maximum absolute error of after baseline establishment. For the Y axis, five runs comprising 64 points produced an MAE of , an RMSE of , and a maximum absolute error of ; the fitted slope and were 1.001 and 0.9987, respectively. These results quantify both the magnitude and consistency of the baseline-referenced measurement error rather than treating the inclinometer output as an unverified status signal. Table 5 provides the complete metrics.
4.5. SCL3300-D01 Inclinometer Alarm, LoRaWAN Transmission, and Codec Results
The hysteresis-based alarm/recovery logic was evaluated in 25 complete trials, each containing six predefined state checkpoints. All 150 checkpoints matched the expected state, yielding 100% checkpoint accuracy for the tested sequence of NORMAL, ALARM, and recovery transitions. The median delay from the ALARM marker to state switching was 0.313 s, and the median delay from the NORMAL marker to switching was 0.235 s. Table 6 and Figure 8 summarize the state-machine results.
During the LoRaWAN continuity observation, FCnt increased monotonically from 728 to 892 and 165 packets were received. No frame-counter gaps were observed, corresponding to a PDR of 100% over this specific observation interval. The traffic comprised 154 30-byte general-data packets on FPort 1 and 11 heartbeat packets on FPort 2. Backend codec correctness was evaluated separately using 100 known 30-byte payloads; all 100 were decoded correctly into the expected engineering fields. Table 7 reports the packet and codec results.
5. Discussion
The ADXL355 results demonstrate the importance of treating communication interruption as part of the sensing design. A wired PoE/Ethernet path is well suited to continuous high-rate vibration data, but wired connectivity does not eliminate transient broker or network failures. The 24-hour run yielded complete record delivery under sustained operation. In all four forced-outage trials, the Flash-backed replay path recovered every expected record. The simultaneous presence of src=flash and src=live records is particularly relevant: it confirms that recovery was not implemented as a stop-and-replay procedure, but as an interleaved process in which historical restoration and current-state delivery coexist. This property strengthens temporal continuity for downstream monitoring systems.
The SCL3300-D01 path addresses a different systems problem. Construction-site inclination is naturally represented as a comparatively low-rate state variable, making LoRaWAN and compact fixed-format payloads more appropriate than continuous high-throughput transport. The angle tests quantify the uncertainty of the baseline-referenced measurements, while the 150/150 state checkpoints show that the configured hysteresis logic behaved deterministically in the repeated laboratory trials. Frame-counter continuity and the 100-payload codec test further verify that the transmitted state can be traced and reconstructed at the backend. The significance of this path is therefore the integration of measurement, state abstraction, transport, and deterministic decoding within one verifiable low-data-rate workflow.
The two paths should therefore be interpreted as complementary rather than competing alternatives. The framework deliberately uses different communication mechanisms because the monitored phenomena impose different temporal, bandwidth, and deployment requirements. Its unifying element is not a common radio or protocol, but a common data-layer discipline: source identity, measurement time, explicit data-source/state markers, fixed payload semantics, and experimentally verifiable delivery. This separation of transport-specific design from shared traceability requirements is the principal architectural innovation and provides a more realistic foundation for multi-scenario smart-building and construction-site monitoring than a uniform communication stack would provide.
The reported validation also defines the current scope of the claims. The 100% completeness, recovery, checkpoint, PDR, and codec values apply to the specific nodes, durations, forced-outage conditions, and LoRaWAN observation interval tested in this study; they should not be interpreted as guarantees under arbitrary field conditions. Larger deployments, longer wireless observations, adverse coverage conditions, power-consumption analysis, clock-drift characterization, and direct BIM/GIS or digital-twin synchronization remain to be evaluated. These limitations do not change the demonstrated data-path functions, but they identify the next steps required to establish deployment-scale robustness.
6. Conclusions
This study developed and experimentally validated a dual-path IoT sensing and communication framework for two structurally different monitoring scenarios: smart-building vibration monitoring and construction-site inclination-status monitoring. The framework is based on a simple but consequential design principle: heterogeneous sensing workloads should use communication paths matched to their temporal and field constraints, while sharing common requirements for traceability, measurement-time preservation, payload interpretability, and backend verification. The contribution is therefore an end-to-end sensing data foundation rather than two isolated sensor prototypes.
For the smart-building path, the ADXL355, ESP32-S3, PoE/Ethernet, and MQTT implementation combines 200 Hz triaxial acquisition with sensor/MCU filtering, 40-record batching, Flash LittleFS-based offline preservation, and live/flash interleaved recovery. This architecture is designed so that a temporary communication failure does not force a choice between recovering historical records and maintaining current transmission: both streams can progress after reconnection.
The 24-hour test delivered all 69,120,000 expected vibration records from four nodes, and the four forced-outage trials recovered all 52,200 expected records. Welch PSD analysis further confirmed the intended reduction of frequency content above the 10 Hz cutoff while retaining the dominant lower-frequency components. Together, these results verify sustained acquisition, outage recovery, and explicit source traceability for the tested high-data-rate path.
For the construction-site path, the SCL3300-D01, ESP32, SX1276, LoRaWAN gateway, and backend decoder form a low-data-rate workflow in which raw inclination measurements are converted into baseline-referenced changes and stable NORMAL/ALARM states before transmission. The fixed payload additionally carries temperature, battery information, and status flags, allowing the backend to reconstruct both the physical measurement and its operational context.
The SCL3300-D01 validation quantified the angle error on both axes, achieved the expected state at all 150 checkpoints across 25 alarm/recovery trials, observed no frame-counter gaps among 165 LoRaWAN packets, and correctly decoded all 100 known test payloads. These results support the implemented measurement, state-transition, transport, and codec functions within the evaluated conditions.
Overall, the experiments show that the two paths satisfy different engineering requirements while conforming to a shared data-layer concept. The ADXL355 path emphasizes continuous high-rate acquisition and interruption recovery; the SCL3300-D01 path emphasizes low-volume wireless status reporting and deterministic state interpretation. In both cases, device identity, time-related information, source/state markers, and explicit payload definitions preserve the provenance and meaning of the data as they move from the physical site to the backend.
The proposed framework consequently provides a practical front-end foundation for smart-building and construction-site structural monitoring and for future digital-twin-oriented integration. It does not replace BIM/GIS, visualization, model updating, or maintenance decision support; rather, it supplies the traceable and recoverable sensing records on which those higher-level functions depend. Future work should extend the present validation to larger and longer field deployments and then evaluate cross-scenario data mapping, state synchronization, visualization, and maintenance-support functions at platform scale.
Author Contributions
Conceptualization, C.-H.C., Y.-H.H. and E.H.-K.W.; methodology, Y.-H.H.; software, Y.-H.H.; validation, Y.-H.H.; formal analysis, Y.-H.H.; investigation, Y.-H.H.; resources, C.-H.C., W.-L.L., H.-K.W., E.H.-K.W., S.-C.Y. and T.T.; data curation, Y.-H.H.; writing—original draft preparation, Y.-H.H.; writing—review and editing, C.-H.C., Y.-H.H., W.-L.L., H.-K.W., E.H.-K.W., S.-C.Y. and T.T.; supervision, E.H.-K.W. and S.-C.Y. All authors have read and agreed to the published version of the manuscript.
Funding
This research received no external funding.
Institutional Review Board Statement
Not applicable.
Informed Consent Statement
Not applicable.
Data Availability Statement
The data presented in this study are available from the corresponding author upon reasonable request.
Acknowledgments
The authors thank the laboratory members for technical support during system development and validation.
Conflicts of Interest
The authors declare no conflict of interest.
References
- Farrar, C.R.; Worden, K. An Introduction to Structural Health Monitoring. Philos. Trans. R. Soc. A Math. Phys. Eng. Sci. 2007, 365, 303–315. [Google Scholar] [CrossRef] [PubMed]
- Sohn, H.; Farrar, C.R.; Hemez, F.M.; Shunk, D.D.; Stinemates, D.W.; Nadler, B.R.; Czarnecki, J.J. A Review of Structural Health Monitoring Literature: 1996–2001. Technical Report LA-13976-MS; Los Alamos National Laboratory, 2004.
- Carden, E.P.; Fanning, P. Vibration Based Condition Monitoring: A Review. Struct. Health Monit. 2004, 3, 355–377. [Google Scholar] [CrossRef]
- Di Nuzzo, F.; Brunelli, D.; Polonelli, T.; Benini, L. Structural Health Monitoring System with Narrowband IoT and MEMS Sensors, 2021. arXiv arXiv:eess.
- Lynch, J.P. A Summary Review of Wireless Sensors and Sensor Networks for Structural Health Monitoring. Shock Vib. Dig. 2006, 38, 91–128. [Google Scholar] [CrossRef]
- Davcev, D.; Mitreski, K.; Trajkovic, S.; Nikolovski, V.; Koteli, N. IoT Agriculture System Based on LoRaWAN. In Proceedings of the 2018 14th IEEE International Workshop on Factory Communication Systems, 2018; pp. 1–4. [Google Scholar] [CrossRef]
- Pueyo Centelles, R.; Freitag, F.; Meseguer, R.; Navarro, L.; Ochoa, S.F.; Santos, R.M. A LoRa-Based Communication System for Coordinated Response in an Earthquake Aftermath. Proceedings 2019, 31, 73. [Google Scholar] [CrossRef]
- Gallardo, J.L.; Ahmed, M.A.; Jara, N. LoRa IoT-Based Architecture for Advanced Metering Infrastructure in Residential Smart Grid. IEEE Access 2021, 9, 124295–124312. [Google Scholar] [CrossRef]
- Zonzini, F.; Dertimanis, V.; Chatzi, E.; De Marchi, L. System Identification at the Extreme Edge for Network Load Reduction in Vibration-Based Monitoring. IEEE Internet Things J. 2022, 9, 20467–20478. [Google Scholar] [CrossRef]
- Bor, M.; Vidler, J.; Roedig, U. LoRa for the Internet of Things. In Proceedings of the Proceedings of the 2016 International Conference on Embedded Wireless Systems and Networks, 2016; Junction Publishing; pp. 361–366. [Google Scholar]
- Basford, P.J.; Bulot, F.M.J.; Apetroaie-Cristea, M.; Cox, S.J.; Ossont, S.J. LoRaWAN for Smart City IoT Deployments: A Long Term Evaluation. Sensors 2020, 20, 648. [Google Scholar] [CrossRef] [PubMed]
- Murray-Bergquist, L.; Bernauer, F.; Igel, H. Characterization of Six-Degree-of-Freedom Sensors for Building Health Monitoring. Sensors 2021, 21, 3732. [Google Scholar] [CrossRef] [PubMed]
- Green, D.K.E.; Jaspan, A. Applied Bayesian Structural Health Monitoring: Inclinometer Data Anomaly Detection and Forecasting, 2023. arXiv arXiv:stat.
- Kritzinger, W.; Karner, M.; Traar, G.; Henjes, J.; Sihn, W. Digital Twin in Manufacturing: A Categorical Literature Review and Classification. IFAC-PapersOnLine 2018, 51, 1016–1022. [Google Scholar] [CrossRef]
- Boje, C.; Guerriero, A.; Kubicki, S.; Rezgui, Y. Towards a Semantic Construction Digital Twin: Directions for Future Research. Autom. Constr. 2020, 114, 103179. [Google Scholar] [CrossRef]
- Digital Twin Consortium. Definition of a Digital Twin. 2026. [Google Scholar] [CrossRef]
- Li, X.; Zhang, F.L.; Xiang, W.; Liu, W.X.; Fu, S.J. Structural Health Monitoring System Based on Digital Twins and Real-Time Data-Driven Methods. Structures 2024, 70, 107739. [Google Scholar] [CrossRef]
- Hu, X.; Olgun, G.; Assaad, R.H. An Intelligent BIM-Enabled Digital Twin Framework for Real-Time Structural Health Monitoring Using Wireless IoT Sensing, Digital Signal Processing, and Structural Analysis. Expert Syst. With Appl. 2024, 252, 124204. [Google Scholar] [CrossRef]
- Li, Y.; Kong, Q.; Xiong, B.; Chi, F.; Qu, Y.; Wang, C. Edge-Fog-Cloud-Based Digital Twin Network for Autonomous and Distributed Structural Health Monitoring of a Mega Dam Cluster. Autom. Constr. 2025, 172, 106050. [Google Scholar] [CrossRef]
- Huang, J.; Broekman, A.; Markou, G.; Chen, H.P. Framework for a Practical and Cost-Effective IoT-Enhanced Structural Health Monitoring and Damage Diagnostics System with Digital Twinning. J. Civ. Struct. Health Monit. 2025, 15, 2059–2084. [Google Scholar] [CrossRef]
- OASIS Open. MQTT Version 5.0; Organization for the Advancement of Structured Information Standards, 2019. [Google Scholar]
- Espressif Systems. ESP32-S3 Series Datasheet . Espr. Syst. 2024. [Google Scholar]
- WIZnet. W5500 Datasheet; WIZnet Co., Ltd., 2023. [Google Scholar]
- Devices, Analog. ADXL354/ADXL355: Low Noise, Low Drift, Low Power, 3-Axis MEMS Accelerometers Data Sheet; Analog Devices, Inc., 2025. [Google Scholar]
- Murata Manufacturing. SCL3300-D01 Three-Axis Inclinometer Product Documentation; Murata Manufacturing Co., Ltd., 2023. [Google Scholar]
- LoRa Alliance. LoRaWAN L2 1.0.4 Specification . LoRa Alliance 2020. [Google Scholar]
Figure 1.
Dual-scenario engineering monitoring context.
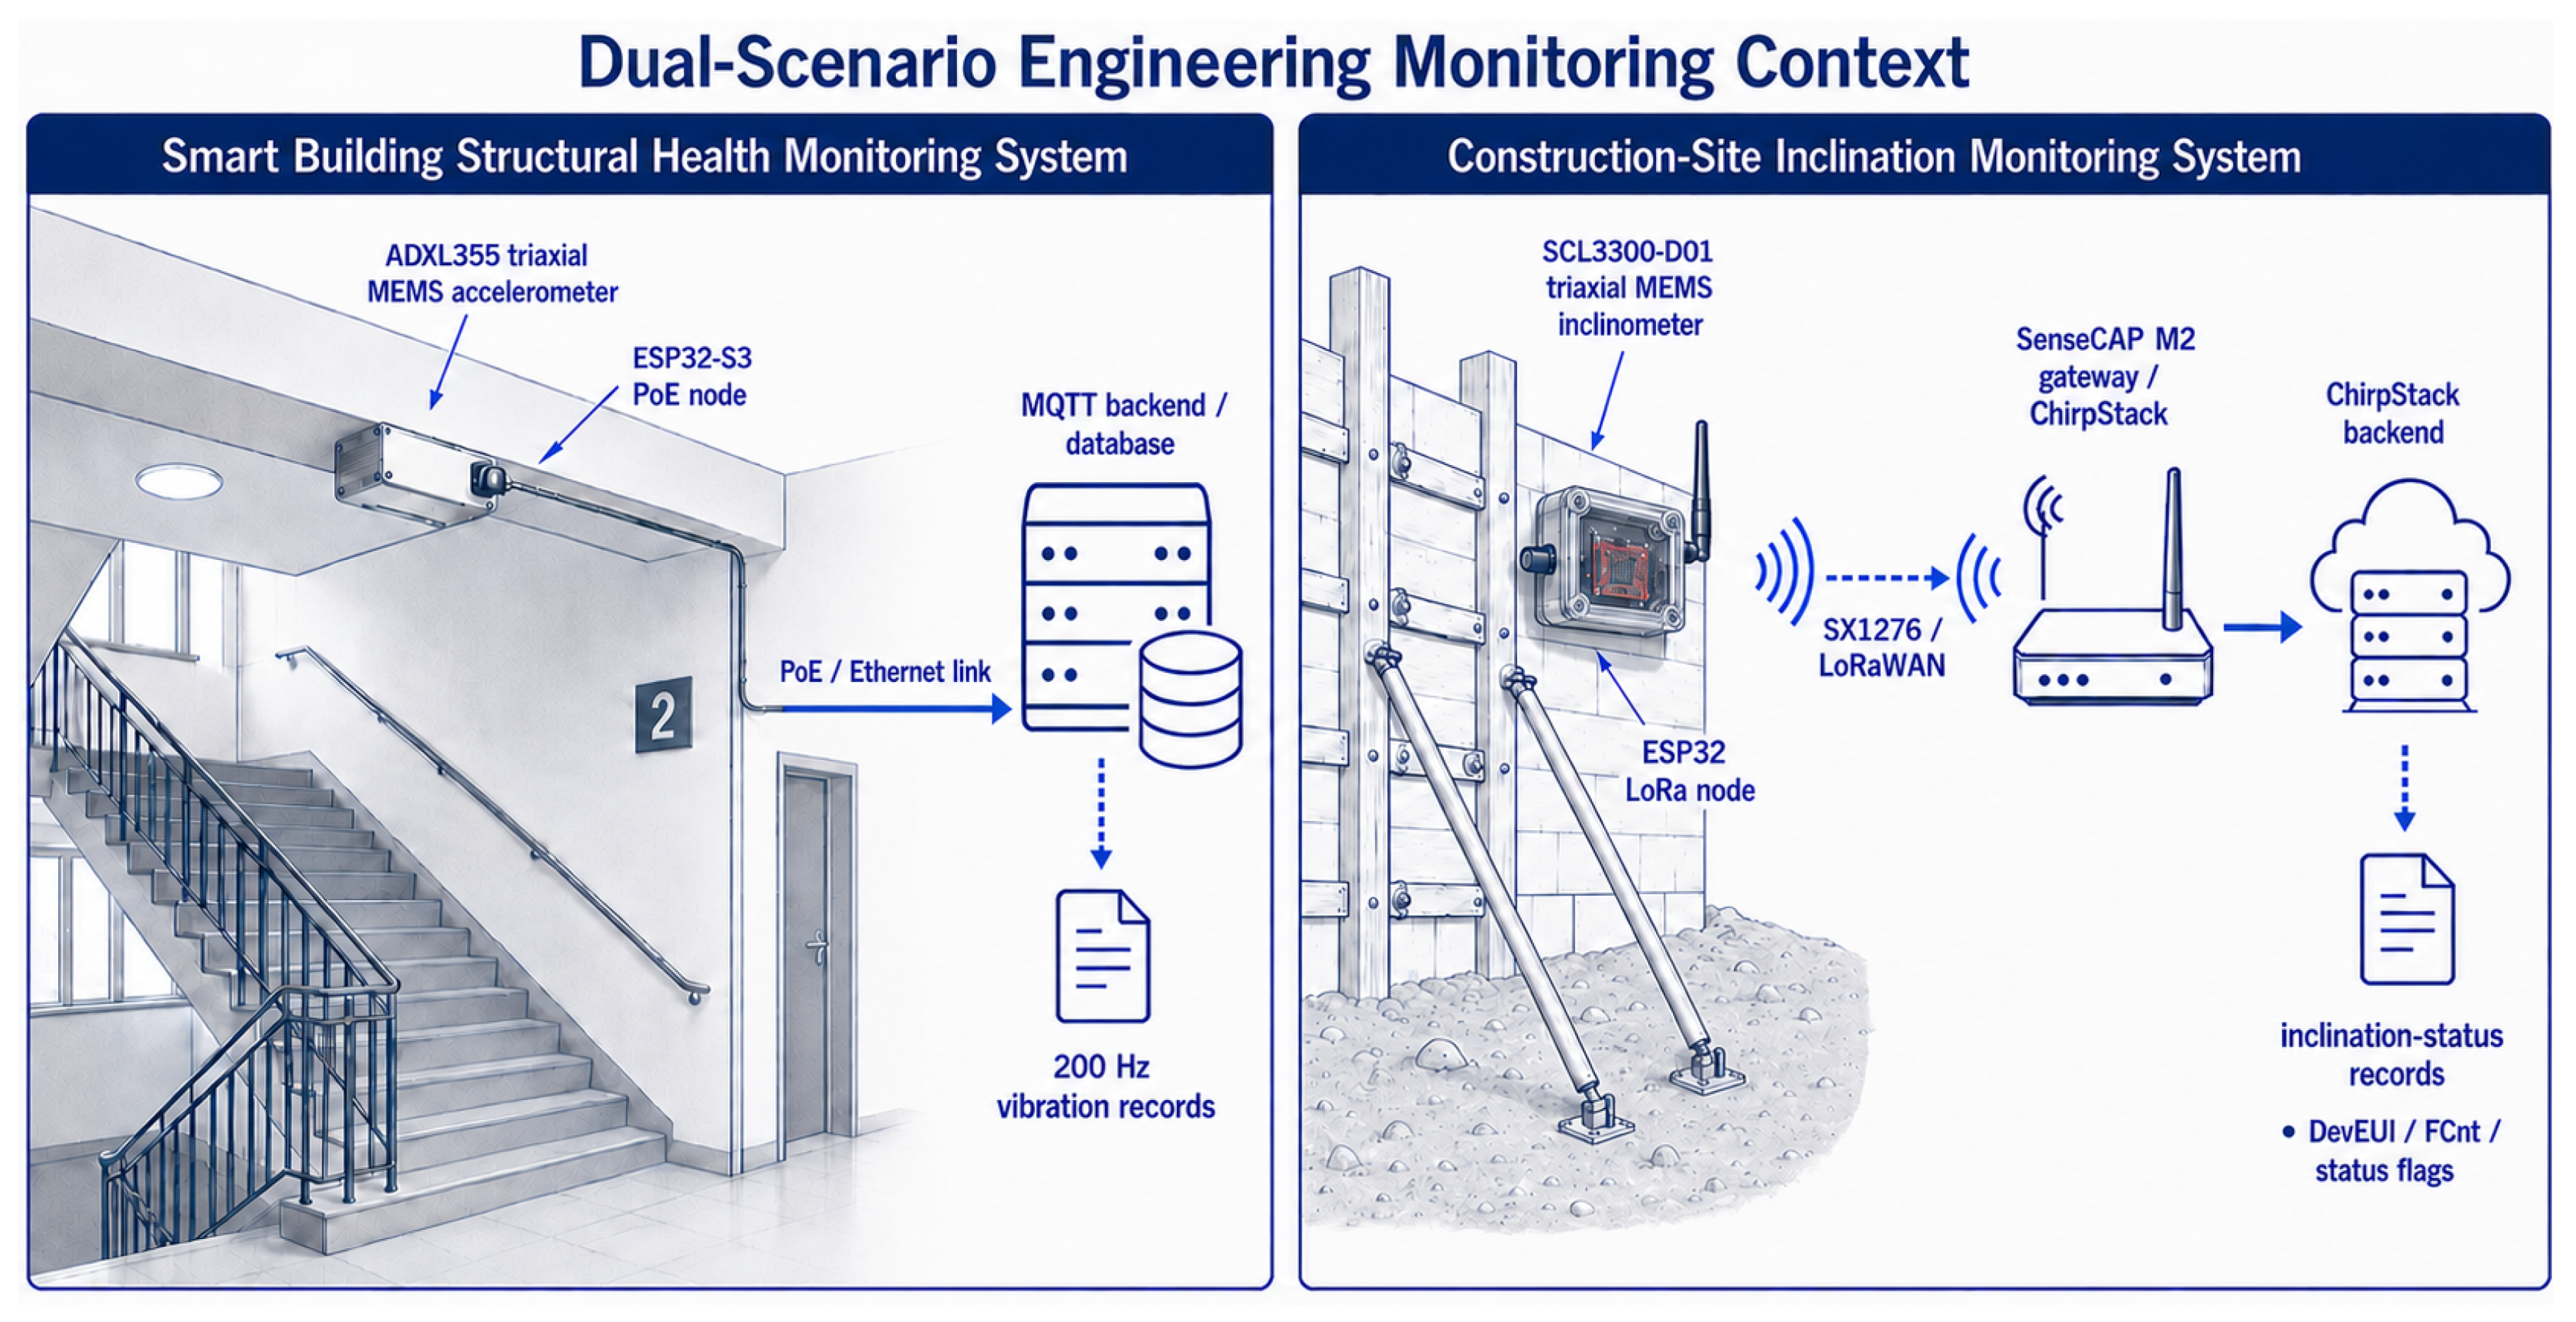
Figure 2.
Functional positioning of this study in relation to commercial monitoring products and representative IoT/SHM studies.
Figure 2.
Functional positioning of this study in relation to commercial monitoring products and representative IoT/SHM studies.
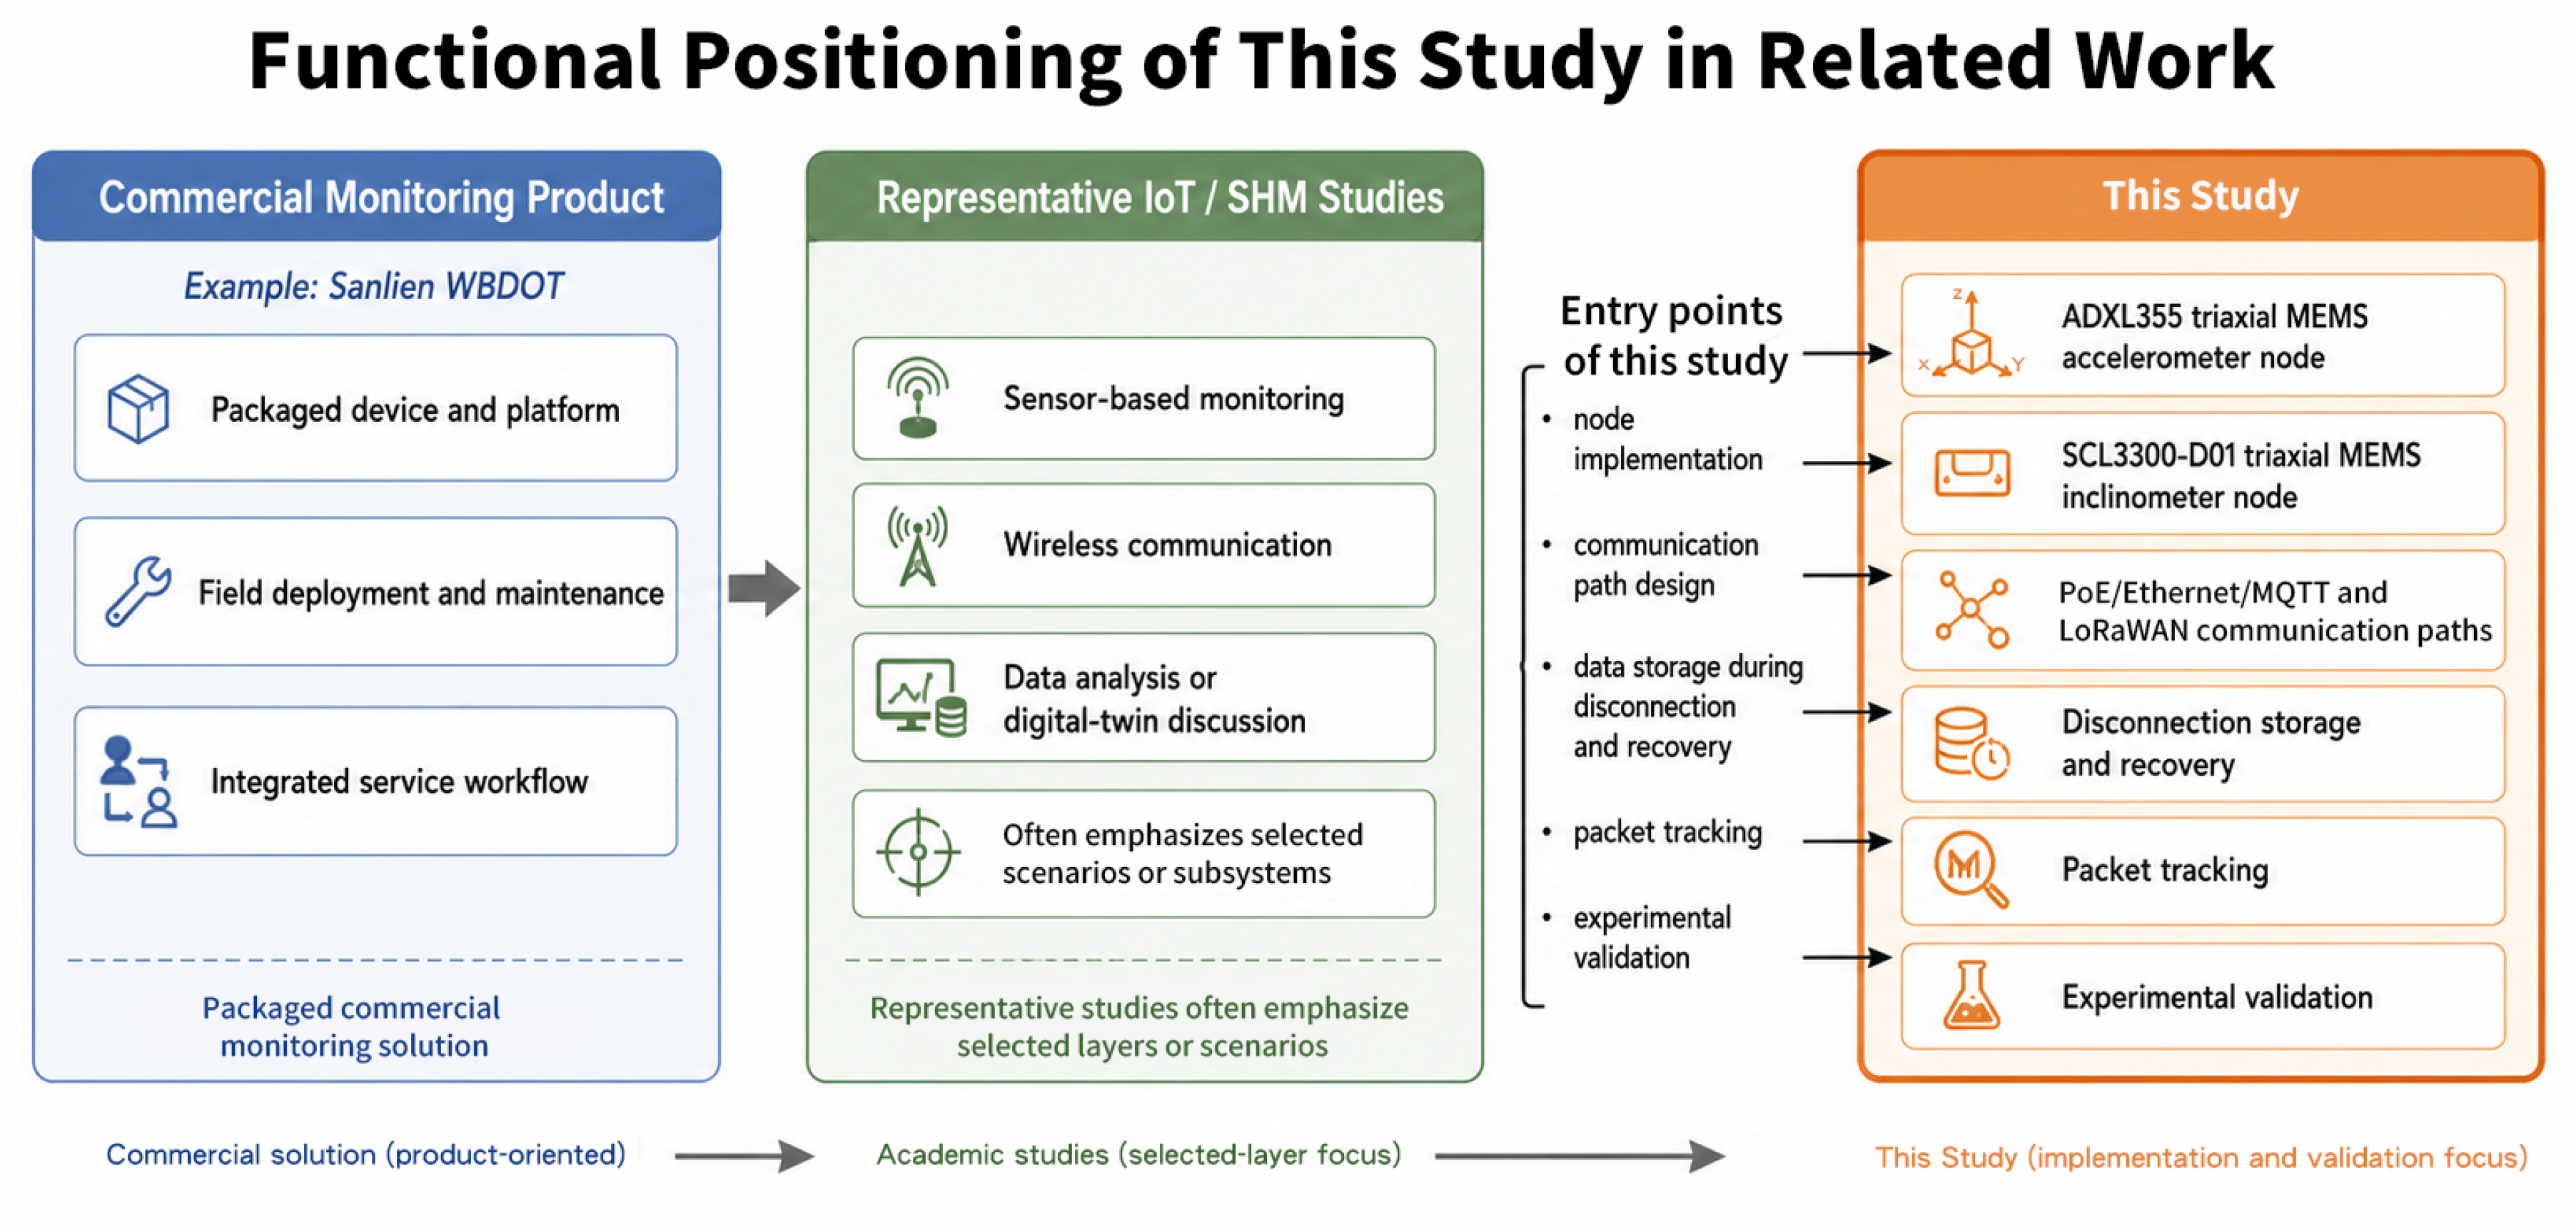
Figure 3.
Dual-scenario field sensing and communication data-layer overview
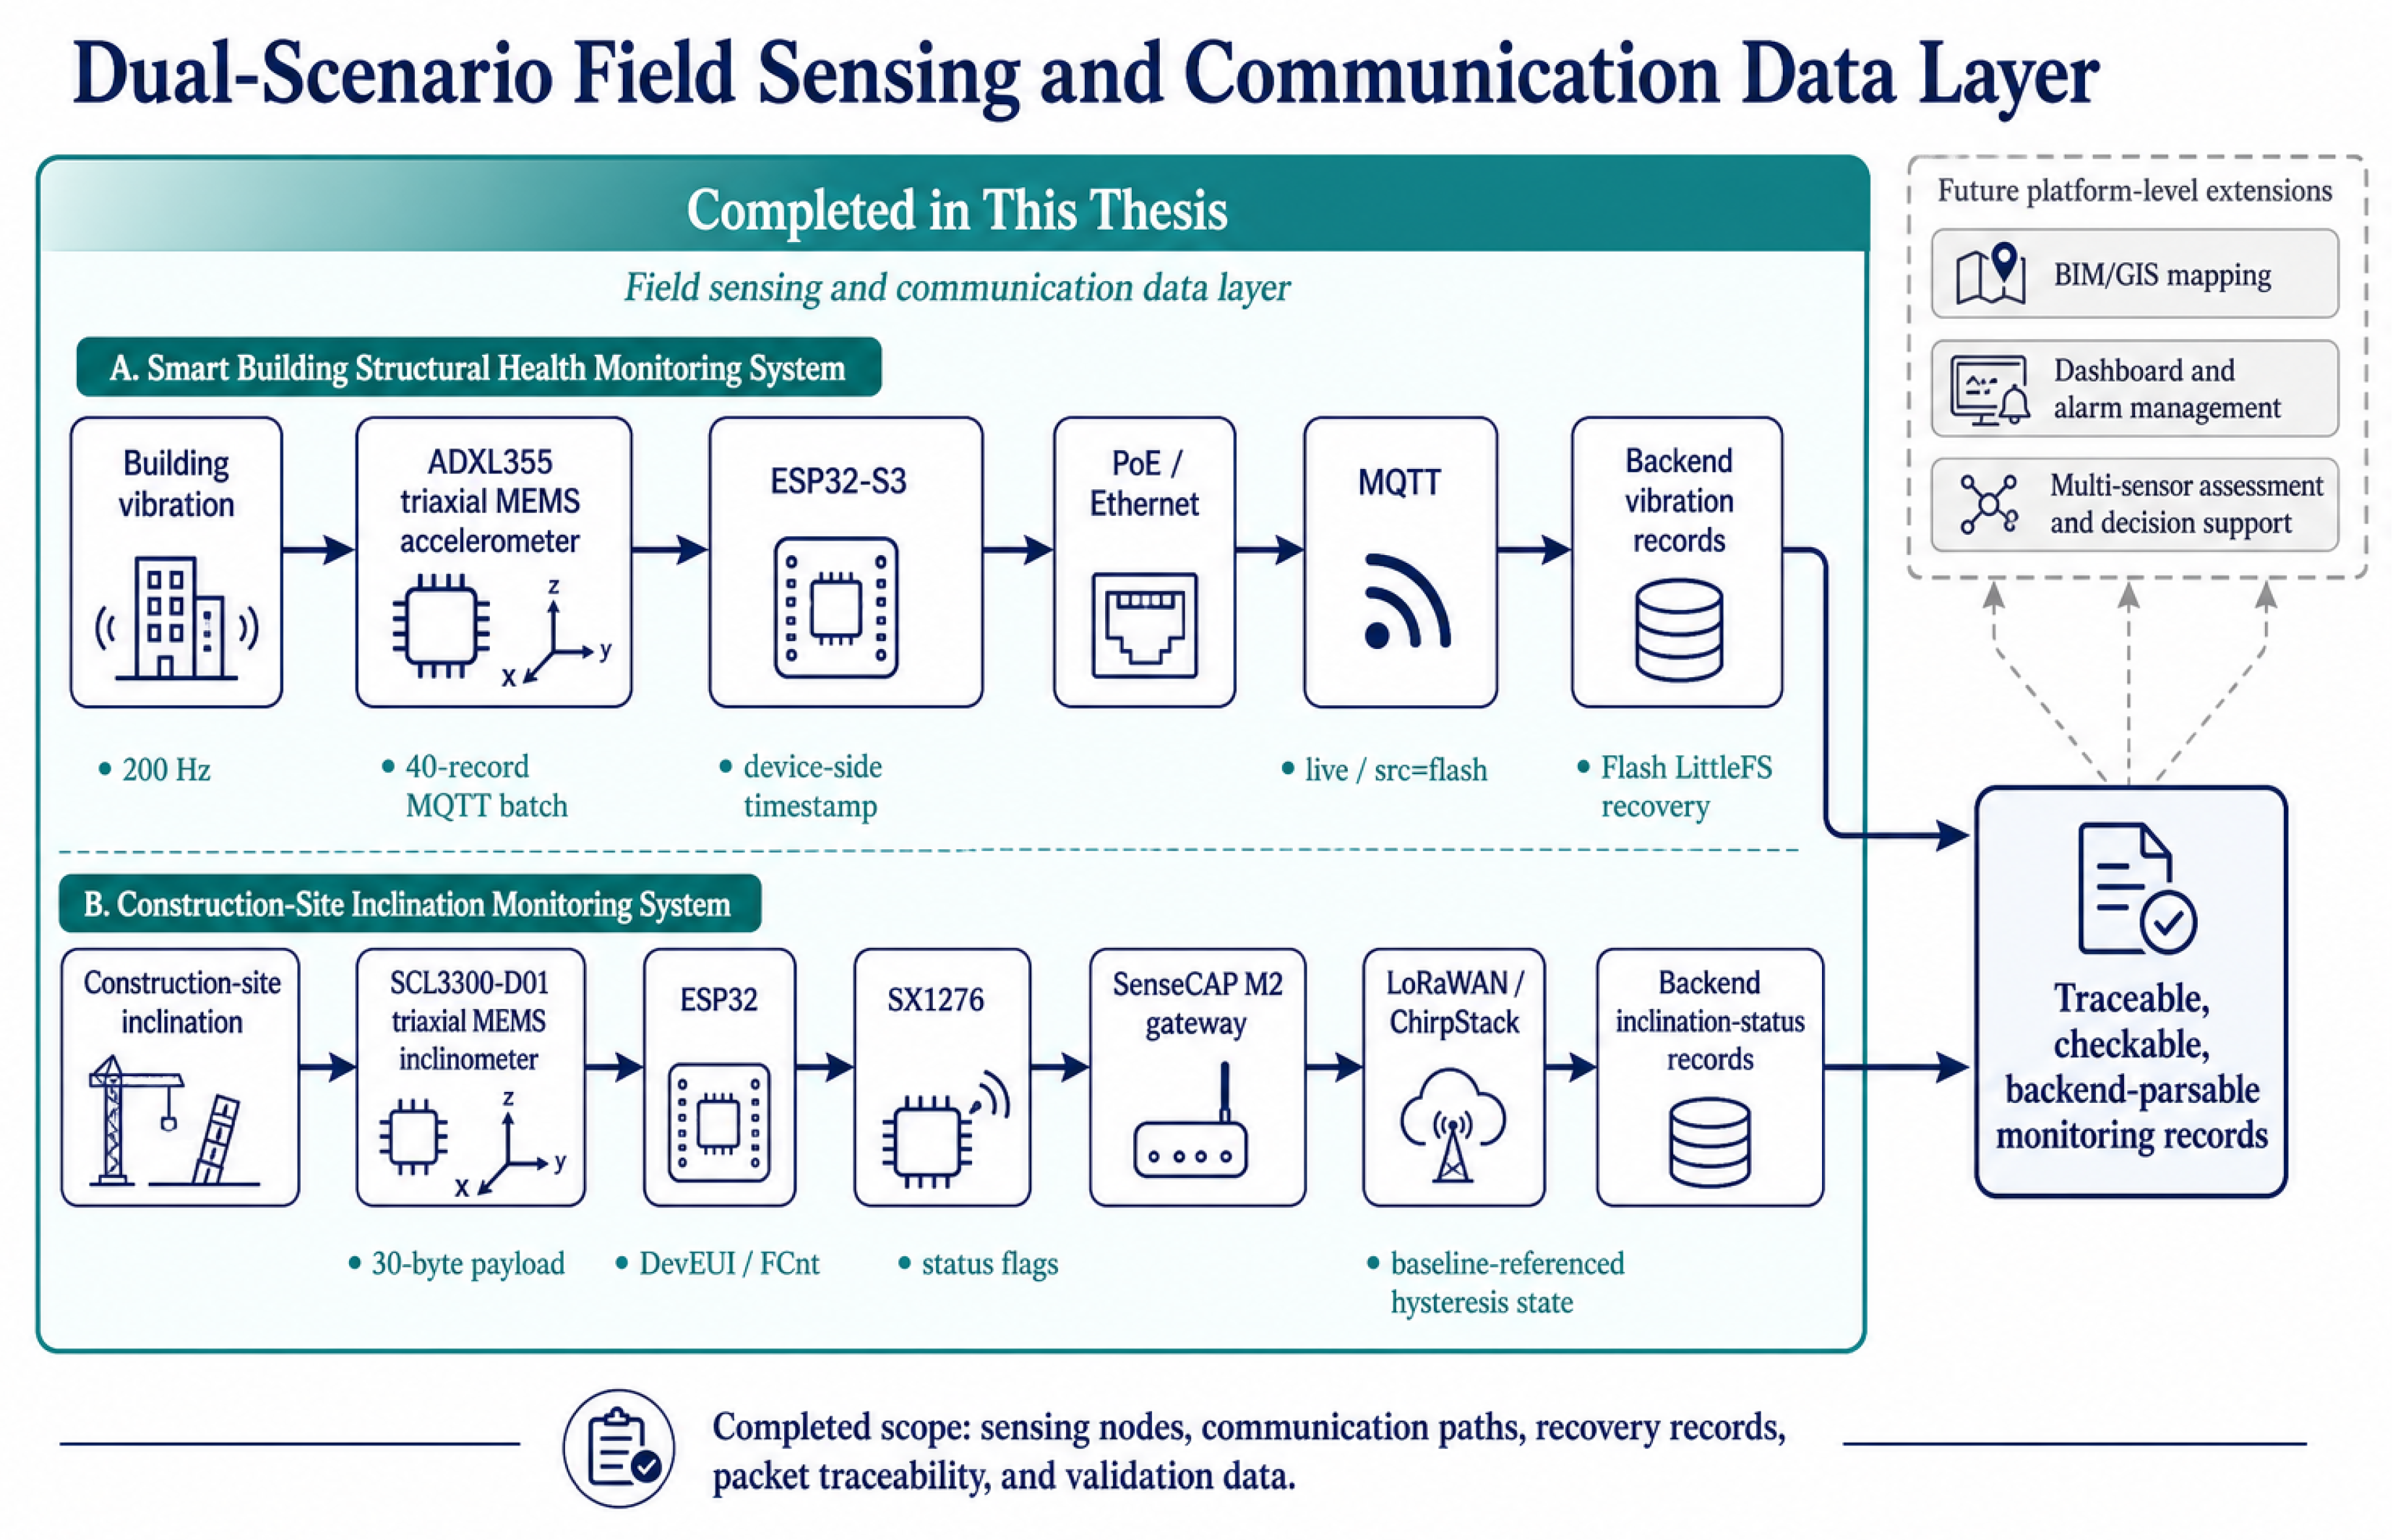
Figure 4.
ADXL355 accelerometer IoT sensing data-flow diagram.
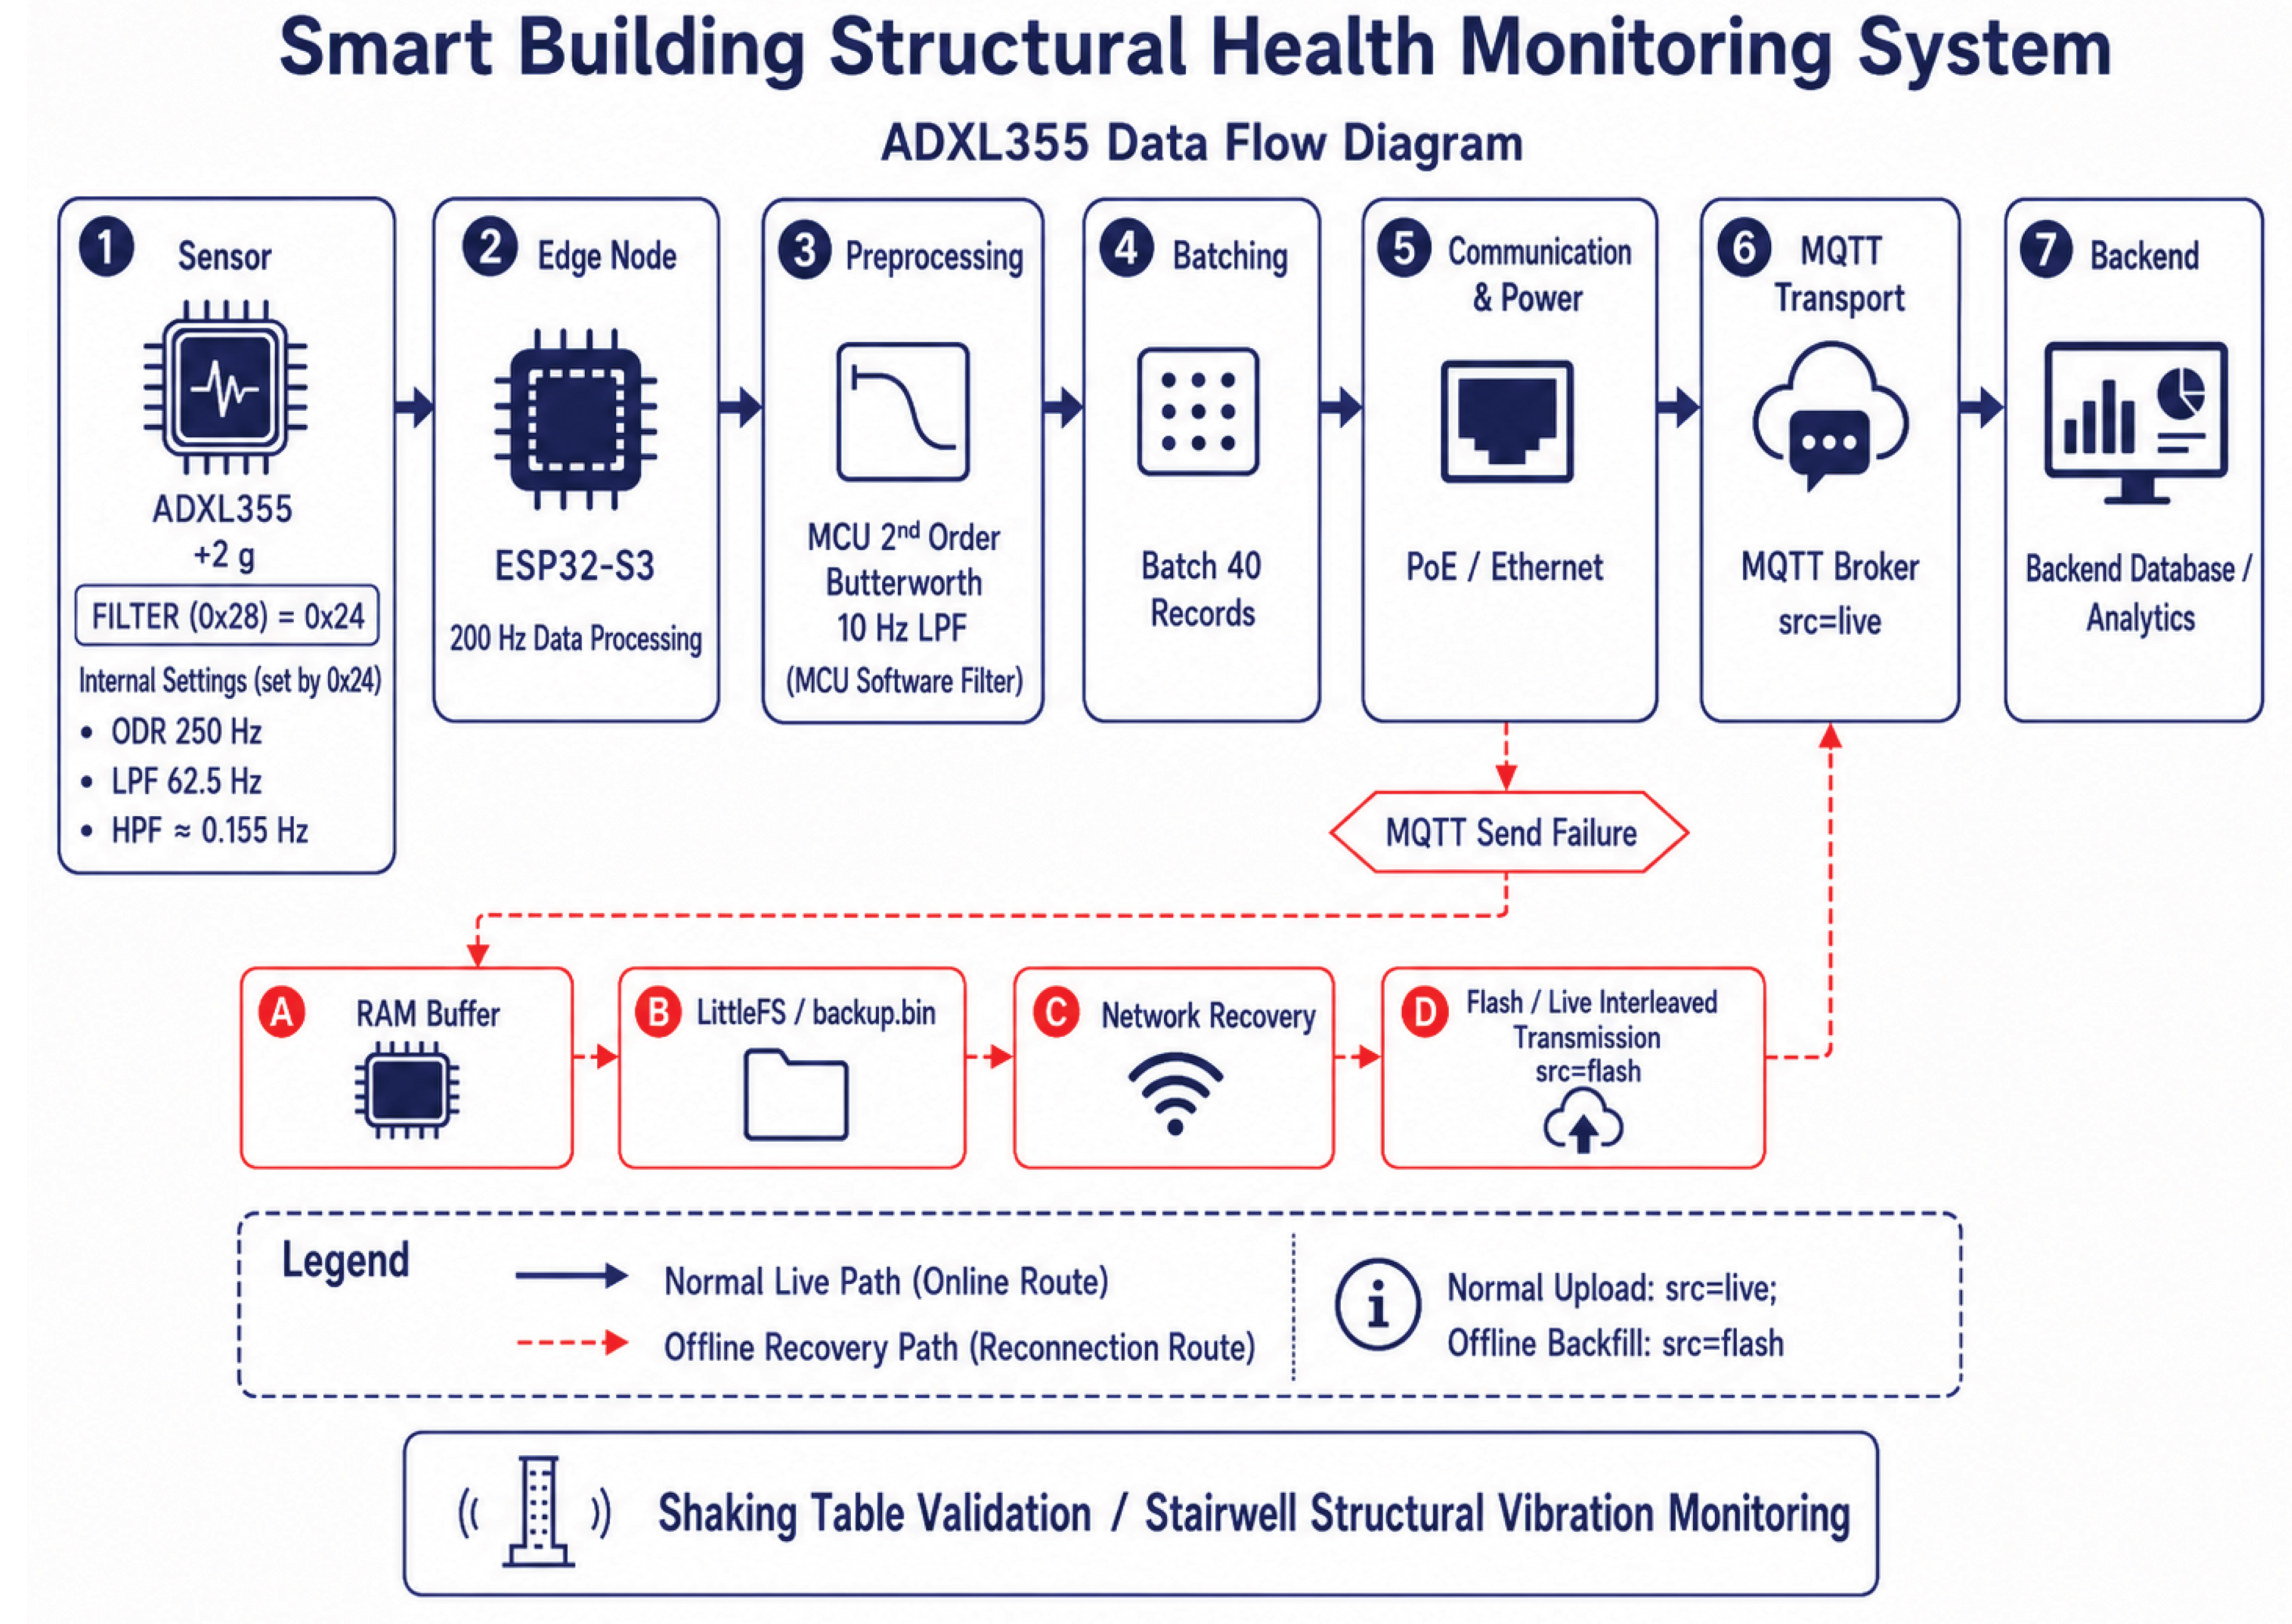
Figure 5.
SCL3300-D01 inclinometer IoT sensing data-flow diagram.
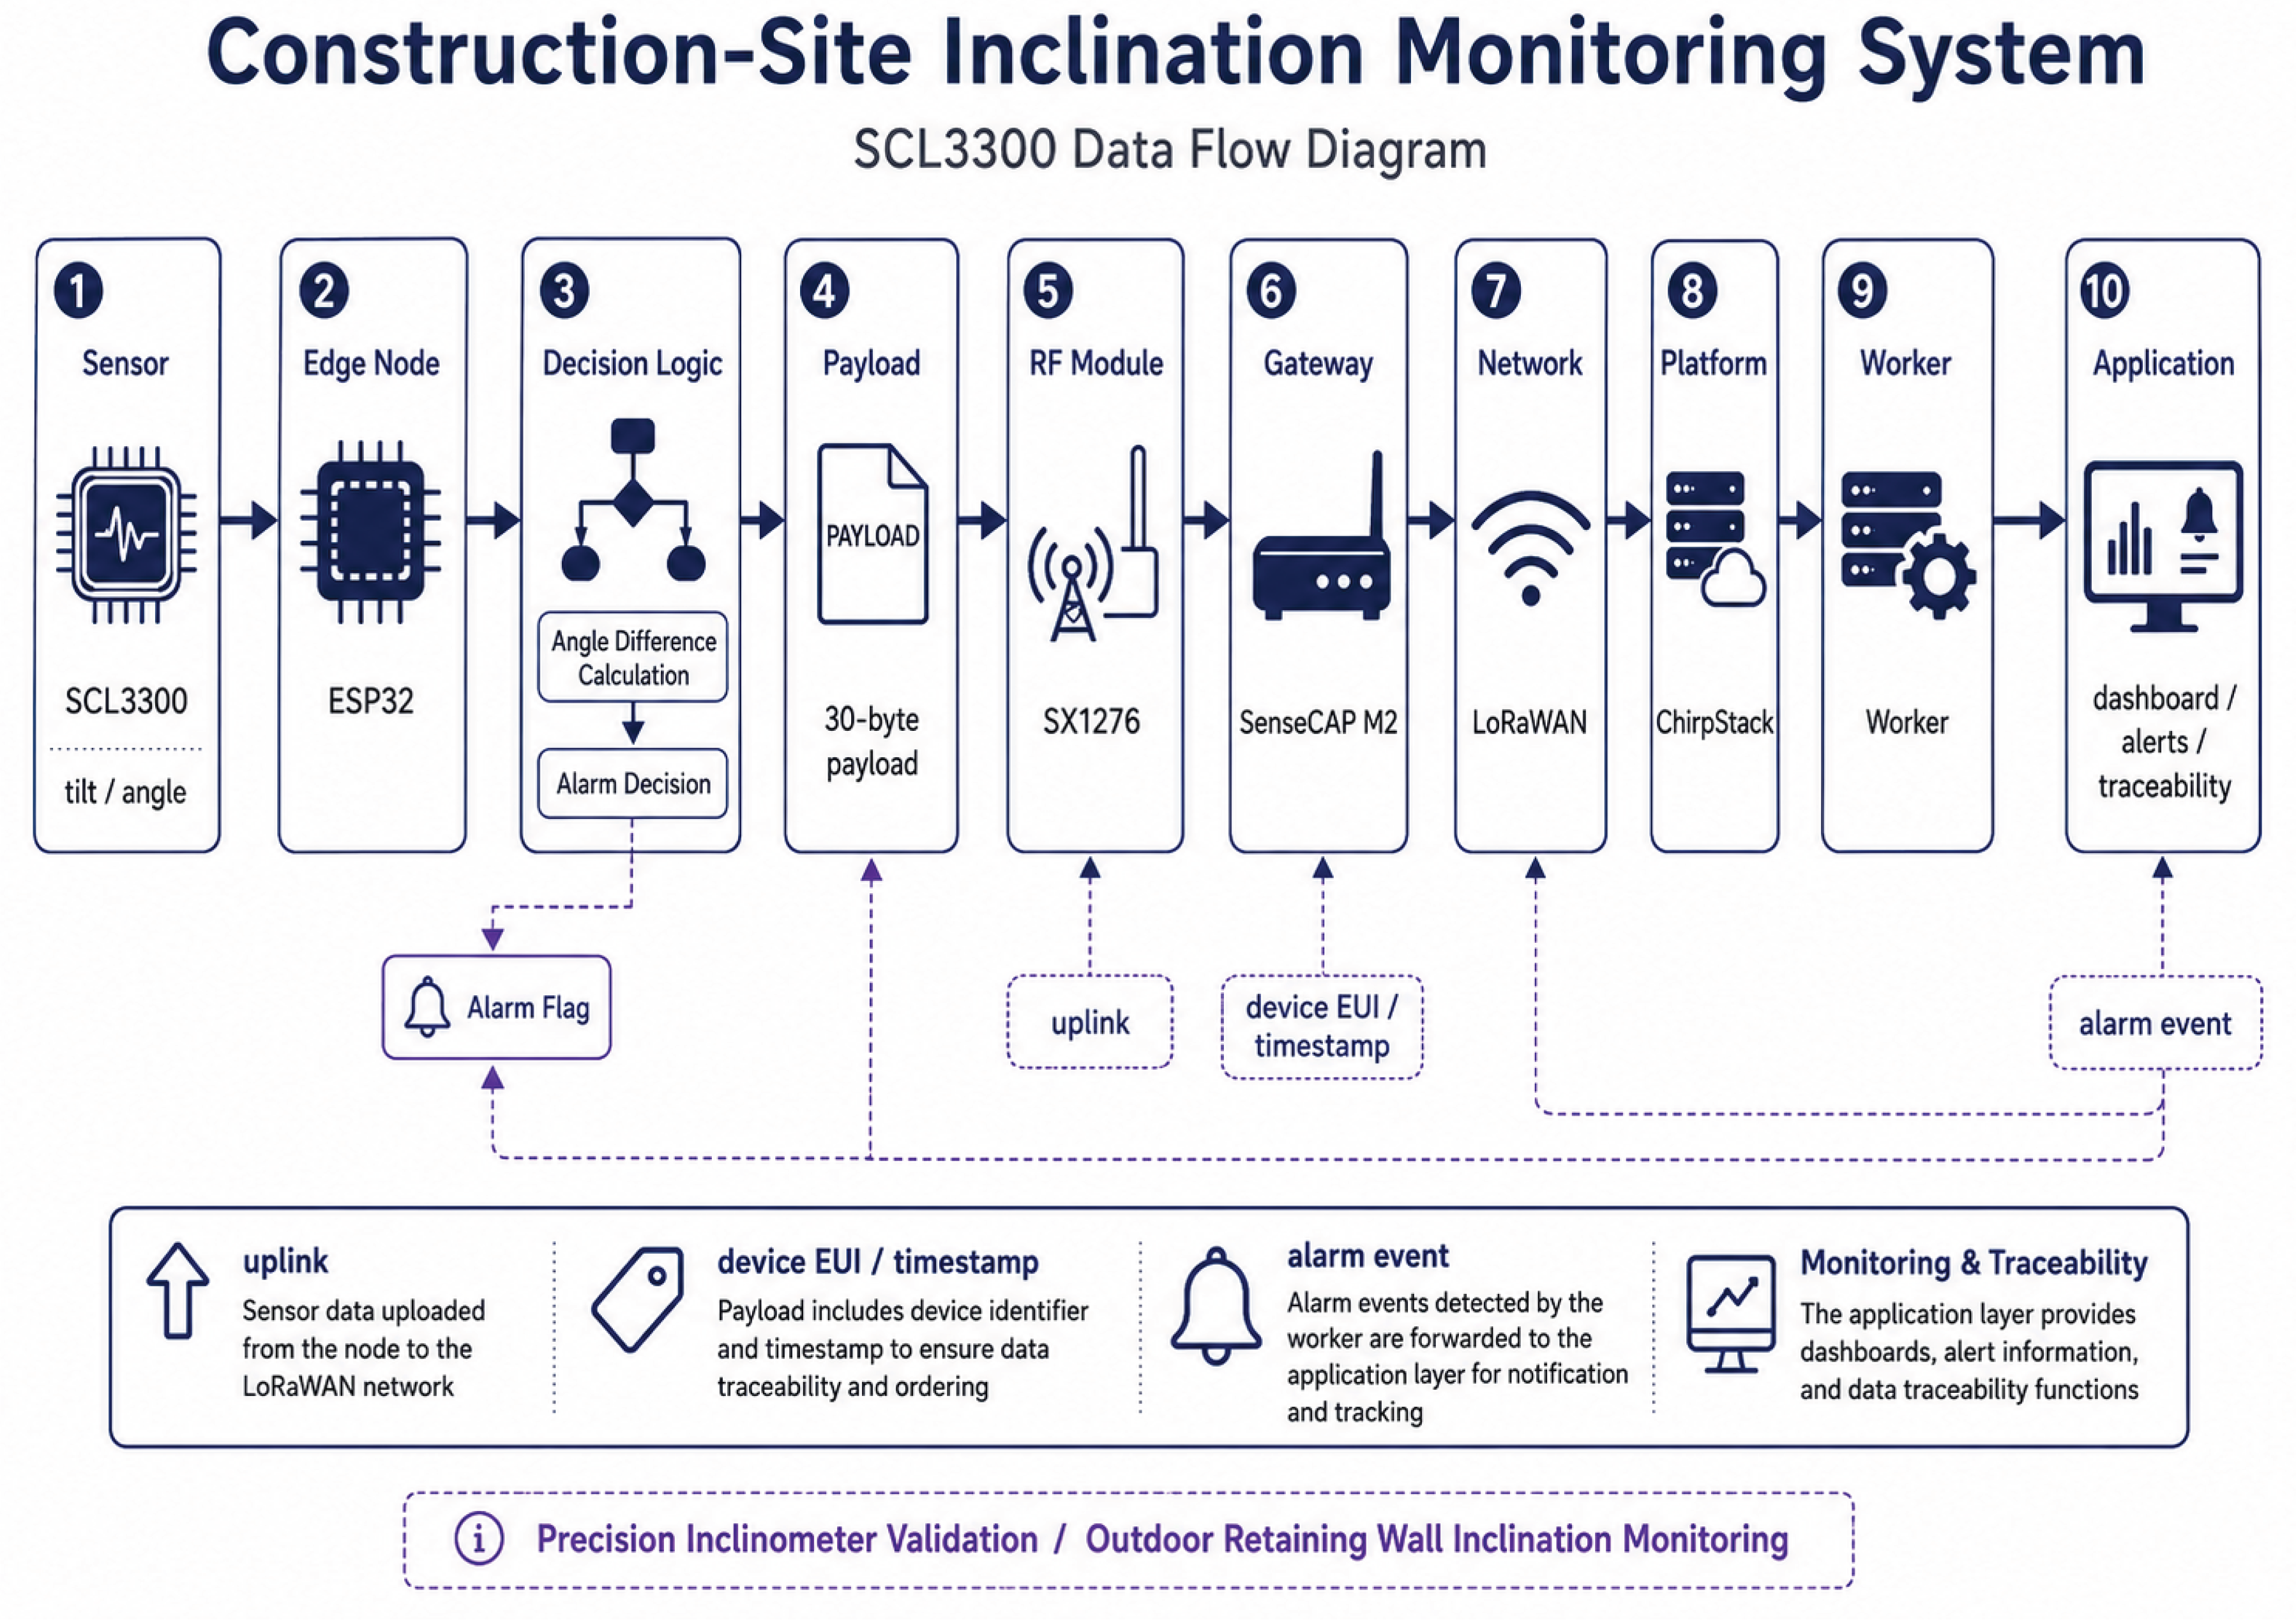
Figure 6.
ADXL355 accelerometer recovery rate over four disconnection trials.
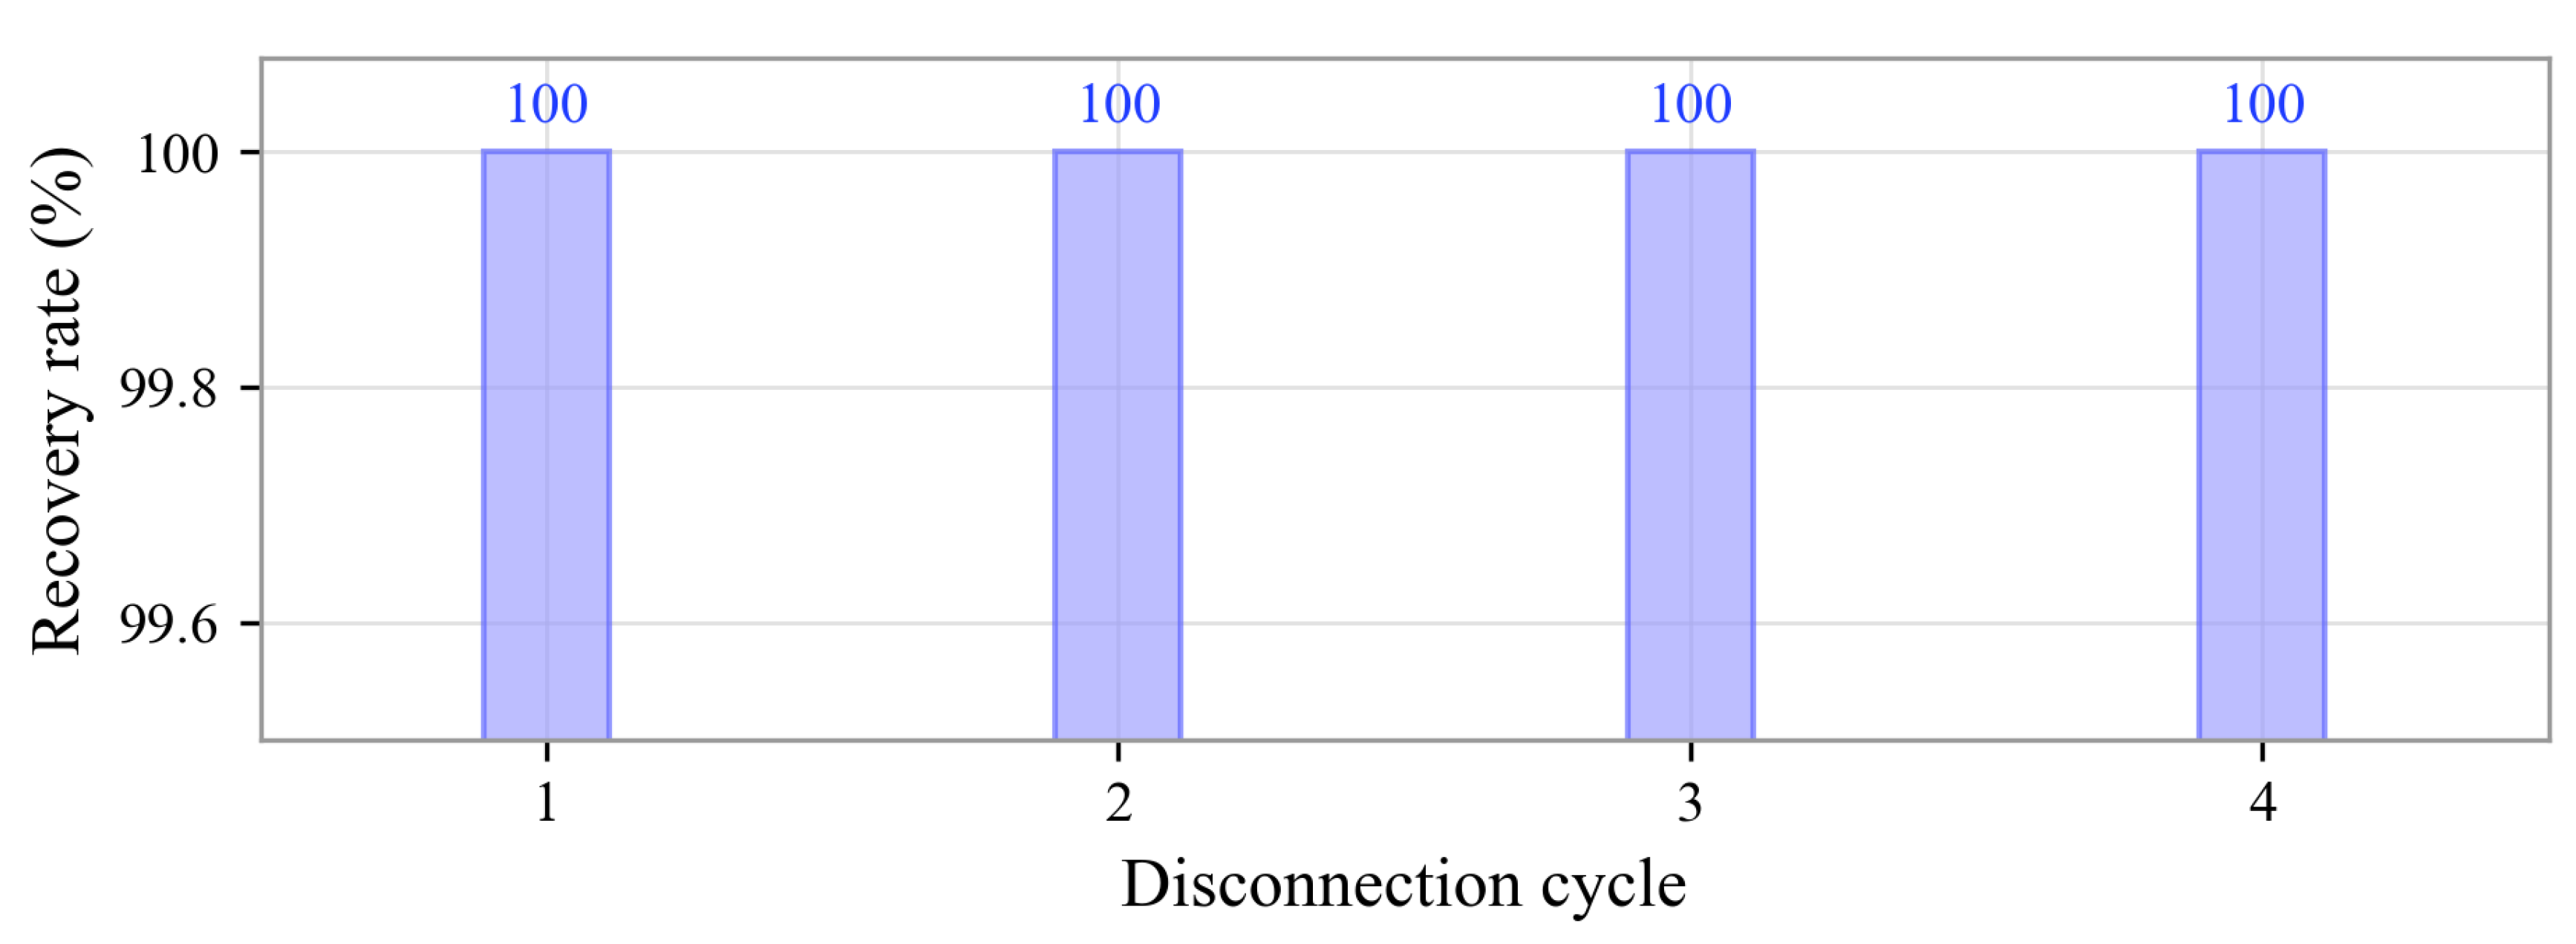
Figure 7.
Welch PSD comparison plots before and after the MCU-side 10 Hz second-order Butterworth low-pass filter.
Figure 7.
Welch PSD comparison plots before and after the MCU-side 10 Hz second-order Butterworth low-pass filter.
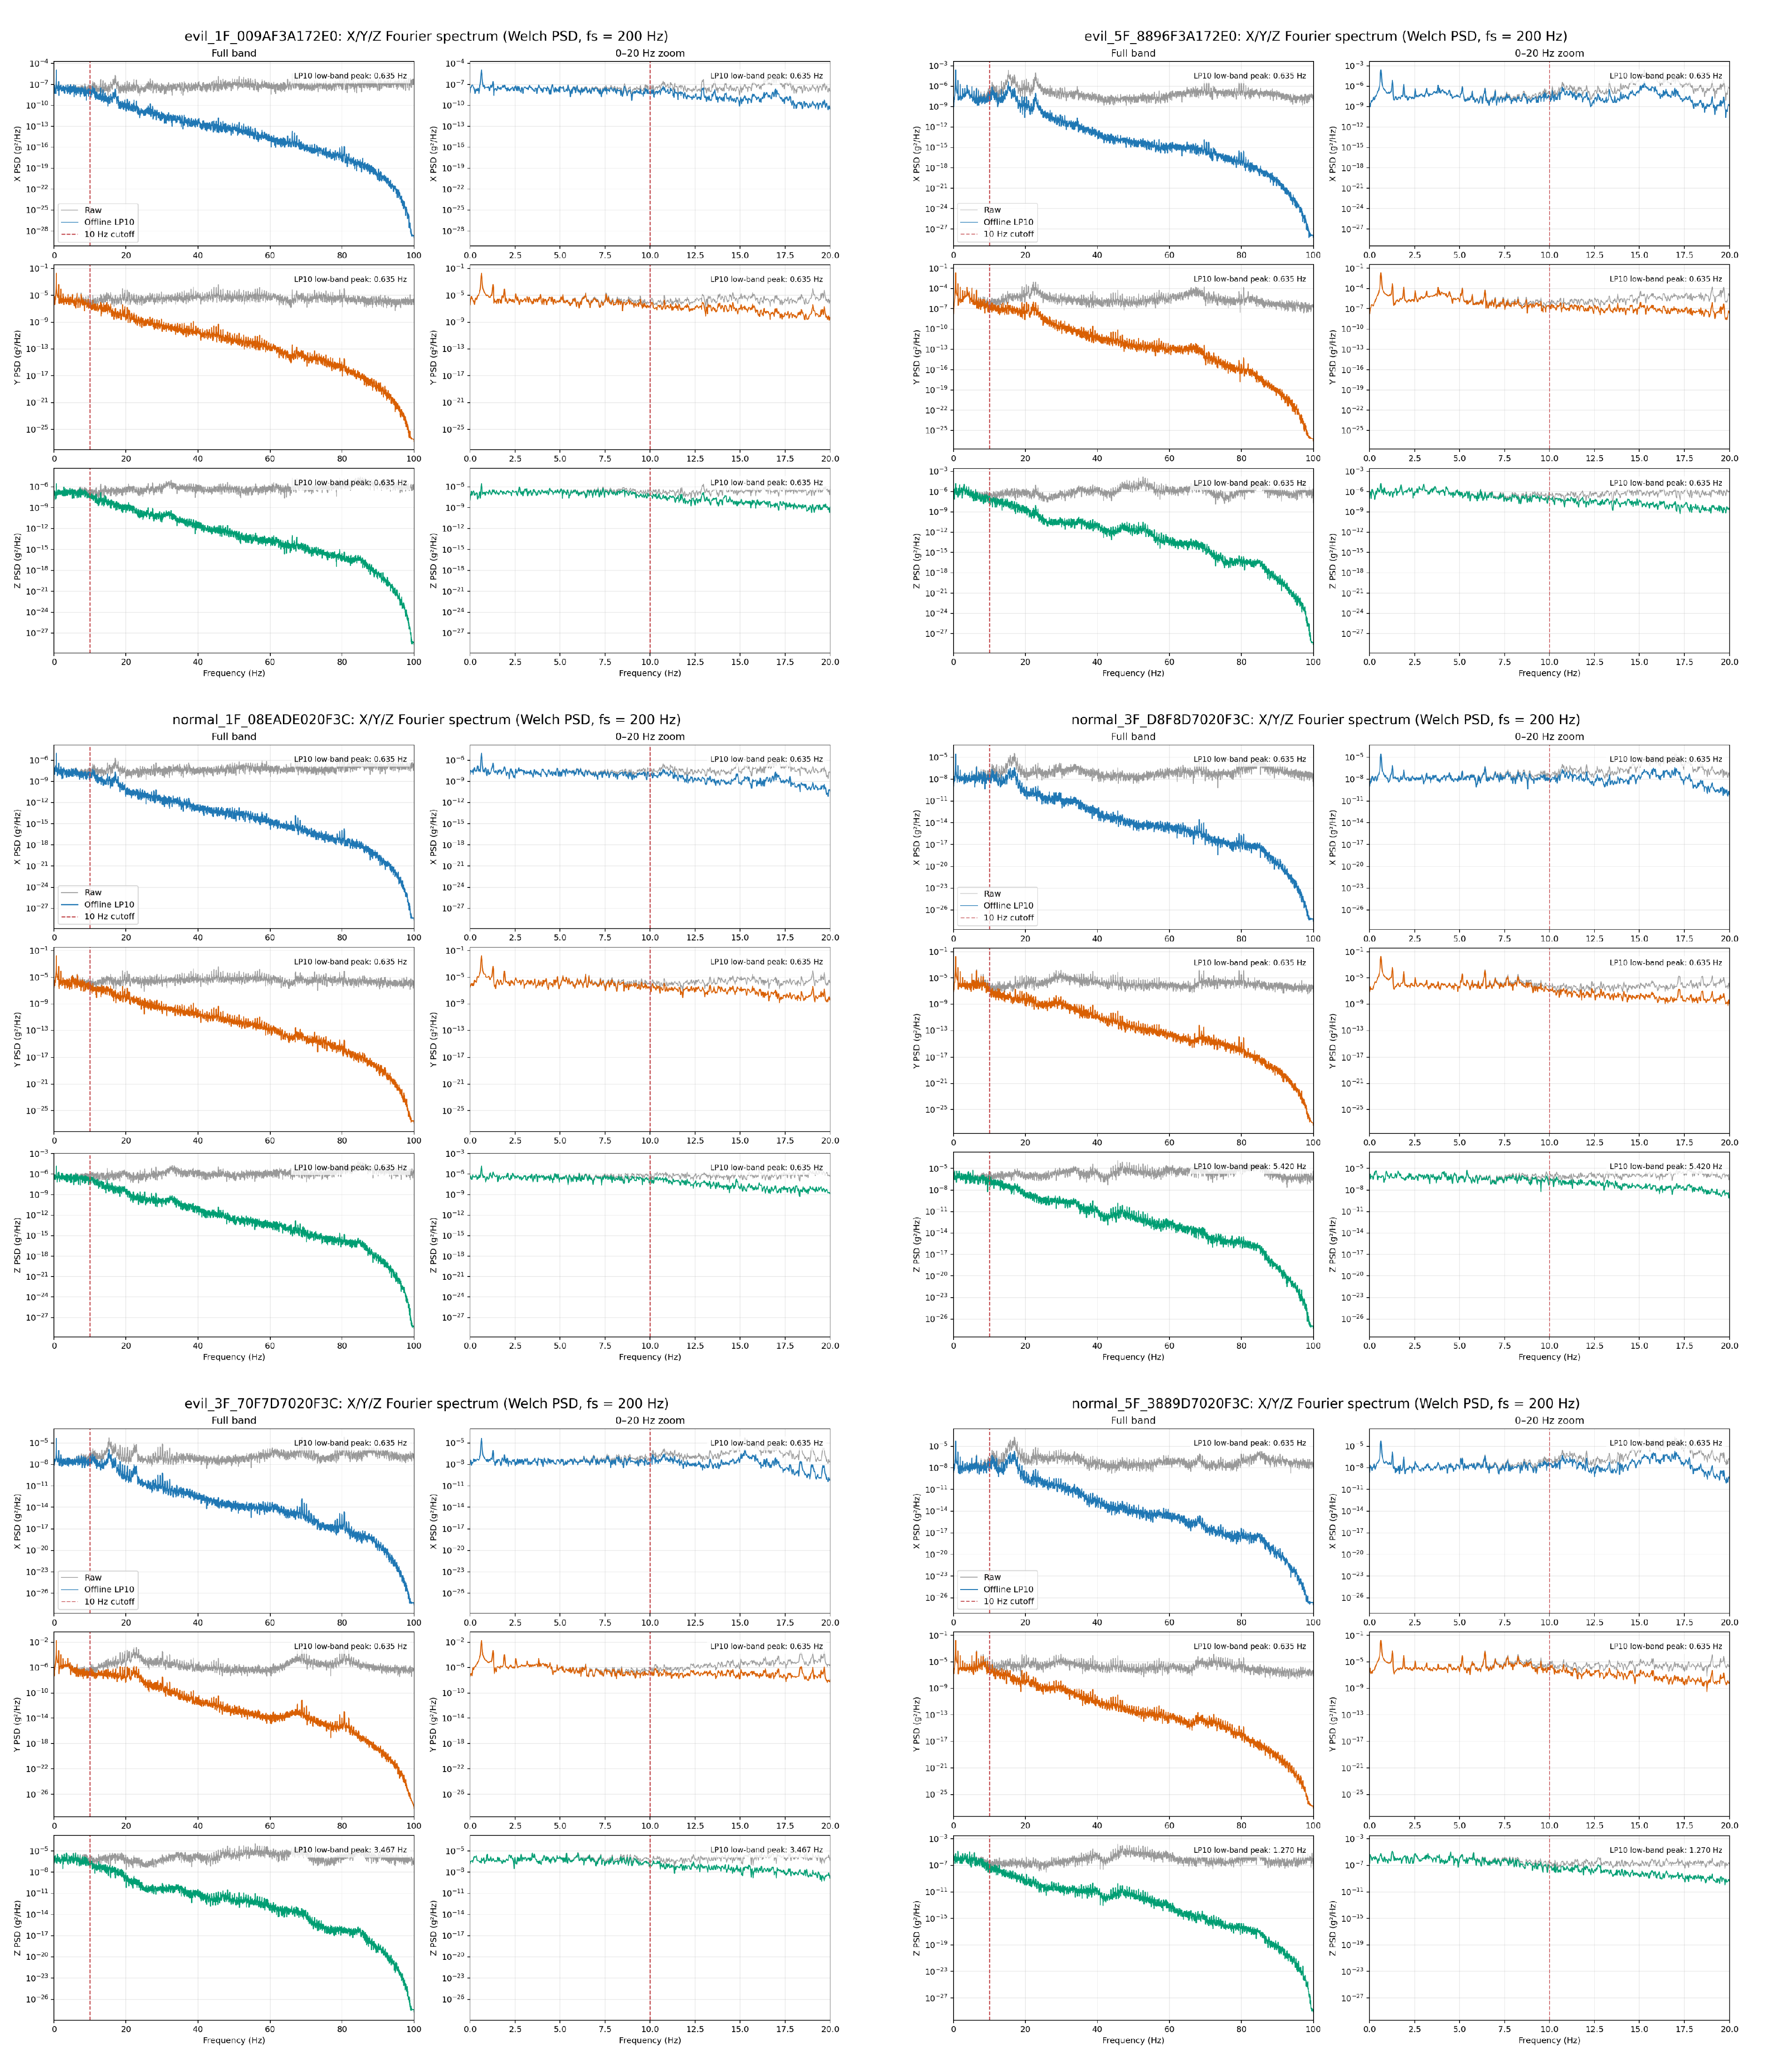
Figure 8.
Median angle differences at each stage of the 25 trials.
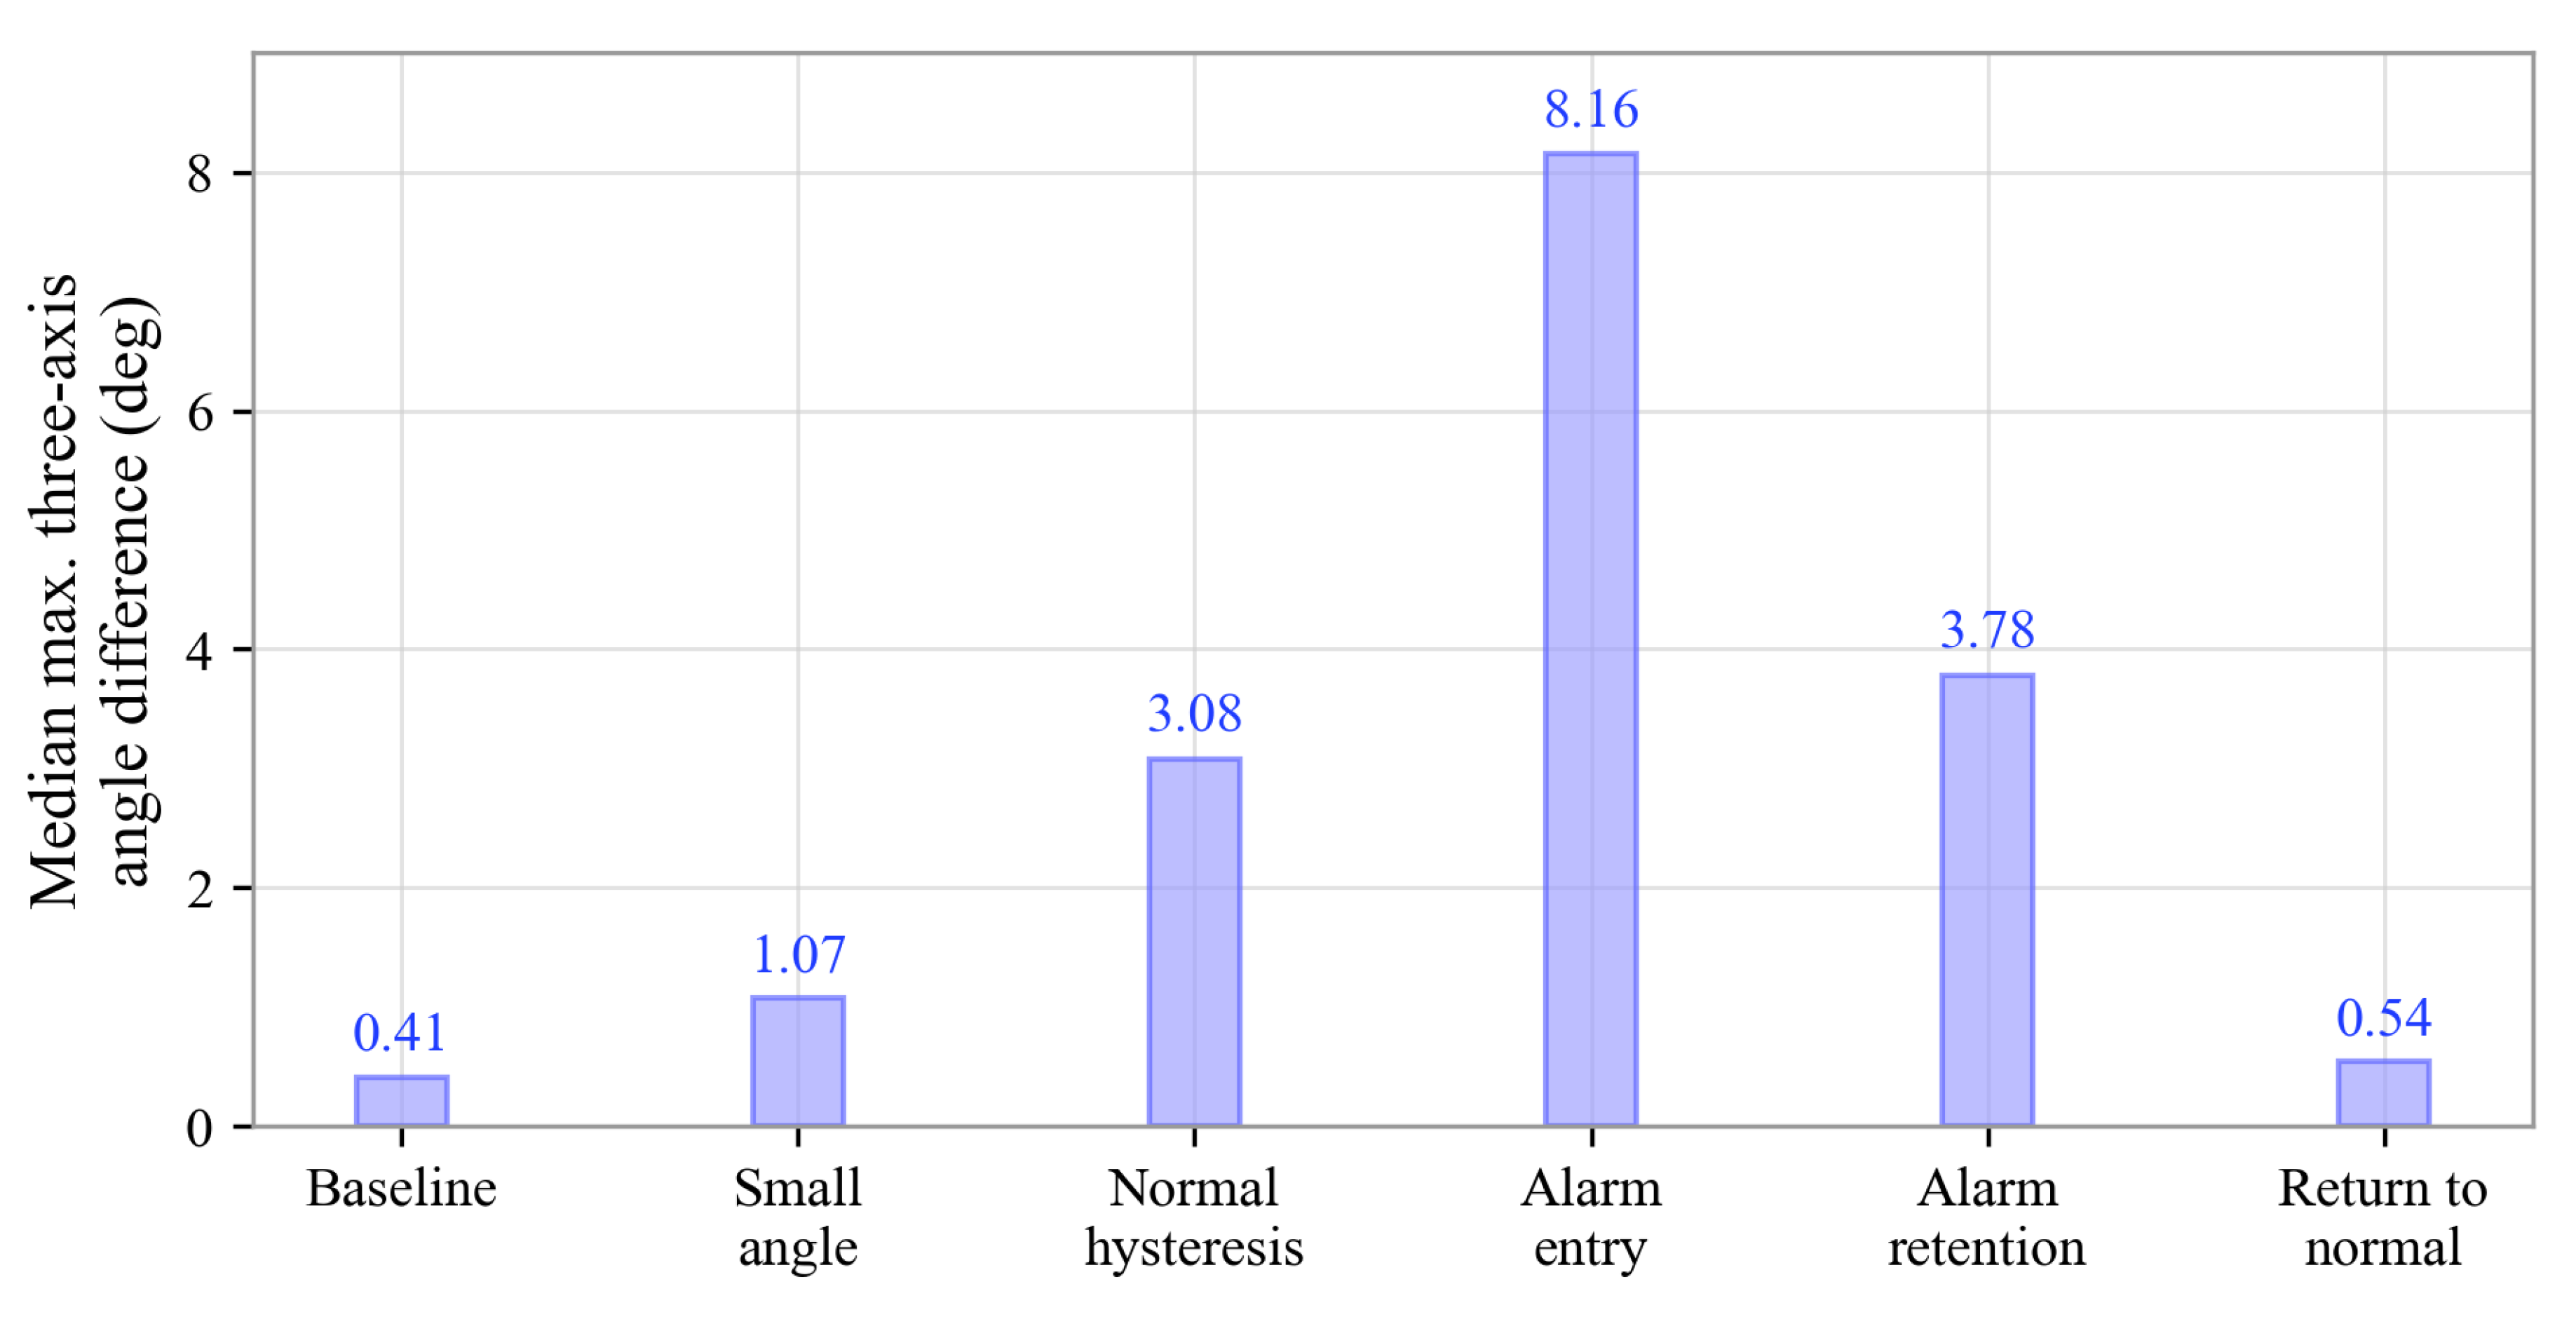
Table 2.
SCL3300 inclinometer uplink payload.
| Offset | Length | Type | Scale | Field |
|---|---|---|---|---|
| 0 | 2 | int16 BE | accX | |
| 2 | 2 | int16 BE | accY | |
| 4 | 2 | int16 BE | accZ | |
| 6 | 2 | int16 BE | angleX | |
| 8 | 2 | int16 BE | angleY | |
| 10 | 2 | int16 BE | angleZ | |
| 12 | 2 | int16 BE | temperature | |
| 14 | 2 | int16 BE | delta accX | |
| 16 | 2 | int16 BE | delta accY | |
| 18 | 2 | int16 BE | delta accZ | |
| 20 | 2 | int16 BE | delta angleX | |
| 22 | 2 | int16 BE | delta angleY | |
| 24 | 2 | int16 BE | delta angleZ | |
| 26 | 2 | int16 BE | battery voltage | |
| 28 | 1 | uint8 | 1 | battery percentage |
| 29 | 1 | uint8 | 1 | status flags |
Table 3.
24-hour sampling results of ADXL355 accelerometer nodes.
| Sensor ID | Actual received data records | Relative to theoretical data count |
|---|---|---|
| 009AF3A172E0 | 17,280,000 | 100% |
| 08EADE020F3C | 17,280,000 | 100% |
| 3889D7020F3C | 17,280,000 | 100% |
| 70F7D7020F3C | 17,280,000 | 100% |
| Total | 69,120,000 | 100% |
Table 4.
ADXL355 accelerometer network-disconnection recovery results.
| Round | Expected records | Actual records | src=flash | src=live | Recovery rate |
|---|---|---|---|---|---|
| 1 | 13,400 | 13,400 | 13,040 | 360 | 100% |
| 2 | 12,960 | 12,960 | 12,520 | 440 | 100% |
| 3 | 13,160 | 13,160 | 12,840 | 320 | 100% |
| 4 | 12,680 | 12,680 | 12,440 | 240 | 100% |
| Total | 52,200 | 52,200 | 50,840 | 1,360 | 100% |
Table 5.
SCL3300-D01 inclinometer X- and Y-axis angle validation results.
| Metric | Result |
|---|---|
| X-axis included runs | 5 |
| Number of specified-angle stationary measurement points | 50 |
| Reference angle range | -14.6 to +18.9 degrees |
| X-axis RMSE | 0.189 degrees |
| X-axis maximum absolute error | 0.443 degrees |
| X-axis average of within-angle-point standard deviations | 0.059 degrees |
| Y-axis included runs | 5 |
| Y-axis specified-angle stationary measurement points | 64 |
| Y-axis reference angle range | -16.1 to +14.7 degrees |
| Y-axis MAE / RMSE | 0.360 / 0.422 degrees |
| Y-axis maximum absolute error | 0.829 degrees |
| Y-axis slope / | 1.001 / 0.9987 |
| Y-axis signed mean error | +0.294 degrees |
| Y-axis average of within-angle-point standard deviations | 0.060 degrees |
Table 6.
SCL3300-D01 inclinometer enlarged-threshold baseline-referenced rule-based hysteresis state-machine result.
Table 6.
SCL3300-D01 inclinometer enlarged-threshold baseline-referenced rule-based hysteresis state-machine result.
| Metric | Result |
|---|---|
| Included rounds | 25 trials |
| Completed state-transition trials | 25 trials |
| Checkpoint pass count | 150 / 150 |
| Alarm and recovery accuracy | 100% |
| Median time from ALARM marker to state switching | 0.313 s |
| Median time from NORMAL marker to state switching | 0.235 s |
Table 7.
Current SCL3300-D01 inclinometer LoRaWAN data result.
| Metric | Result |
|---|---|
| FCnt range | 728–892 |
| Total frames | 165 |
| 30-byte general data frames | 154 |
| Periodic device status confirmation frames | 11 |
| Observed PDR | 100% |
| Median RSSI | -19 dBm |
| Median SNR | 12 dB |
| Codec all-field correctness rate | 100% (actual correct 100 sets / expected comparison 100 sets) |
Disclaimer/Publisher’s Note: The statements, opinions and data contained in all publications are solely those of the individual author(s) and contributor(s) and not of MDPI and/or the editor(s). MDPI and/or the editor(s) disclaim responsibility for any injury to people or property resulting from any ideas, methods, instructions or products referred to in the content. |
© 2026 by the authors. Licensee MDPI, Basel, Switzerland. This article is an open access article distributed under the terms and conditions of the Creative Commons Attribution (CC BY) license (http://creativecommons.org/licenses/by/4.0/).
Copyright: This open access article is published under a Creative Commons CC BY 4.0 license, which permit the free download, distribution, and reuse, provided that the author and preprint are cited in any reuse.