Preprint
Article

This version is not peer-reviewed.

Study of the Gas-Phase Pyrolysis of N‑aryl‑3‑Oxobutanamides and the 2‑aryl Hydrazone Derivatives: A Novel Computational Approach Including DFT with Multivariant Analysis

A peer-reviewed version of this preprint was published in:
Molecules 2026, 31(18), 3201. https://doi.org/10.3390/molecules31183201

Submitted:

16 August 2026

Posted:

18 August 2026

You are already at the latest version

Abstract

In this work, we carried out a computational study of the gas-phase thermal decomposition of N‑aryl‑3‑oxobutanamides (β-ketoamides) and the 2‑arylhydrazone derivatives. We performed calculations using density functional theory (DFT) at B97D‑GD3BJ/deft2tzvp level, with multivariant analysis including descriptors of global reactivity, e.g., ionization energy (I), electron affinity (A), molecular hardness (η) and electrophilicity (ω). The objective was to elucidate the reaction mechanism. To this end, we modeled the structures of reactants, transition states and products and studied the effect of substituents on the N-aryl and the 2-aryl aromatic ring on the energy of activation. The synchronicity of the process and the nature of non-covalent interactions were studied to gain insight into the reactivity and selectivity of these molecules. We examined the reactivity of 2-arylhydrazone derivatives, which show reaction rates about three orders of magnitude slower than the parent β-ketoamide. We evaluated two competing mechanisms involving cyclic transition states of six and four members. This study included electronic descriptors, e.g., NBO analysis, IGM/IBSI, Wiberg bond indexes, and intrinsic reaction coordinate calculations (IRC). We introduce a new descriptor, Dynamic Synchronicity, SyD, for mechanistic and kinetic characterization. To the best of our knowledge, this work is the first comprehensive theoretical study of the system ketoamide/aryl hydrazone. Multivariate statistical methods, i.e., principal component analysis (PCA) and hierarchical cluster analysis (HCA), are useful tools for the selection of the atoms involved in the transition states.
Keywords: 
;  ;  ;  ;  ;  

1. Introduction

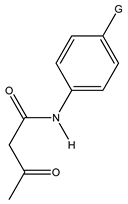
N-aryl-3-oxobutanamides (β-ketoamides), Scheme 1, are versatile building blocks defined by an aryl group attached to the amide nitrogen and a ketone group at the beta position. They are widely used as intermediates in organic synthesis and pharmaceutical research.
In the industry, β-ketoamides have been used as precursors of aromatic isocyanates, which are intermediates in the synthesis of polyurethanes, surface coatings, adhesives, and polymer foams [1,2,3]. Thermal stability control and decomposition pathways of β-ketoamides precursors are critical for optimizing synthesis processes and the stability of final materials [4,5].
The structural motif β-ketoamide is found in the pharma industry [6], agrochemicals [7], and functional materials [8]. The study of thermal stability contributes to the understanding of degradation pathways, storage conditions, and industrial safety [9,10]. Ketoamides are model systems to study electronic and structural factors and the impact of the thermal stability of nitrogenated carbonyl compounds [11].
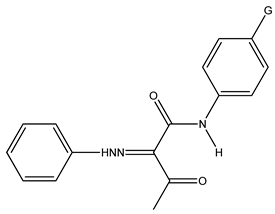
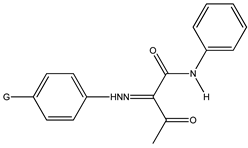
Arylhydrazone derivatives (Scheme 1b) possess a functional group present in medicinal chemistry [12,13], supramolecular chemistry [14], and molecular sensors [15,16]. Hydrazones have been used as units of molecular recognition, chemical switches, and synthesis precursors. Arylhydrazone derivative systems allow exploration of the impact of intermolecular interactions, stereoelectronic effects and electron density distribution on the stability and kinetics of reactions [14,17,18,19].
Gas-phase pyrolysis reactions are systems of interest because they are unimolecular processes, solvent-free and catalysis-free. These characteristics allow us to analyze the intrinsic reactivity of molecules, which depends only on the molecular structure, and study substituent effects without influences from the media or external agents [20,21,22].
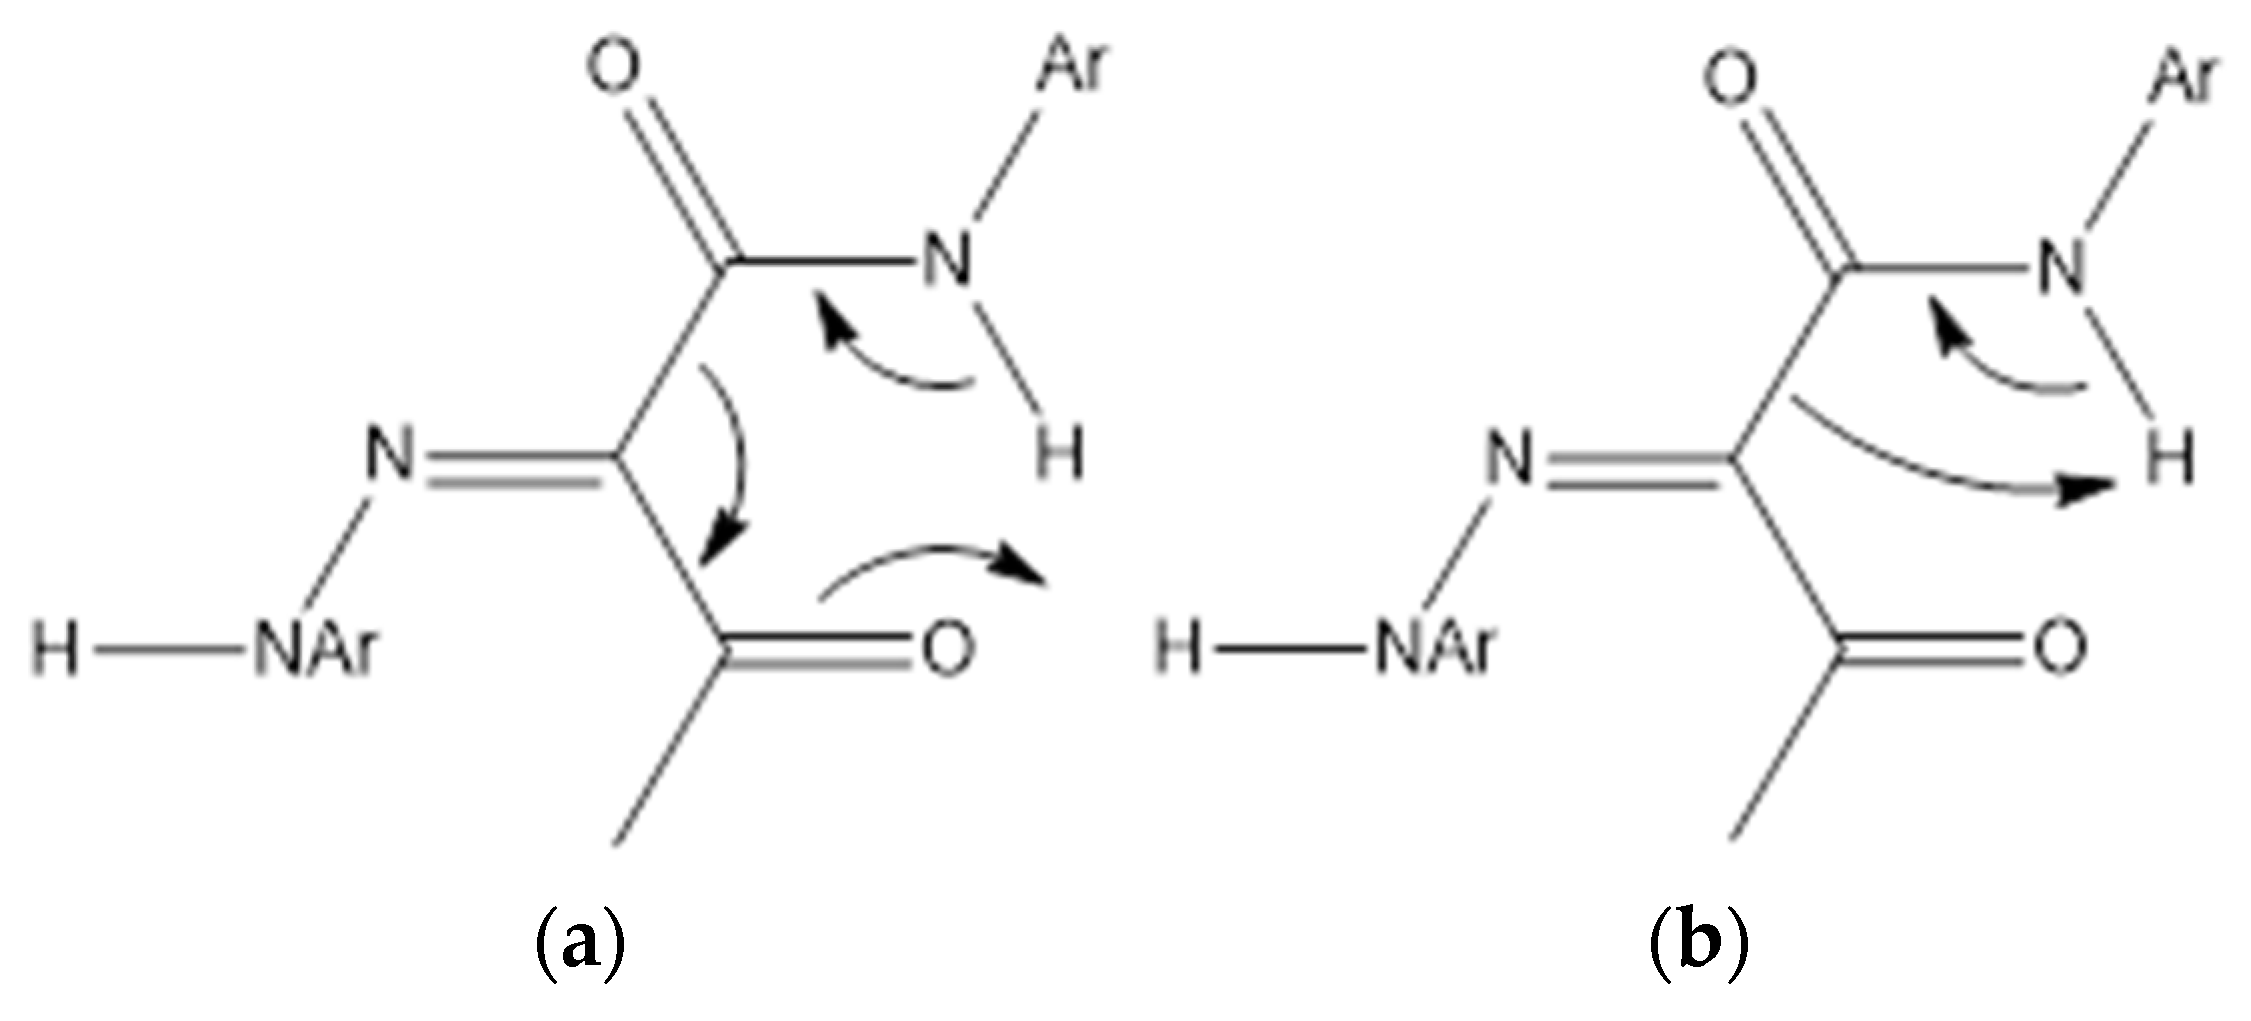
The proposed mechanism for the thermal decomposition of β-ketoamides and thiones is an asynchronous concerted process. This mechanism proceeds through a cyclic six-member ring transition state (TS), depicted in Scheme 2a.
The proposed concerted asynchronous mechanism illustrated in Scheme 2a, involves the intramolecular proton transfer from the N-H group to the photophilic carbonyl oxygen (C=O), leading to the molecular fragmentation [23]. The proton transfer occurs in a concerted asynchronous fashion. The fragmentation reaction forms an aryl isocyanate (O=C=N-Ar) and a ketone or its tautomer. The cyclic transition state proposed is supported by previous theoretical studies in similar systems, and it is consistent with the typical kinetic parameters of polar unimolecular reactions [24,25,26,27]. Scheme 2 also provides a four-path mechanism to evaluate the competing reaction pathways. We carried out a comprehensive computational study to characterize the energetic profiles and electronic properties of the two competing reaction pathways.
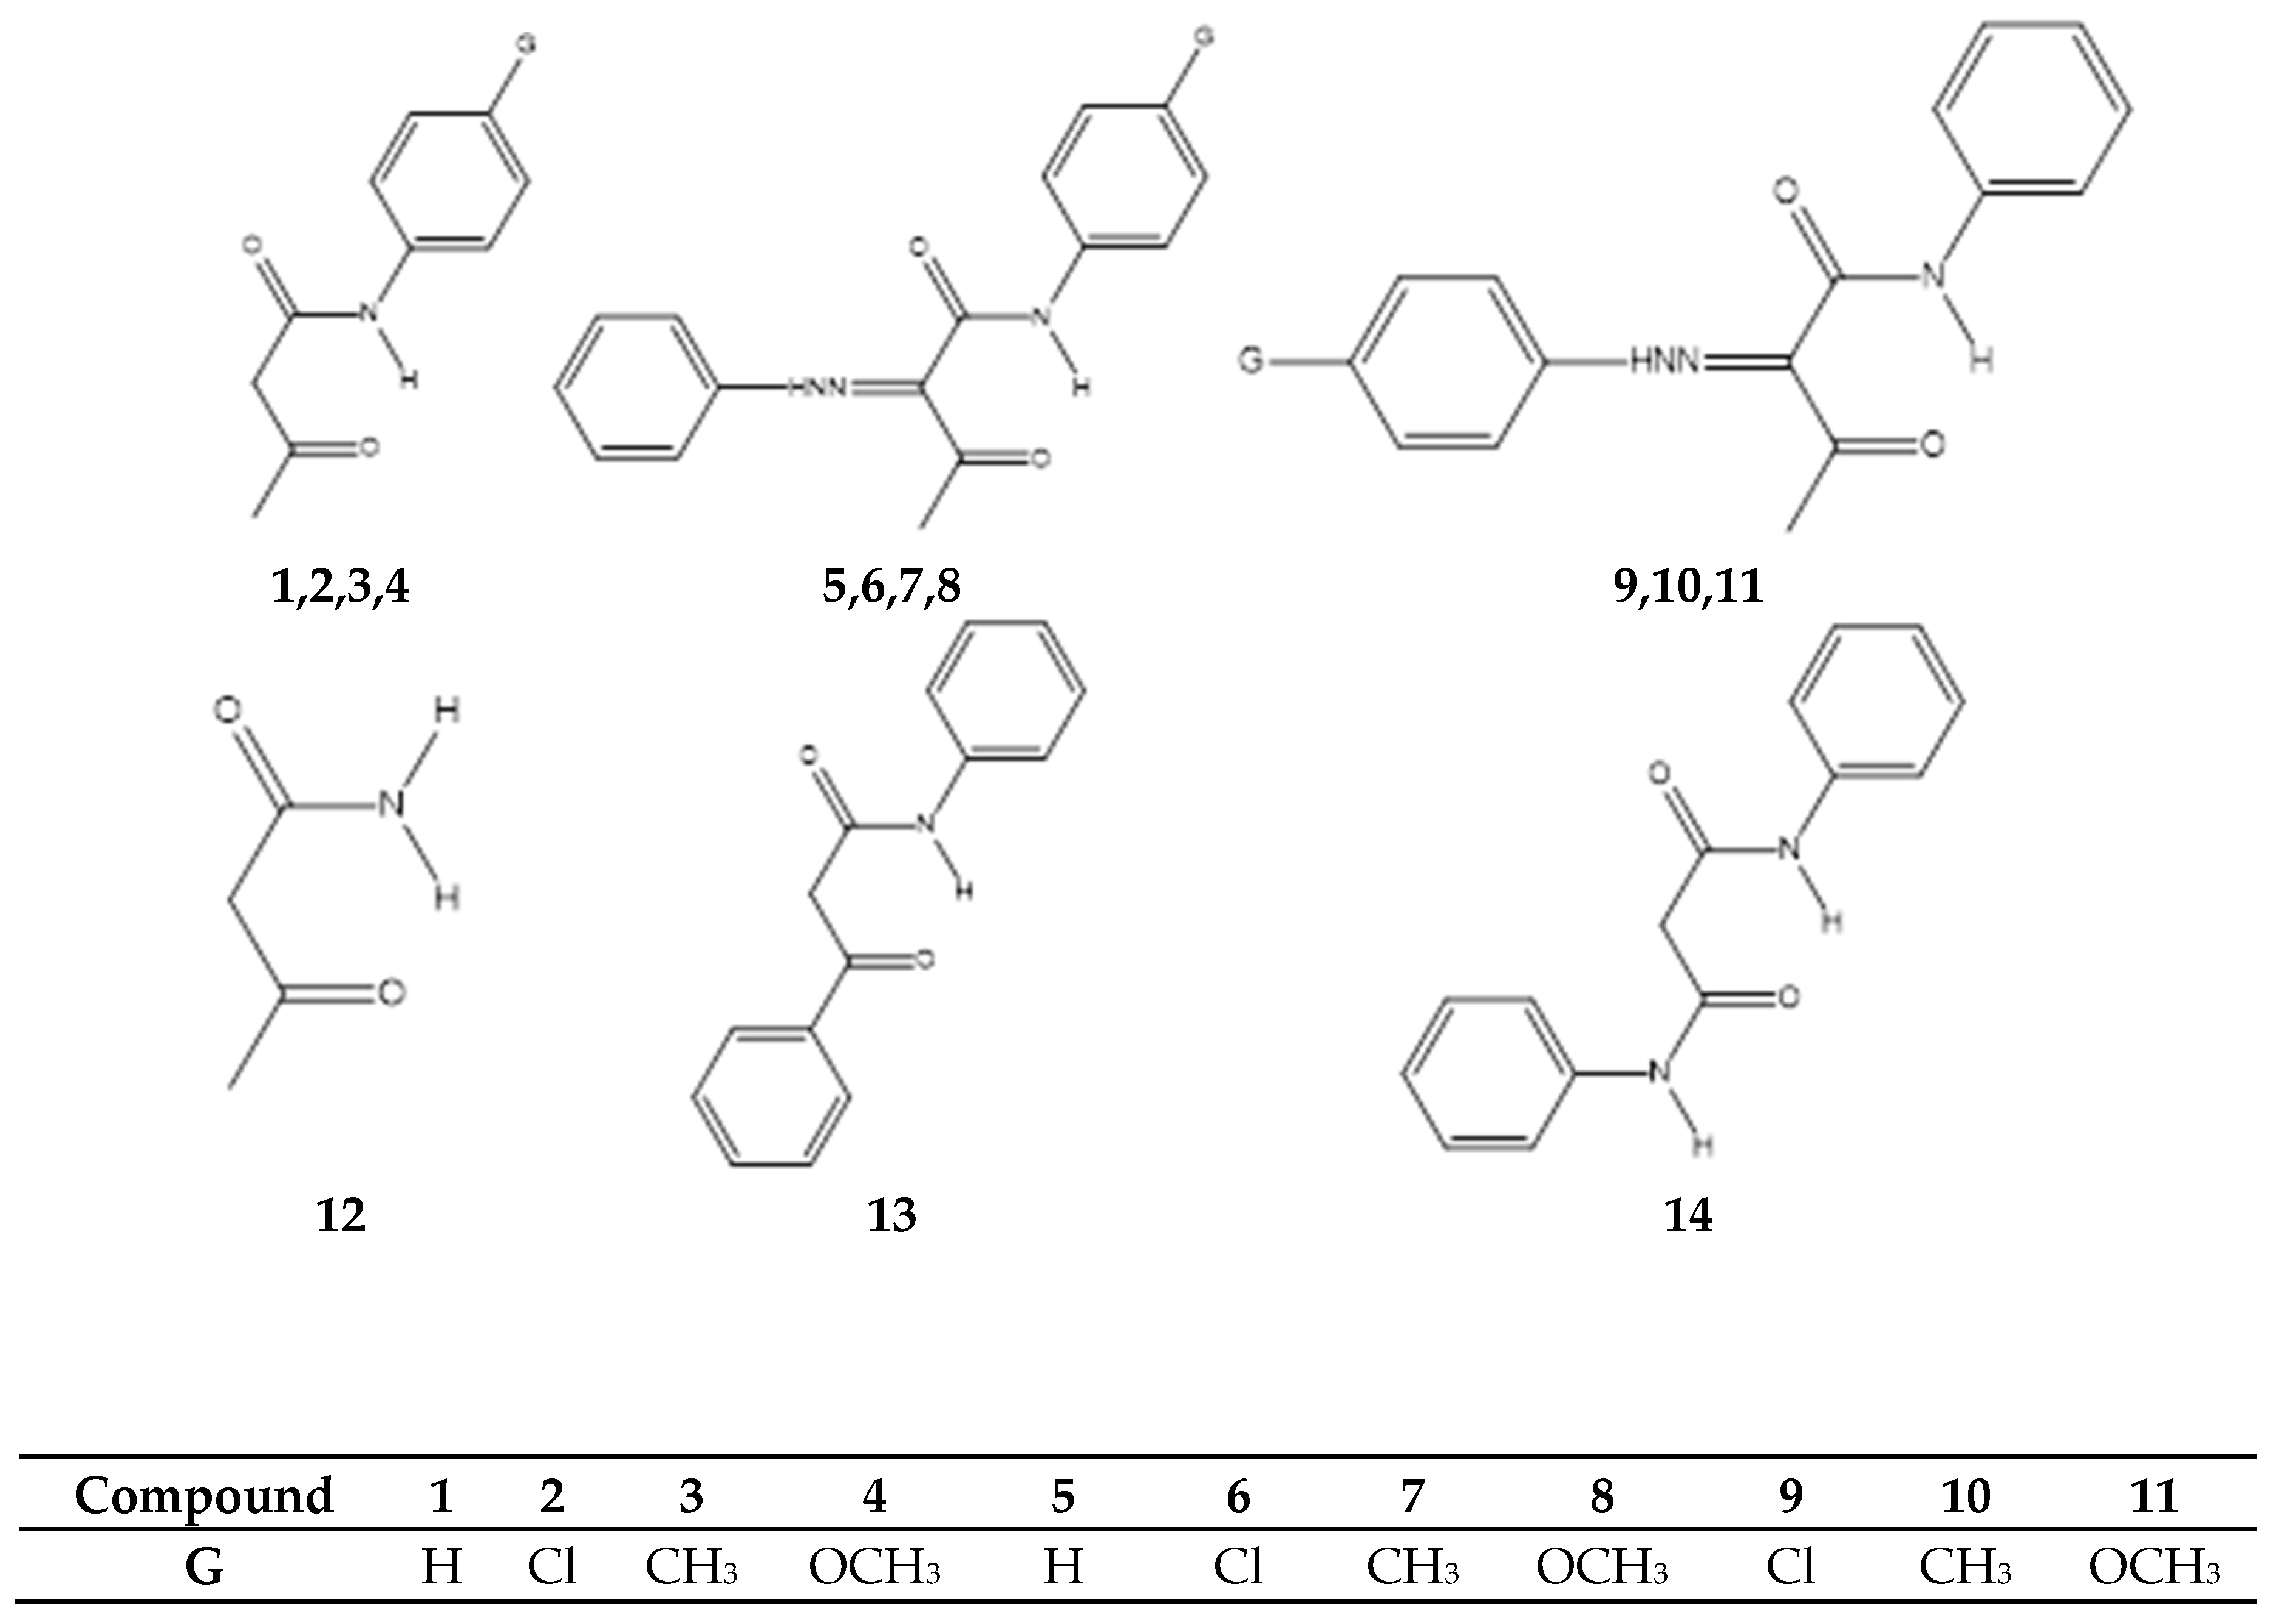
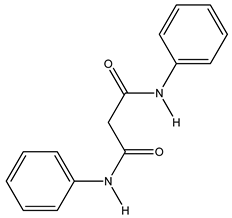
An experimental work by Malhas et al [23] studied the pyrolysis of fourteen N-aryl β-ketoamides and 2-arylhydrazo derivatives. The kinetic parameters reported (Table 1), show a great difference in reactivity: the arylhydrazone derivatives (compounds 5–11) are over 1,000 times less reactive than the parent ketoamides (compounds 1-4, 12-14), Scheme 3.
Arrhenius parameters for β-ketoamides are, on average, log A (s-1) = 12.0 ± 2.0 and Ea = 119.2 ± 17.0 kJ mol-1. Arrhenius parameters for arylhydrazone derivatives are log A (s-1) = 13.0 ± 0.7 and significatively larger energies of activation, Ea = 157.5 ± 8.6 kJ mol-1.
The Arrhenius parameter, log A is related to the entropy of activation. Larger values of log A are associated with more positive entropies of activation, implying less ordered and higher conformational flexibility transition states.
In reactions with cyclic transition states mechanisms, the ring size impacts the entropy of activation ΔS. Small rings, e.g., four-member cyclic transition states are constrained, conformationally restricted, and are associated with significantly negative ΔS and low log A values, typically between 10-12. Larger cyclic transition states, e.g., six-member rings, are more flexible, have more rotational freedom and are associated with less negative ΔS, and consequently larger Log A values, between 12 -14.
Malhas et al, reported log A values 12 for β-ketoamides and 13 for arylhydrazones, consistent with a cyclic six-member transition state mechanism. The difference suggests that the transition state for arylhydrazone thermal decomposition is more flexible, less ordered than the transition state for β-ketoamides.
To explain the difference, Malhas et. al. suggested that for arylhydrazone derivatives, both the hydrazone nitrogen (N-H) and the amide hydrogen could interact with the protophilic oxygen of the carbonyl group. To the best of our knowledge, the proposed mechanisms have not been validated by comprehensive theoretical studies, and the factors that govern this competition, e.g., electronic and stereoelectronic factors, relative acidity of the proton in the amide N-H and hydrazone groups, protophilicity of the carbonyl oxygen, polarity of bonds, and the role of non-covalent intramolecular interactions have not been described.
Density functional theory methods (DFT) have consolidated as an important tool to study gas-phase reaction mechanisms, allowing the characterization of transition states, calculation of activation energies and evaluation of electronic effects, with adequate precision and low computational costs [28,29]. DFT studies of unimolecular pyrolysis have been shown to reproduce experimental kinetic parameters, allowing the validation of proposed mechanisms [30,31].
Previous computational works studied the thermal decomposition of systems with similar structural motifs, e.g., β-ketoesters [32], thionamides [33], and other functionalized amides [34]. These works proposed cyclic six-membered transition states for the thermal decomposition and highlight the role of an intramolecular proton transfer in the C-N bond breaking. The methods include range-separated DFT calculations [35].
Natural Bond Orbital (NBO) methods have been used extensively to quantify the electronic redistribution and donor-acceptor interactions in transition states of elimination reactions [36]. Wiberg indexes provide effective bond orders and have been used to evaluate the advance in the reaction coordinate and synchronicity of concerted reactions [37].
In this work, we use Principal Component Analysis (PCA) to determine the stereoelectronic factors in the gas-phase pyrolysis of N-aryl-3-oxobutanamides (β-ketoamides) and the 2-arylhydrazone derivatives. We propose the utilization of the synchronicity parameter along the reaction coordinate, from reactants to products, introducing a new descriptor, dynamic synchronicity, SyD.
In addition, we used the Independent Gradient Model (IGM) to visualize and characterize non-covalent interactions that can contribute to stabilizing or destabilizing reactive geometries [38].
The computational protocol in this work includes optimization of geometries with DFT functionals with dispersion corrections, energy calculations with extended basis sets, NBO analysis, IGM and IRC calculations. This methodology has been used in similar mechanistic studies [39]. This study aims at validating (or disproving) the transition state proposed in the experimental study by Malhas et al., and the quantification of electronic and stereoelectronic factors which contribute to the observed difference in reactivity between β-ketoamides and arylhydrazone derivatives.

2. Computational Level of Theory

Initially, we used HCTH407[40] for the series HCTH147, HCTH93, and HCTH [41], B97D3[42], B97D[43], X3LYP[44], B3LYP[45], CAM-B3LYP[46], with several basis sets to determine the best combination consistent with experimental activation energies. These methods are listed in table S1, in the supporting information.
We selected B97D3 and B97D functionals. B97D is a dispersion-corrected semi-local density functional (GGA) used in computational chemistry developed by Stefan Grimme to model large molecular systems, organic structures, and non-covalent van der Waals interactions. The functional B97D with the def2TZVP basis set [47] offered the best results combining precision and computational cost. For example, calculated ΔH (~122–123 kJ/mol) and ΔG (~126 kJ/mol) are closer to the experimental values (ΔH ≈ 116 kJ/mol and Ea 116.1 ± 4 kJ/mol). The basis set def2TZVP yields entropies ΔS ≈ -7 J/K mol, indicating that the functional/basis set B97D with def2TZVP is adequate to study the systems in this work, avoiding the cost of the use of larger basis sets. For example, def2TZVP affords comparable results with 6311G-++(2df,2pd), at a lower computational cost. We utilized SPARTAN26 and GAUSSIAN16 computational software [48,49].

3. Computational Methods

3.1. Calculation of Thermodynamic and Kinetic Parameters

Thermodynamic parameters were obtained from vibrational frequency calculations. Gibbs free energy values were calculated at 450 K and 1 atm, conditions used in the experimental work. Free energy of activation was obtained from:
Δ G = G T S G R e a c t i v o s
We calculated Δ H and Δ S in similar fashion, equation /1/. Rate constants for the gas-phase unimolecular decomposition were estimated using Eyring’s equation, assuming a transmission coefficient, κ = 1 . All calculations were performed at the reported experimental temperature, allowing direct comparison with kinetic data [50].
k c a l c ( T ) = κ k B T h e x p ( Δ G R T )
We performed NBO analysis, Wiberg bond index, Independent gradient model (IGM) for non-covalent interactions, and Intrinsic Reaction Coordinate (IRC) calculations. The statistical multivariant model Principal Component Analysis (PCA/HCA) was used to correlate quantum electronic descriptors with experimental values [51,52].

3.2. Natural Bond Orbital Analysis (NBO)

We carried out NBO calculations on the optimized geometries of the reactant, transition state, and products [53]. From the NBO calculations, we obtained the atomic charges by natural population analysis (NPA). The redistribution of charges was analyzed along the reaction coordinate, focusing on the atoms involved in the proton transfer process, bond breaking and bond formation. Wiberg bond indexes ( W A B ), were calculated to determine the effective bond order between atom pairs and evaluate the reaction progress in the transition state.
The unimolecular pyrolysis reaction is concerted. To determine the synchronicity degree of this concerted process, we evaluated the evolution of Wiberg bond indexes along the Intrinsic Reaction Coordinate, IRC. We specifically analyzed the bond indexes involved in bond breaking (C-N, N-H) and bond formation (O-H), following the changes from reactant to products.
The degree of concertation of the pyrolysis mechanism will be assessed by analyzing the evolution of the Wiberg binding indices along the Intrinsic Reaction Coordinate (IRC). Bonds that are broken (C–N, N–H) and those that are formed (O–H) will be specifically analyzed, following their variation from reactants to products. Synchronicity index ( S y ) is calculated as [54]:
S y = 1 i = 1 n δ B i δ B v 2 ( n 1 ) δ B v
where δ B i is the change in bond index for bond i, between the reactant and transition state, and δ B v is the average change. An S y value close to 1 indicates a fully concerted, highly synchronous mechanism, whereas a value close to 0 indicates a fully asynchronous or stepwise process.
In this work, we determined the synchronicity value for each coupled pair among the reactant, transition state, and product. We proposed a new descriptor, “Dynamic Synchronicity”, SyD, evaluating the synchronicity value for each compound along the Intrinsic Reaction Coordinate, IRC profile. We studied thirteen stable structures, totaling 201 points each.
We studied the evolution of the synchronicity parameter along the reaction coordinate. The analysis of Sy along the IRC provides a dynamic perspective of the process, in contrast to the static view of conventional global descriptors. This novel approach to characterize the synchronicity of the mechanism at different stages of the process reveals characteristic patterns depending on the electronic nature of the substituents. This analysis is described in the results section.

3.3. Analysis of Non-Covalent Interactions

Topological analysis of the electron density (ED) allows obtaining local descriptors to characterize covalent and non-covalent interactions. The independent gradient model (IGM) method is used to identify, visualize, and quantify both covalent and non-covalent interactions within molecular systems by analyzing electron density gradients. It isolates intra-fragment and inter-fragment interactions to generate smooth 3D interaction isosurfaces. The descriptor Δg gives a local depiction of the electronic exchange and reveals clash regions. The method uses promolecular density. The promolecular density is a model of a molecule's electron distribution formed by simply adding together the independent, spherically averaged charge densities of its constituent isolated atoms. It serves as a computationally fast reference state that excludes chemical bonding effects. Despite its limitations, the IGM method is a useful tool for qualitative and comparative analysis of non-covalent interactions in complex systems.
Electron density maps allow the visualization of regions with interactions in the transition states and compare the nature and intensity of the interaction between β-ketoamides and the arylhydrazone derivatives, providing evidence of stabilizing or destabilizing non-covalent interactions.
The Intrinsic Bond Strength Index (IBSI) and the Independent Gradient Model (IGM) are used together to measure and visualize chemical bond strengths and molecular interactions. IBSI quantifies the amount of electronic exchange for unit length squared, normalized to 1 for the hydrogen molecule, H2 [55].
g p a r = V δ g p a r d 2 d V δ g p a r H 2 d H 2 2 d V

3.4. Data Matrix Construction, Local and Global Reactivity Descriptors

We constructed data matrix X of dimensions n x p, where n = 14, the number of compounds in this study, and p is a group of computational descriptors obtained from DFT calculations and analysis. Global descriptors depict molecular properties, not related to specific reactive sites in the molecule. Global descriptors are calculated from frontier orbital energies, ( E H O M O , E L U M O ). Structural, bonds or local descriptors are represented by Wiberg bond indexes. NBO descriptors include atomic charges NPA.
Koopman’s theorem [52] defines the ionization potential, I, and electron affinity, A, obtained from HOMO-LUMO energies, as follows:
I =     E H O M O       y       A =     E L U M O
From I and A values, we can obtain the absolute electronegativity (χ), absolute hardness (η), chemical potential (μ), and softness (S, inverse of hardness):
χ = I + A 2 ;           η = I A 2 ;           μ = I + A 2 ;           y           S =   1 η      
Electrophilicity is a reactivity descriptor which quantifies the global electrophilicity of a molecule, on a relative scale. The Parr electrophilicity index (ω) is a quantitative measure of a chemical species' power to accept electron density. It is defined as:
ω = μ 2 2 η
where μ is the electronic chemical potential, and η is the chemical hardness [56].
A good nucleophile is characterized by low μ and ω values, while a good electrophile is characterized by high μ and ω values. The electrophilicity index ω measures the tendency of a chemical species to accept electrons. This index assesses the energetic stabilization of a system when it acquires additional electron charge N m a x from its surroundings [57]; N m a x is calculated as:
N m a x = μ η
While the electrophilicity index ω describes the tendency of a system to accept electrons, N m a x describes the capacity for additional electron charge of a given molecule.
Ayers et al. [58,59] proposed other reactivity descriptors, which measure the nucleophilic and electrophilic capacity of a leaving group, as nucleofugacity (ΔEₙ) which ranks the ability of a leaving group to depart with a bonding pair of electrons, and electrofugacity (ΔEₑ), defined as:
E n =   A + ω           y           E e =   I + ω  

3.5. Principal Component Analysis (PCA) and Hierarchical Cluster Analysis (HCA)

Principal component analysis, PCA, and hierarchical cluster analysis, HCA, are the most widely used tools to explore similarities and hidden patterns among samples. PCA shrinks data size by transforming a pool of many variables into fewer, new combined variables. HCA sorts variables into groups shown as a tree diagram.
In PCA, the new, smaller group of variables constitute the principal components. These components are obtained through orthogonal transformation. The principal components are orthogonal vectors of the covariance matrix. A covariance matrix is a square, symmetric table that shows the variance of separate variables on its diagonal and the covariance between different pairs of variables in its other spaces. It helps us see how items in a dataset change together. PCA is sensible to the scales of the original variables. For this reason, it is necessary to apply auto-scaling treatment. In this work, we used Numiqo for statistical calculations. Numiqo is a web app for statistical data analysis, available at numiqo.com [60].
To utilize these techniques, we need to calculate the standardized matrix Z, and from this, calculate the covariance matrix:
C = 1 n 1 Z T Z
This will allow obtaining the autovectors (V), which define the directions of the principal components, and the auto values ( λ j ), which quantify the variance for each component.
The scores (T = ZV) are analyzed to identify possible grouping in β-ketoamides and arylhydrazone derivatives, while the loadings allow determining which descriptors contribute predominantly to the observed differences in reactivity [61,62,63].
Hierarchical cluster analysis HCA allows representing the available data in 2D dendrograms. A dendrogram is a tree-like diagram that visualizes hierarchical clustering, showing how data points or groups are merged or split during hierarchical cluster analysis. Its relationship with a similarity matrix forms the mathematical foundation for identifying natural groupings in data. It displays individual items at the base and progressive group connections moving upward. To build a dendrogram, the distances between pairs are calculated, and the similarity matrix is created. For two samples k and l, the similarity index is calculated as:
S k l = 1 d k l d m a x
where d k l is the Euclidean distance between samples k and l, and d m a x     is the maximum distance between any two samples in the data set.

4. Results and Discussion

Table 1 displays the experimental data reported by Malhas et al, for the gas-phase pyrolysis at 450 K. All reactions showed first-order kinetics. Arrhenius parameters log A (s⁻¹) and Ea (kJ mol⁻¹) are in the expected range for unimolecular gas-phase thermal elimination [64,65,66,67,68,69,70,71]. The fragmentation reaction forms an aryl isocyanate (O=C=N-Ar) and a ketone or its tautomer. Ketenes (RCH=C=O) were not observed in the pyrolysis products. The two mechanisms, shown in Scheme 2, explain the formation of aryl isocyanate, Ar-N=C=O; i.e., the product formation can be explained by a concerted mechanism through a six-member cyclic transition state, 2a, and also by an alternate pathway through a cyclic four-membered transition state, 2b. In both proposed mechanisms, the bond between the amide carbonyl and the alpha carbon breaks, and an aryl isocyanate forms, Ar-N=C=O. In mechanism 2a, scheme 2, the cyclic six-member transition state is thermodynamically more stable. In this pathway, a proton transfer occurs from the amide nitrogen, N-H, to a protophilic center, e.g., the oxygen atom in the carbonyl group, C=O. In mechanism 2b, involving a cyclic four-member transition state, the amide proton N-H is transferred to the alpha carbon. This is less favorable since carbon is less protophilic than the β-carbonyl oxygen. We discuss the thermodynamic and kinetic data of mechanism 2a, evaluating the possibility of mechanism 2b.
Data collected in Table 1 show that 2-arylhydrazone substituted β-keto anilides (N-aryl- β-ketoamides), structures 5-8, are less reactive than the non-substituted analogues (1-4) by a factor of ≥ 1.4 × 10³.

4.1. Computational Study of β-Ketoanilides, Compounds 1-4

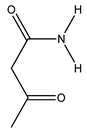
Table 2 and Table 3 display thermodynamic parameters calculated using the B97D-GD3BJ/Def2TZVP level of theory at 450 K. We used acetoacetamide (compound 12, Figure 1) as a reference for the discussion of reactivity differences. The calculated energy of activation for acetoacetamide 129.87 kJ/mol, obtained assuming the mechanism depicted in Scheme 2a, is comparable with the experimental value of 121.3 – 127.3 kJ/mol with experimental error. This indicates that the mechanism proceeds through a six-member transition state, TS. The calculated energy of activation for N-phenyl-3-oxobutanamide (N-phenyl-acetoacetamide), compound 1, Figure 1, Table 2, is slightly lower than that of acetoacetamide. The Ea decreases from 129.87 to 126.67 kJ/mol, suggesting that the phenyl group stabilizes the six-member TS, facilitating the reaction. i.e., the reaction is faster. Substitution in the aromatic ring para position by chlorine (p-Cl, compound 2), methyl (p-Me, compound 3), and methoxy (p-OMe, compound 4) do not make significant changes; calculated energies of activation are around 126 kJ/mol.
Higher reactivity cannot be explained solely in terms of differences in energy of activation. The free energy of activation, Δ G is a better parameter to describe reactivity, as it contains entropy changes, included in the experimental log A. For the p-chloro substituted compound 2, log A is 14, implying more favourable entropy of activation, contributing to the faster rate. Calculated entropy of activation is -6.69 j/Kmol, the smallest negative value in the series. The slowest reaction is observed for compound 3, with a p-methyl substituent, and log A 9.75, indicating a very organized, restricted transition state, with a calculated entropy of activation of -9.20 j/Kmol. The small differences in the calculated entropy of activation between these compounds suggest the functional DFT (B97D-GD3BJ/Def2TZVP underestimates entropic effects or the balance between electronic and steric effects in the TS.

4.2. Computational Study of Phenylhydrazone Derivatives of β-Ketoanilides, 5-11

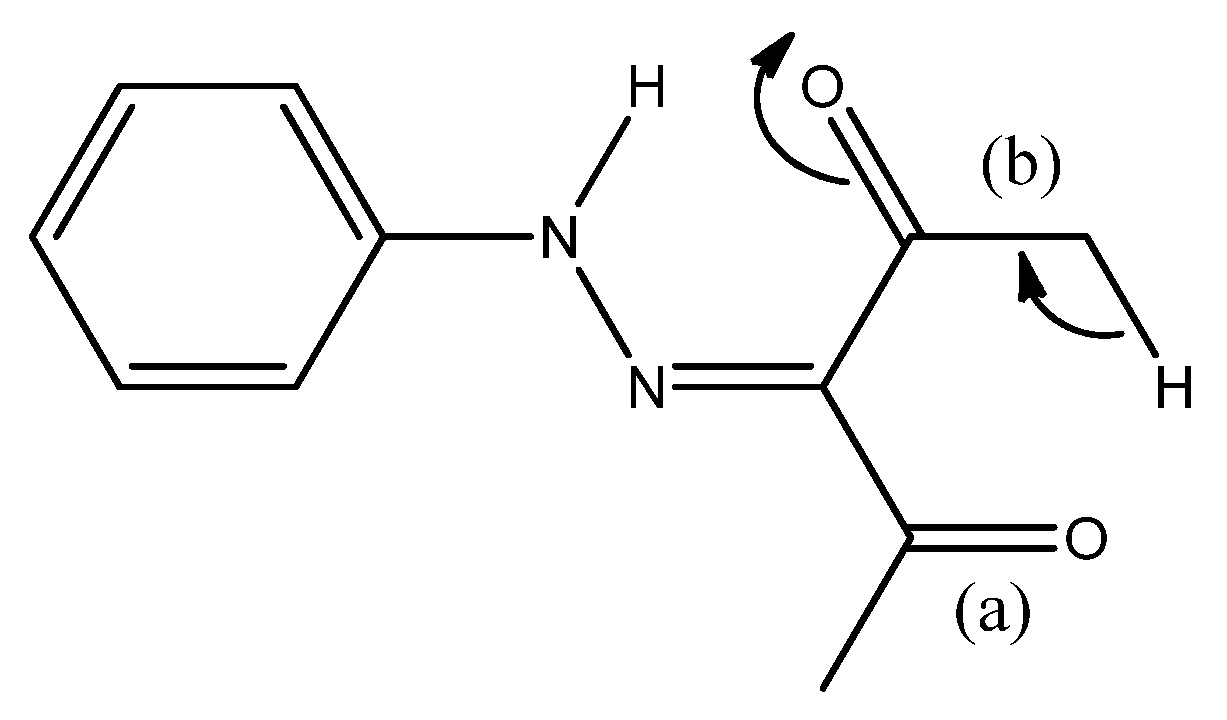
The influence of arylhydrazone substituents on the reactivity of acetoacetamide and acetanilides (1-4), compared to non-substituted is significant, as observed in the experimental data and in theoretical calculations. Analysis of arylhydrazone effect on the kinetics and mechanism of these systems provides an opportunity to study structure-reactivity relationships, Scheme 4.
The phenylhydrazone group on carbonyl (b) helps increase the positive charge of the hydrogen adjacent (α to carbonyl b), facilitating the proton transfer to the oxygen of the carbonyl group (a), (Scheme 4). The effect is an increase in the pyrolysis rate compared to acetoacetamide, due to the assistance of the phenylhydrazone group.
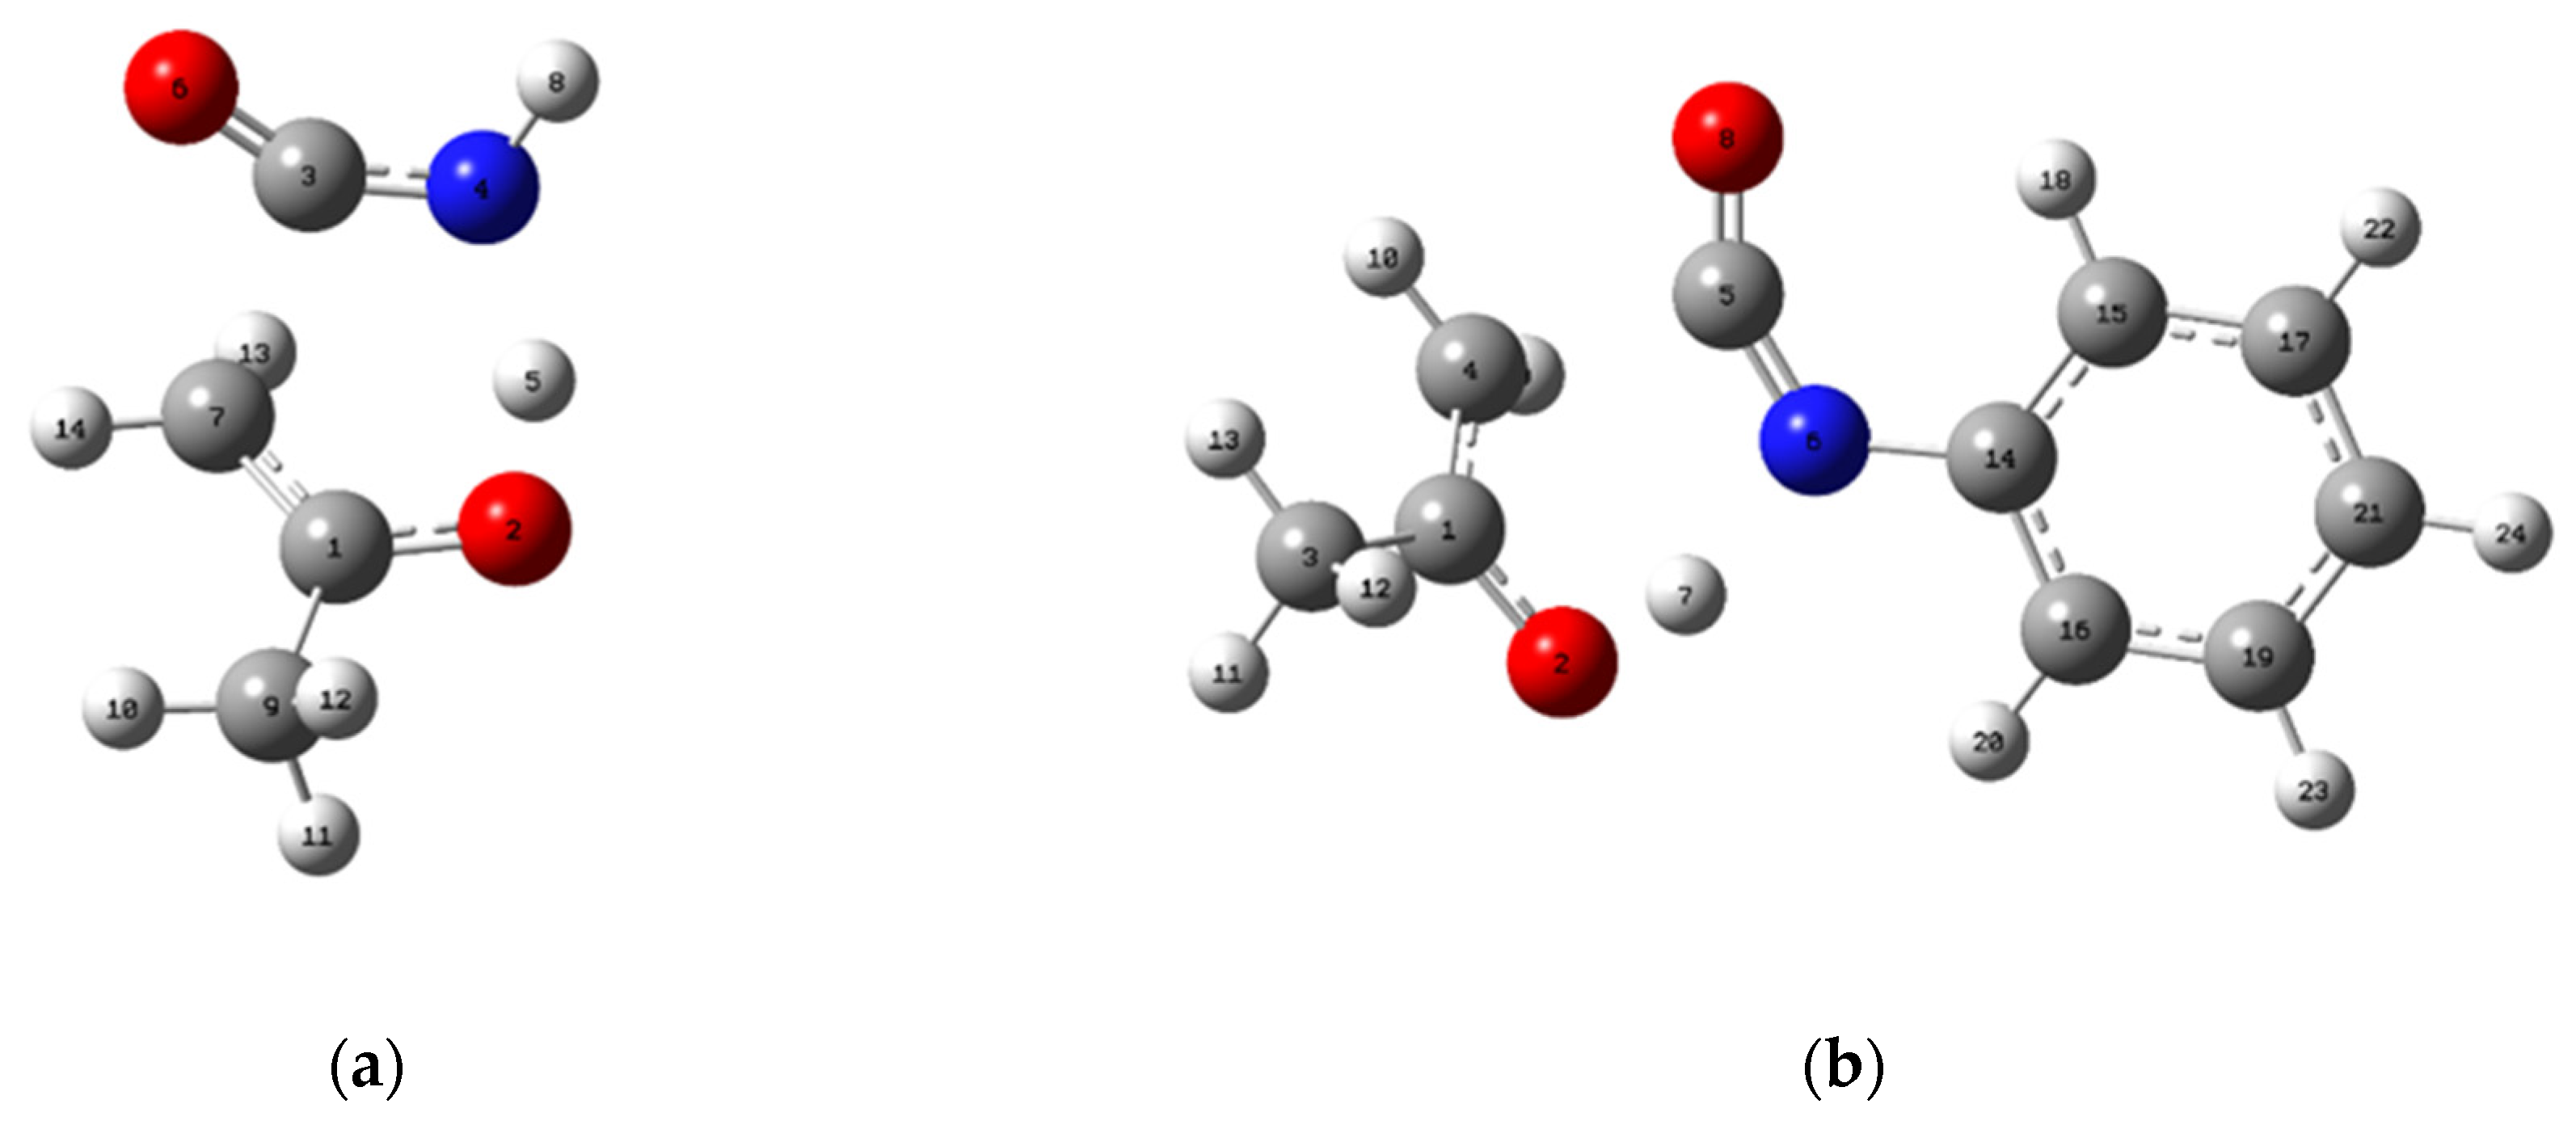
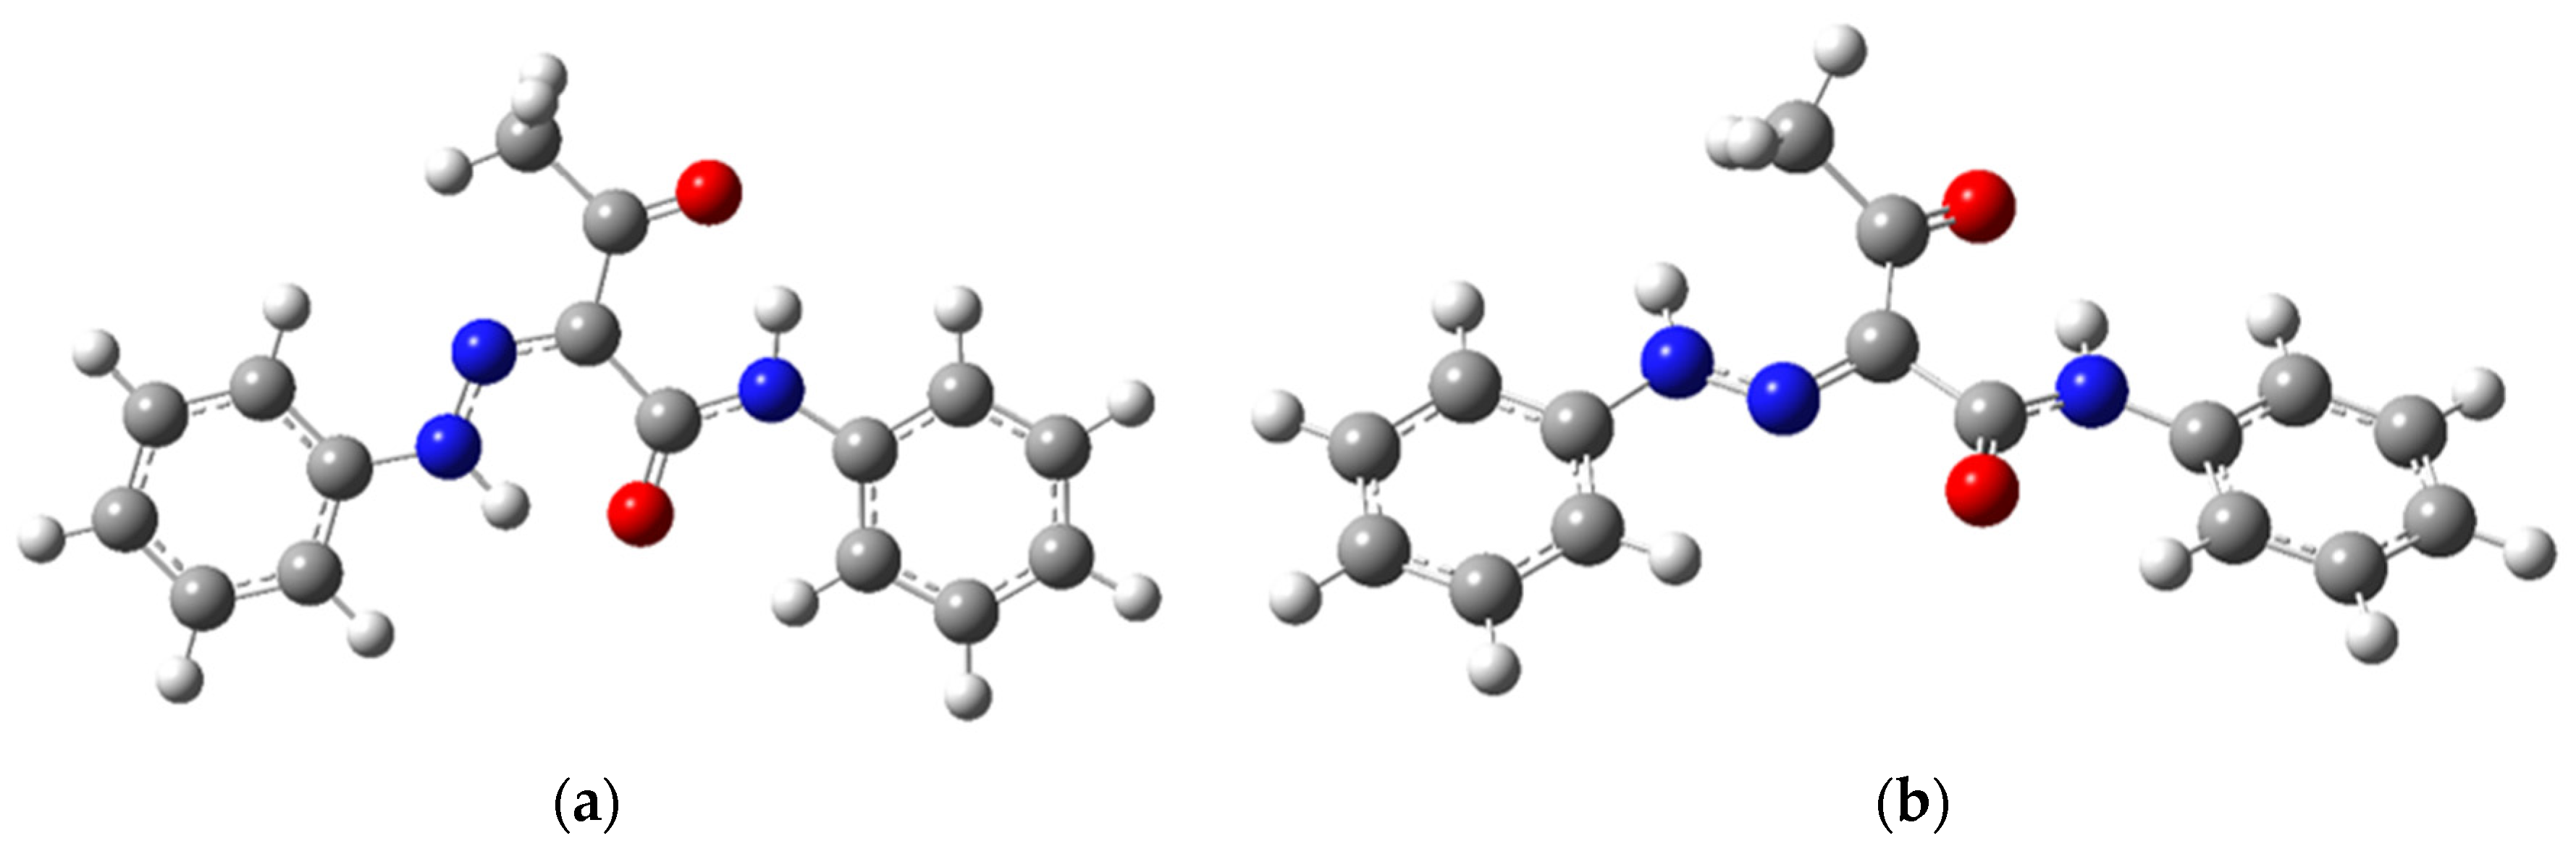
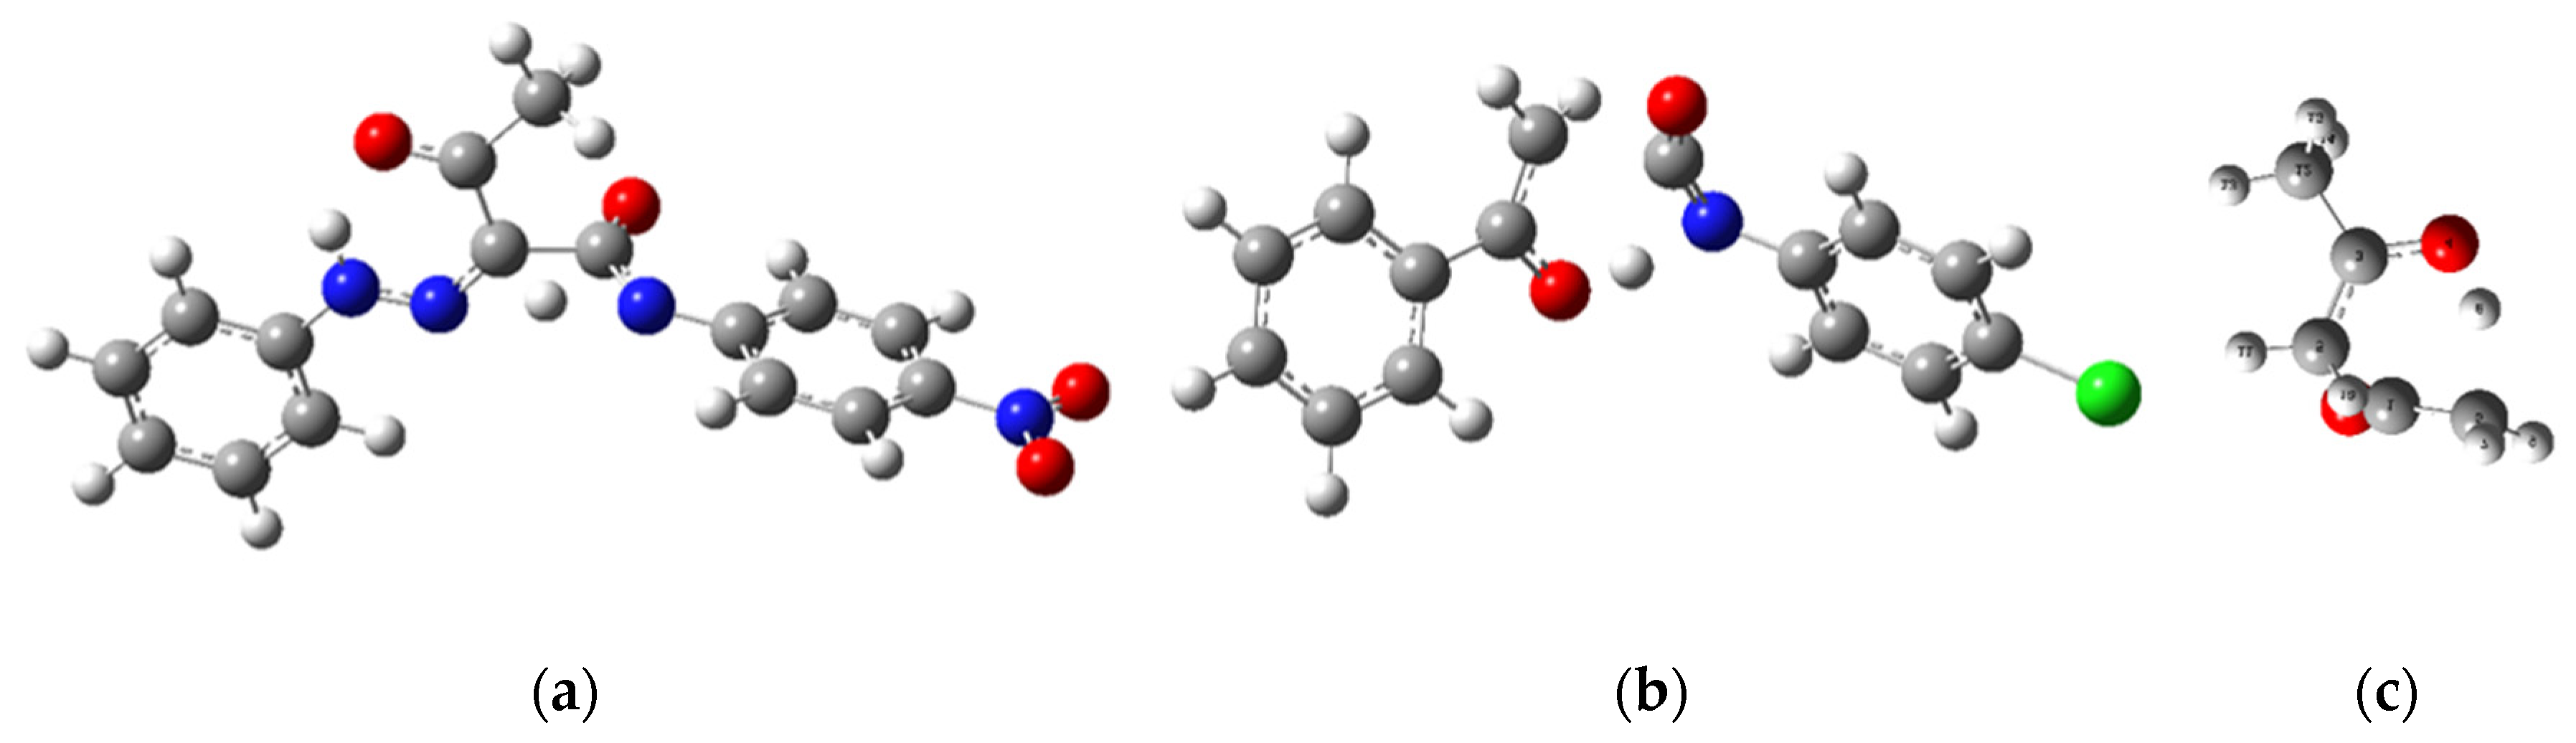
An interaction between the keto group (C=O) and the hydrogen of the arylhydrazone group (N-H) in a conformation of compound 5, depicted in Figure 2a. This interaction is an alternate pathway, affecting the rate of the pyrolysis reaction. This pathway, however, does not produce the observed fragmentation products. Figure 2b shows the reactant conformation leading to product formation, used in this work. An interaction between the keto group (C=O) and the hydrogen of the arylhydrazone group (N-H) in a conformation of compound 5, depicted in Figure 2a. This interaction is an alternate pathway, affecting the rate of the pyrolysis reaction. This pathway, however, does not produce the observed fragmentation products. Figure 2b shows the reactant conformation leading to product formation, used in this work.
Table 2 and Table 3 show the influence of the arylhydrazone group, according to the six-member TS mechanism and four-member TS mechanism, depicted in Scheme 2. Results show that the mechanism through a four-member TS gave larger values of ΔG and Ea than the six-member TS; thus, the four-member TS is less favourable.
In the case of the six-member TS from compound 14, the conformation shown in Figure 2b gave a calculated ΔG over 200 kJ/mol. Rotation of the phenylhydrazone group to the conformation shown in Figure 2b produced a ΔG value in agreement with the experimental value.
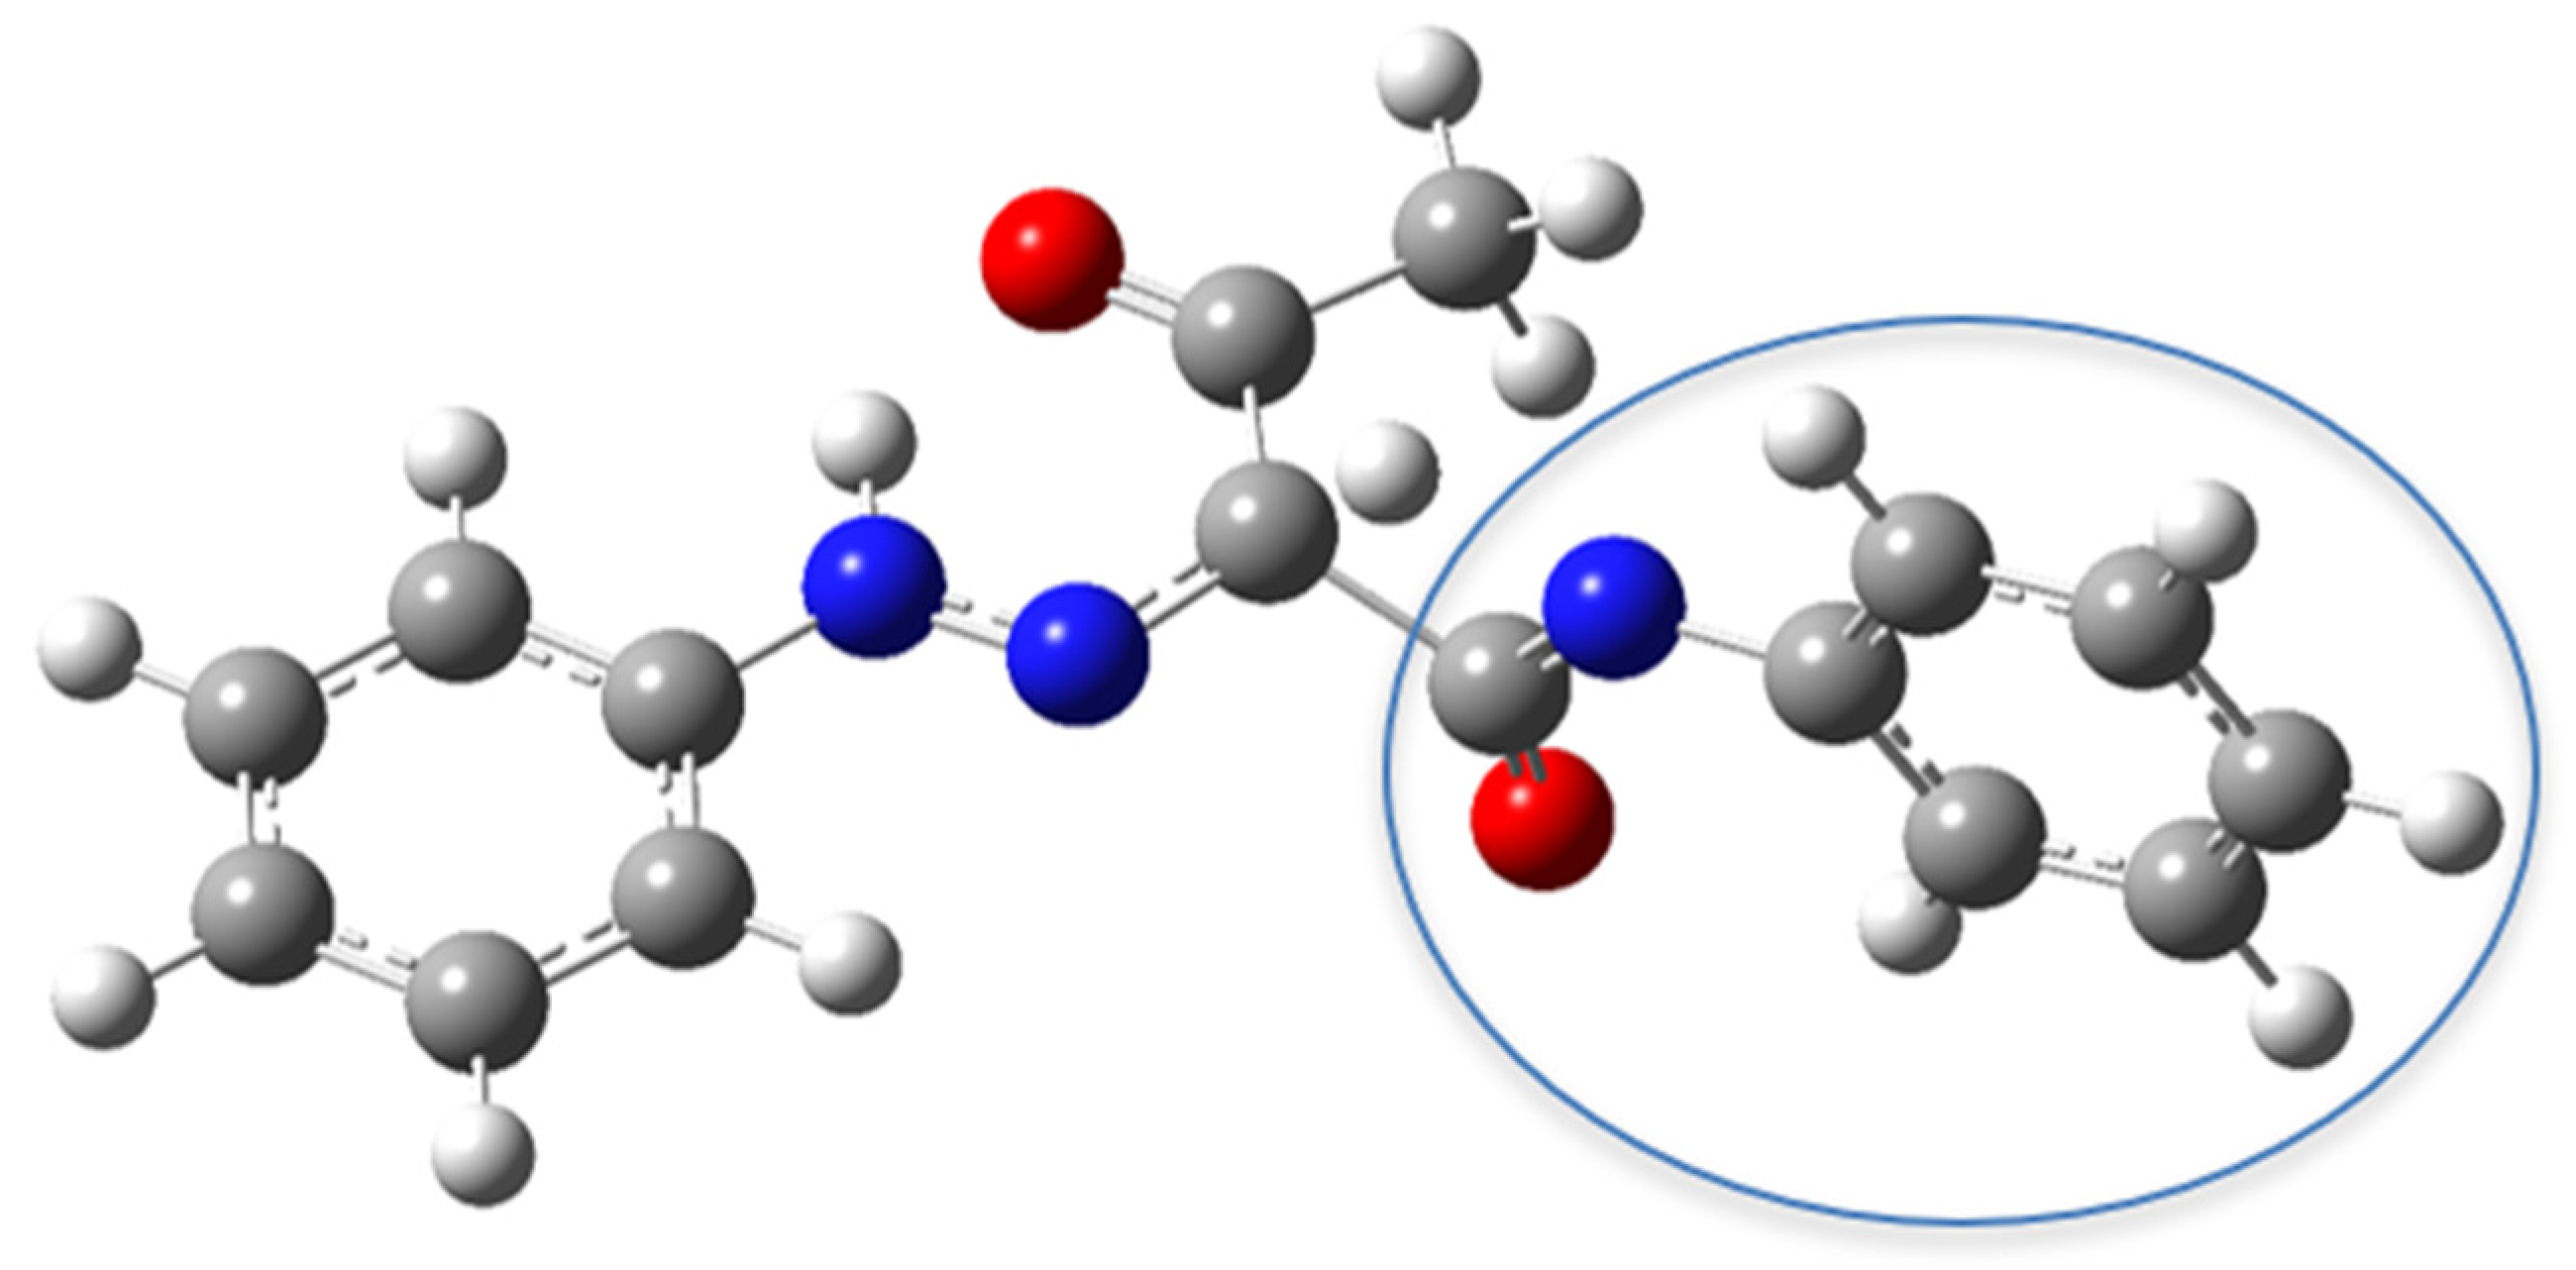
The four-member TS structure was also used in this study for compounds 5–11, and it is depicted in Figure 3. In this transition state, the amide N–H hydrogen migrates toward the α-carbon atom. To enable this migration, the group highlighted in the blue circle rotates approximately 90° around the C–C bond, orienting the α-carbon favorably for the hydrogen transfer. The hydrazone N–H hydrogen remains in proximity to the oxygen of the acetyl group, as shown in the figure. This conformational rearrangement is essential to achieve the four-member cyclic geometry and allows the subsequent C–C bond cleavage.
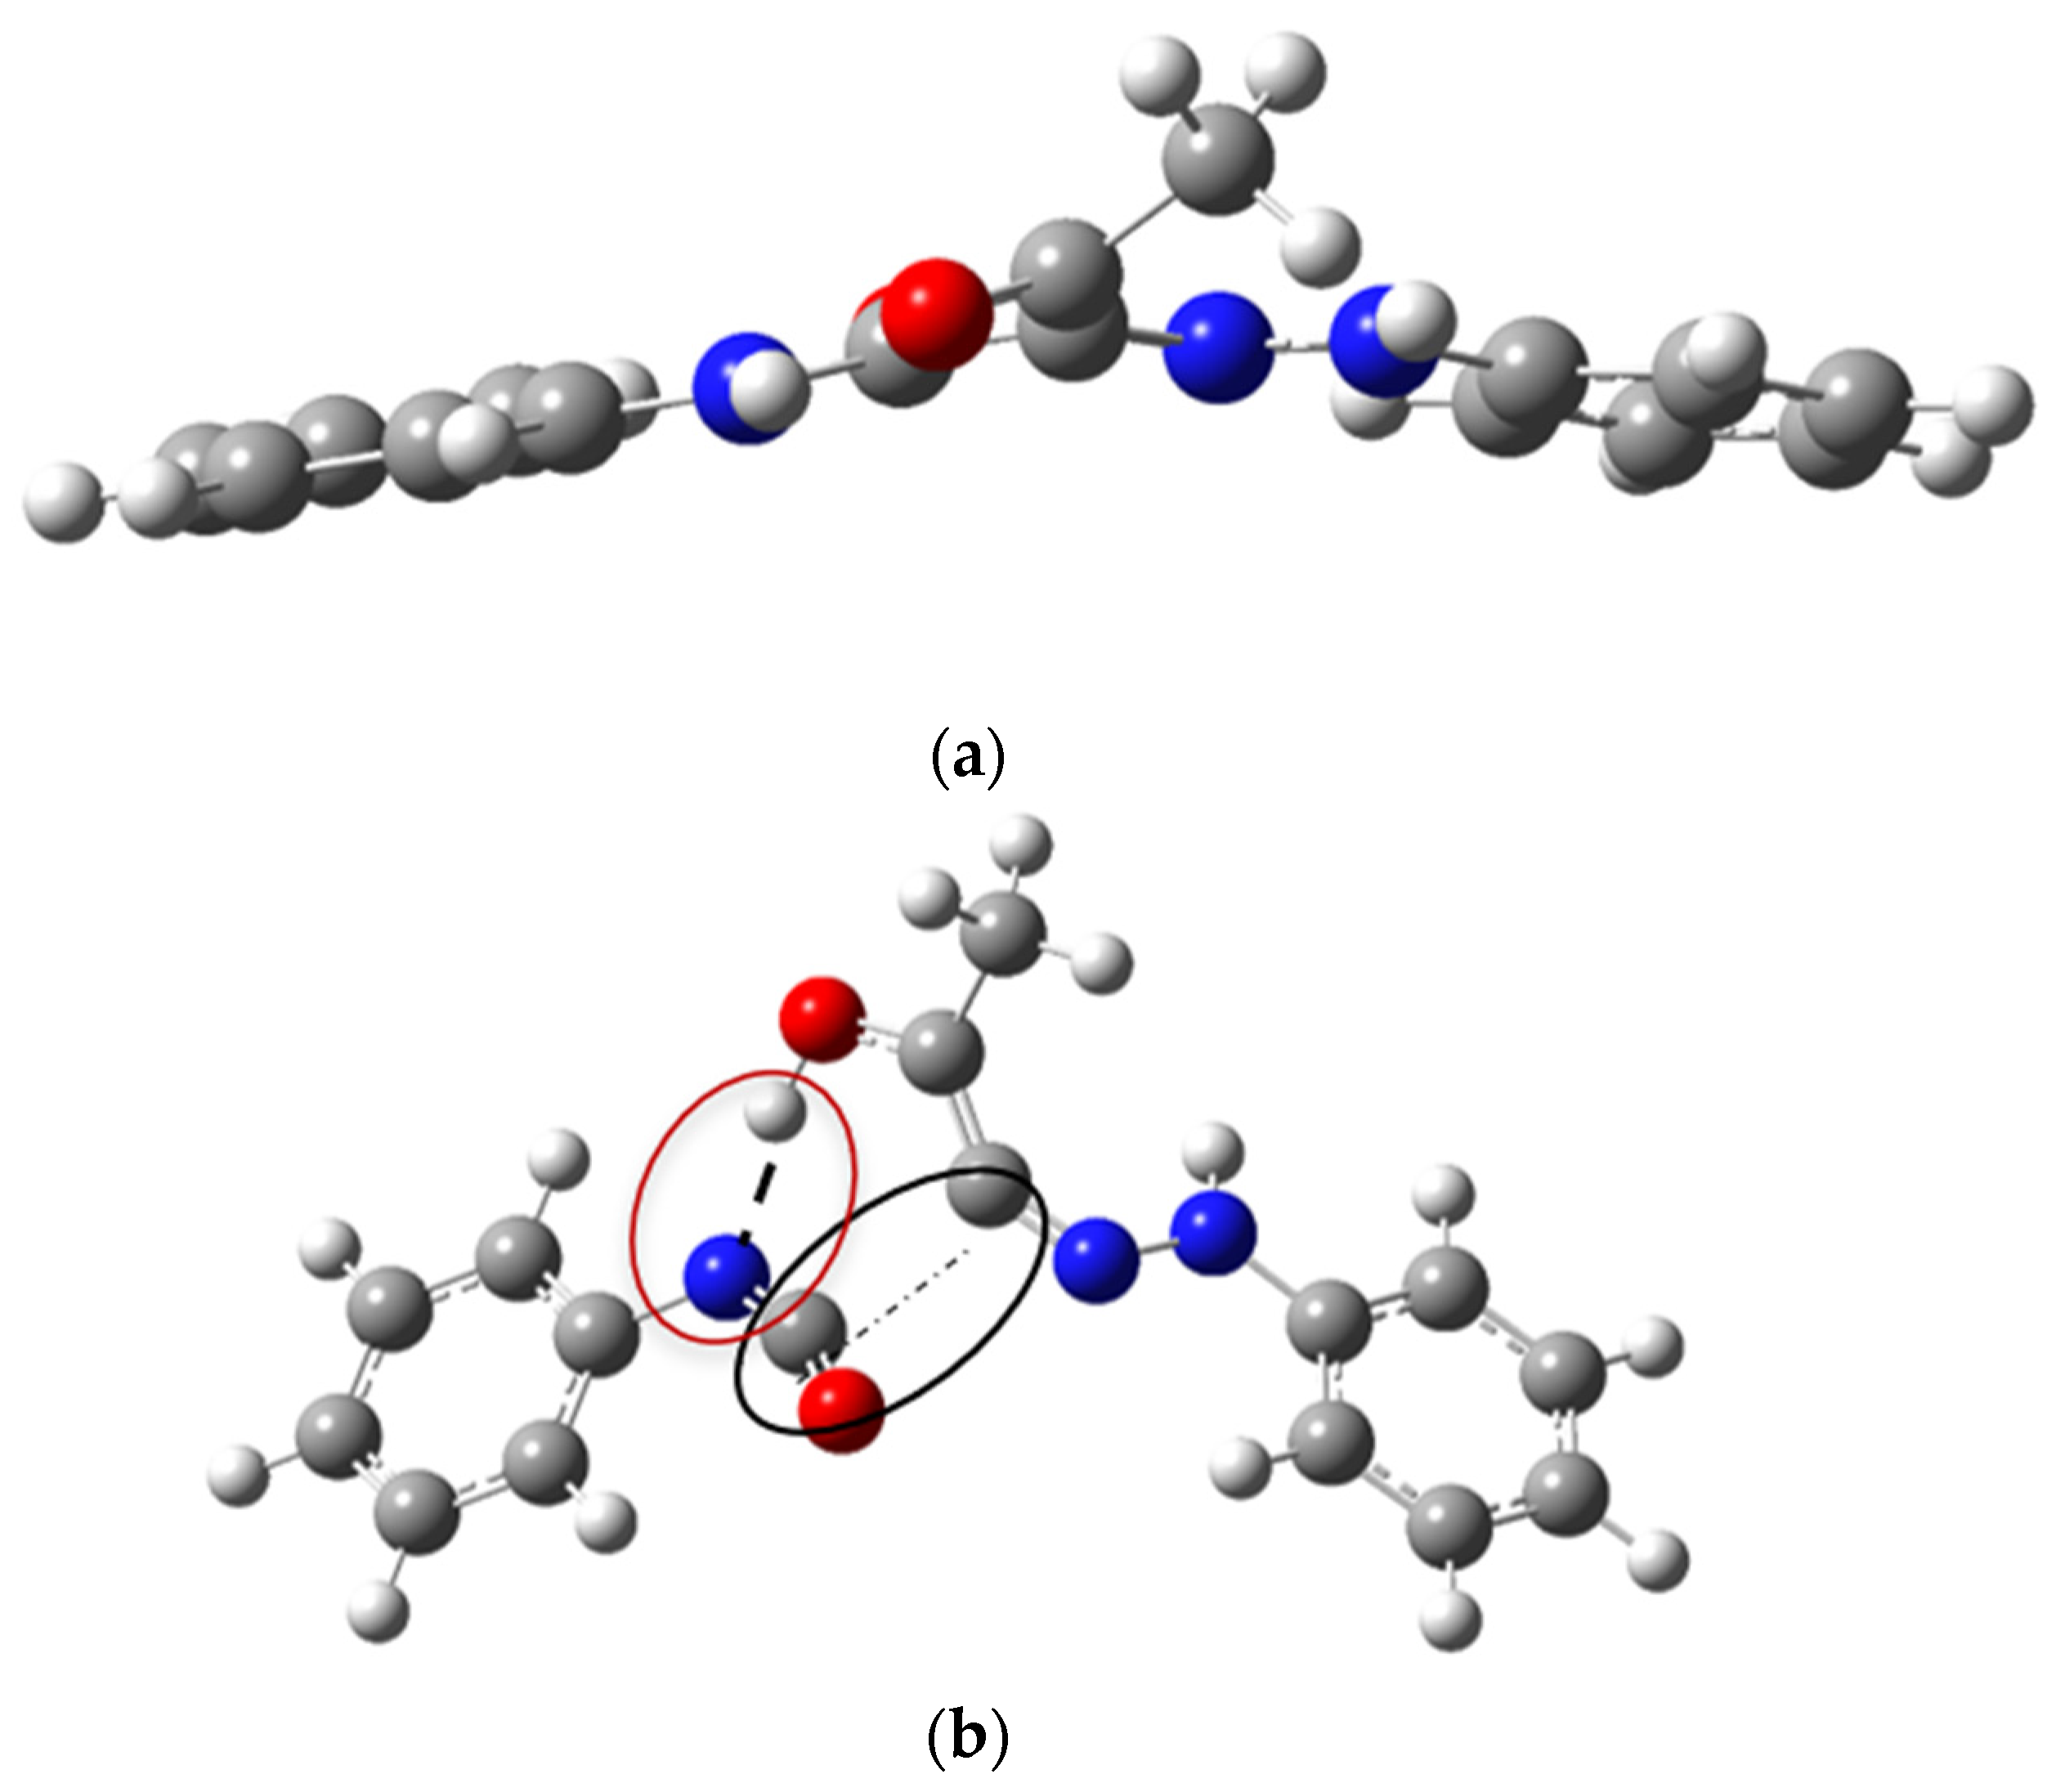
Figure 4 depicts another view of Figure 2b. The aromatic rings and the center of reaction are approximately in one plane, and the methyl group is in the plane. The TS in Figure 4b shows early hydrogen migration, and the C-C bond is significantly broken. The energies of activation, Ea and enthalpies of activation of aryhydrazone (compounds 5-11) are much higher than the Ea of the parent ketoanilides (compounds 1-4), which explains the lower reactivity observed experimentally. For compounds 5-8, with substituents: -H, -Cl, -CH3, and -OCH3 in the para position of the anilide phenyl ring, small changes in Ea are observed, 177 – 180 kJ/mol for the six-member TS mechanism, suggesting the substituent effect is negligible on the energy barrier. By contrast, for compounds 9-11, where the substituent is at the para position of the aryhydrazone ring, the effect is significant. Compound 11 (p-OCH3) has the lowest Ea (~177 kJ/mol), followed by compound 10 (p-CH3), while compound 9 (p-Cl) has the highest Ea (~180 kJ/mol).
These results imply that electron donor groups EDG (p-OCH3 and p-CH3) on the arylhydrazone group stabilize the six-member cyclic TS, while the electron withdrawing group EWG, p-Cl, destabilizes the TS. Comparing the mechanisms, the six-member cyclic TS is favored over the four-member cyclic TS by approximately 10-12 kJ/mol, which confirms the proposal by Malhas et al. Entropies of activation (ΔS) for compounds 5-11 is positive (25-30 J/Kmol) for the six-member TS mechanism, indicating a less organized TS configuration, while the four-member TS mechanism, the entropy change is zero or slightly positive, implying a more restricted TS configuration.
Regarding the functional/basis set performance, B97D-GD3BJ/Def2TZVP calculation reproduce the observed reactivity trend; that is, aryhydrazone derivatives, 5-11 have barriers significantly higher (~178 kJ/mol) than ketoanilides 1-4 (~126 kJ/mol), in agreement with experimental results (~158–164 kJ/mol for compounds 5–11 vs. ~105–136 kJ/mol for compounds 1–4). However, calculations systematically overestimate the Ea by 15-20 kJ/mol for compounds 5-11. This discrepancy suggests that even though the functional captures the principal electronic effects, it underestimates the stabilization of the TS by non-covalent interactions, or finer electron correlation effects, especially in aryhydrazone derivatives with extended conjugation. Despite the systematic error, the calculation reproduces the experimental reactivity trend and substituent effect; thus, the level of theory is robust enough to establish relative reactivity and validate the predominant mechanism as a cyclic six-member TS.

4.3. HOMO – LUMO, IBSI, NPA

The optimized geometries of the 14 compounds obtained from DFT calculations using the B97D-GD3BJ functional with the Def2TZVP basis set were verified by vibrational analysis to confirm that the structures are true local minimum on the potential energy surface, that is, they lack imaginary frequencies. We constructed 9 matrices from the compounds’ descriptors; for the compounds, we were able to do IRC. The IRC gave 201 points for each compound.
The energy gap between frontier orbitals, HOMO and LUMO, has been used to characterize chemical reactivity and stability. Molecules with small energy gap, ΔEg, described as “soft”, are more polarizable, associated with significant chemical reactivity, and low kinetic stability. Table 4S shows the energies HOMO – LUMO and the energy gap ΔEg, for the molecules in this study.
Calculated global descriptors, e.g. chemical potential, ionization energy, hardness, and softness, are presented in Table 2S. Ionization energy is a fundamental descriptor for chemical reactivity. High energy of ionization implies chemical stability. Hardness and softness descriptors are also used to describe molecular stability and reactivity. The hardness descriptor illustrates resistance to deformation or polarization of the electron cloud in atoms, ions and molecules under a perturbation. Molecular descriptors were calculated from the energies of frontier orbitals, HOMO – LUMO, using the DFT/B97D-GD3BJ/Def2TZVP level of theory, in the gas phase.
Analysis of the energy gap HOMO-LUMO, ΔEg, in Figure 1S revealed that ΔEg decreases from ~3.75 eV in the reactants (point 1 of the IRC, M1) up to ~3.57 eV in the transition state TS region (M93-M96), and increases again to ~3.95 eV in the products region (M201). The point of maximum gap, ΔEg of 3.6148 eV (HOMO −5.9471 eV and LUMO -2.3323 eV), occurs at the TS (M101), indicating greater polarizability and less kinetic stability, to facilitate the charge transfer implied in bond breaking and formation. Global descriptors derived from HOMO-LUMO energies at M101 are hardness (η) = 1.8074 eV, chemical potential (μ) = -4.1397 eV, softness (S) = 0.5533 eV⁻¹, electrophilicity index (ω) = 4.7408 eV and maximum charge transferred ΔNmax = 2.2904 e. These values confirm that TS is softer, more polarized, with greater capacity to accept electrons and higher reactivity at this point in the potential energy surface.
Intrinsic bond strength index IBSI, derived from the Independent Gradient Model IGM (IBSI), is a powerful method to measure and compare the strengths of chemical bonds. IBSI and electron density (ρ) analysis along the IRC allows quantifying electronic exchange between fragments participating in the reaction. At the TS (M101), IBSI associated with N4-H4 bond breaking decreases significantly, to 0.316, while IBSI associated with O2-H5 bond formation increases to 0.912, illustrating the asynchronous character of the six-member TS mechanism. Electron density (ρ) analysis in the TS shows values of ρO2−H5=0.245 and ρN4−H5=0.096, indicating a hydrogen bond N4–H5···O2, stabilizing the TS, Figure 2S.
Figure 3S shows atomic charges from natural population analysis (NPA). The hydrogen atom in the amide group, H4, becomes more positive, qH5=+0.47149 e, consistent with the proton transfer to the oxygen of the carbonyl group, O2, which increases its charge to qH5=+0.47149 e, from its value in the reactant, −0.53942 e. The amide nitrogen, N4, shows a decrease in charge to a value qN4=−0.85727 e, compared to the reactant, with a value −0.78444 e, illustrating the breaking of the bond N-H, with electron delocalization toward the aromatic ring. Carbon atoms C1, C3, and C7 also show significant changes: C1 becomes more positive (qC1=+0.45863 e in the TS vs. +0.57194 e in the reactant), C3 turns into more positive (qC3=+0.73602 e in the TS vs.+0.62233 e in the reactant), and C7 becomes more negative qC7=−0.59461 e in the TS vs.−0.60166 e in the reactant), illustrating the charge redistribution associated with C3-C7 bond breaking and product formation.
Jointly, these analyses: HOMO-LUMO gap ΔEg, Intrinsic bond strength index IBSI, and atomic charges from natural population analysis, NPA, provide a consistent, multifaceted image of the pyrolysis process. Reactivity is controlled by the capacity of the system to polarize the electron cloud and facilitate the charge redistribution in the TS. This ability is modulated by electronic effects of the substituents at the aromatic ring, with differences in the behavior between ketoanilides (1-4) and the arylhydrazone derivatives (5-11).

4.4. Principal Component Analysis (PCA)

For PCA, due to the amount of data involved, we used the IRC information of the atoms involved in the six-member TS, Table 5. We built a 201 x 30 PCA matrix using 30 variables: HOMO (eV), LUMO (eV), Gap (eV), I, A, χ, η, μ, S, ω, ΔN, IBSI_O2-H5, IBSI_H5-N4, IBSI_N4-C3, IBSI_C3-C7, IBSI_C7-C1, IBSI_C1-O2, electron density ρ_O2-H5, ρ_H5-N4, ρ_N4-C3, ρ_C3-C7, ρ_C7-C1, ρ_C1-O2, C1, and charges qC3, qC7, qN4, qH5, and qO2.
For compound 12, data was auto scaled to ensure all variables were comparable on the same scale. The objective of the PCA was to reduce the dimensionality of the data, to identify the most relevant variables and determine which variables can explain the chemical reactivity of the compounds in this study. Table 4 shows the variables included in PC1 calculated for each IRC point for compound 12. Variance analysis revealed that the three principal components, PC1, PC2, and PC3, explain 99.31% of the total variance, with PC1 87.32%, PC2 10.46% and PC3 1.54%. We used these components for the analysis to interpret the chemical reactivity of the compounds; the inclusion of more components is more likely to introduce noise than give significant information.
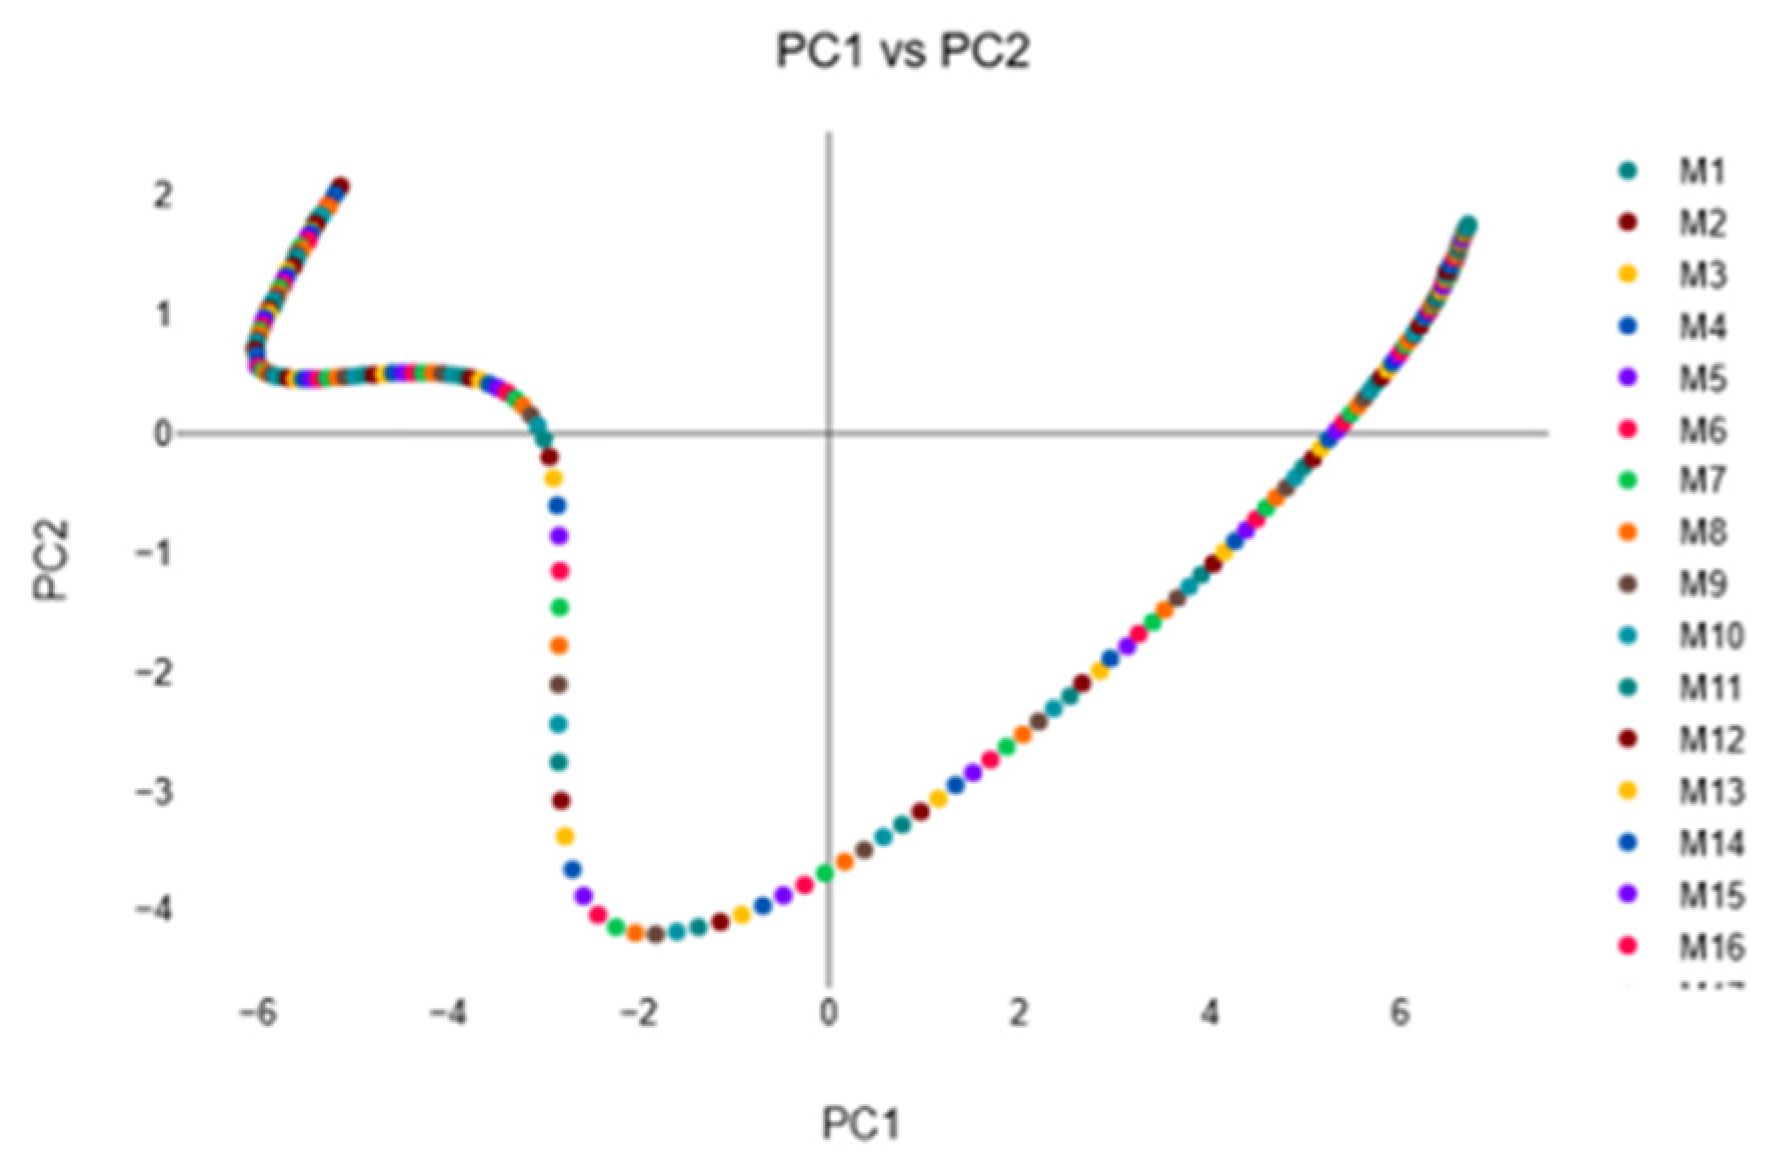
A plot of the distribution of scores PC1 vs PC2 in the structures along the IRC (M1, M2, etc) is shown in Figure 5. We observe two main groups. The most reactive structures have larger positive PC1 values, while less reactive structures have negative PC1 values. This information indicates that the PC1 value is critical for reactivity, while PC2 provides a secondary classification associated with fine-structural effects or electron-density variations.
The charge vector, a.k.a., loading vector, represents the weights or coefficients assigned to each original variable to construct a specific principal component. The charge vector for PC1 is expressed by a linear equation with coefficients for the weight of the variables. The vector is:
PC1 = 0.92[HOMO] + 0.94[LUMO] + 0.89[Gap ΔEg] - 0.92[I] - 0.94[A] - 0.93[χ] + 0.89[η] + 0.93[μ] - 0.88[S] - 0.94[ω] - 0.94[ΔN] – 0.95[ΔEn] -0.94[ΔEe] + 0.97[IBSI_O2-H5] - 0.95[IBSI_H5-N4] + 0.99[IBSI_N4-C3] - 0.95[IBSI_C3-C7] + 0.98[IBSI_C7-C1] - 0.98[IBSI_C1-O2] + 0.97[ρ_O2-H5] - 0.95[ρ_H5-N4] + 0.98[ρ_N4-C3] - 0.94[ρ_C3-C7] + 0.96[ρ_C7-C1] - 0.98[ρ_C1-O2] - 1.00[qC1] + 0.97[qC7] + 0.97[qC3] - 0.32[qN4] + 0.94[qH5] - 0.98[qO2]
From this equation, we selected the variables with positive coefficients, associated with higher chemical reactivity (PC1 > 0). The variables with greater weight in the PC1 charge vector comprise HOMO, LUMO, Gap ΔEg (HOMO-LUMO Gap), η (hardness), μ (chemical potential), bond strength: IBSI_O2-H5, IBSI_N4-C3, IBSI_C7-C1, bond electron densities: ρ_O2-H5, ρ_N4-C3, ρ_C7-C1, and atomic charges qC7, qC3 and qH5. These variables reflect the capacity of the compound to polarize the electron cloud, stabilize the TS by non-covalent interactions, and facilitate charge transfer along the reaction coordinate. The simplified charge PC1 vector is:
PC1 = 0.92[HOMO] + 0.94[LUMO] + 0.89[Gap ΔEg] + 0.89[η] + 0.93[μ] + 0.97[IBSI_O2-H5] + 0.99[IBSI_N4-C3] + 0.98[IBSI_C7-C1] + 0.97[ρ_O2-H5] + 0.98[ρ_N4-C3] + 0.96[ρ_C7-C1] + 0.97[qC7] + 0.97[qC3] + 0.94[qH5].
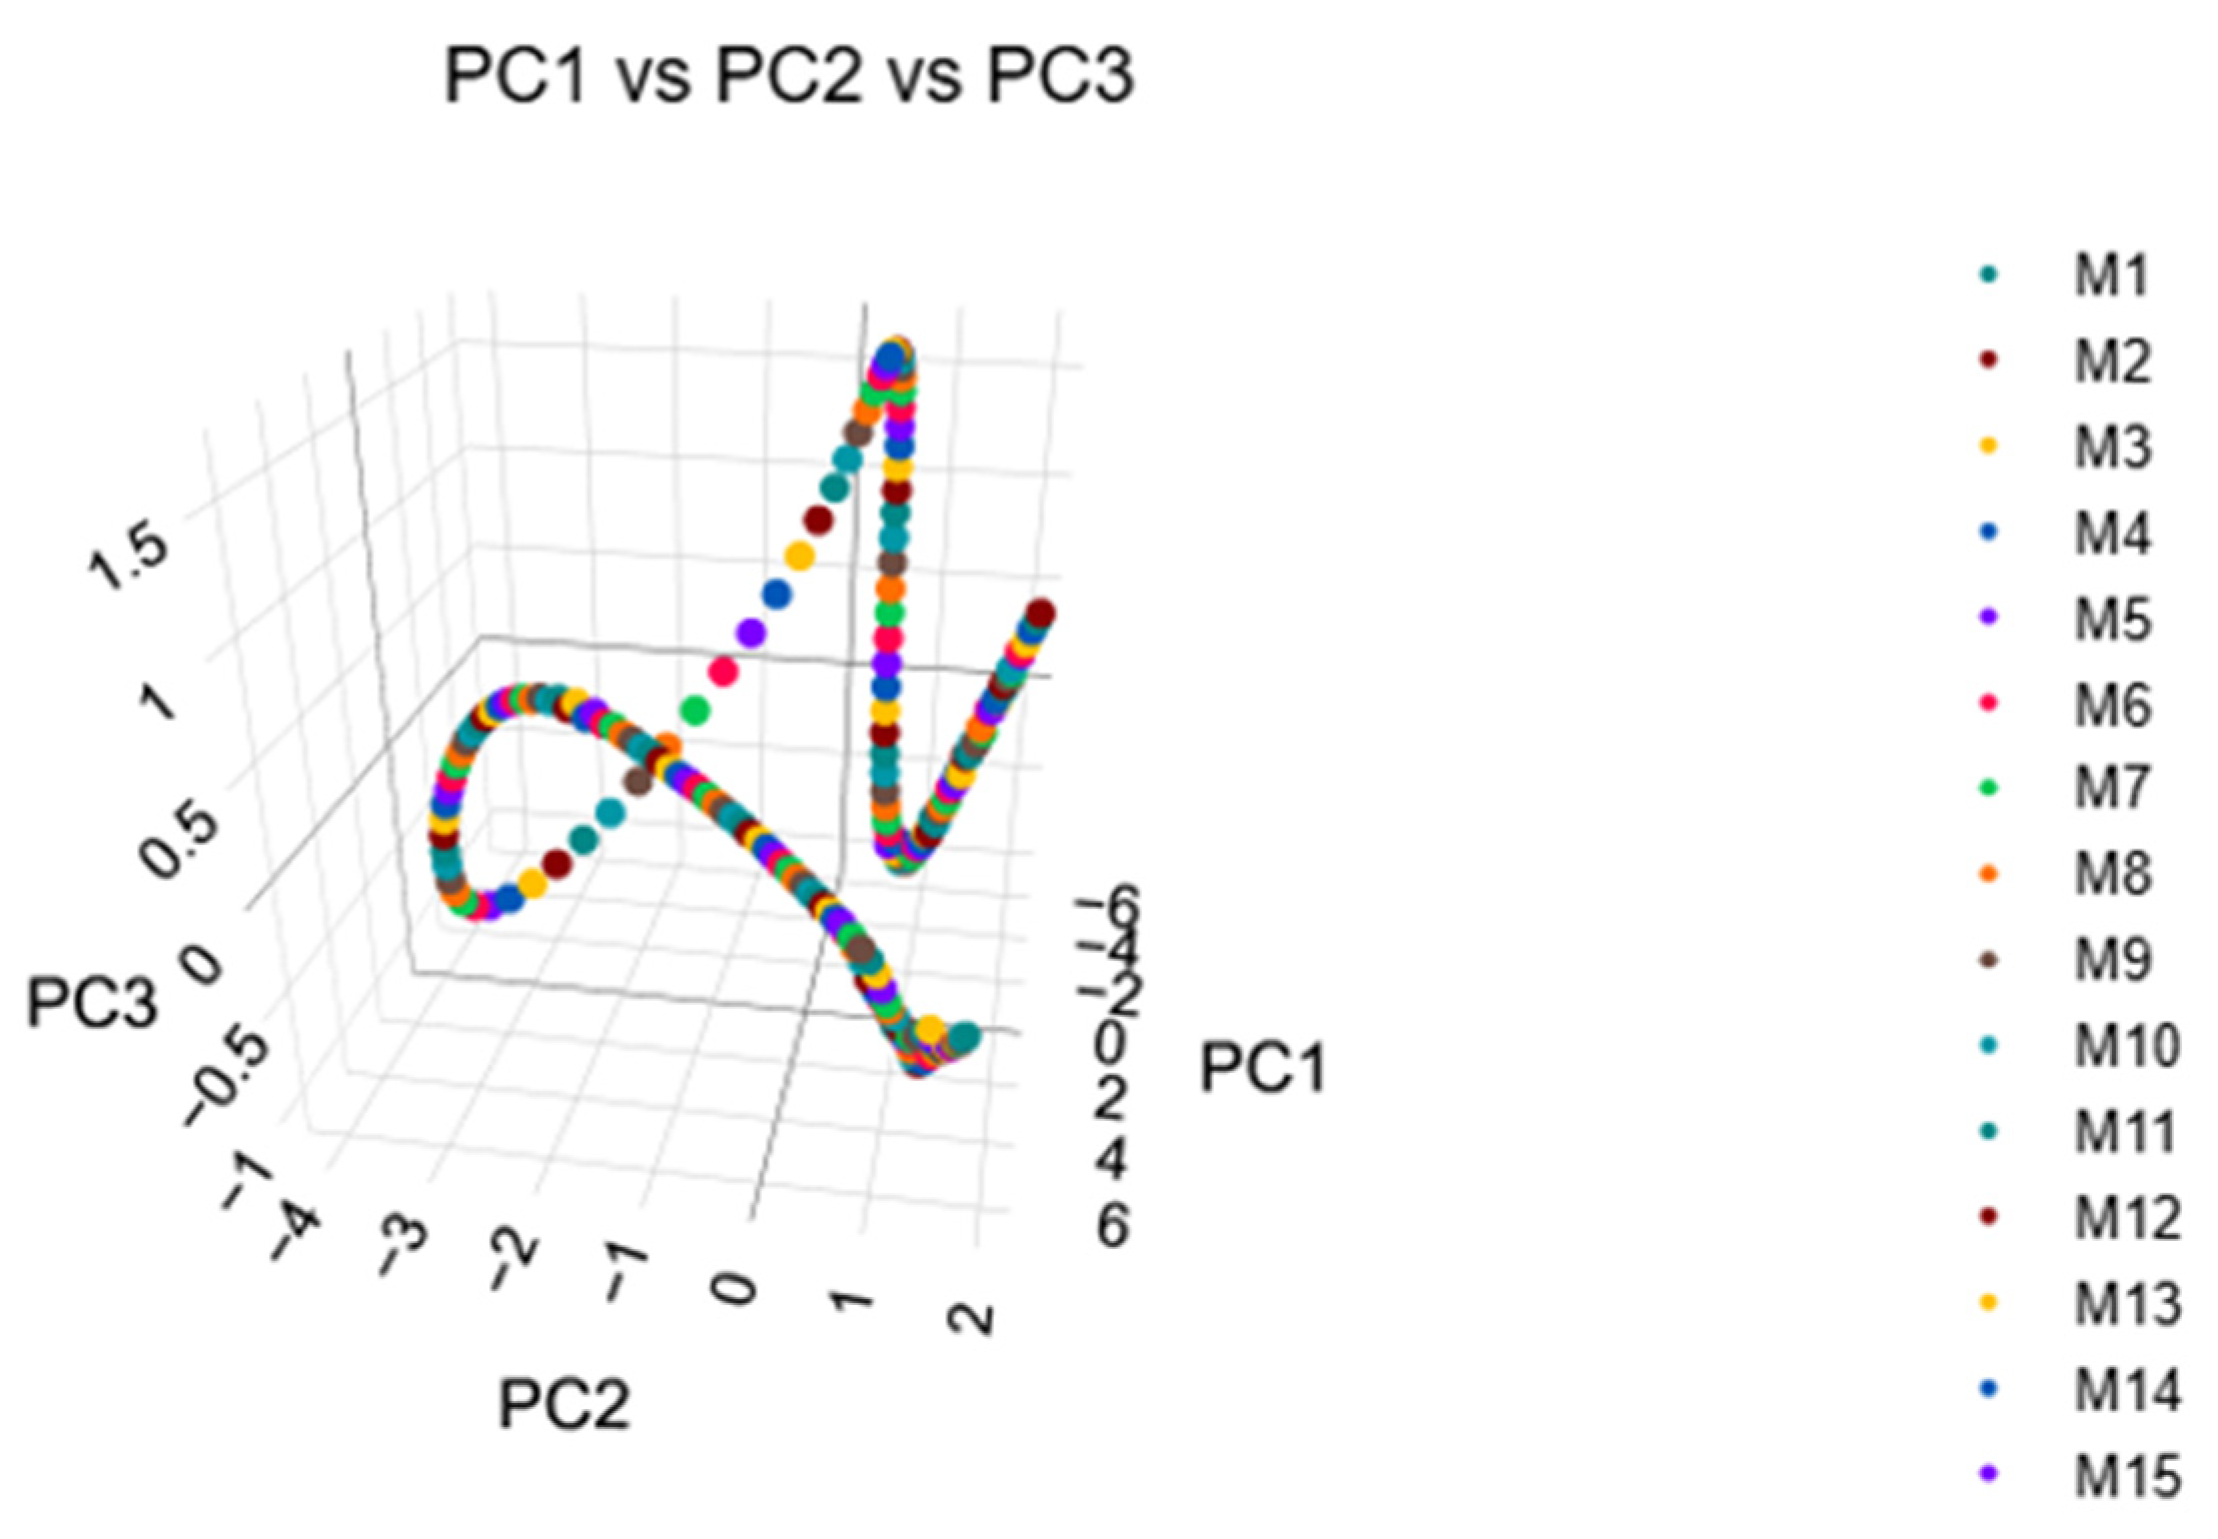
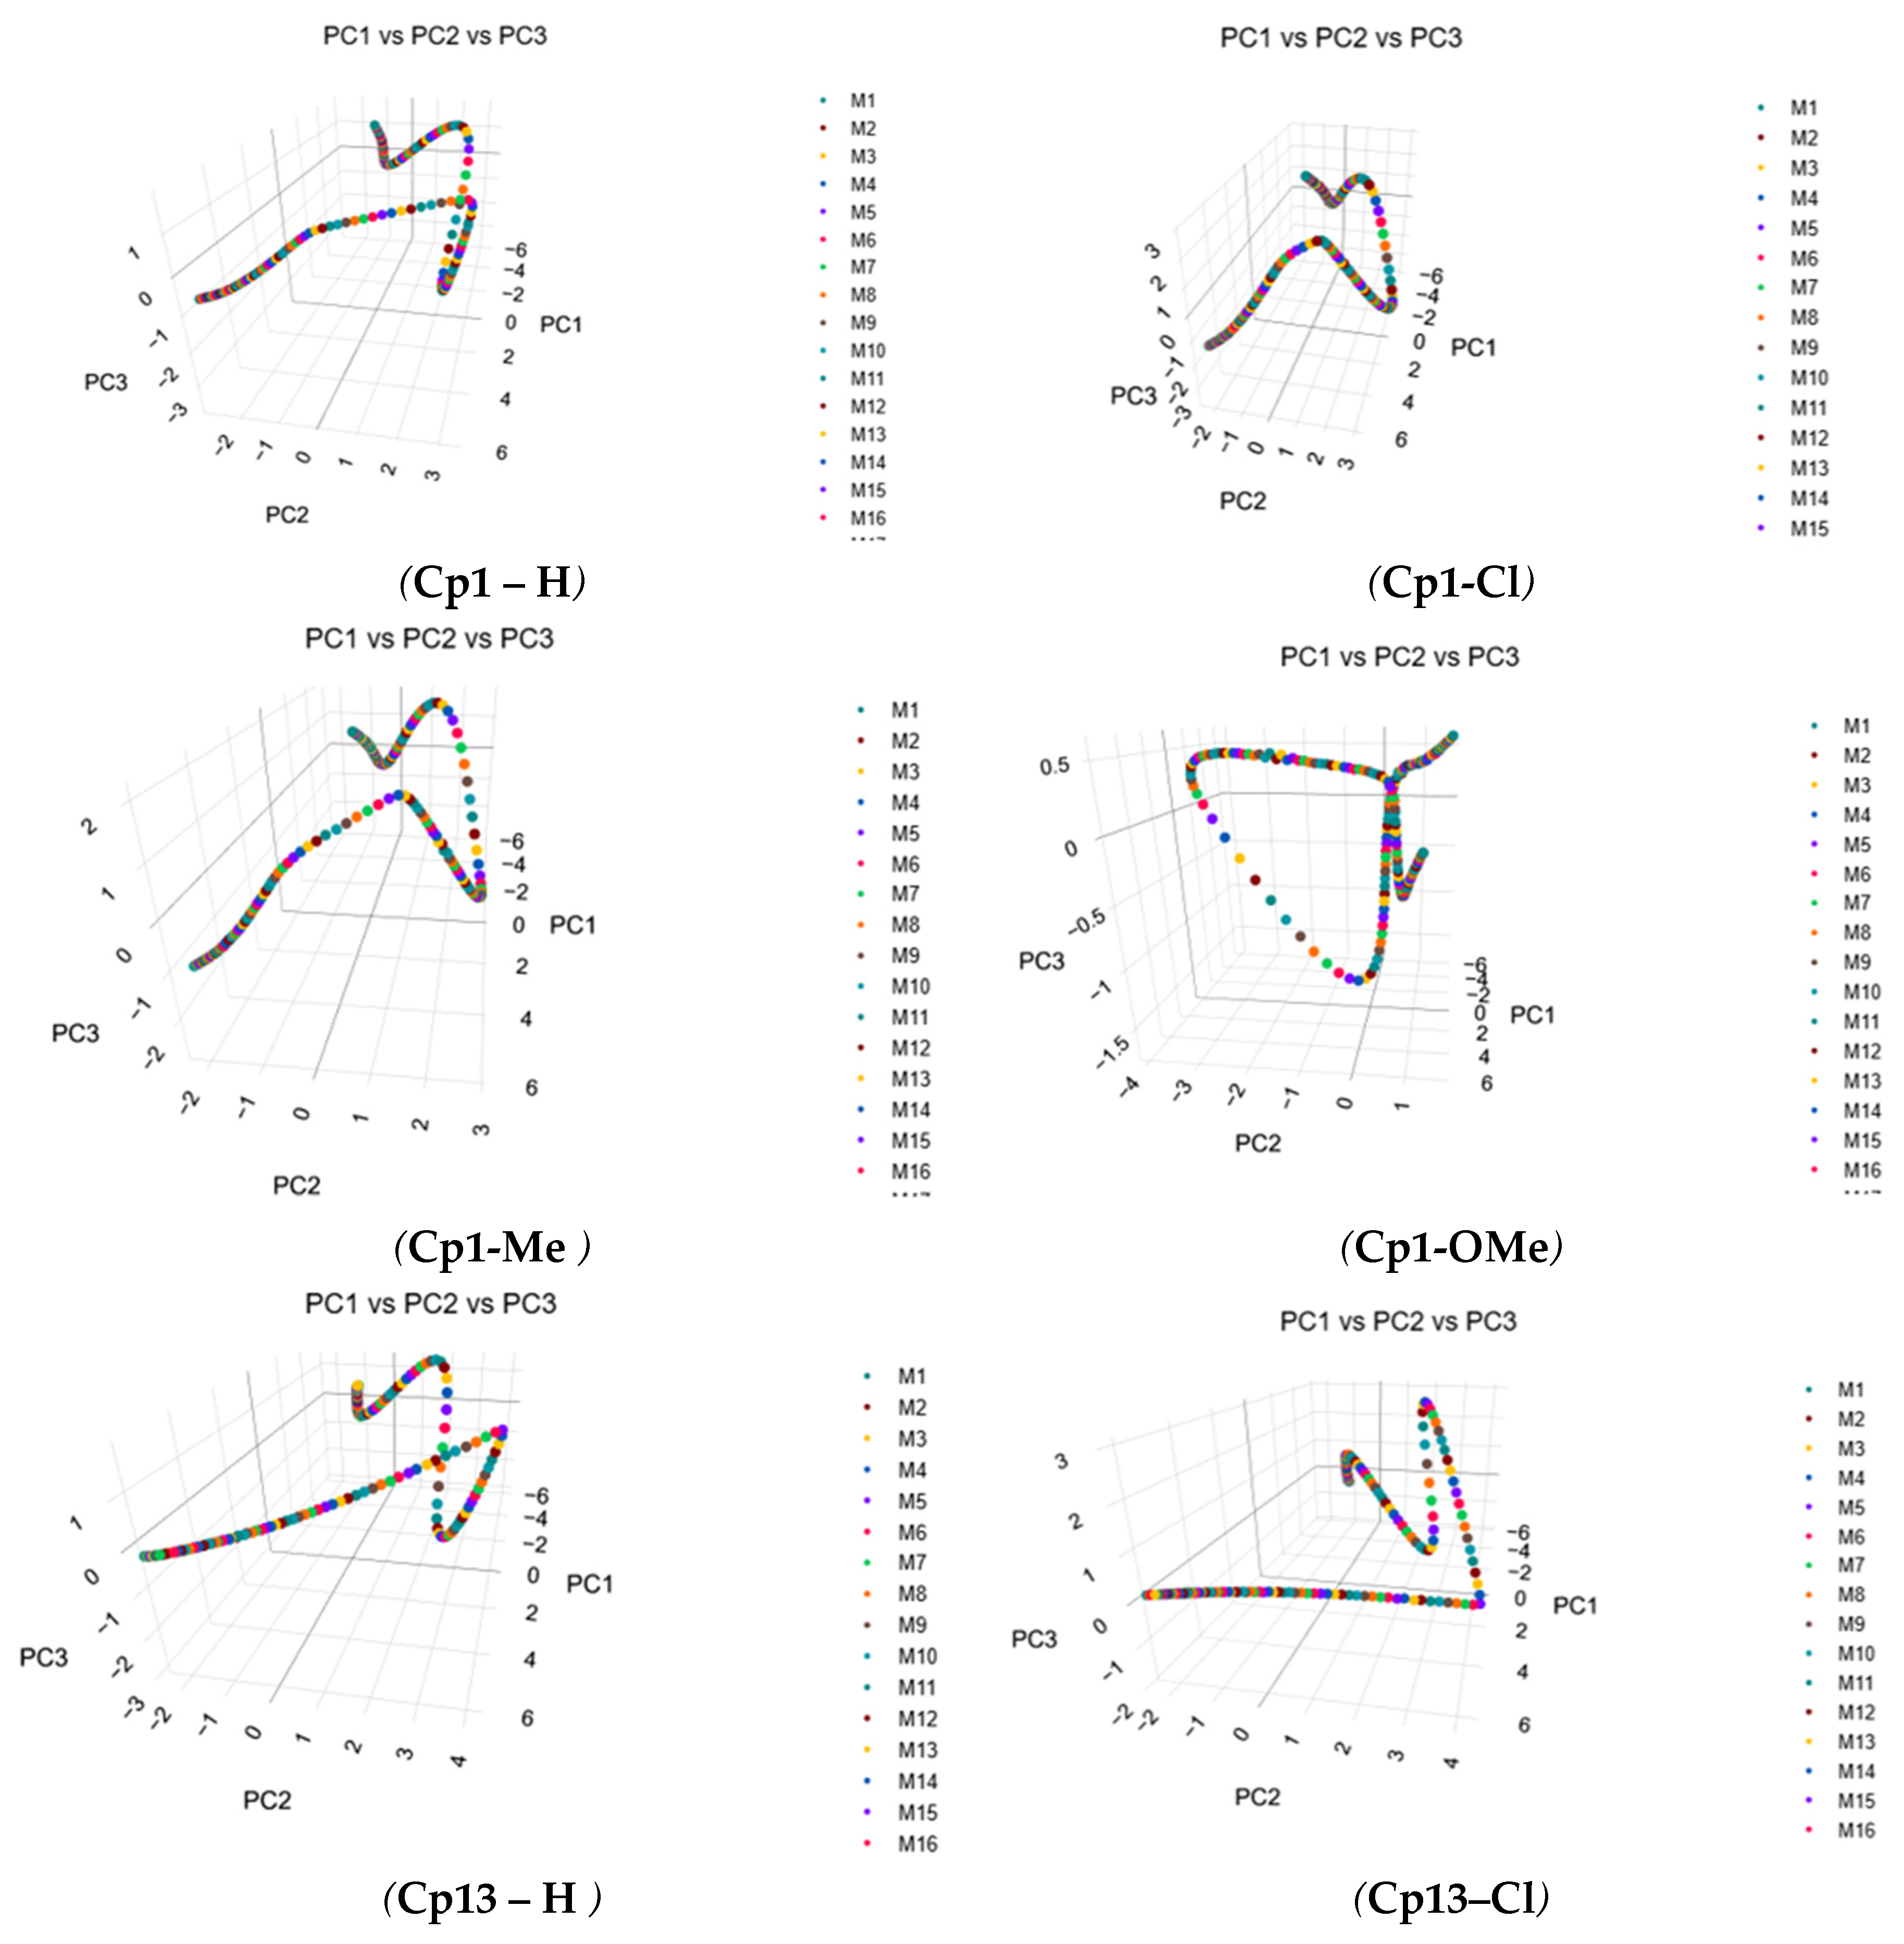
Figure 6 shows a 3D plot of PC1, PC2, and PC3 values at each point of the IRC. The axes PC2 and PC3 give complementary information to the reactivity classification obtained with PC1. This 3D representation allows grouping and gives possible subclasses among reactive structures, which may be related to orientation in space or charge distribution in the TS. A fundamental aspect in Table 5 is the sign change of PC1 coefficients, from one compound to another, indicating an inversion in the contribution of some variables on the reactivity. For example, for compounds Cp12, Cp13 and Cp1-H, the coefficients of the variables HOMO, LUMO, ΔEg (HOMO-LUMO Gap), η, μ, IBSI and atomic charges qC7, qC3, and qH5, are positive and consistent, indicating that the high contribution of these variables are associated with greater reactivity of the compounds, PC1>0. By contrast, for compounds Cp1-Cl, Cp1-Me, and Cp13-Cl, the coefficients of the variables HOMO, ΔEg (HOMO-LUMO Gap), η, μ and charges qC7, qC3, and qH5 change sign (negative values), revealing the relationship between these variables and lower reactivity, PC1<0.
The change of sign shows that the nature of substituents, electron donor groups (EDG), or electron withdrawing groups (EWG), changes the role of the descriptor in the reactivity of the compounds. For example, for compounds with chlorine (EWG), e.g., Cp1-Cl and Cp13-Cl, the variables hardness (η) and chemical potential (μ) have negative coefficients, implying these compounds respond in opposite way to the compounds with no substituent. For compounds that have positive sign coefficients for all variables, e.g. Cp12, Cp13, Cp1-H, the reactivity is dominated by the polarization and charge transfer ability, while the compounds with negative coefficients, e.g., Cp1-Cl, Cp1-Me, and Cp13-Cl electronic and steric effects compete and modify the relative contribution (coefficient) of the descriptors.
Figure 4S and Figure 7 are important to understand how the substituents modulate the reactivity along the reaction coordinate. Figure 10S (PC1 vs. PC2) displays the distribution of the 201 points in the IRC in 2D, where a clear separation is observed between the most reactive structures (PC1>0) and less reactive ones (PC1<0). This separation is relevant because PC1 represents a universal reactivity criterion, independent of the compound. Figure 7 is the 3D display PC1 vs. PC2 vs. PC3, adding an additional layer of information that allows visualizing the effect of EDG and EWG in the shape and orientation of the curve in the principal component space. The changes in the point distribution reflect profound changes in the electronic dynamic of the reaction, which manifest in the relative position of the TS and the dispersion of the points representing reactants and products. Figure 4S and Figure 7 demonstrate that PCA not only reduces the data dimensionality but also allows identifying reactivity patterns that are not evident using individual descriptors. This study confirms PCA as an important tool for mechanistic studies.

4.5. Hierarchical Cluster Analysis (HCA)

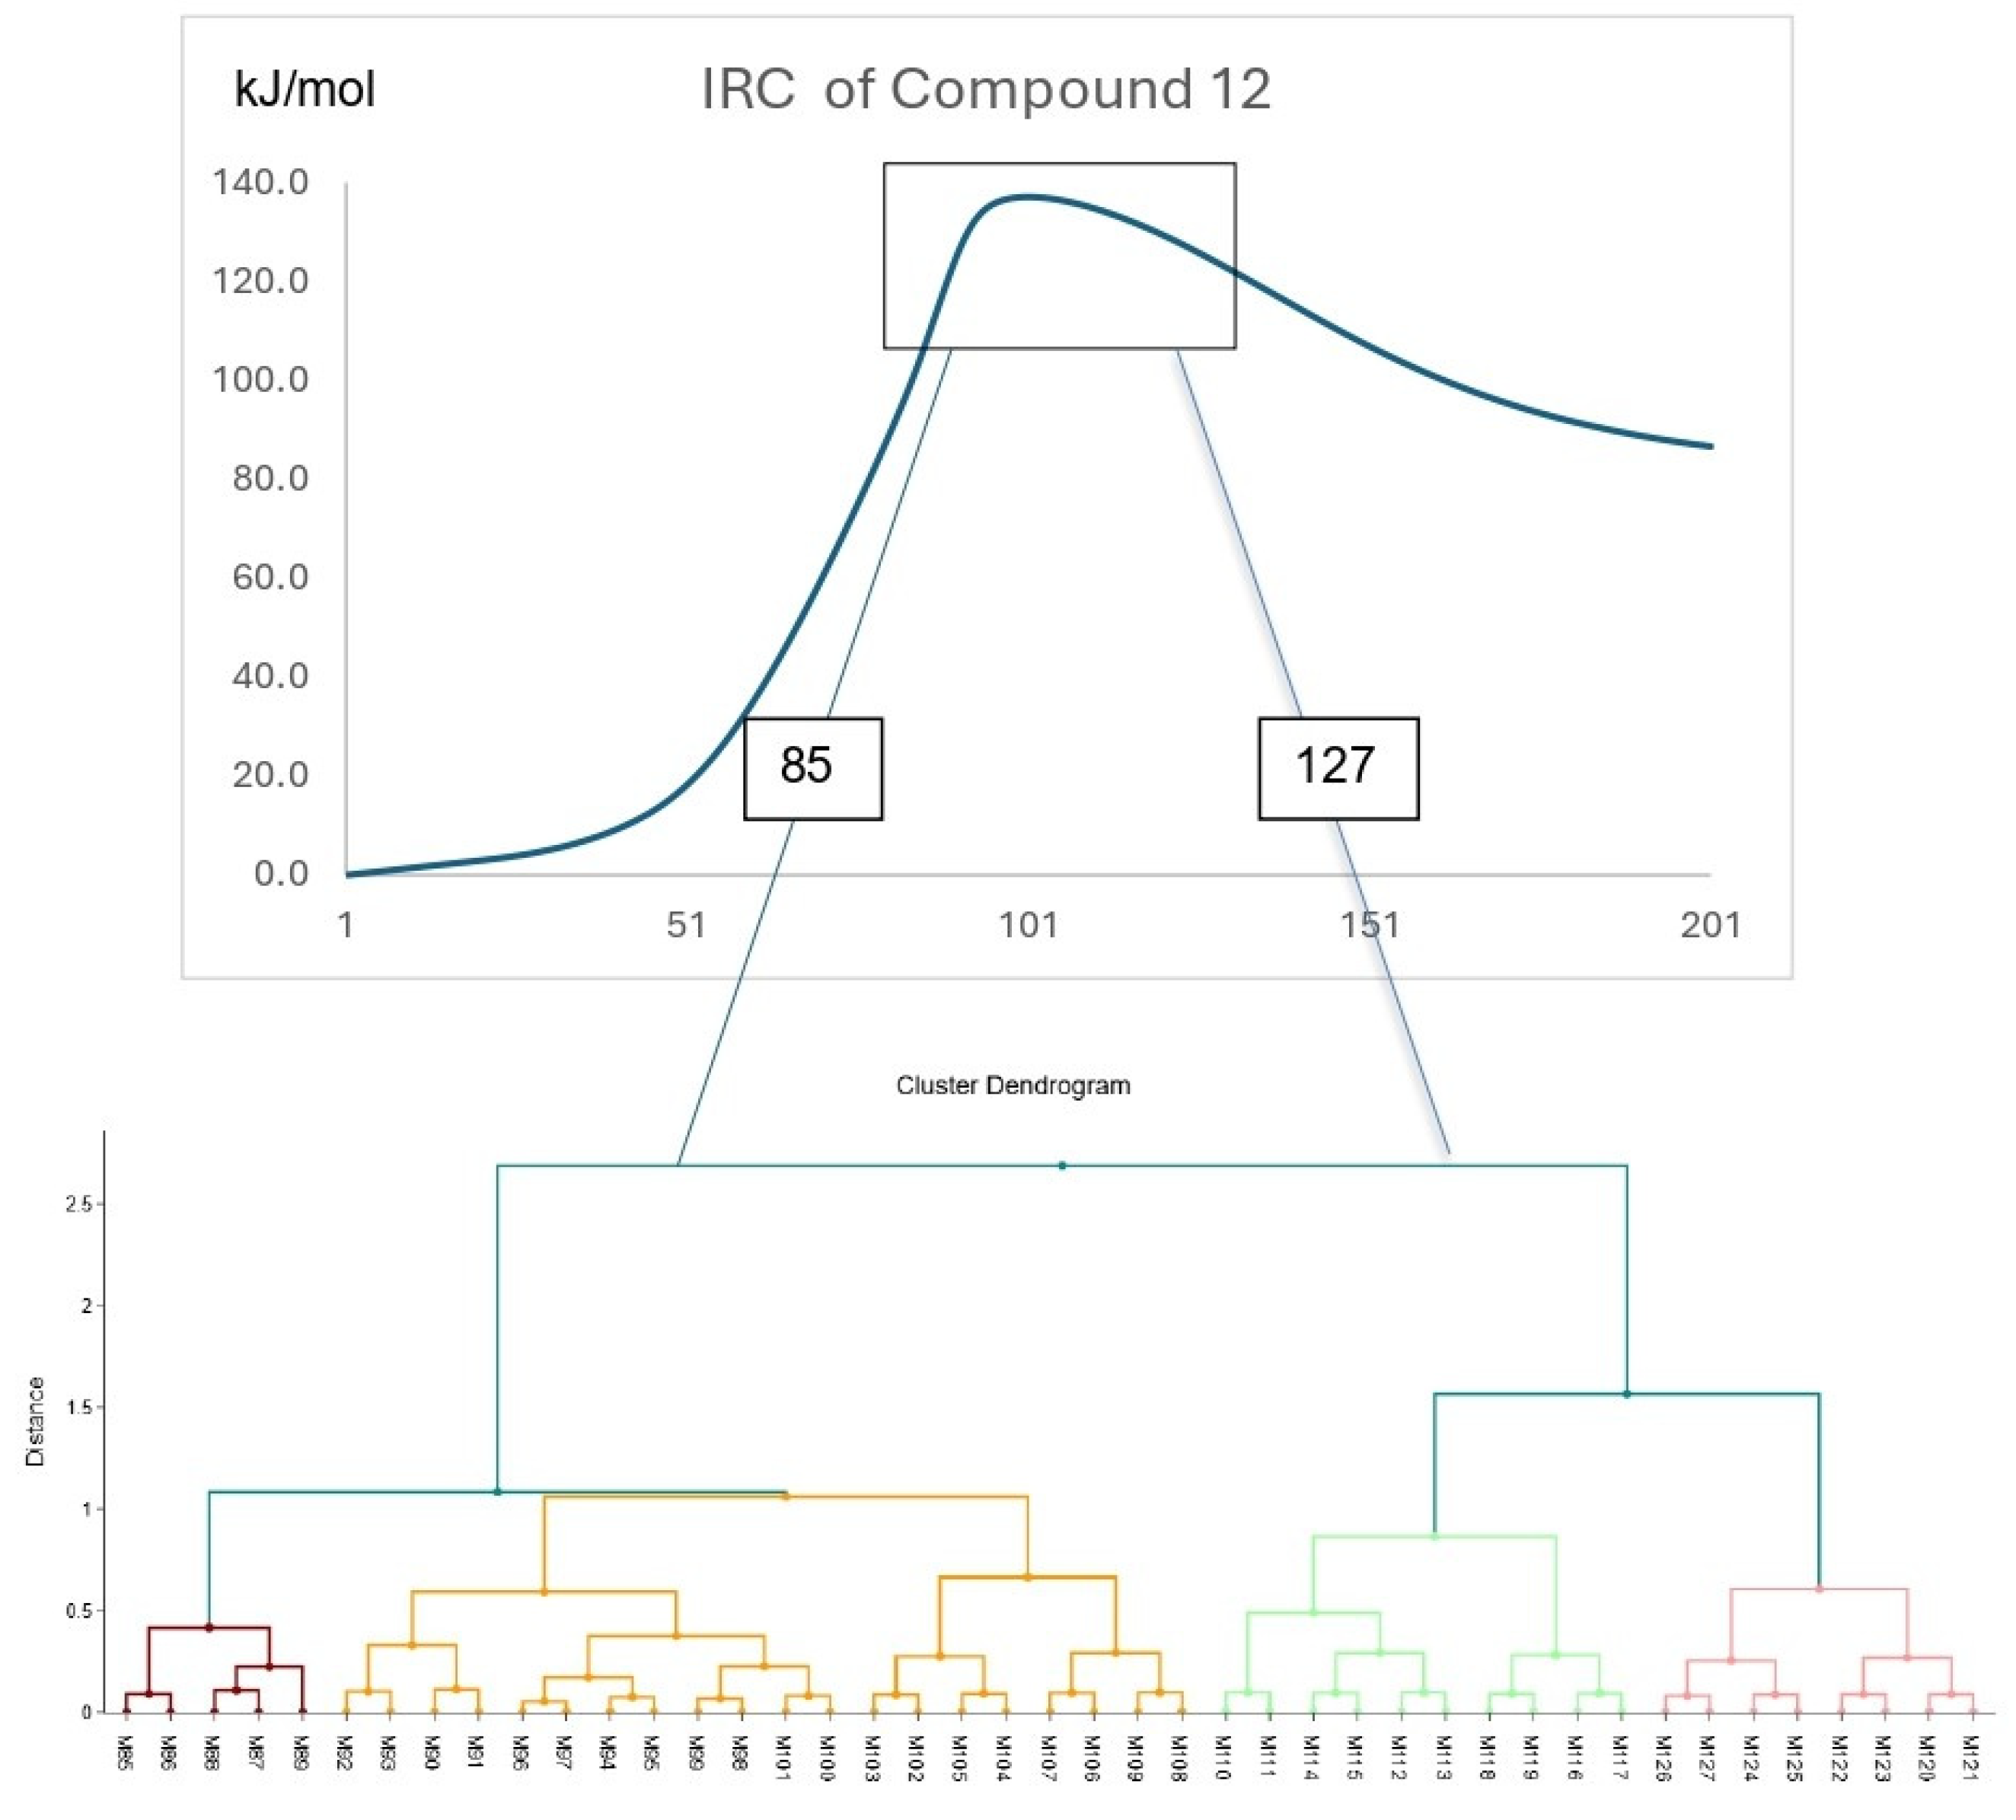
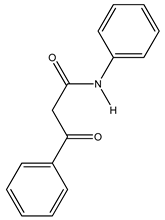
The hierarchical cluster analysis method was applied to 30 DFT descriptors, including frontier orbital HOMO-LUMO, global reactivity descriptors, IBSI and NPA charges for 61 IRC points between M85-M127 (30 points) and 30 points after the TS, M101. This selection allows focusing the analysis on the IRC regions with significant structural changes, i.e., proton transfer (associated with N4–H5 bond breaking and O2–H5 bond formation), and C3-C7 bond breaking. In contrast with energy diagrams like IRC, HCA does not follow a chronological order of events. HCA groups points by chemical similarity, calculated as the Euclidian distance between vectors of 30 descriptors. Points with similar electronic profiles are fused at short distances (short fusion altitude); points with different electronic signatures are separated (high fusion altitude). A dendrogram is a diagram illustrating hierarchical clustering. The dendrogram created is a sensible diagnostic tool to detect how substituents reorganize the topology of the potential energy surface. Comparative analysis of three representative compounds: compound 12 (acetoacetamide), compound 1 (N-phenyl-3-oxobutanamide or acetoacetanilide), and compound 13 (N-phenyl-3-oxo-3-phenylpropanamide or 2-benzoylacetanilide), reveals a systematic trend that correlates the number of aromatic rings with the redistribution of points along the IRC, Figure 8, 5S for compounds 1 and 13. Dendrogram of compound 12 (acetoacetamide), Figure 8, shows the points are organized in three groups. Reactant points, M85-M100 for a compact cluster, fusing at shorter distances, compared to the rest of the dendrogram. In this region of high chemical similarity, IBSI bond indexes are close to the reactant values (IBSI_N4–H5 ≈ 0.72, IBSI_C3–C7 ≈ 1.02), and NPA charges are stable (O2 ≈ −0.54, N4 ≈ −0.78). The TS occupies a separate branch from the reactant block, joining with the rest of the tree at a fusion altitude higher than the height observed for the reactant points. This difference is due to the 30 descriptors reaching peak values at the saddle point: IBSI_O2–H5 = 0.91 (maximum), IBSI_N4–H5 = 0.32 and IBSI_C3–C7 = 0.45 (minimum), ΔEg gap HOMO–LUMO = 3.61 eV (global minimum), hardness η = 1.81 eV (minimum) and electrophilicity ω = 4.74 eV (maximum).
The electronic signature of the TS is clearly differentiated from the reactant region. The products region, M102-M127, is not a unique block; instead, there are different fusion heights, showing more variability than the reactant region. The dispersion observed for acetoacetamide, compound 12, is a consequence of instability due to lack of resonance stabilization in the absence of phenyl groups; e.g., charges NPA of N4 and O2 vary from (−0.87 to −0.89 and −0.62 to −0.64, respectively.
In compound 1 (acetoacetanilide), the presence of a phenyl substituent at the nitrogen substantially modifies the dendrogram topology (Figure 5S). The TS shifts to a more centered position in the dendrogram, fusing earlier with the product and at intermediate fusion altitude, compared to compound 12. This shift is due to stabilization by resonance of the negative charge at N4, developed during the proton transfer. In the TS region for compound 1, charge values are less extreme, IBSI_O2–H5 lowers to 0.89, IBSI_N4–H5 increases to 0.35, IBSI_C3–C7 increases to 0.48, and qN4 becomes more negative (−0.88). The TS is chemically less extreme; the vector of descriptors is closer to products. The product region M102-M127, is more compact than compound 12: fusion distances are shorter; however, the effect is less pronounced than compound 13. This behavior reflects the effect of the phenyl group, stabilizing N4 charge, reduction conformational fluctuations and homogenizing descriptor values in the products.
Compound 13 (2-benzoylacetanilide), with two phenyl groups, has greater reorganization of the dendrogram. This shift is the result of the cumulative effect of the phenyl ring on N4 stabilizing the developing negative charge during the proton transfer, and the phenyl ring on C3 stabilizes the polarization of on the alpha carbon, during the C3-C7 bond breaking. In the TS descriptor values in compound 13 are less extreme compared to compounds 12 and 1. TS values are: IBSI_O2–H5 = 0.87, IBSI_N4–H5 = 0.38, IBSI_C3–C7 = 0.50, charges NPA qN4 = −0.90 and q C3 = +0.71 (less positive than the TS charge on C3 for compounds 12 and 1). The TS is chemically similar to products; HCA places the TS and product on the same tree branch. The products region, M102-M127 for a very compact cluster, with the lowest fusion distances in this study, indicating the values of the product descriptors are very close. The resonance stabilization by two phenyl groups produces stable descriptor values; for example, NPA charge, qN4, only varies from −0.90 to −0.91; qC3 between +0.70 and +0.71, IBSI_O2–H5 between 0.98 y 0.99, and IBSI_C3–C7 between 0.01 and 0.02. This homogeneity is seen in the close, compact HCA grouping.
HCA analysis utilizing 30 descriptors, gives information about small structural changes along the reaction, which cannot be observed with Ea analysis alone. Parameters that influence the regrouping of points are bond indexes IBSI (O2-H5, N4-H5 and C3-C7), and NPA charges qN4, qO2, and qC3; these parameters show important changes along the IRC and are affected by the presence of phenyl groups.
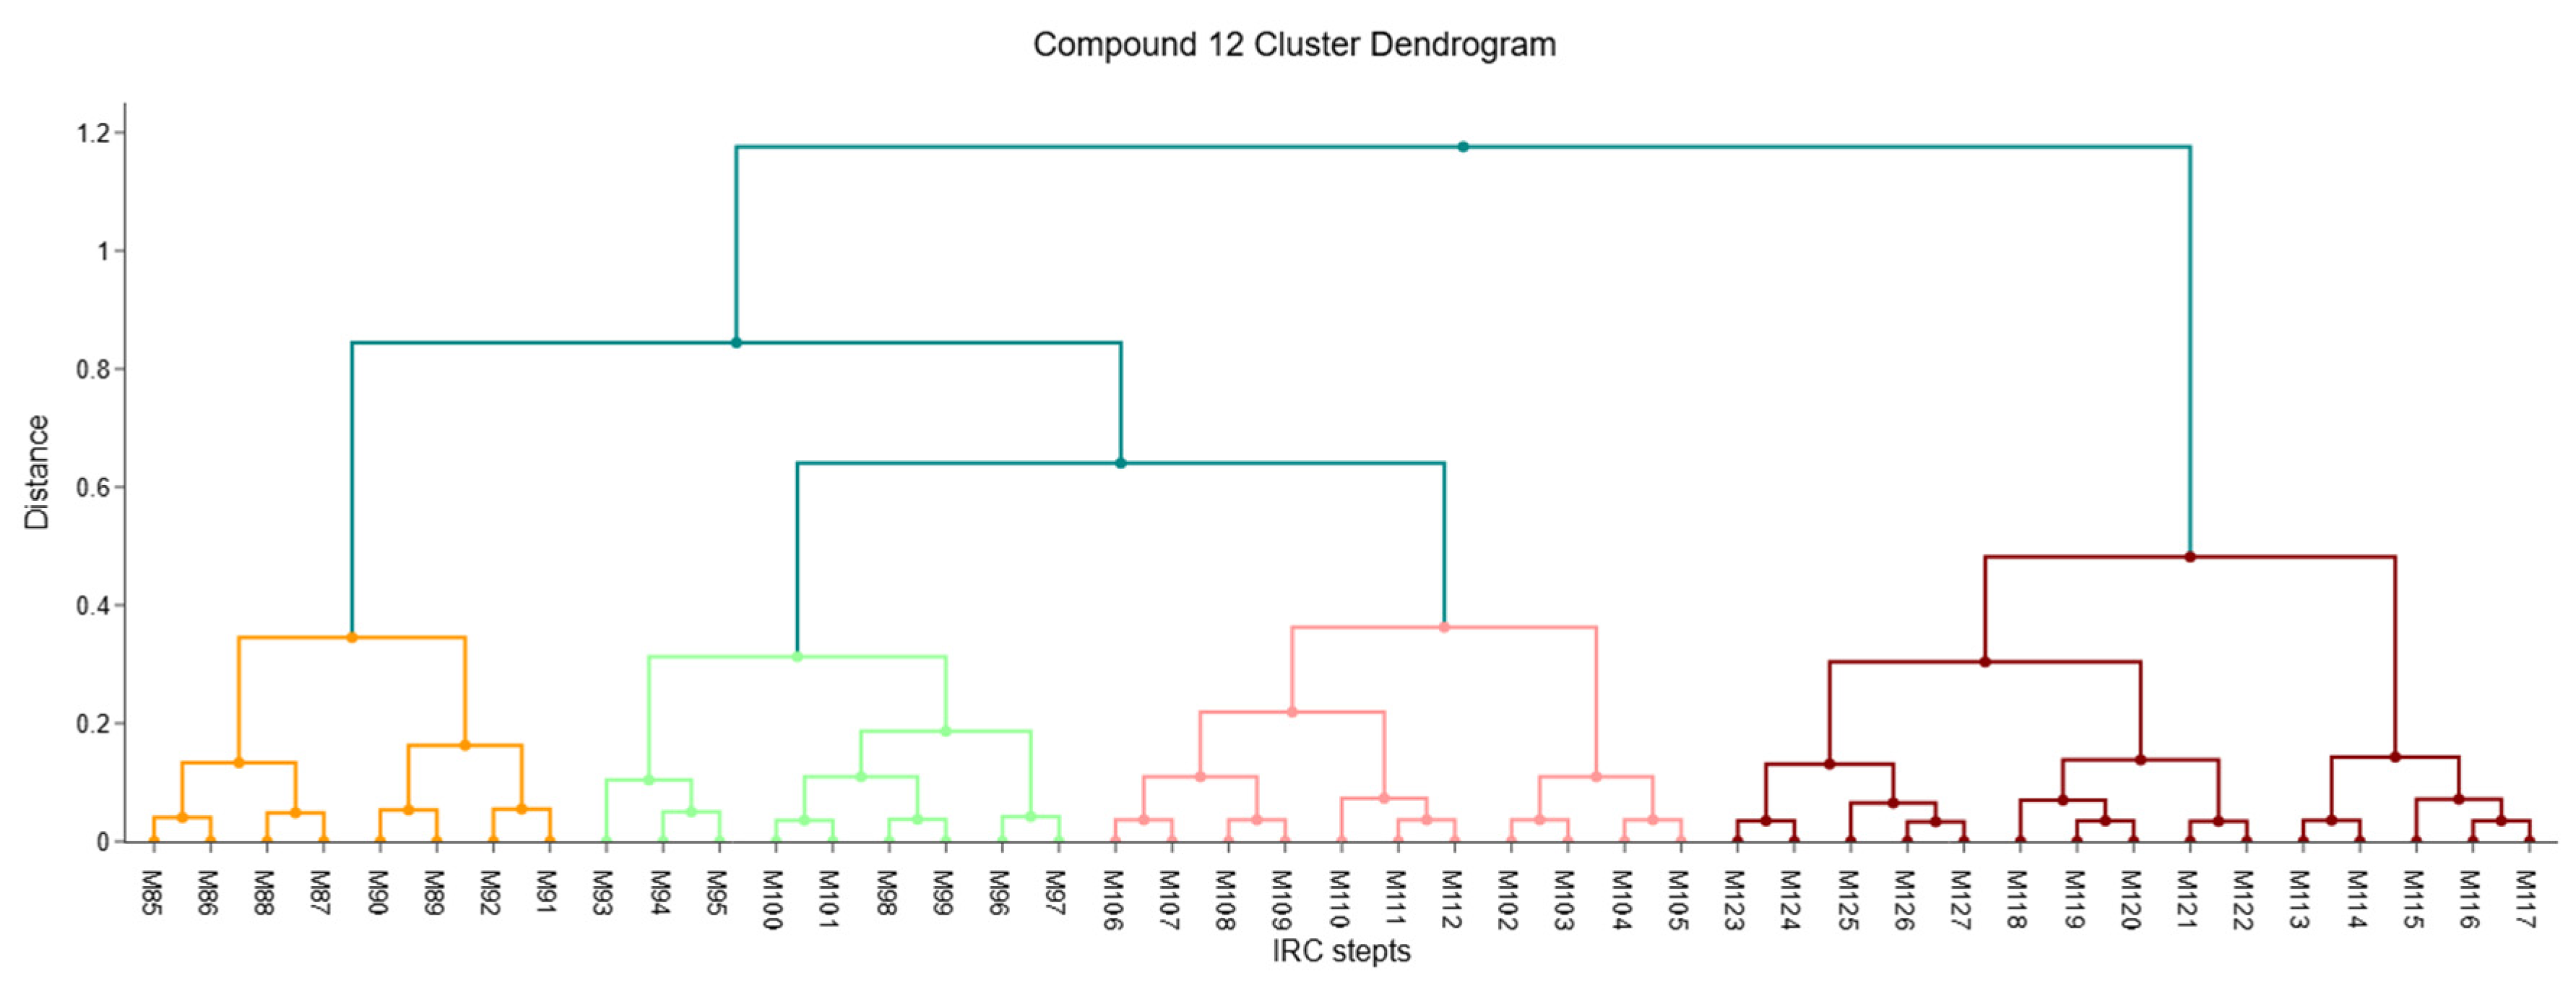
The HCA dendrogram produced for compound 12 using only 13 variables with positive coefficients in PC1 (Figure 9, Table 4) has essentially the same structure of the dendrogram generated with 30 variables (Figure 9). Reagents (M85-M100) for a compact cluster, the TS M101 is clearly separated, and the products (M102-127) have a disperse distribution. This result imply that the variables selected from PC1 are determinant in the process: capacity to polarize the electron cloud (associated with energies HOMO, LUMO, ΔEg Gap), the ability to transfer charge (associated with η, μ), bond strength of bonds that break and form during the reaction (IBSI), and charge redistribution (NPA) of the atoms involved in the TS. PCA not only reduces the dimensionality of the data but also identifies key parameters influencing the pyrolysis of acetoacetamide (compound 12), thereby validating this method as a tool for investigating reaction mechanisms.

4.6. Dynamic Synchronicity, SyD

Traditionally, the degree of concertation in a reaction has been evaluated using Moyano's synchronicity index [54], which is calculated from the changes in Wiberg bond indices between the transition state (TS) and the reactants. Although this approach has been widely used, it offers a static and punctual view of a process that is, by nature, dynamic and evolutionary. To overcome this limitation and obtain a more complete characterization of the mechanism, in this work we introduce a new descriptor: Dynamic Synchronicity (SyD). This descriptor is calculated by applying the same Moyano equation (Equation 3) to each of the 201 points along the intrinsic reaction coordinate (IRC), using the Wiberg indices obtained from NBO analysis.
This evolutionary approach allows us to build a complete synchronicity profile that reveals how the mechanism behaves at each stage of the process, from reactants to products. By analyzing these profiles for different compounds and mechanisms, we can extract mechanistic information that the static TS value cannot provide, making SyD a dynamic "fingerprint" of the reaction mechanism.
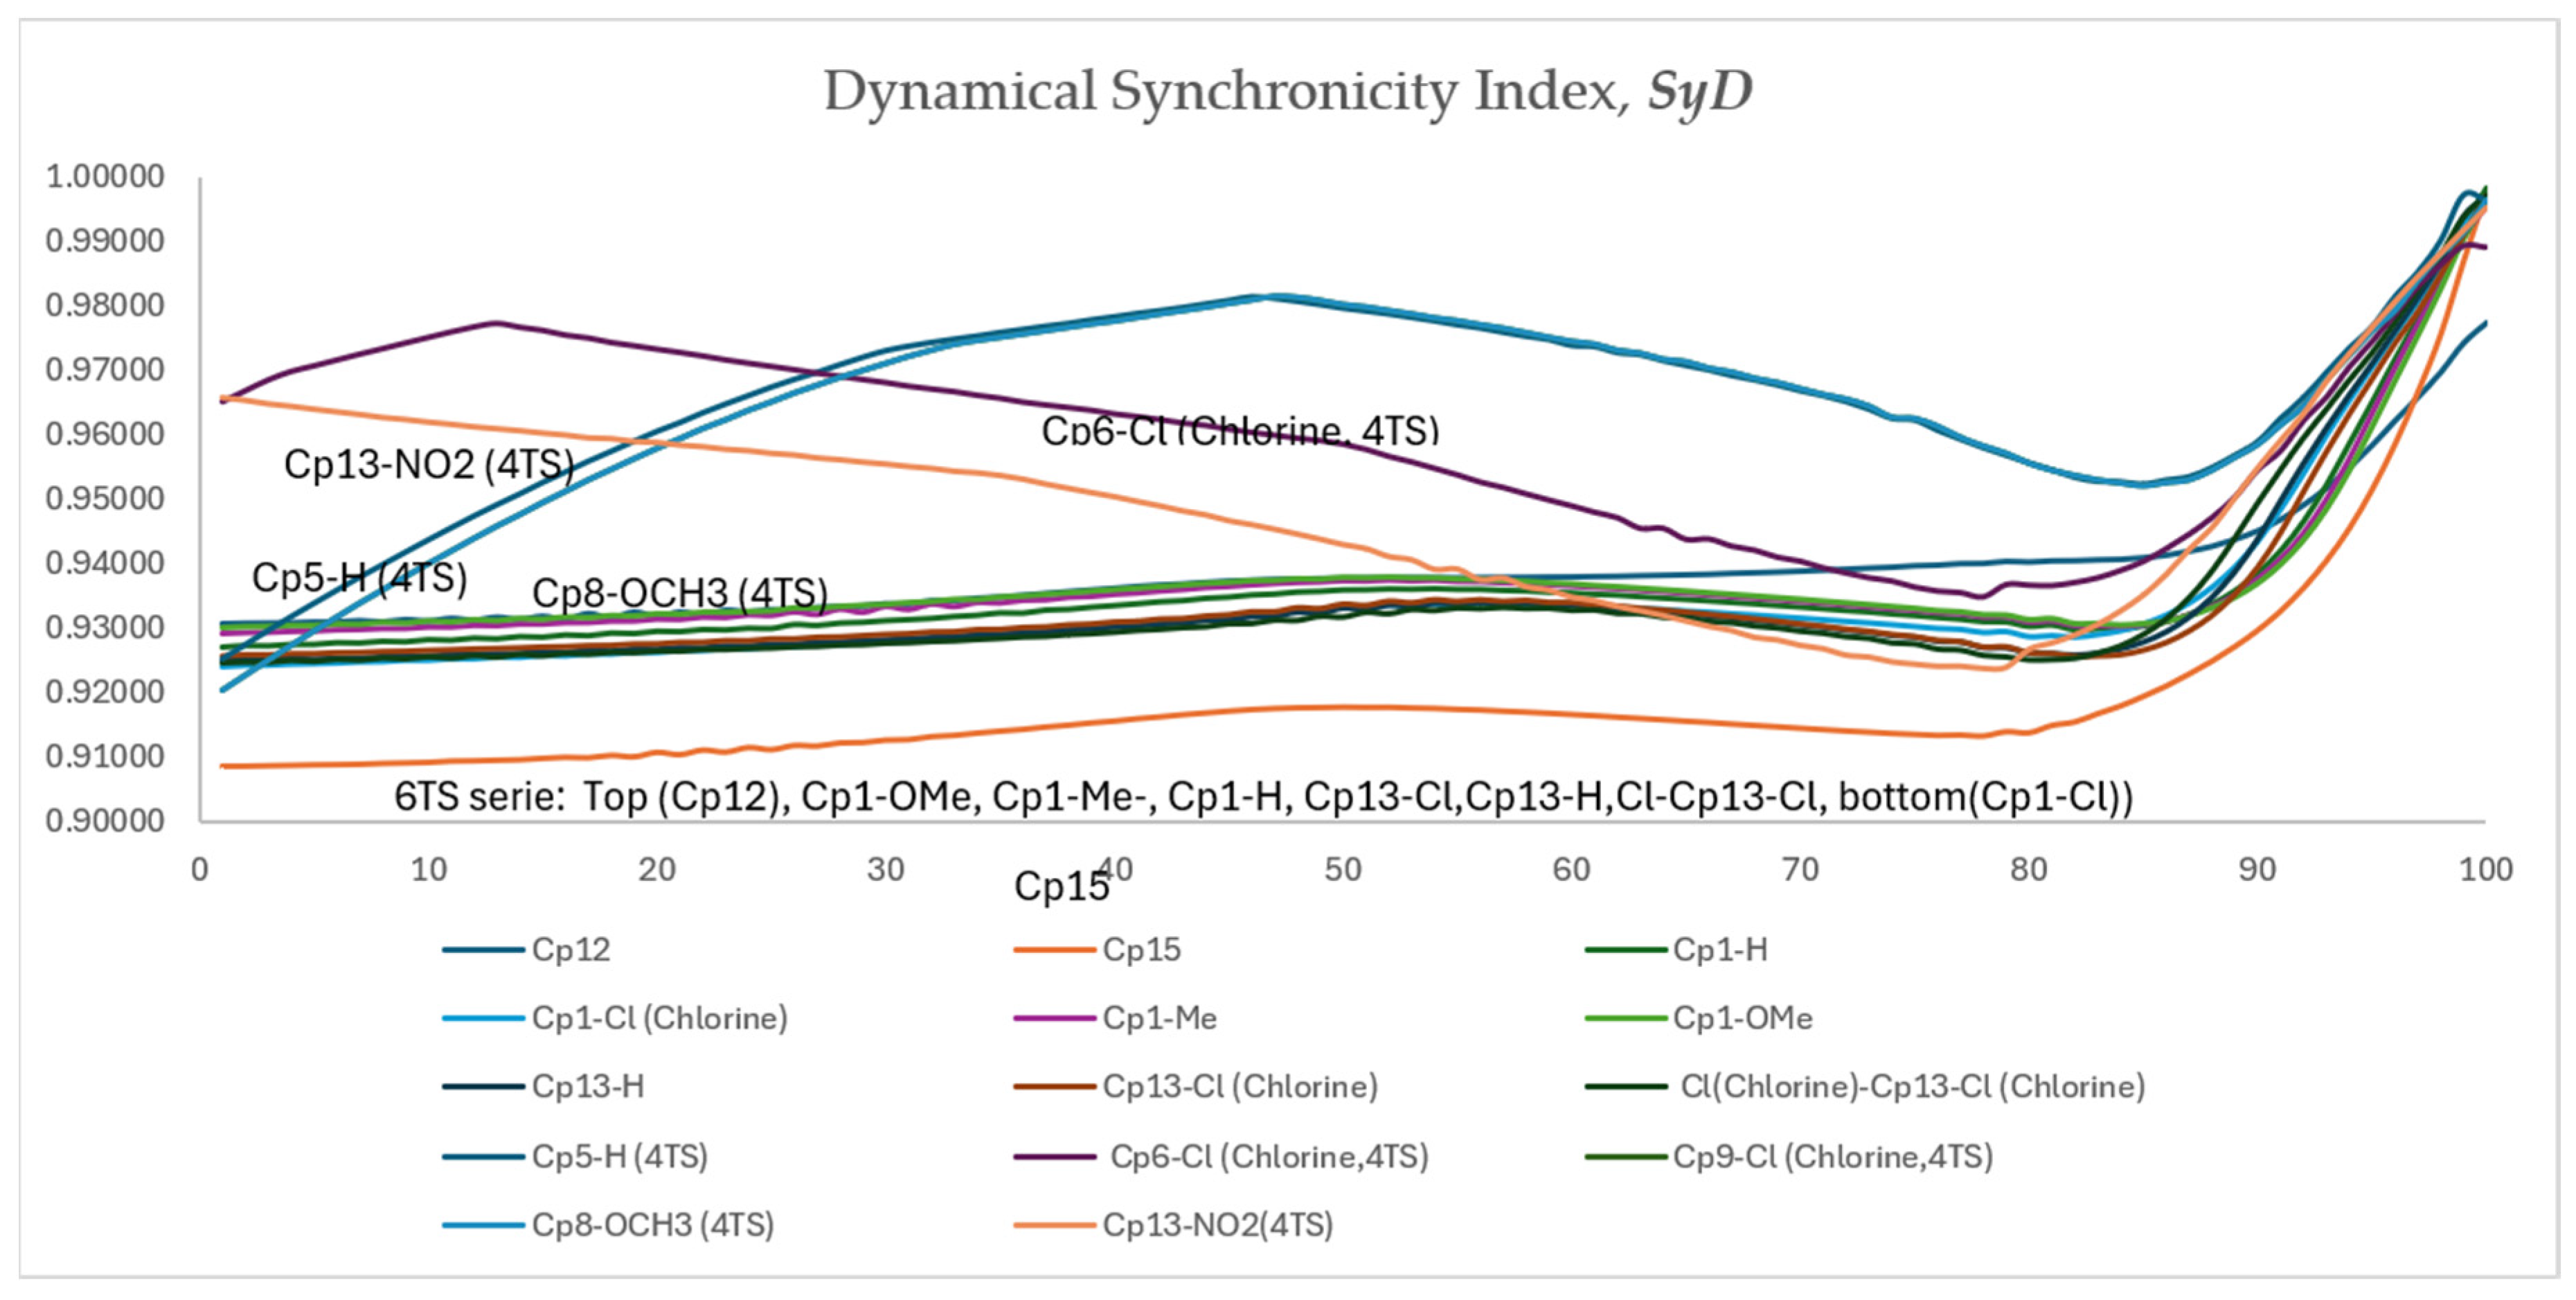
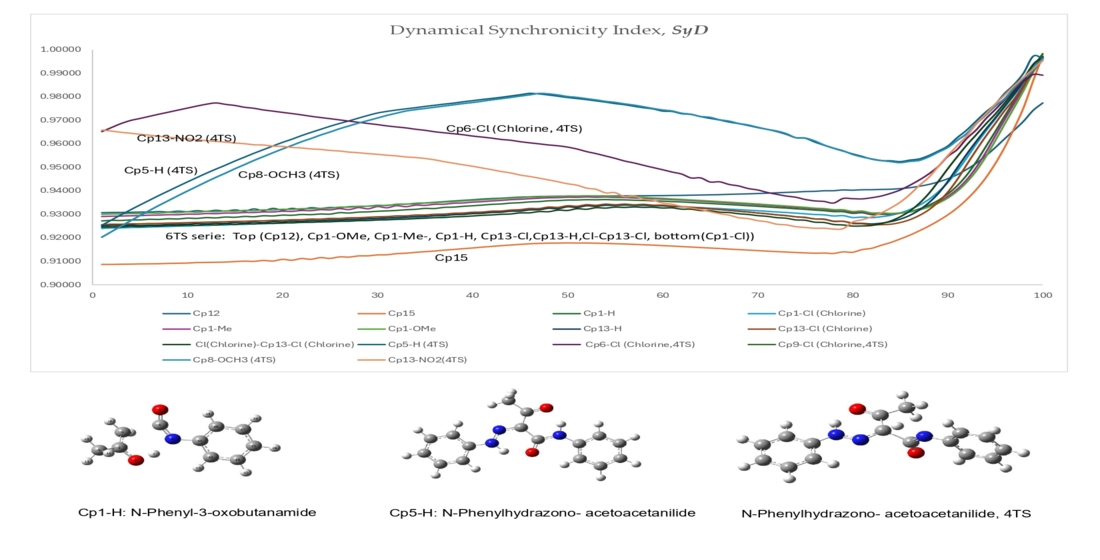
Figure 10 shows the SyD profiles for all compounds studied through the six-membered transition state mechanism (6TS), while Tables 6A and 6B present representative values of these profiles. A key finding is that all curves for the 6TS mechanism converge to the same global shape, characterized by a progressive increase of SyD from the reactant region (values ~0.93) to a maximum near the TS (values close to 0.99, point 100, Table 5A), followed by a slight decrease toward the products. This convergence indicates that, regardless of the substituent or the nature of the compound, the essence of the concerted six-membered mechanism remains the same. However, the exact position of the curve and its slope in the region near the TS are extremely sensitive to the electronic nature of the substituents. We observe that for compounds with electron-donating groups (EDG, such as -Me and -OMe), the SyD profile shows a smoother and more sustained increase along the IRC, reaching higher values in the TS region (for example, SyD≈0.998 for Cp1-OMe and SyD≈0.996 for Cp1-Me at point 100, Table 5A). This behavior is the quantitative manifestation of a highly synchronous mechanism, where proton transfer (N4–H5 bond breaking and O2–H5 bond formation) and C3–C7 bond breaking occur almost simultaneously.
In contrast, for compounds with electron-withdrawing groups (EWG, such as -Cl), the SyD profile is more abrupt and reaches notably lower values at the TS (for example, SyD≈0.997 for Cp1-Cl at point 100, Table 5A). Although this decrease seems subtle, it is highly significant from a mechanistic point of view. It indicates that the mechanism becomes more asynchronous. EWGs destabilize the TS by failing to compensate for the developing partial charge, forcing the system to proceed more sequentially: proton transfer must be more advanced before C-C bond breaking can occur effectively. This behavior is even more pronounced in compound Cp13-NO₂, where the curve clearly separates from the rest of the family, showing the destabilizing effect of the nitro group and confirming that the SyD descriptor can detect even subtle differences in mechanistic behavior.
The true power of the SyD descriptor becomes evident when comparing the 6TS mechanism with the alternative four-membered mechanism (4TS). In Figure 10, the SyD profiles for the 4TS mechanism (dashed lines) are not only significantly lower in magnitude in the TS region (values ~0.99, Table 5B), but they also do not converge to the same pattern. The shape of the curve varies drastically depending on the compound; only compounds Cp5-H and Cp8-OCH3 show a similar trajectory, while the rest show profiles with plateaus, inflexions, and erratic behaviors. This behavior is a direct reflection of the greater strain and conformational restriction of the four-membered ring. In this TS, the transfer of the amide proton to the α-carbon is a highly unfavorable event from an enthalpic point of view and is spatially demanding, requiring a rotation of approximately 90° of the hydrazone fragments (see Figure 3) to orient the α-carbon favorably. SyD captures this complexity. For example, compound Cp6-Cl (4TS) shows a profile with a pronounced plateau and values below 0.93 near the TS (Table 5B), indicating that bond breaking and formation are highly decoupled. The effect of the substituent is chaotic because the restricted geometry of the 4-membered ring amplifies local steric and electronic interactions in a way that does not follow a simple linear trend, unlike what occurs with the 6TS mechanism.
To further validate the sensitivity and general applicability of the SyD descriptor, we extended the analysis to include additional compounds that were not part of the main thermodynamic study (Figure 11). These structures: Cp13-NO₂ (4TS), Cp13-Cl (chlorine), and the unsubstituted pentane-2,4-dione (Cp15), were selected to test the descriptor's response under extreme electronic conditions and in the absence of aromatic stabilization. The inclusion of these compounds serves multiple purposes. First, Cp15 (pentane-2,4-dione) represents the simplest structural scaffold, lacking the amide nitrogen and the aromatic rings present in the other compounds. Its SyD profile (Figure 10, Table 5A) shows a smooth and highly synchronous behavior, with values reaching 0.997 at the TS (point 100). This confirms that the fundamental six-membered proton transfer mechanism is inherently synchronous, and that the presence of the aryl groups in the other compounds modulates but does not alter this basic behavior. Second, Cp13-Cl (chlorine) was included to evaluate the effect of a chlorine substituent at a different position than in the main series. Interestingly, its SyD profile (Figure 10) closely follows the pattern of the other chlorinated compounds (Cp1-Cl and Cp6-Cl), demonstrating that the descriptor is sensitive to the electronic nature of the substituent (electron-withdrawing) rather than its specific position in the molecule. This positional independence reinforces the robustness of SyD as an electronic descriptor.
Third, and most importantly, Cp13-NO₂ (4TS) was included to explore the behavior of SyD under an extreme electron-withdrawing condition within the four-membered mechanism. The resulting profile (Figure 10, Table 5B) shows the most asynchronous behavior of the entire series, with values dropping below 0.99 in the TS region and a markedly different shape compared to the other 4TS compounds. This indicates that the strong electron-withdrawing nature of the nitro group severely destabilizes the already constrained four-membered TS, forcing an even more sequential bond breaking/formation process. This result is consistent with the general trend observed for EWG substituents (more asynchronous mechanisms) and provides additional evidence that SyD can detect and quantify even extreme electronic perturbations.
The results presented validating SyD as a sensitive, robust, and novel descriptor for the study of reaction mechanisms. It not only confirms that the 6TS mechanism is the predominant one (by showing more synchronous and energetically favorable profiles, Table 2) but also allows the classification and quantification of substituent effects in a way that was not possible with static indices. The ability of SDy to clearly differentiate between mechanisms (4TS vs. 6TS) and between families of substituents (EDG vs. EWG) positions it as a powerful and versatile tool for mechanistic characterization in computational chemistry.
The implementation of SyD in this work not only provides a deeper insight into the pyrolysis mechanism of β-ketoamides and hydrazones but also lays the groundwork for its application in the study of a wide variety of concerted reactions, making it a significant methodological contribution to the field of computational chemistry.
Table 5. A. Sample SyD values evaluated along the IRC, utilizing Wiberg indexes and NBO, calculated at GD3BJ/Def2TZVP level of theory at 450 K.
IRC PAIR Cp12 Cp15 Cp1-H Cp1-Cl (Chlorine) Cp1-Me Cp1-OMe Cp13-H
1 0.93068 0.90866 0.92718 0.92397 0.92904 0.92997 0.92502
2 0.93076 0.90867 0.92741 0.92417 0.92918 0.93013 0.92532
3 0.93079 0.90874 0.92737 0.92420 0.92923 0.93016 0.92523
4 0.93083 0.90880 0.92760 0.92437 0.92937 0.93032 0.92542
5 0.93095 0.90887 0.92760 0.92444 0.92943 0.93031 0.92525
6 0.93094 0.90891 0.92787 0.92454 0.92961 0.93054 0.92538
7 0.93116 0.90896 0.92782 0.92472 0.92966 0.93046 0.92543
8 0.93096 0.90909 0.92808 0.92475 0.92981 0.93081 0.92565
9 0.93132 0.90917 0.92800 0.92497 0.92982 0.93067 0.92571
10 0.93109 0.90925 0.92834 0.92496 0.93007 0.93103 0.92578
…. …. …. …. …. …. ….
51 0.93778 0.91777 0.93608 0.93318 0.93722 0.93773 0.93289
52 0.93777 0.91779 0.93620 0.93358 0.93737 0.93785 0.93364
53 0.93782 0.91768 0.93616 0.93352 0.93724 0.93772 0.93338
54 0.93781 0.91762 0.93624 0.93376 0.93733 0.93772 0.93392
55 0.93780 0.91747 0.93614 0.93366 0.93714 0.93753 0.93379
56 0.93784 0.91736 0.93613 0.93386 0.93711 0.93746 0.93404
57 0.93786 0.91719 0.93598 0.93367 0.93692 0.93731 0.93390
58 0.93788 0.91704 0.93589 0.93376 0.93682 0.93717 0.93394
59 0.93792 0.91687 0.93571 0.93353 0.93661 0.93694 0.93369
60 0.93794 0.91667 0.93559 0.93355 0.93645 0.93679 0.93365
61 0.93800 0.91648 0.93538 0.93331 0.93622 0.93653 0.93335
…. ….. ….. ….. ….. ….. …. ……
91 0.94685 0.93269 0.94213 0.94845 0.94064 0.93982 0.94978
92 0.94909 0.93627 0.94664 0.95401 0.94466 0.94360 0.95556
93 0.95170 0.94047 0.95228 0.95991 0.94992 0.94842 0.96101
94 0.95486 0.94547 0.95871 0.96536 0.95622 0.95440 0.96615
95 0.95835 0.95150 0.96516 0.97056 0.96333 0.96125 0.97100
96 0.96215 0.95852 0.97181 0.97569 0.97037 0.96840 0.97608
97 0.96580 0.96658 0.97816 0.98066 0.97719 0.97546 0.98119
98 0.96967 0.97552 0.98461 0.98590 0.98357 0.98272 0.98677
99 0.97422 0.98685 0.99251 0.99242 0.99081 0.99050 0.99375
100 0.97734 0.99757 0.99833 0.99685 0.99565 0.99656 0.99692
Table 5. B. Sample SyD values, as defined in Table 6A.The notation 4TS refers to a reaction mechanism involving a four-membered ring transition state.
IRC PAIR Cl (Chlorine)-Cp13-Cl (Chlorine) Cp5-H (4TS) Cp6-Cl (Chlorine,4TS) Cp9-Cl (Chlorine,4TS) Cp8-OCH3 (4TS) Cp13-NO2(4TS)
1 0.92453 0.92534 0.9652 0.9203 0.9203 0.9658
2 0.92465 0.92755 0.9669 0.9226 0.9226 0.9654
3 0.92461 0.92975 0.9686 0.9249 0.9249 0.9649
4 0.92492 0.93188 0.9699 0.9272 0.9272 0.9645
5 0.92477 0.93395 0.9708 0.9294 0.9294 0.9640
6 0.92507 0.93598 0.9717 0.9316 0.9316 0.9636
7 0.92495 0.93800 0.9726 0.9338 0.9338 0.9632
8 0.92527 0.93993 0.9734 0.9358 0.9358 0.9628
9 0.92514 0.94187 0.9743 0.9379 0.9379 0.9624
10 0.92547 0.94378 0.9752 0.9399 0.9399 0.9620
…. …. …. …. …. …. …..
51 0.93236 0.97924 0.9578 0.9797 0.9797 0.9424
52 0.93214 0.97878 0.9567 0.9792 0.9792 0.9411
53 0.93279 0.97824 0.9558 0.9786 0.9786 0.9406
54 0.93263 0.97771 0.9548 0.9780 0.9780 0.9391
55 0.93303 0.97710 0.9538 0.9776 0.9776 0.9392
56 0.93292 0.97661 0.9527 0.9770 0.9770 0.9375
57 0.93312 0.97594 0.9518 0.9764 0.9764 0.9378
58 0.93295 0.97533 0.9508 0.9757 0.9757 0.9364
59 0.93300 0.97482 0.9499 0.9750 0.9750 0.9359
60 0.93266 0.97390 0.9490 0.9744 0.9744 0.9348
61 0.93273 0.97373 0.9480 0.9740 0.9740 0.9343
…. …. …. …. …. ….. …..
91 0.95447 0.96259 0.9575 0.9614 0.9614 0.9592
92 0.95942 0.96582 0.9622 0.9643 0.9643 0.9633
93 0.96383 0.96968 0.9659 0.9685 0.9685 0.9684
94 0.96836 0.97348 0.9706 0.9722 0.9722 0.9726
95 0.97261 0.97680 0.9745 0.9760 0.9760 0.9768
96 0.97738 0.98146 0.9788 0.9792 0.9792 0.9808
97 0.98235 0.98527 0.9831 0.9838 0.9838 0.9847
98 0.98774 0.99018 0.9865 0.9879 0.9879 0.9883
99 0.99370 0.99723 0.9895 0.9913 0.9913 0.9919
100 0.99691 0.99634 0.9892 0.9963 0.9963 0.9954

5. Conclusions

In this work, we carried out an exhaustive computational study of the gas-phase pyrolysis of N-aryl-3-oxobutanamides (β-ketoamides) and 2-arylhydrazone derivatives, employing density functional theory at the B97D-GD3BJ/Def2TZVP level, multivariant analysis PCA and HCA. Our results validate the concerted asynchronous mechanism through a six-member cyclic transition state. The intramolecular proton transfer from the amide N-H to the oxygen atom of the beta carbonyl group is determinant in the reaction rate. Analysis of global and local molecular descriptors, and the evolution of Wiberg bond indexes along the intrinsic reaction coordinate, IRC, allowed us to introduce the concept of Dynamic Synchronicity, SyD, as a new descriptor to differentiate substituent effects in concerted mechanisms. In the gas-phase pyrolysis of β-ketoamides and arylhydrazone derivatives, we demonstrated that electron-donor substituents (e.g., Me, OMe) facilitate more synchronic mechanisms, whereas electron-withdrawing substituents (e.g., Cl, NO2) favor more asynchronous processes and destabilize the transition state, in accord with the observed differences in reactivity. Principal component analysis (PCA) revealed that PC1, which groups variables such as HOMO, LUMO energies, hardness, chemical potential and bond indexes, is the determinant for reactivity. PCA can be used to identify patterns for reactivity-stability using a training set of molecules with available experimental data. This information can then be used to evaluate the reactivity in other molecules outside the training set. The strategy presented in this work can be used to predict reactivity/stability of a variety of systems. Hierarchical cluster analysis (HCA) allowed visualizing how the organization of the IRC points is modified by the substituents. Subtle effects in the reaction’s dynamics can be analyzed. This work provides a solid theoretical validation of the reaction mechanism and proposes an integrated methodology combining computational tools with chemometric techniques, offering a more complete approach to study chemical reactivity. The selection criteria of the variables derived from PAC and HCA can be useful in the rational design of compounds with the highest thermal stability. The proposed descriptor, Dynamic Synchronicity, SyD, provides a novel global-evolutive parameter to study the reaction mechanism.

Supplementary Materials

The following supporting information can be downloaded at the website of this paper posted on Preprints.org.

Author Contributions

Conceptualization, R. I. C. and M. L.; formal analysis, R. I. C., M. L., and T. C. S.; investigation, R. I. C. and M. L.; methodology, R. I. C., and M. L.; supervision, J. L. P.; validation, T. C. S.; visualization, R. I. C. and M. L.; writing–original draft, R. I. C. and M. L.; writing–review & editing, T. C. S., J. L. P. and C.J.A.G.S.:

Data availability

All computational details and data are available in a supplementary file.

Acknowledgments

The authors thank the Facultad de Química e Ingeniería Química de la Universidad Nacional Mayor de San Marcos, particularly the DEINPRO research group, for the use of the high-performance computing system utilized for most of the theoretical calculations presented in this work. Rosalinda Ipanaque-Chávez extends his sincere gratitude to the Postgraduate Program of the Faculty of Chemical and Chemical Engineering. This research was funded by the Universidad Nacional Mayor de San Marcos under Rectoral Resolution N. º 007064-2026-R (28.05.2026)-UNMSM, Directoral Resolution N. º 00686-DGA-2026 (02.06.2026), SIAF N. º 28876 and with project code C26070151.

Conflicts of interest

There are no conflicts to declare.

References

  1. Guo, Y.; Cristadoro, A. M.; Kleemann, J.; Bokern, S.; Sijbesma, R. P.; Tomović, Ž. Solvent-Free Preparation of Thermally Stable Poly(urethane-imide) Elastomers. ACS Appl. Polym. Mater. 2023, 5 (6), 4517–4524. [CrossRef]
  2. Van Belleghem, L.; Dirix, R.; de Oliveira Silva, R.; Wery, J.; Sakellariou, D.; Van Velthoven, N.; De Vos, D. Recovery of Polyol and Aromatic Amines from Rigid Polyurethane Foams via Ammonolysis. JACS Au 2025, 5 (8), 3444–3452. [CrossRef]
  3. Mudri, N. H.; Abdullah, L.; Aung, M. M.; Salleh, M. Z.; Awang Biak, D. A.; Rayung, M. Comparative Study of Aromatic and Cycloaliphatic Isocyanate Effects on Physico-Chemical Properties of Bio-Based Polyurethane Acrylate Coatings. Polymers 2020, 12 (7), 1494. [CrossRef]
  4. Choe, H.; Kim, J. H. Reactivity of Isophorone Diisocyanate in Fabrications of Polyurethane Foams for Improved Acoustic and Mechanical Properties. J. Ind. Eng. Chem. 2018, 68, 341–347. [CrossRef]
  5. Zhumanazarova, G. M.; Sarsenbekova, A. Z.; Abulyaissova, L. K.; Figurinene, I. V.; Zhaslan, R. K.; Makhmutova, A. S.; Sotchenko, R. K.; Aikynbayeva, G. M.; Hranicek, J. Study of Mathematical Models Describing the Thermal Decomposition of Polymers Using Numerical Methods. Polymers 2025, 17, 1197. [CrossRef]
  6. Lizarraga, E.; Zabaleta, C.; Palop, J. A. Thermal Stability and Decomposition of Pharmaceutical Compounds. Journal of Thermal Analysis and Calorimetry 2007, 89, 783–792. [CrossRef]
  7. Scattolin, T.; Bouayad-Gervais, S.; Schoenebeck, F. Straightforward Access to N-Trifluoromethyl Amides, Carbamates, Thiocarbamates and Ureas. Nature 2019, 573. 102–106. [CrossRef]
  8. Yu, Y.; Zhang, H.; Xu, P.; Zhang, X.; Wang, H.; Hu, M.; Guo, J. Effect of Ultra-High Temperature Degradation on the Physical Properties and Chemical Structure of an AMPS-Based Copolymer Oil-Well Cement Additive PADIM in Aqueous Solution. Polymers 2025, 16, 1486. [CrossRef]
  9. Pliquet, M.; Rapeaux, M.; Delange, F.; Bussiere, P. O.; Therias, S.; Gardette, J. L. Multiscale Analysis of the Thermal Degradation of Polyamide 6,6: Correlating Chemical Structure to Mechanical Properties. Polym. Degrad. Stab. 2021, 183, 109496. [CrossRef]
  10. Kurima, A.; Kinashi, K.; Sakai, W.; Tsutsumi, N. Spin-Trapping Analysis of the Thermal Degradation Reaction of Polyamide 66. Polymers 2022, 14, 4748. [CrossRef]
  11. Ji, C.-L.; Hong, X. Factors Controlling the Reactivity and Chemoselectivity of Resonance Destabilized Amides in Ni-Catalyzed Decarbonylative and Non-Decarbonylative Suzuki–Miyaura Coupling. J. Am. Chem. Soc. 2017, 139 (42), 15522–15529. [CrossRef]
  12. Leonardo, M. C.; Albino, S. L.; de Araújo, W. J. S.; Nascimento, M. V. B.; Rodríguez-Macías, J. D.; Brazon, E. A. M.; de Moura, R. O.; Nogueira, F.; dos Santos Nascimento, I. J. Exploring Subtilisin Inhibition to Discover Antimalarial Drugs: Insights into Medicinal Chemistry and Drug Discovery. Pharmaceuticals 2025, 18 (9), 1318. [CrossRef]
  13. Ibraheem, H. H.; Queen, B. K.; Al-Sabti, M. D.; Issa, A. A.; Al-Majedy, Y. K.; Jabir, M. S.; Sulaiman, G. M.; Hasoon, B. A.; Eshaq, M. M.; Jawad, K. H.; et al. Insights into the Pharmaceutical Properties and In Silico Study of Novel Hydrazone Derivatives. Sci. Rep. 2024, 14, 21563. [CrossRef]
  14. Jabeen, M. A Comprehensive Review on Analytical Applications of Hydrazone Derivatives. JOTCSA 2022, 9 (3), 663–698. [CrossRef]
  15. Pereira, T. M.; Kümmerle, A. Hydrazone-Based Small-Molecule Chemosensors. In Hydrazone-Based Small-Molecule Chemosensors; IntechOpen, 2020. [CrossRef]
  16. Su, X.; Aprahamian, I. Hydrazone-Based Switches, Metallo-Assemblies and Sensors. Chem. Soc. Rev. 2014, 43 (6), 1963–1981. [CrossRef]
  17. Subhasri, A.; Balachandran, S.; Mohanraj, K.; Senthil Kumar, P.; Jeeva Jothi, K.; Anbuselvan, C. Synthesis, Computational and cytotoxicity studies of aryl hydrazones of β-diketones: Selective Ni2+ metal Responsive fluorescent chemosensors. J. Mol. Struct. 2023, 1285, 135418. [CrossRef]
  18. Tatum, L. A.; Su, X.; Aprahamian, I. Simple Hydrazone Building Blocks for Complicated Functional Materials. Acc. Chem. Res. 2014, 47, 2141–2149. [CrossRef]
  19. Shao, B.; Aprahamian, I. Perspective Hydrazones as New Molecular Tools. Chem 2020, 6, 1–12. [CrossRef]
  20. Mong, G. R.; Chong, C. T.; Chong, W. W. F.; Ng, J.-H.; Ong, H. C.; Ashokkumar, V.; Tran, M.-V.; Karmakar, S.; Goh, B. H. H.; Yasin, M. F. M. Progress and Challenges in Sustainable Pyrolysis Technology: Reactors, Feedstocks and Products. Fuel 2022, 323, 124380. [CrossRef]
  21. Li, S. Reviewing Air Pollutants Generated during the Pyrolysis of Solid Waste for Biofuel and Biochar Production: Toward Cleaner Production Practices. Sustainability 2024, 16 (3), 1169. [CrossRef]
  22. Yang, Y.; Zhou, T.; Cheng, M.; Xie, M.; Shi, N.; Liu, T.; Huang, Z.; Zhao, Y.; Huang, Q.; Liu, Z.; Li, B. Recent Advances in Organic Waste Pyrolysis and Gasification in a CO₂ Environment to Value-Added Products. J. Environ. Chem. Eng. 2023, 11 (5), 110950. [CrossRef]
  23. Malhas, R. N.; Al-Awadi, N. A.; El-Dusouqui, O. M. E. Kinetic and Mechanism of Gas-Phase Pyrolysis of N-Aryl-3-oxobutanamide Ketoanilides, Their 2-Arylhydrazono Derivatives, and Related Compounds. Int. J. Chem. Kinet. 2007, 39, 82–91. [CrossRef]
  24. Esan, T. O.; Ogunyemi, B. T.; Oyeneyin, O. E.; Adebayo, O. L.; Adejoro, I. A. Computational Investigation into the Kinetics, Mechanism and Thermodynamics Properties of the Gas-Phase Thermal Decomposition of 1-Phenyl Ethyl Acetate. FUDMA J. Sci. 2022, 6 (6), 61–69. [CrossRef]
  25. Shojaei, S. H. R.; Shiroudi, A.; Abdel-Rahman, M. A. Computational Studies on Thermo-Kinetics Aspects of Pyrolysis of Isopropyl Acetate and Its Methyl, Bromide and Hydroxyl Derivatives. Heliyon 2022. [CrossRef]
  26. Abdel-Rahman, M. A.; Shibl, M. F.; Mahmoud, M. A. M. Pyrolytic Elimination of Ethylene from Ethoxyquinolines and Ethoxyisoquinolines: A Computational Study. Sci. Rep. 2023, 13, 6248. [CrossRef]
  27. Henao, D.; Murillo, J.; Ruiz, P.; Quijano, J.; Mejía, B.; Castañeda, L.; Notario, R. A Computational Study of the Thermolysis of β-Hydroxy Ketones in Gas Phase and in m-Xylene Solution. J. Phys. Org. Chem. 2012. [CrossRef]
  28. Butera, V. Density Functional Theory Methods Applied to Homogeneous and Heterogeneous Catalysis: A Short Review and a Practical User Guide. Phys. Chem. Chem. Phys. 2024, 26, 7950–7970. [CrossRef]
  29. Xiao, J.; Zhang, Y.; Li, B.; Zhang, S.; Gao, Y.; Chen, W.; Wang, H.; Zhang, J. Z. H.; Zhu, T. A Deep Learning-Augmented Density Functional Framework for Reaction Modeling with Chemical Accuracy. JACS Au 2025, 5, 3892–3903. [CrossRef]
  30. Alvarez-Aular, A.; Cartaya, L.; Maldonado, A.; Monascal, Y.; Coll, D. S.; Chuchani, G. Experimental and DFT Studies for the Kinetics and Mechanism of the Pyrolysis of 2-(4-Substituted-phenoxy)tetrahydro-2H-pyranes in the Gas Phase. J. Anal. Appl. Pyrolysis 2018, 132, 1–10. [CrossRef]
  31. Mai, T. V. T.; Chuang, Y.-Y.; Giri, B. R.; Huynh, L. K. Ab-initio Studies of Thermal Unimolecular Decomposition of Furan: A Complementary Deterministic and Stochastic Master Equation Model. Fuel 2020, 264, 116492. [CrossRef]
  32. Akbar Ali, M.; Thripati, S. Computational Prediction for the Formation of Amides and Thiomides in the Gas Phase Interstellar Medium. Front. Chem. 2025, 13, 1615586. [CrossRef]
  33. Maciejewska, M.; Lastawiecka, E.; Grochowicz, M. Thermal Characterization of Crosslinked Polymeric Microspheres Bearing Thiol Groups Studied by TG/FTIR/DSC under Non-Oxidative Conditions. Materials 2024, 17, 1372. [CrossRef]
  34. Phiri, Z.; Everson, R.; Neomagus, H.; Wood, B. Transformation of Nitrogen Functional Forms and the Accompanying Chemical-Structural Properties Emanating from Pyrolysis of Bituminous Coals. Appl. Energy 2018, 219, 218–231. [CrossRef]
  35. Ali, M. I.; Hussain, J.; Anwar, M. U.; Al-Harrasi, A.; Naseer, M. M. Intramolecular Noncovalent C-Bonding Driven Conformational Preference in Spiroisatin-Based N-Acyl Hydrazones. RSC Adv. 2025. [CrossRef]
  36. Jiao, Y.; Weinhold, F. NBO/NRT Two-State Theory of Bond-Shift Spectral Excitation. Molecules 2020, 25 (18),4052. [CrossRef]
  37. Zaklika, J.; Komorowski, L.; Ordon, P. Evolution of the Atomic Valence Observed by the Reaction Fragility Spectra on the Reaction Path. J. Mol. Model. 2019, 25, 134. [CrossRef]
  38. Lefebvre, C., Khartabil, H., Boisson, J.-C., Contreras-García, J., Piquemal, J.-P., & Hénon, E. (2018). The Independent Gradient Model: A New Approach for Probing Strong and Weak Interactions in Molecules from Wave Function Calculations. ChemPhysChem, 19(6), 724-735. [CrossRef]
  39. Ipanaque-Chávez, R.; Loroño, M.; Cordova-Sintjago, T.; Paz, J. L. Substituent Effects in the Thermal Decomposition of 1,2,4-Triazol-3(2H)-Ones and Their Thione Analogues: A DFT Study with Functional Performance. Molecules 2026, 31 (1), 109. [CrossRef]
  40. Boese, A. D., Chandra, A., Martin, J. M. L., & Marx, D. (2003). The ammonia dimer (NH3)2: The quest for a quantitative description of a prototype system for hydrogen bonding. The Journal of Chemical Physics, 119(12), 5965–5980.
  41. Hamprecht, F. A., Cohen, A. J., Tozer, D. J., & Handy, N. C., Development and assessment of new exchange-correlation functionals. The Journal of Chemical Physics, 1998, 109(15), 6264–6271. [CrossRef]
  42. Goerigk, L., & Grimme, S., A thorough benchmark of density functional methods for general main group thermochemistry, kinetics, and noncovalent interactions. Physical Chemistry Chemical Physics, 2011,13(14), 6670-6688. [CrossRef]
  43. Grimme, S., Semiempirical GGA-type density functional constructed with a long-range dispersion correction. Journal of Computational Chemistry, 2006, 27(15), 1787-1799. [CrossRef]
  44. Xu, X., & Goddard III, W. A., The X3LYP extended density functional for accurate descriptions of nonbond interactions, spin states, and thermochemical properties. Proceedings of the National Academy of Sciences, 101, 2004, 2673-2677. [CrossRef]
  45. Stephens, P. J., Devlin, F. J., Chabalowski, C. F., & Frisch, M. J., Ab Initio Calculation of Vibrational Absorption and Circular Dichroism Spectra Using Density Functional Force Fields. The Journal of Physical Chemistry, 1994, 98, 11623-11627. [CrossRef]
  46. Yanai, T., Tew, D. P., & Handy, N. C., A new hybrid exchange–correlation functional using the Coulomb-attenuating method (CAM-B3LYP). Chemical Physics Letters, 2004, 393, 51-57. [CrossRef]
  47. Weigend, F., & Ahlrichs, R., Balanced basis sets of split valence, triple zeta valence and quadruple zeta valence quality for H to Rn: Design and assessment of accuracy. Physical Chemistry Chemical Physics, 2025, 7, 3297-3305. [CrossRef]
  48. Spartan’26 v.1.0, 2026, Wavefunction, Inc., Irvine, CA; https://www.wavefun.com/spartan.
  49. Gaussian 16, Revision B.01, M. J. Frisch, G. W. Trucks, H. B. Schlegel, G. E. Scuseria, M. A. Robb, J. R. Cheeseman, G. Scalmani, V. Barone, G. A. Petersson, H. Nakatsuji, X. Li, M. Caricato, A. V. Marenich, J. Bloino, B. G. Janesko, R. Gomperts, B. Mennucci, H. P. Hratchian, J. V. Ortiz, A. F. Izmaylov, J. L. Sonnenberg, D. Williams-Young, F. Ding, F. Lipparini, F. Egidi, J. Goings, B. Peng, A. Petrone, T. Henderson, D. Ranasinghe, V. G. Zakrzewski, J. Gao, N. Rega, G. Zheng, W. Liang, M. Hada, M. Ehara, K. Toyota, R. Fukuda, J. Hasegawa, M. Ishida, T. Nakajima, Y. Honda, O. Kitao, H. Nakai, T. Vreven, K. Throssell, J. A. Montgomery, Jr., J. E. Peralta, F. Ogliaro, M. J. Bearpark, J. J. Heyd, E. N. Brothers, K. N. Kudin, V. N. Staroverov, T. A. Keith, R. Kobayashi, J. Normand, K. Raghavachari, A. P. Rendell, J. C. Burant, S. S. Iyengar, J. Tomasi, M. Cossi, J. M. Millam, M. Klene, C. Adamo, R. Cammi, J. W. Ochterski, R. L. Martin, K. Morokuma, O. Farkas, J. B. Foresman, and D. J. Fox, Gaussian, Inc., Wallingford CT, 2016.
  50. Barone, V.; Crisci, L.; Di Grande, S. Accurate Thermochemical and Kinetic Parameters at Affordable Cost by Means of the Pisa Composite Scheme (PCS). J. Chem. Theory Comput. 2023, 19, 7273–7286. [CrossRef]
  51. Becke, A. D. 1993; J. Chem. Phys., 98: 5648.
  52. Koopmans, T. 1993; Physica., 1: 104.
  53. Weinhold, F.; Landis, C. R.; Glendening, E. D. What is NBO Analysis and How is It Useful? Int. Rev. Phys. Chem. 2016, 35 (3), 399–440. [CrossRef]
  54. Moyano, A., Pericas M. A, Valenti E., J. Org. Chem. 54 (1989) 573.
  55. J. Klein, H. Khartabil, Jean-Charles Boisson, J. Contreras-Garcia, Jean-Philip Piquemal, et al.. A New Way for Probing Bond Strength. Journal of Physical Chemistry A, 2020, 124 (9), pp.1850-1860. [CrossRef]
  56. Lesar, A. and Milosev, I. 2009; Chem. Phys. Lett., 483 (4-6): 198.
  57. Lee, C., Yang, W. and Paar, R. G. 1988; Phys. Rev., B37: 785.
  58. Ayers, P. W., Anderson, J. S. M. and Bartolotti, L. J. 2005; Int. J. Quantum Chem, 101: 520.
  59. Roos, G., Loverix, S., Brosens, E. Belle, K., Wyns, Van L., Geerlings, P. and Messens, J.; 2006; Chem BioChem., 7: 981.
  60. Numiqo Team. numiqo: Online Statistics Calculator, version 2026; numiqo e.U.: Graz, Austria, 2026. https://numiqo.com.
  61. Esbensen, K. Principal Component Analysis (PCA). In Chemometrics in Excel; John Wiley & Sons, Inc.: Hoboken, NJ, 2002; pp 133–154.
  62. Ferreira, G. R.; Arruda, H. F.; Silva, F. N.; Comin, C. H.; Amancio, D. R.; Costa, L. da F. Principal Component Analysis: A Natural Approach to Data Exploration. São Paulo Research Foundation (FAPESP), 2018.
  63. Salem, N.; Hussein, S. Data Dimensional Reduction and Principal Components Analysis. Procedia Comput. Sci. 2019, 163, 292–299. [CrossRef]
  64. Dib, H. H.; Al-Awadi, N. A.; Ibrahim, Y. A.; El-Dusouqui, O. M. E. J Phys Org Chem 2004, 17, 267–272; (b) Dib, H. H.; Al-Awadi, N. A.; Ibrahim, Y. A.;El-Dusouqui, O. M. E. Tetrahedron 2003, 59, 9455–9464; (c) Al-Awadi, N. A.; George, B. J.; Dib, H. H.;Ibrahim, M. R.; Ibrahim, Y. A.; El-Dusouqui, O. M. E.Tetrahedron 2005, 61, 8257–8263.
  65. Al-Awadi, N. A.; Kaul, K.; El-Dusouqui, O. M. E. Can. J. Chem. 1998, 76, 1922–1925.
  66. Al-Juwaiser, I. A.; Al-Awadi, N. A.; El-Dusouqui,O. M. E. Can J Chem 2002, 80, 499–503, and references therein.
  67. Al-Awadi, S. A.; Abdellah, M. R.; Dib, H. H.; Ibrahim,M. R.; Al-Awadi, N. A.; El-Dusouqui, O. M. E. Tetrahedron 2005, 61, 5769–5777.
  68. Al-Awadi, N. A.; Al-Bashir, R. F.; El-Dusouqui, O.M. E. J. Chem. Soc., Perkin Trans 2 1989, 579–581.
  69. Al-Awadi, N. A.; El-Dusouqui, O.M. E.; Mathew, T. Int J Chem Kinet 1997, 29, 289–293; (b) Al-Awadi, N.A.; El-Dusouqui, O. M. E. Int J Chem Kinet 1997, 29,295–298.
  70. Al-Awadi, N. A.; Elnagdi, M. H.; Kaul, K.; Illingovan, S.; El-Dusouqui, O. M. E. Tetrahedron 1998, 54, 4633–4640; (b) Al-Awadi, N. A.; Elnagdi, M. H.; Kaul, K.; Illingovan, S.; El-Dusouqui, O. M. E. J Phys Org Chem 1999, 12, 654–658; (c) Al-Awadi, N. A.; Al- Bashir, R. F.; El-Dusouqui, O. M. E. Tetrahedron Lett. 1989, 30, 1699–1702; (d) Shorter, J. Pure Appl. Chem. 1994, 66, 2451–2468.
  71. Al-Awadi, N. A.; Elnagdi, M. H.; Al-Awadhi, H. A.; El-Dusouqui, O. M. E. Int J Chem Kinet 1998, 30, 457-462.
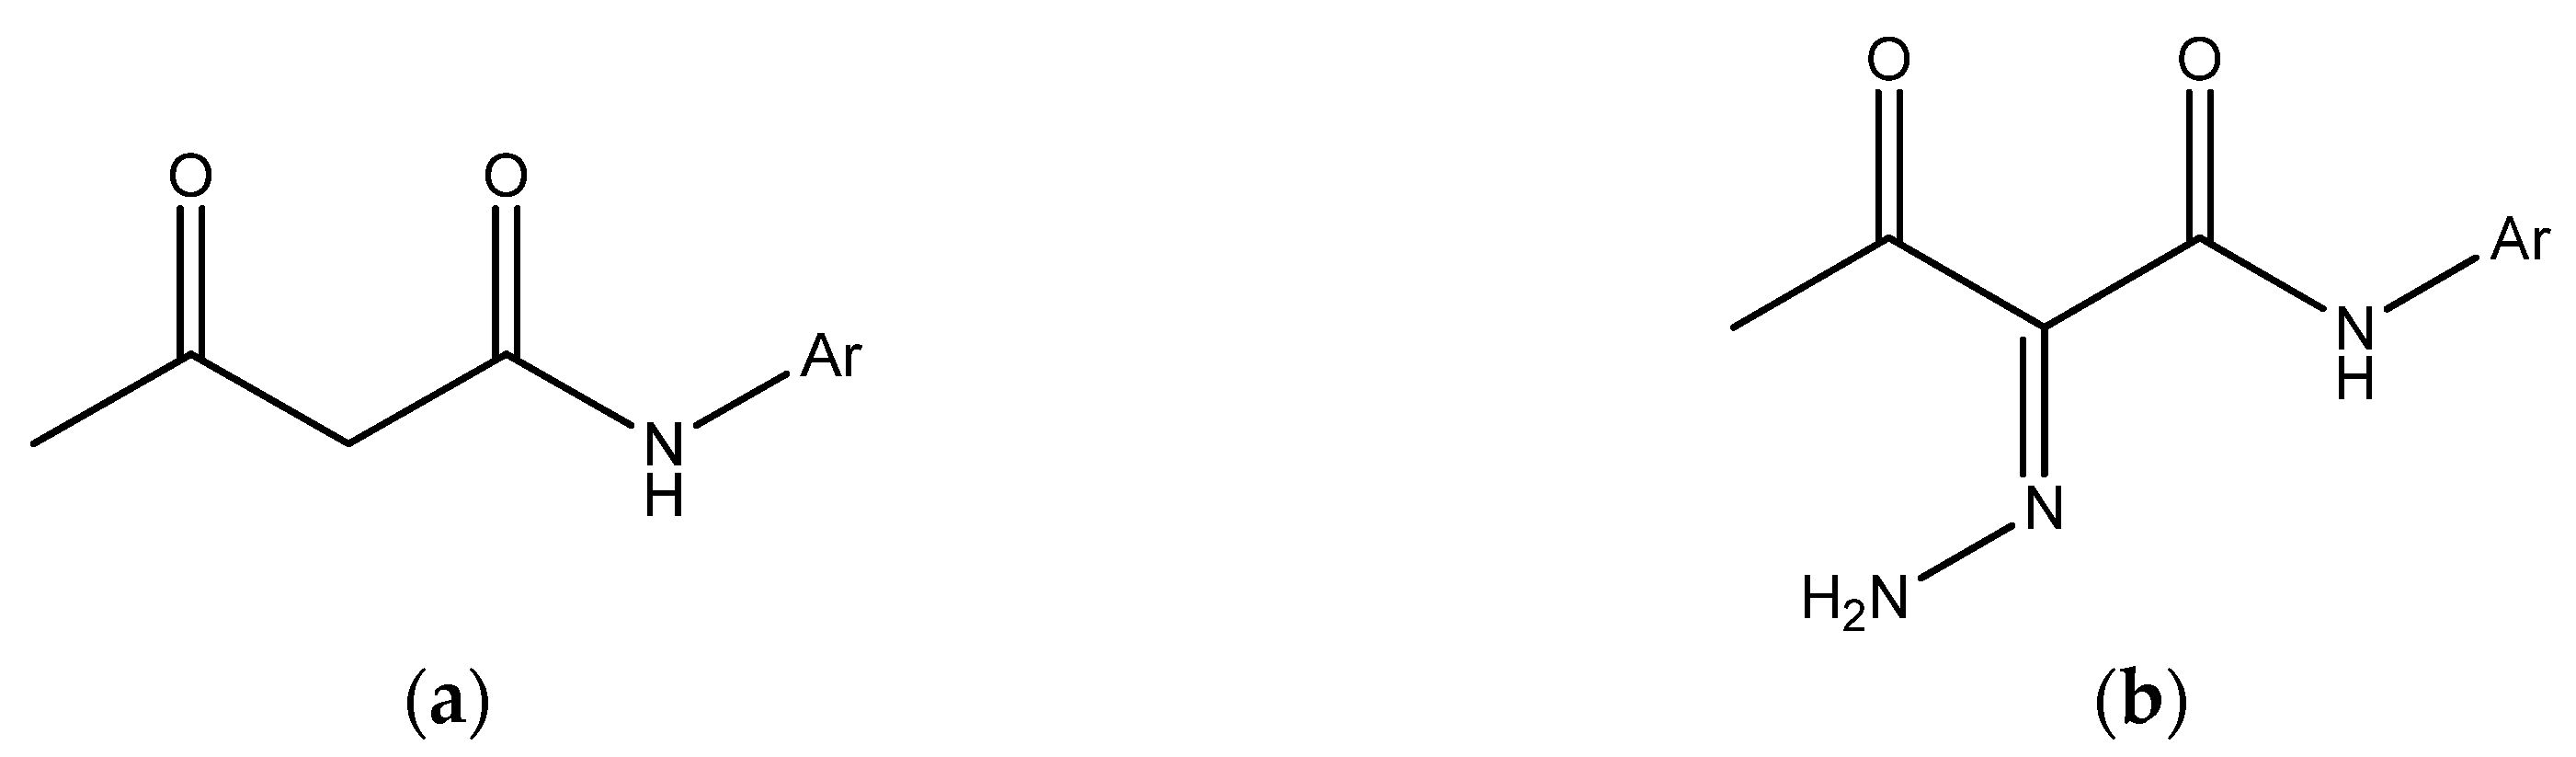
Scheme 1. Structure of (a) N-aryl-3-oxobutanamide and (b) N-aryl-2-arylhydrazone-3-oxobutanamide.
Preprints 228582 sch001
Scheme 2. Alternative reaction pathways proposed for arylhydrazone derivatives: through a cyclic six-member transition state (a), and competing reaction pathway through a cyclic four-member transition state. (b) [23].
Preprints 228582 sch002
Scheme 3. Compounds included in the experimental study by Malhas et al, [23].
Preprints 228582 sch003
Figure 1. Computational models of the transition state for acetoacetamide (a) and N-phenylacetoacetamide (N-Phenyl-3-oxobutanamide) (b), at B97D-GD3BJ/Def2TZVP, 450 K.
Preprints 228582 g001
Scheme 4. Assistance of the phenylhydrazone group in the elimination reaction. The effect increases the positive charge of the alpha hydrogen next to the carbonyl (b), facilitating the proton transfer, which is transferred to the oxygen in the carbonyl group (a).
Preprints 228582 sch004
Figure 2. Conformers of compound 5. Conformer (a) illustrates a possible pathway, where the hydrogen of the hydrazo group is transferred to the carbonyl oxygen of the acetanilide. This pathway, however, does not give the observed fragmentation products. Structure (b) is the reactive conformation leading to the observed products.
Preprints 228582 g002
Figure 3. Four-member cyclic transition state for compounds 5–11, optimized at the B97D-GD3BJ/Def2TZVP level of theory at 450 K. To enable the migration of the amide N–H hydrogen toward the α-carbon, the fragment highlighted in the blue circle undergoes a ~90° rotation around the C–C bond. The C–C bond that breaks during the reaction is oriented perpendicularly to the plane of the migrating hydrogen, facilitating the fragmentation process.
Preprints 228582 g003
Figure 4. Top depicts another view of the conformer in Figure 2b, showing an almost planar structure except for the methyl group, clearly off plane. Bottom depicts the six-member TS structure found for compounds 5-11, from GD3BJ/Def2TZVPcalculations at 450 K.
Preprints 228582 g004
Figure 5. Plot of principal component PC1 vs PC2 values of 201 points of the intrinsic reaction coordinate IRC, for the pyrolysis of acetoacetamide (compound 12), calculated at B97D-GD3BJ/Def2TZVP level of theory, at 450 K. Structure with higher reactivity are characterized by PC1 > 0; less reactive structures have PC1 < 0.
Preprints 228582 g005
Figure 6. 3D plot of principal components PC1, PC2, and PC3 for 201 points in the IRC of compound 12, calculated B97D-GD3BJ/Def2TZVPlevel of theory at 450 K. The separation between reactive and non-reactive structures is observed along the PC1 axis, while PC2 and PC3 give complementary information.
Preprints 228582 g006
Figure 7. 3D graphical representation of principal components PC1, PC2, and PC3 od IRC poins for compounds studied. Compounds included possess substituents EDG (-Me, -OMe) and EWG(-Cl).
Preprints 228582 g007
Figure 8. HCA Dendrogram (HCA: Complete-linkage, Euclidean: 4 Clusters) for 61 points of the IRC of Compound 12, from M85 to M127 (30 points before and after the TS, M101), using 30 DFT variables (global descriptors, IBSI, electron densities and NPA charges) calculated at B97D-GD3BJ/Def2TZVP level of theory at 450 K. HCA dendrogram groupings shows three blocks: reactants (M85 – M100), TS (M101) and products (M102- M127).
Preprints 228582 g008
Figure 9. HCA Dendrogram (HCA: Complete-linkage, Euclidean: 4 Clusters) for 61 IRC points for compound 12, from (M85–M127), using only 13 variables with positive coefficients in PC1: (HOMO, LUMO, ΔEg Gap, η, μ, IBSI_O2–H5, IBSI_N4–C3, IBSI_C7–C1, ρ_O2–H5, ρ_N4–C3, ρ_C7–C1, NPA charges qC7, qC3, qH5), calculated at B97D-GD3BJ/Def2TZVPlevel of theory at 450 K.
Preprints 228582 g009
Figure 10. Evolution of the dynamic synchronicity (SyD) parameter, along the intrinsic reaction coordinate, IRC for compounds in this work including reference compound 15, derivatives containing EDG (-Me, -OMe, derivatives with EWG (-Cl, -NO2), variants 13a and 13b, and the four-member TS mechanism (4TS), calculated at B97D-GD3BJ/Def2TZVP level of theory at 450 K.
Preprints 228582 g010
Figure 11. Structures of additional compounds: (a) Cp13-NO2-4TS, (b) Cp13-Cl (chlorine), and (c) the unsubstituted pentane-2,4-dione (cp15) incorporated in the SyD analysis in Figure 15.
Preprints 228582 g011
Table 1. Experimental Arrhenius parameters and energies of activation at 450 K [23].
Compound log A (s⁻¹) Ea (kJ mol⁻¹) k (10³ s⁻¹)
KETOANILIDES
1 N-phenyl 11.7 ± 0.4 116.1 ± 4.4 1.80
2 p-Cl-phenyl 11.8 ± 0.3 117.8 ± 3.8 1.41
3 p-Me-phenyl 11.5 ± 0.3 114.2 ± 3.4 2.29
4 p-OMe-phenyl 11.2 ± 0.3 110.7 ± 3.2 3.35
12 Acetoacetamide 11.9 ± 0.4 118.9 ± 4.5 1.30
13 N-phenyl-3-oxo-3-phenylpropanamide 12.5 ± 0.4 124.8 ± 4.7 0.87
14 N,N'-diphenylpropanediamide 12.8 ± 0.5 127.6 ± 5.2 0.32
ARYLHYDRAZONE DERIVATIVES
5 N-phenyl-2-phenylhydrazone 13.2 ± 0.3 158.8 ± 3.2 0.0010
6 p-Cl-phenyl/2-phenylhydrazone 13.0 ± 0.3 156.3 ± 3.1 0.0012
7 p-Me-phenyl/2-phenylhydrazone 13.3 ± 0.3 159.5 ± 3.3 0.0010
8 p-OMe-phenyl/2-phenylhydrazone 13.1 ± 0.3 157.6 ± 3.2 0.0011
9 N-phenyl-2-p-Cl-phenylhydrazone 13.4 ± 0.3 160.8 ± 3.4 0.0007
10 N-phenyl-2-p-Me-phenylhydrazone 13.1 ± 0.3 157.3 ± 3.2 0.0012
11 N-phenyl-2-p-OMe-phenylhydrazone 13.0 ± 0.3 155.9 ± 3.1 0.0014
Table 2. Calculated thermodynamic parameters using B97D-GD3BJ/Def2TZVP level of theory, at 450 K. Substituent G information for each compound is available in Scheme 3; for example, for compound 1, G = H.
Structure Compound ΔH (kJ/mol) ΔG (kJ/mol) ΔS (J/Kmol) Ea (kJ/mol)
Preprints 228582 i001 1 Six-member TS 122.93 126.14 -7.15 126.67
2 123.86 126.87 -6.69 127.60
3 122.76 126.90 -9.20 126.50
4 122.72 126.60 -8.63 126.46
Preprints 228582 i002 5 Six-member TS 174.54 161.90 28.11 178.28
6 176.79 163.40 29.77 180.53
7 174.15 161.53 28.06 177.89
8 173.68 162.06 25.84 177.42
5 Four-member TS 185.58 185.02 1.24 189.32
6 184.28 183.23 2.33 188.02
7 186.11 185.40 1.58 189.85
8 185.44 183.43 4.47 189.18
Table 3. Thermodynamic parameters at B97D-GD3BJ/Def2TZVP level of theory, and 450 K.
Structure Compound ΔH (kJ/mol) ΔG (kJ/mol) ΔS (J/Kmol) Ea (kJ/mol)
Preprints 228582 i003 9 Six-member TS 175.55 150.15 56.49 179.29
10 178.10 150.71 60.91 181.84
11 177.68 163.46 31.60 181.42
9 Four-member TS 187.89 174.66 29.43 191.64
10 185.49 173.82 26.59 189.23
11 179.17 179.28 -0.26 182.91
Preprints 228582 i004 12 Six-member TS 126.13 126.72 -1.31 129.87
Preprints 228582 i005 13 Six-member TS 120.98 112.40 19.08 124.72
Preprints 228582 i006 14 Six-member TS 148.98 214.69 -4.62 152.72
146.52 203.40 15.04 150.27
Table 4. Principal component PC1 contributions for 201 IRC points of compounds Cp12, Cp13, Cp1-H, Cp1-Cl, Cp1-Me, Cp13-Cl (chlorine). For simplicity, the abbreviation Cp is used hereafter to denote each compound, thereby avoiding any ambiguity with atomic indices or labels.
Variable Compounds
Cp12 Cp13 Cp1-H Cp1-Cl Cp1-Me Cp13-Cl
HOMO (eV) 0.92 0.37 -0.07 -0.47 -0.67 0.29
LUMO (eV) 0.94 0.95 0.94 0.93 0.95 0.95
Gap ΔEg (eV) 0.89 0.97 0.94 0.93 0.96 0.97
I -0.92 -0.37 0.07 0.47 0.67 -0.29
A -0.94 -0.95 -0.94 -0.93 -0.95 -0.95
X -0.93 -0.91 -0.86 -0.85 -0.86 -0.90
η 0.89 0.97 0.94 0.93 0.96 0.97
μ 0.93 0.91 0.86 0.85 0.86 0.90
S -0.88 -0.96 -0.94 -0.92 -0.96 -0.97
ω -0.94 -0.96 -0.95 -0.93 -0.95 -0.97
ΔN -0.94 -0.97 -0.95 -0.93 -0.96 -0.97
ΔEn -0.95 -0.96 -0.94 -0.92 -0.95 -0.96
ΔEe -0.94 -0.95 -0.93 -0.91 -0.93 0.98
IBSI_O2-H5 0.97 0.98 0.98 0.97 0.98 -0.97
IBSI_H5-N4 -0.95 -0.96 -0.96 -0.95 -0.96 0.99
IBSI_N4-C3 0.99 0.99 0.99 0.98 0.99 -0.97
IBSI_C3-C7 -0.95 -0.96 -0.96 -0.95 -0.96 0.99
IBSI_C7-C1 0.98 0.98 0.98 0.98 0.98 -0.98
IBSI_C1-O2 -0.98 -0.98 -0.98 -0.97 -0.98 0.98
ρ_O2-H5 0.97 0.98 0.98 0.97 0.98 -0.97
ρ_H5-N4 -0.95 -0.96 -0.96 -0.95 -0.96 0.99
ρ_N4-C3 0.98 0.98 0.98 0.98 0.98 -0.96
ρ_C3-C7 -0.94 -0.95 -0.95 -0.95 -0.95 0.98
ρ_C7-C1 0.96 0.97 0.97 0.96 0.97 -0.99
ρ_C1-O2 -0.98 -0.98 -0.99 -0.98 -0.98 -1.00
qC1 -1.00 -1.00 -1.00 -0.99 -1.00 0.99
qC7 0.97 1.00 0.99 0.98 0.98 0.98
qC3 0.97 0.98 0.98 0.98 0.99 -0.23
qN4 -0.32 -0.17 -0.28 -0.23 -0.32 0.97
qH5 0.94 0.96 0.96 0.96 0.97 -0.98
qO2 -0.98 -0.98 -0.99 -0.98 -0.99 0.29
Disclaimer/Publisher’s Note: The statements, opinions and data contained in all publications are solely those of the individual author(s) and contributor(s) and not of MDPI and/or the editor(s). MDPI and/or the editor(s) disclaim responsibility for any injury to people or property resulting from any ideas, methods, instructions or products referred to in the content.
Copyright: This open access article is published under a Creative Commons CC BY 4.0 license, which permit the free download, distribution, and reuse, provided that the author and preprint are cited in any reuse.