
Submitted:
17 August 2026
Posted:
17 August 2026
You are already at the latest version
Abstract
Historical underground workings in the Maleia–Livezeni sector of the Petroșani Coal Basin were reconstructed from four archival mining plans and a coordinate-referenced Drawing Exchange Format (DXF) dataset. Twelve extraction-sector polygons, principal galleries, exploitation limits, dated mining stages, and 567 validated mining-elevation annotations associated with Coal Seam No. 3 were integrated in a geographic information system (GIS) using the Romanian Stereo 70 coordinate reference system (EPSG:3844). Net elevation differences between 2007 and 2026 at seventeen surface benchmarks were used as response variables. Nearest-feature relationships and mining-exposure indicators for 50, 100, and 150 m neighbourhoods were evaluated using exploratory Spearman rank correlations. Cumulative gallery length within 50 m showed the strongest association with elevation-loss magnitude (ρ = 0.734, p = 0.0008, q = 0.010), while extraction-sector coverage and gallery length remained positively associated at broader scales. R19 showed the greatest immediate extraction-sector exposure, whereas R14, which recorded the largest elevation loss, was characterised by a broader concentration of surrounding workings. R09 recorded the smallest elevation change and was approximately 470 m from the nearest reconstructed extraction sector. Cumulative mining configuration was more informative than nearest-sector distance alone for interpreting spatially variable post-mining deformation and highlighted the limitations of archival GIS reconstruction.
Keywords:
post-mining subsidence
; historical mine plans
; GIS reconstruction
; underground coal mining
; Petroșani Coal Basin
1. Introduction
Underground coal extraction modifies the initial stress field and may produce surface deformation both during mining and after mine closure. The magnitude and spatial distribution of this deformation depend on interacting factors such as extraction geometry and chronology, mining depth, seam thickness, overburden behaviour, and structural discontinuities [1,2,3,4,5,6,7]. Although geodetic monitoring, remote sensing, analytical methods, and numerical modelling can quantify ground movement [8,9,10,11], deformation measurements alone do not always explain why neighbouring surface locations exhibit different responses.
Historical mining documentation provides valuable spatial and temporal evidence for interpreting legacy underground workings. Archived plans may preserve extraction-sector boundaries, galleries, exploitation limits, pillars, mining elevations, and successive mining stages. After coordinate verification and structured digitisation within a geographic information system (GIS), these records can be integrated with present-day surface observations to reconstruct historical mining configurations [12]. However, because archival plans may contain positional inconsistencies or incomplete operational information, reconstructed geometries must be treated as plan-based spatial estimates and interpreted with explicit consideration of uncertainty [13].
This approach is particularly relevant in long-established mining districts, where several adjacent panels were exploited successively. In such settings, the present deformation pattern may reflect the cumulative configuration of multiple workings rather than the effect of one isolated panel. Nearest-feature distance alone may therefore provide an incomplete representation of mining influence, whereas multi-scale indicators describing extraction-sector coverage, gallery concentration, and the number of surrounding mining sectors may better characterize the historical underground context.
The Petroșani Coal Basin in the Southern Carpathians of Romania provides a suitable case study because of its lithological heterogeneity, tectonic compartmentalization, and complex history of underground coal exploitation. Within the Maleia–Livezeni sector, Coal Seam No. 3 was mined through several neighbouring panels, galleries, inclined workings, and submining sectors, mainly during the first decade of the twenty-first century. The successive development of these workings created a spatially complex mining configuration that can be compared with the cumulative elevation differences recorded at surface benchmarks.
Previous Global Positioning System (GPS) monitoring in the Petroșani mining area also documented spatially variable horizontal and vertical surface motions, with the largest movements occurring in the older central mining sector [14].
In this study, four archival mining plans and a coordinate-referenced Drawing Exchange Format (DXF) dataset were used to reconstruct twelve extraction sectors, principal galleries, exploitation limits, documented mining stages, and mining-elevation annotations. Cumulative 2007–2026 elevation differences measured at seventeen benchmarks were used as response values. The analysis combined nearest-feature relationships with mining-exposure indicators calculated within 50, 100, and 150 m neighbourhoods and within a 100–150 m annulus.
The objectives were to (1) reconstruct the documented spatial configuration and chronology of underground exploitation in Coal Seam No. 3; (2) quantify the position of the monitoring benchmarks relative to extraction sectors and principal galleries; and (3) evaluate whether spatially variable elevation loss is more consistently associated with cumulative mining exposure than with nearest-feature distance alone. Geological information was used as an interpretative framework, while the independent effects of lithology, faults, groundwater, overburden thickness, and rock-mechanical properties were not quantified at benchmark scale.
2. Geological and Mining Context
2.1. Regional Geological Framework
The Petroșani (Jiu Valley) Coal Basin is an Oligocene intramontane coal-bearing basin located in the Southern Carpathians of Romania [15,16]. It is approximately 45 km long, 1.5–9 km wide, and 163 km² in area [15]. It lies near the contact between the Getic domain and the Danubian Autochthon, and its coal-bearing succession is divided into mining blocks by longitudinal and transverse faults.
The basin fill comprises a lower conglomeratic complex, a 300–600 m thick productive marl–clay complex containing the principal coal horizons, and an upper detrital complex dominated by conglomerates and sandstones [15]. Alternation between competent sandstone or conglomeratic beds and weaker claystone, marl, and carbonaceous-shale intervals creates pronounced lithological and mechanical heterogeneity.
This heterogeneity and the tectonic compartmentalization provide the geological framework for interpreting spatially variable post-mining deformation. Their effects could not, however, be quantified at individual benchmarks.
2.2. Coal-Bearing Succession and Coal Seam No. 3
Coal Seam No. 3, the most productive coal bed of the Oligocene Dâlja–Uricani Formation, is the principal seam represented in the analysed plans [15,16]. It may contain one to thirty coal benches separated by clay-rich or sterile intercalations; the upper part is comparatively compact, whereas sterile interbeds generally increase toward the floor. The roof comprises alternating sandstones and clay-rich rocks, while the floor is dominated by hard siliceous or quartzitic sandstones and sandy claystones [15].
Within Block VIA, documented seam thickness ranges from approximately 2 to 16.8 m, with a locally exploitable thickness of about 10–10.5 m [15]. The contrast between competent sandstone beds and weaker fine-grained units provides a plausible framework for differential roof collapse, stress redistribution, and delayed compaction, although these processes were not measured beneath individual benchmarks.
2.3. Geological and Mining Setting of the Maleia–Livezeni Sector
The study area covers historical workings in Blocks VI, VIA, and VII of the Maleia–Livezeni sector. The Livezeni deposit is tectonically compartmentalized, and seam dips decrease from approximately 15–20° on the northern flank to 8–10° southward [15]. Coal Seam No. 3 was exploited at depths reaching about 300 m using mechanized longwall methods, extraction in slices, and total roof caving [15].
The archival documentation records extraction sectors, exploitation limits, base and roof galleries, directional workings, ventilation and collector inclines, access routes, pillars, and dated mining stages. The reconstructed sectors include Panel 3 North, Panel 1 North, Panel 2 North submining, Panel 4 submining, and neighbouring extraction areas, developed mainly between 2000 and 2007.
Variable seam inclination, substantial extracted thickness, roof caving, tectonic compartmentalization, and contrasting roof lithologies provide an interpretative framework. Benchmark-specific borehole, fault, groundwater, and rock-mechanical data were unavailable, so geological controls were not tested quantitatively.
3. Data and Methods
3.1. Data Sources and Research Design
The study integrated four archival underground mining plans, a coordinate-referenced DXF compilation, geological and mining information from the CEEX project (Contract No. 722/2006) [15], and net 2007–2026 elevation differences previously published for seventeen benchmarks [17].
The archival sources documented extraction-sector boundaries, exploitation limits, principal galleries, pillars, mining elevations, production information, and dated mining stages in Coal Seam No. 3, Blocks VI, VIA, and VII. Because their detail and spatial coverage varied, they were treated as historical cartographic evidence rather than as a survey-grade three-dimensional mine model.
The published Global Navigation Satellite System (GNSS) values were used only as response variables and were not reprocessed. The new contribution consists of the GIS reconstruction, chronology, multi-scale exposure indicators, validation of mining-elevation annotations, and exploratory statistical comparison with the benchmark elevation losses.
The previously published study [17] focused on the GNSS monitoring design, observation processing, measurement uncertainty, and the magnitude of the 2007–2026 benchmark displacements. The present manuscript does not repeat or reanalyse those geodetic procedures. The published net elevation differences are used exclusively as response variables for a new archival mine-plan reconstruction, mining-chronology assessment, multi-scale GIS exposure analysis, and validation of mining-elevation annotations. The extraction-sector polygons, gallery-exposure metrics, reconstructed chronology, and statistical comparisons reported here were not included in the previous study.
3.2. GIS Reconstruction and Quality Control
The DXF compilation was imported into QGIS [18] and processed in the Romanian Stereo 70 coordinate reference system (EPSG:3844). Benchmark geometries were created using the standard GIS order Point(Easting, Northing), accounting for the Romanian surveying convention X = northing and Y = easting.
Relevant gallery walls, extraction limits, dates, and technical annotations were retained. Principal galleries were digitised as centre lines, and closed polylines representing extracted or submined areas were converted into twelve extraction-sector polygons. Attributes were assigned only when supported by explicit labels or clear spatial relationships; ambiguous features were excluded from quantitative analysis.
Quality control included comparison with the source DXF, inspection of line continuity and attributes, and GEOS validity testing. All twelve retained polygons were valid. Because no independent underground control dataset was available, reconstructed positions and benchmark-to-feature distances are interpreted as plan-based estimates rather than centimetre-level locations.
Distances were computed from the reconstructed plan geometries and are reported as approximate GIS-derived values. Their numerical precision does not imply survey-grade positional accuracy.
3.3. Reconstruction of the Documented Mining Chronology
Chronology was reconstructed from dated annotations, extraction-front positions, production labels, and mining stages. Dates were assigned to a sector only when their graphical relationship was clear; ambiguous dates were retained as documentary information but excluded from formal interpretation.
The best-documented activity occurred between 2000 and 2007. Panel 3 North contained explicit stages for 2000–2002, Panel 2 North submining was documented approximately between 2002 and 2007, and Panel 4 submining was documented mainly after 2003. Panel 1 North was placed earlier in the sequence, but no precise interval could be assigned.
The chronology was interpreted at annual and panel scales and represents a documented sequence, not a complete production history or a precise temporal predictor of the 2007–2026 elevation changes.
3.4. Integration of Benchmark Elevation Differences
The response dataset comprised net elevation differences between the 2007 and 2026 surveys at seventeen benchmarks. Negative values indicate elevation loss, while || was used in statistical analysis so that larger downward changes corresponded to larger positive magnitudes.
Coordinates and elevation differences were taken from the previously published GNSS study [17]; the field observations, processing, adjustment, and uncertainty analysis were not repeated. All seventeen benchmarks were included in the planimetric analysis. R14, R19, R07, R06, and R09 were selected only for illustrative comparison and were not excluded from the full statistical dataset.
Because only two observation epochs were available, the values represent net change over nineteen years and do not establish whether deformation was continuous, episodic, or characterised by a constant rate.
3.5. Planimetric Mining-Exposure Analysis
Planimetric relationships were evaluated through polygon containment, nearest-feature analysis, and circular neighbourhoods. For each benchmark, QGIS was used to determine whether it lay inside an extraction sector, the nearest extraction sector and principal gallery, and their planimetric distances. A sector distance of 0 m denotes polygon containment, not distance to a boundary or underground void.
Buffers of 50, 100, and 150 m were intersected separately with extraction-sector polygons and gallery centre lines. For each radius, the analysis calculated extraction-sector area and percentage coverage, cumulative gallery length, and the number of distinct extraction sectors. Each sector was counted once using its unique identifier. A 100–150 m annulus was analysed separately to distinguish immediate from peripheral exposure; non-intersections were assigned zero.
Buffers were processed independently for each benchmark and could overlap. The selected radii are comparative GIS scales, not mechanically calibrated influence zones, legal hazard limits, or geotechnical safety boundaries.
The 50, 100, and 150 m radii were selected as nested comparative scales representing the immediate, intermediate, and broader local mining context, considering benchmark spacing and the mapped density of the reconstructed workings. They were not derived from a calibrated subsidence or influence-angle model.
3.6. Mining-Elevation Data Extraction and Validation
Numeric DXF text values between 200 and 800 m were converted to points to provide an exploratory vertical context. A value was accepted when it agreed with the Z coordinate of the corresponding three-dimensional DXF geometry within 0.01 m, yielding 567 verified mining-elevation points.
Because the points represented galleries, inclined workings, collectors, extraction sectors, and other technical features, they were not interpreted as exact panel depths or as a complete three-dimensional mine model. Within 150 m of each benchmark, the number, minimum, maximum, mean, median, range, and standard deviation of verified elevations were calculated, together with approximate vertical separations from the 2007 surface elevation.
Statistical analysis was restricted to ten benchmarks with at least ten verified points. R18, with one value, was retained only descriptively; benchmarks without supported vertical information remained in the planimetric analysis. Unequal point density and feature type were treated as important limitations.
3.7. Exploratory Statistical Analysis
Spearman rank correlations were used to compare || with the planimetric indicators for all seventeen benchmarks and with mining-elevation indicators for the ten benchmarks having sufficient vertical data. This non-parametric method was selected because of the small sample, non-normal and zero-inflated variables, and the absence of an assumed linear relationship.
All tests were two-sided with an initial threshold of p < 0.05. Benjamini–Hochberg false-discovery-rate-adjusted q values were reported for multiple comparisons [19]. Calculations were performed in Python using SciPy [20].
The complete benchmark-level dataset used in the planimetric correlation analysis is provided in Supplementary Table S1.
The coefficients were interpreted as exploratory associations, not causal or predictive relationships, because the benchmarks were spatially clustered, buffers could overlap, variables at different radii were correlated, and only two monitoring epochs were available. Documentary evidence, GIS-derived relationships, and geological interpretation were kept distinct throughout the analysis. The complete analytical workflow, from archival data preparation to statistical and geological interpretation, is summarised in Figure 1.
Because the small and spatially clustered benchmark network did not support a robust spatial-autocorrelation model, the reported p and q values are used only for exploratory screening and not for confirmatory inference.
To assess whether the strongest planimetric association was driven by an individual observation, a leave-one-benchmark-out sensitivity analysis was performed.
4. Results
4.1. Reconstructed Underground-Working Configuration
The GIS reconstruction produced twelve valid extraction-sector polygons, a connected network of principal galleries, exploitation limits, and the positions of the seventeen surface benchmarks relative to the reconstructed workings in Coal Seam No. 3, Blocks VI, VIA, and VII. The mapped sectors included Panel 1 North, Panel 2 North submining, Panel 3 North, Panel 4 submining, and neighbouring areas. Base, roof, directional, access, ventilation, collector, inclined, and connecting galleries formed an interconnected system rather than isolated workings. Panel 3 North was explicitly documented in Coal Seam No. 3, Slice I, Block VI, with a reported production of 68,800 tonnes.
Differences in sector size, adjacency, and gallery connections placed benchmarks inside sectors, near their margins, among several workings, or outside the main reconstructed mining concentration (Figure 2).
4.2. Documented Mining Chronology
The archival documentation recorded successive extraction and infrastructure-development stages, most consistently between 2000 and 2007. Panel 3 North contained explicit stages for 2000–2002; Panel 2 North submining was documented approximately between 2002 and 2007; and Panel 4 submining was documented mainly after 2003. Panel 1 North belonged to the earlier sequence, but its precise interval was unavailable.
The sequence indicates that adjacent sectors and galleries were developed successively rather than simultaneously. However, the plans lack uniform monthly records, extraction rates, and complete opening or closure dates, so Table 1 represents a plan-based chronology rather than a complete production history.
Because deformation observations are available only for 2007 and 2026, the chronology provides historical context but cannot identify when movement occurred during the nineteen-year interval.
4.3. Benchmark Response and Nearest-Feature Relationships
Net elevation loss varied from 0.082 m at R09 to 3.853 m at R14. R19, R07, and R06 also recorded large losses of 2.876, 2.860, and 2.848 m, respectively.
These four high-magnitude benchmarks were close to mapped sectors and galleries: nearest-sector distances ranged from 2.34 m at R19 to 39.08 m at R14, and nearest-gallery distances from 14.86 to 41.82 m. In contrast, R09 was approximately 470 m from the nearest reconstructed sector and 466 m from the nearest gallery, consistent with its peripheral location.
Proximity did not explain every response. R12 recorded 2.556 m despite being more than 600 m from reconstructed features, possibly reflecting incomplete archival coverage, broader deformation, local conditions, benchmark disturbance, or another untested influence. R03 and R04 lay inside sector polygons and therefore had sector distances of 0 m. Overall, proximity was informative but insufficient as a stand-alone explanation (Table 2).
4.4. Multi-Scale Mining-Exposure Patterns
Eight benchmarks intersected at least one extraction sector within 150 m. R19 showed the greatest immediate coverage within 50 m (65.20%), whereas R14 combined limited 50 m coverage (9.78%) with high 150 m coverage (48.32%) and the highest 100–150 m annular coverage (49.50%).
Gallery concentration showed a different ranking. R15 had the greatest cumulative gallery length within 150 m (953.35 m), followed by R14 (786.60 m), yet R15 did not record the greatest elevation loss. R06, R15, and R19 each intersected four distinct sectors within 150 m, while R14 and R07 intersected three.
Thus, high losses occurred under different configurations: strong immediate exposure at R19, broad peripheral exposure at R14, and mixed sector–gallery settings at R06 and R07. No single exposure indicator reproduced the complete benchmark ranking (Table 3).
4.5. Exploratory Statistical Associations
Cumulative gallery length within 50 m showed the strongest planimetric association with || ( = 0.734, p = 0.0008, q = 0.010). Gallery length, extraction-sector coverage, and the number of distinct sectors remained positively associated at broader scales, including the 100–150 m annulus.
The association remained positive in all leave-one-benchmark-out iterations ( = 0.674–0.804; p = 0.00020.0042), indicating that it was not driven by a single benchmark.
Distance to the nearest principal gallery showed a moderate negative association ( = 0.525, p = 0.0307, q = 0.033), whereas distance to the nearest extraction sector was weaker and not statistically supported after adjustment ( = 0.461, p = 0.0625, q = 0.062).
4.6. Exploratory Mining-Elevation Context
Ten benchmarks had at least ten verified mining-elevation points within 150 m. R14 was surrounded by 28 points between 330.50 and 375.50 m and had a mean vertical separation of 454.02 m. Mean separations were 424.41 m at R19, 453.81 m at R07, 429.64 m at R06, and 248.73 m at R16.
The largest elevation losses were therefore not associated with the shallowest documented workings. || was negatively associated with maximum, median, mean, and minimum mining elevation and positively associated with mean and minimum vertical separation. The strongest coefficient involved the standard deviation of mining elevations ( = 0.952, p < 0.0001, q < 0.001).
Given the small subset and the heterogeneous functional origin of the elevation annotations, these coefficients should be regarded as sensitivity indicators rather than as evidence of an independent vertical control on subsidence.
This result is sensitive to the uneven number, distribution, and functional type of the annotations. Associations involving the number of verified elevation points and the total documented elevation range were not statistically supported after adjustment. These vertical indicators describe the surrounding documented mining context; they do not represent exact panel depths beneath individual benchmarks or establish an independent depth-control mechanism (Table 5).
5. Discussion
5.1. Cumulative Mining Configuration Versus Nearest-Feature Interpretation
The main finding is that spatially variable elevation loss was more consistently associated with the cumulative configuration of panels and galleries than with nearest-sector distance alone. This is geologically and operationally plausible in a sector developed through adjoining extraction areas, interconnected infrastructure, and successive mining stages.
The contrasting benchmarks illustrate this point. R19 was dominated by immediate sector exposure, R14 by a broader surrounding concentration, and R06–R07 by mixed proximity to galleries and several sectors. R15 had the greatest 150 m gallery length without the greatest loss, while R12 remained unexplained by the available reconstruction. Thus, containment, distance, coverage, or gallery length should not be interpreted independently.
The strong association for gallery length within 50 m does not define a mechanical influence radius. Overlapping neighbourhoods, correlated indicators, spatial clustering, incomplete archival coverage, and unmeasured geological factors preclude causal attribution to an individual panel or gallery.
5.2. Significance of the Reconstructed Mining Chronology
The reconstructed 2000–2007 sequence shows that later extraction occurred in a rock mass already modified by earlier workings. Successive caving, fracturing, stress redistribution, and compaction may therefore have produced cumulative effects [1,2,3,4,5,6,7].
However, the chronology is incomplete and cannot be linked directly to deformation timing because only the 2007 and 2026 surface epochs are available. It supports a cumulative historical interpretation, not a time-resolved deformation model.
5.3. Geological Context and Geomechanical Interpretation
Coal Seam No. 3 occurs within alternating competent sandstones and weaker claystones, marls, and carbonaceous shales. Following roof caving, these contrasts may influence bridging, fracture development, stress transfer, and delayed compaction; successive extraction may enlarge the disturbed rock volume [1,2,3,4,5,6,7].
In another sector of the Jiu Valley, discontinuous post-mining deformation was associated with the combined influence of thick-seam extraction, longwall top-coal caving, relatively shallow workings, and nearby faults [21]. Although the mining and geological conditions are not identical to those at Maleia–Livezeni, this case illustrates the importance of considering mining geometry together with structural controls.
The observed patterns are compatible with these mechanisms but do not quantify them. Mining depth, extracted thickness, seam inclination, faults, groundwater, and rock-mass properties were not available uniformly at benchmark scale. The 567 elevation annotations add partial vertical context but represent different mining features rather than complete panel geometry.
Geology therefore provides an interpretative framework, not proof of a unique mechanism. Panel-specific three-dimensional geometry, boreholes, structural and hydrogeological observations, and rock-mechanical parameters would be required for causal assessment.
5.4. Contribution and Practical Implications
The study converts heterogeneous archival plans and DXF information into a structured GIS framework linked to existing geodetic observations. Its novelty lies not in a new GNSS dataset, but in reconstructing twelve extraction sectors, chronology, multi-scale exposure indicators, and 567 validated elevation annotations and evaluating them for all available benchmarks.
The workflow can support first-level screening in former mining districts where archival documentation survives but complete three-dimensional models do not. Locations surrounded by several sectors or dense gallery networks can be prioritised for renewed GNSS or interferometric synthetic aperture radar (InSAR) monitoring and site-specific geological or geotechnical investigation.
The indicators are screening variables only. The 50, 100, and 150 m radii are analytical scales, and high exposure does not establish present instability, a legal hazard zone, or a geotechnical safety boundary.
5.5. Limitations and Future Research
The main limitations arise from the heterogeneous scale, quality, completeness, and positional accuracy of the archival plans. Reconstructed features are plan-based estimates, and the two-dimensional buffers do not incorporate complete depth, seam inclination, extracted thickness, or disturbed-rock geometry. Overlapping neighbourhoods also reduce statistical independence.
Chronology is incomplete, surface deformation is represented by only two epochs, the network contains seventeen spatially clustered benchmarks, and the vertical analysis includes ten. The 567 elevation annotations are unevenly distributed and do not form a complete three-dimensional mine model. Benchmark-scale lithological, structural, hydrogeological, and rock-mechanical data were unavailable.
Future work should add GNSS or InSAR epochs, denser monitoring, panel-specific depth and extraction data, borehole and fault information, groundwater observations, and calibrated three-dimensional geomechanical modelling.
6. Conclusions
This study reconstructed twelve extraction sectors, principal galleries, mining stages, and 567 verified elevation annotations for Coal Seam No. 3 in the Maleia–Livezeni sector and integrated them with net 2007–2026 elevation differences at seventeen benchmarks.
Mining-feature concentration was more consistently associated with elevation-loss magnitude than nearest-sector distance alone. Gallery length within 50 m showed the strongest planimetric association, while sector coverage, gallery length, and the number of surrounding sectors remained informative at broader scales. The contrasting configurations of R19, R14, R06, R07, and R15 show that no individual GIS indicator explains the complete response.
The mining-elevation data provided partial vertical context but did not show that the largest losses occurred above the shallowest workings. Because the archival geometry is incomplete, the sample is small and spatially clustered, and benchmark-scale geological data are unavailable, the results are exploratory rather than causal.
The workflow is useful for preliminary post-mining screening and for prioritising additional monitoring, but its buffer radii are comparative GIS scales, not calibrated influence or hazard limits. Denser deformation observations and three-dimensional geological and mine models are required for predictive assessment.
Supplementary Materials
The following supporting information can be downloaded at the website of this paper posted on Preprints.org. Table S1. Complete benchmark-level dataset used in the exploratory planimetric analysis.
Author Contributions
Conceptualization, T.G. and V.P.; methodology, T.G. and V.P.; software, T.G.; formal analysis, T.G.; investigation, T.G.; data curation, T.G.; visualization, T.G.; writing—original draft preparation, T.G.; writing—review and editing, T.G. and V.P.; validation, V.P. All authors have read and agreed to the published version of the manuscript.
Funding
This research received no external funding.
Institutional Review Board Statement
Not applicable.
Informed Consent Statement
Not applicable.
Data Availability Statement
The 2007–2026 GNSS elevation-difference dataset is reported in reference [17]. The complete benchmark-level dataset used in the planimetric analysis is provided as Supplementary Table S1. The coordinate-referenced DXF compilation and derived GIS layers may be made available for scientific verification subject to institutional and archival restrictions.
Acknowledgments
The authors acknowledge the historical CEEX project documentation and archived mining plans that supported reconstruction of the underground mining geometry in the Maleia–Livezeni sector.
Conflicts of Interest
The authors declare no conflicts of interest.
References
- Peng, S.S. Surface Subsidence Engineering; Society for Mining, Metallurgy and Exploration: Littleton, CO, USA, 1992. [Google Scholar]
- Whittaker, B.N.; Reddish, D.J. Subsidence: Occurrence, Prediction and Control; Elsevier: Amsterdam, The Netherlands, 1989. [Google Scholar]
- Kratzsch, H. Mining Subsidence Engineering; Springer: Berlin/Heidelberg, Germany, 1983. [Google Scholar] [CrossRef]
- Bell, F.G.; Stacey, T.R.; Genske, D.D. Mining Subsidence and Its Effect on the Environment: Some Differing Examples. Environ. Geol. 2000, 40, 135–152. [Google Scholar] [CrossRef]
- Singh, R.P.; Dhar, B.B. Influence of Mine Geometry on Surface Subsidence Prediction. Int. J. Rock. Mech. Min. Sci. 1997, 34, 1147–1158. [Google Scholar]
- Brady, B.H.G.; Brown, E.T. Rock Mechanics for Underground Mining, 3rd ed.; Springer: Dordrecht, The Netherlands, 2004. [Google Scholar] [CrossRef]
- Strozik, G.; Jendruś, R.; Manowska, A.; Popczyk, M. Mine Subsidence as a Post-Mining Effect in the Upper Silesia Coal Basin. Pol. J. Environ. Stud. 2016, 25, 777–785. [Google Scholar] [CrossRef] [PubMed]
- Blachowski, J.; Ellefmo, S.L. Mining Ground Deformation Estimation Based on Pre-Processed InSAR Open Data—A Norwegian Case Study. Minerals 2023, 13, 328. [Google Scholar] [CrossRef]
- Cai, Y.; Jin, Y.; Wang, Z.; Chen, T.; Wang, Y.; Kong, W.; Xiao, W.; Li, X.; Lian, X.; Hu, H. A Review of Monitoring, Calculation, and Simulation Methods for Ground Subsidence Induced by Coal Mining. Int. J. Coal Sci. Technol. 2023, 10, 32. [Google Scholar] [CrossRef]
- Lian, X.; Shi, L.; Kong, W.; Han, Y.; Fan, H. Residual Subsidence Time Series Model in Mountain Area Caused by Underground Mining Based on GNSS Online Monitoring. Int. J. Coal Sci. Technol. 2024, 11, 27. [Google Scholar] [CrossRef]
- Ma, Z.; Yang, X.; Xie, L.; Dong, W. Life Cycle Mining Deformation Monitoring and Analysis Using Sentinel-1 and Radarsat-2 InSAR Time Series. Remote Sens. 2024, 16, 2335. [Google Scholar] [CrossRef]
- Hvizdák, L.; Tometzová, D.; Iannaccone, B.; Šoltésová, M.; Domaracká, L.; Kyšeľa, K. Old Mine Map Georeferencing: Case of Marsigli’s 1696 Map of the Smolník Mines. ISPRS Int. J. Geo-Inf. 2023, 12, 345. [Google Scholar] [CrossRef]
- Bindzarova Gergelova, M.; Labant, S.; Mizak, J.; Sustek, P.; Leicher, L. Inventory of Locations of Old Mining Works Using LiDAR Data: A Case Study in Slovakia. Sustainability 2021, 13, 6981. [Google Scholar] [CrossRef]
- Muntean, A.; Mocanu, V.; Ambrosius, B. A GPS Study of Land Subsidence in the Petroșani (Romania) Coal Mining Area. Nat. Hazards 2016, 80, 797–810. [Google Scholar] [CrossRef]
- University of Bucharest; National Institute for Earth Physics; University of Petroșani. Subsidence of Lands Affected by Underground Mining: The Case of the Petroșani Mining Basin; CEEX Programme, Contract No. 722/2006, Research and Scientific–Technical Reports, Stages I–IV; Bucharest, Romania, 2006–2008. (In Romanian) [Google Scholar]
- Belkin, H.E.; Tewalt, S.J.; Hower, J.C.; Stucker, J.D.; O’Keefe, J.M.K.; Tatu, C.A.; Buia, G. Petrography and Geochemistry of Oligocene Bituminous Coal from the Jiu Valley, Petroșani Basin (Southern Carpathian Mountains), Romania. Int. J. Coal Geol. 2010, 82, 68–80. [Google Scholar] [CrossRef]
- Gavrilescu, T.; Păunescu, C. Persistent Mining-Induced Subsidence Two Decades after Underground Coal Exploitation: Evidence from Multi-Temporal GNSS Monitoring. Mining 2026, 6, 57. [Google Scholar] [CrossRef]
- Graser, A.; Sutton, T.; Bernasocchi, M. The QGIS Project: Spatial without Compromise. Patterns 2025, 6, 101265. [Google Scholar] [CrossRef] [PubMed]
- Benjamini, Y.; Hochberg, Y. Controlling the False Discovery Rate: A Practical and Powerful Approach to Multiple Testing. J. R. Stat. Soc. Ser. B 1995, 57, 289–300. [Google Scholar] [CrossRef]
- Virtanen, P.; Gommers, R.; Oliphant, T.E.; Haberland, M.; Reddy, T.; Cournapeau, D.; Burovski, E.; Peterson, P.; Weckesser, W.; Bright, J.; et al. SciPy 1.0: Fundamental Algorithms for Scientific Computing in Python. Nat. Methods 2020, 17, 261–272. [Google Scholar] [CrossRef] [PubMed]
- Marian, D.P.; Onica, I. Analysis of the Geomechanical Phenomena That Led to the Appearance of Sinkholes at the Lupeni Mine, Romania, in the Conditions of Thick Coal Seams Mining with Longwall Top Coal Caving. Sustainability 2021, 13, 6449. [Google Scholar] [CrossRef]
Figure 1.
Methodological workflow used to reconstruct the historical underground workings and evaluate their spatial relationships with cumulative benchmark elevation differences.
Figure 1.
Methodological workflow used to reconstruct the historical underground workings and evaluate their spatial relationships with cumulative benchmark elevation differences.
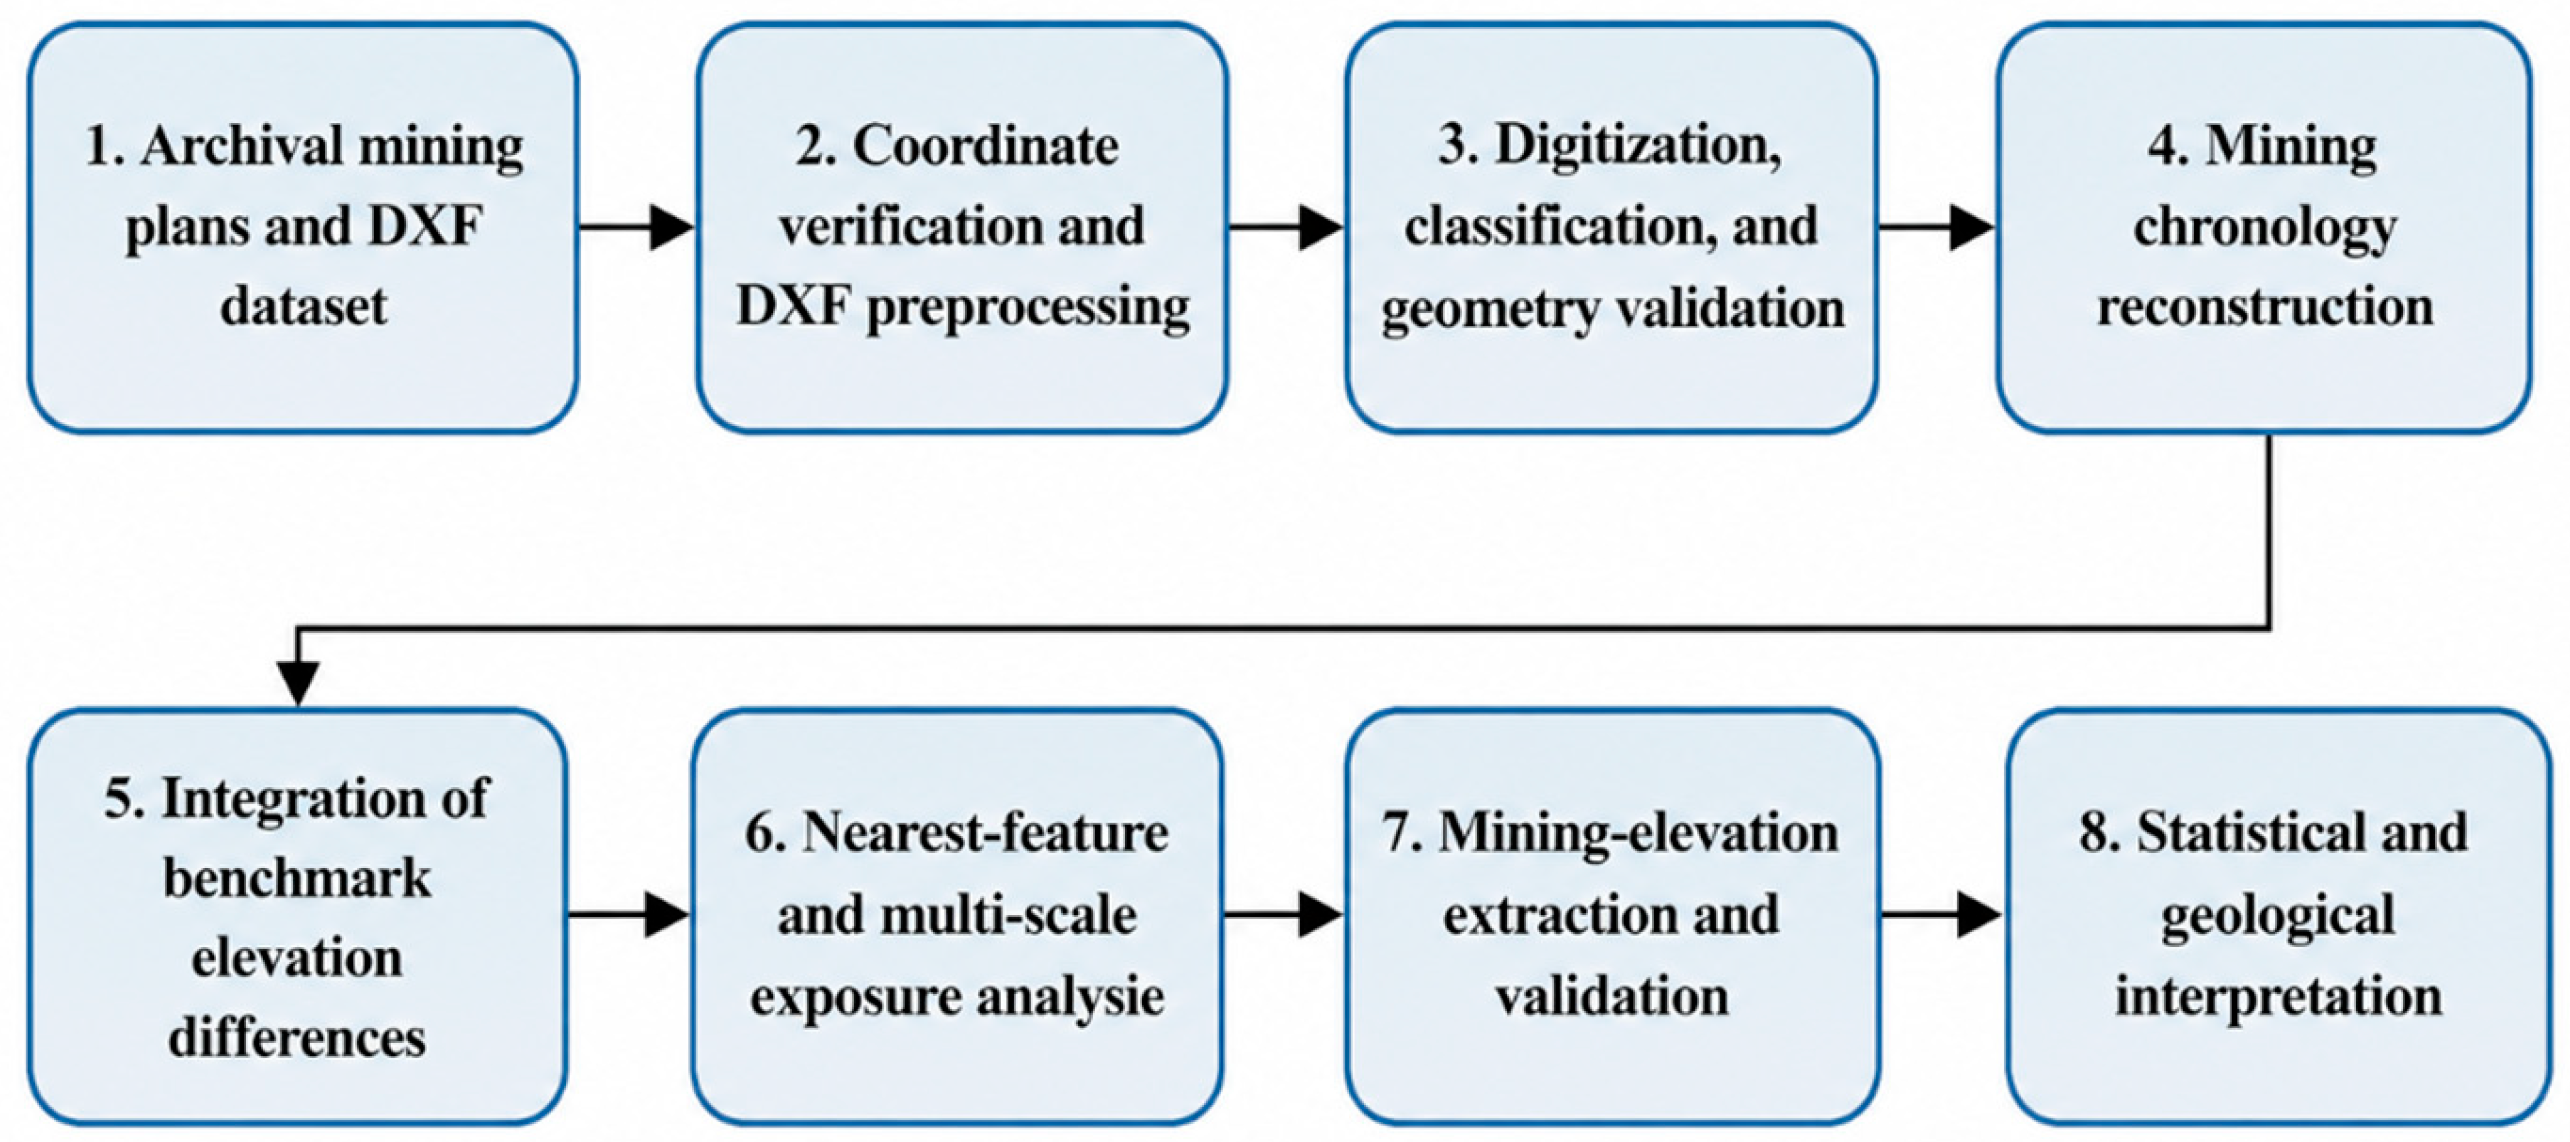
Figure 2.
GIS reconstruction of the historical underground workings in the Maleia–Livezeni sector. The main map shows reconstructed extraction sectors, principal-gallery centre lines, and benchmarks located near the mapped workings, while the inset presents the complete seventeen-benchmark monitoring network. The underground geometry was reconstructed from archival mining plans and a coordinate-referenced DXF compilation in the Romanian Stereo 70 coordinate reference system (EPSG:3844). Feature positions should be interpreted as plan-based spatial estimates.
Figure 2.
GIS reconstruction of the historical underground workings in the Maleia–Livezeni sector. The main map shows reconstructed extraction sectors, principal-gallery centre lines, and benchmarks located near the mapped workings, while the inset presents the complete seventeen-benchmark monitoring network. The underground geometry was reconstructed from archival mining plans and a coordinate-referenced DXF compilation in the Romanian Stereo 70 coordinate reference system (EPSG:3844). Feature positions should be interpreted as plan-based spatial estimates.
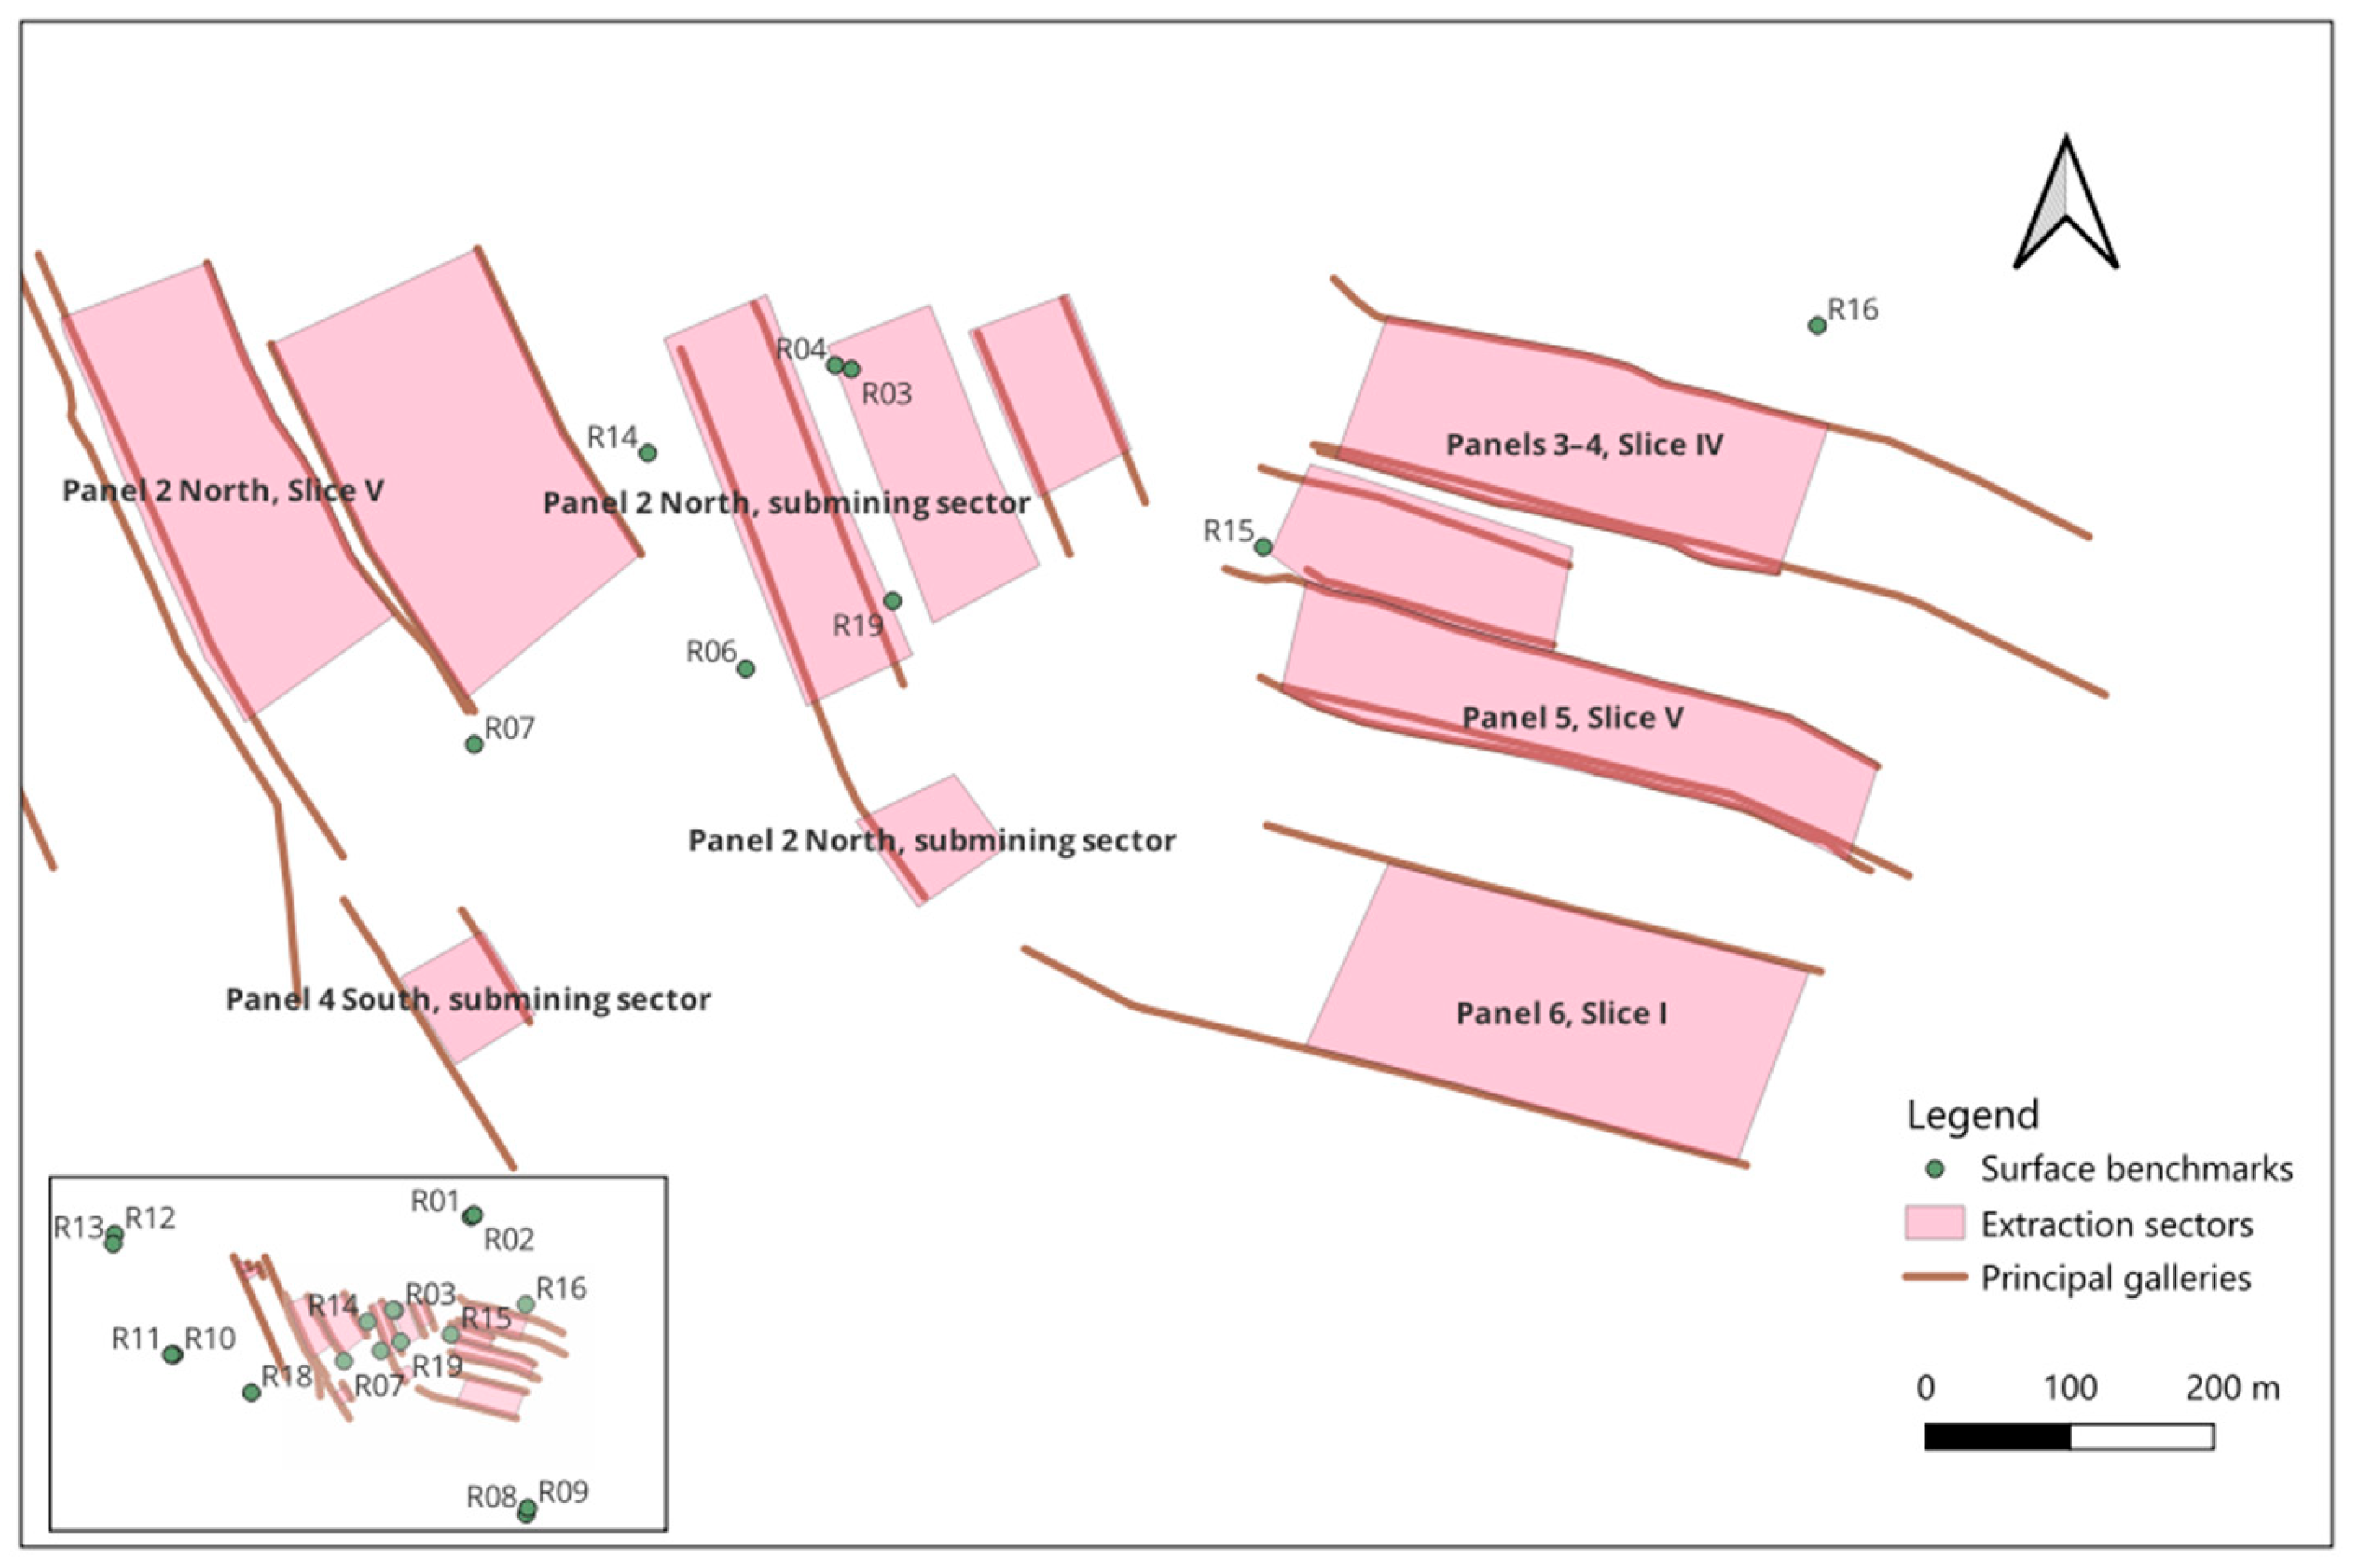
Figure 3.
Exploratory relationships between the magnitude of the net 2007–2026 elevation difference, ||, and the GIS-derived mining indicators: (a) Spearman rank-correlation coefficients for the selected planimetric variables, with asterisks indicating false-discovery-rate-adjusted q < 0.05; and (b) relationship between || and cumulative principal-gallery length within 50 m of each benchmark. Benchmark labels identify representative and contrasting observations.
Figure 3.
Exploratory relationships between the magnitude of the net 2007–2026 elevation difference, ||, and the GIS-derived mining indicators: (a) Spearman rank-correlation coefficients for the selected planimetric variables, with asterisks indicating false-discovery-rate-adjusted q < 0.05; and (b) relationship between || and cumulative principal-gallery length within 50 m of each benchmark. Benchmark labels identify representative and contrasting observations.
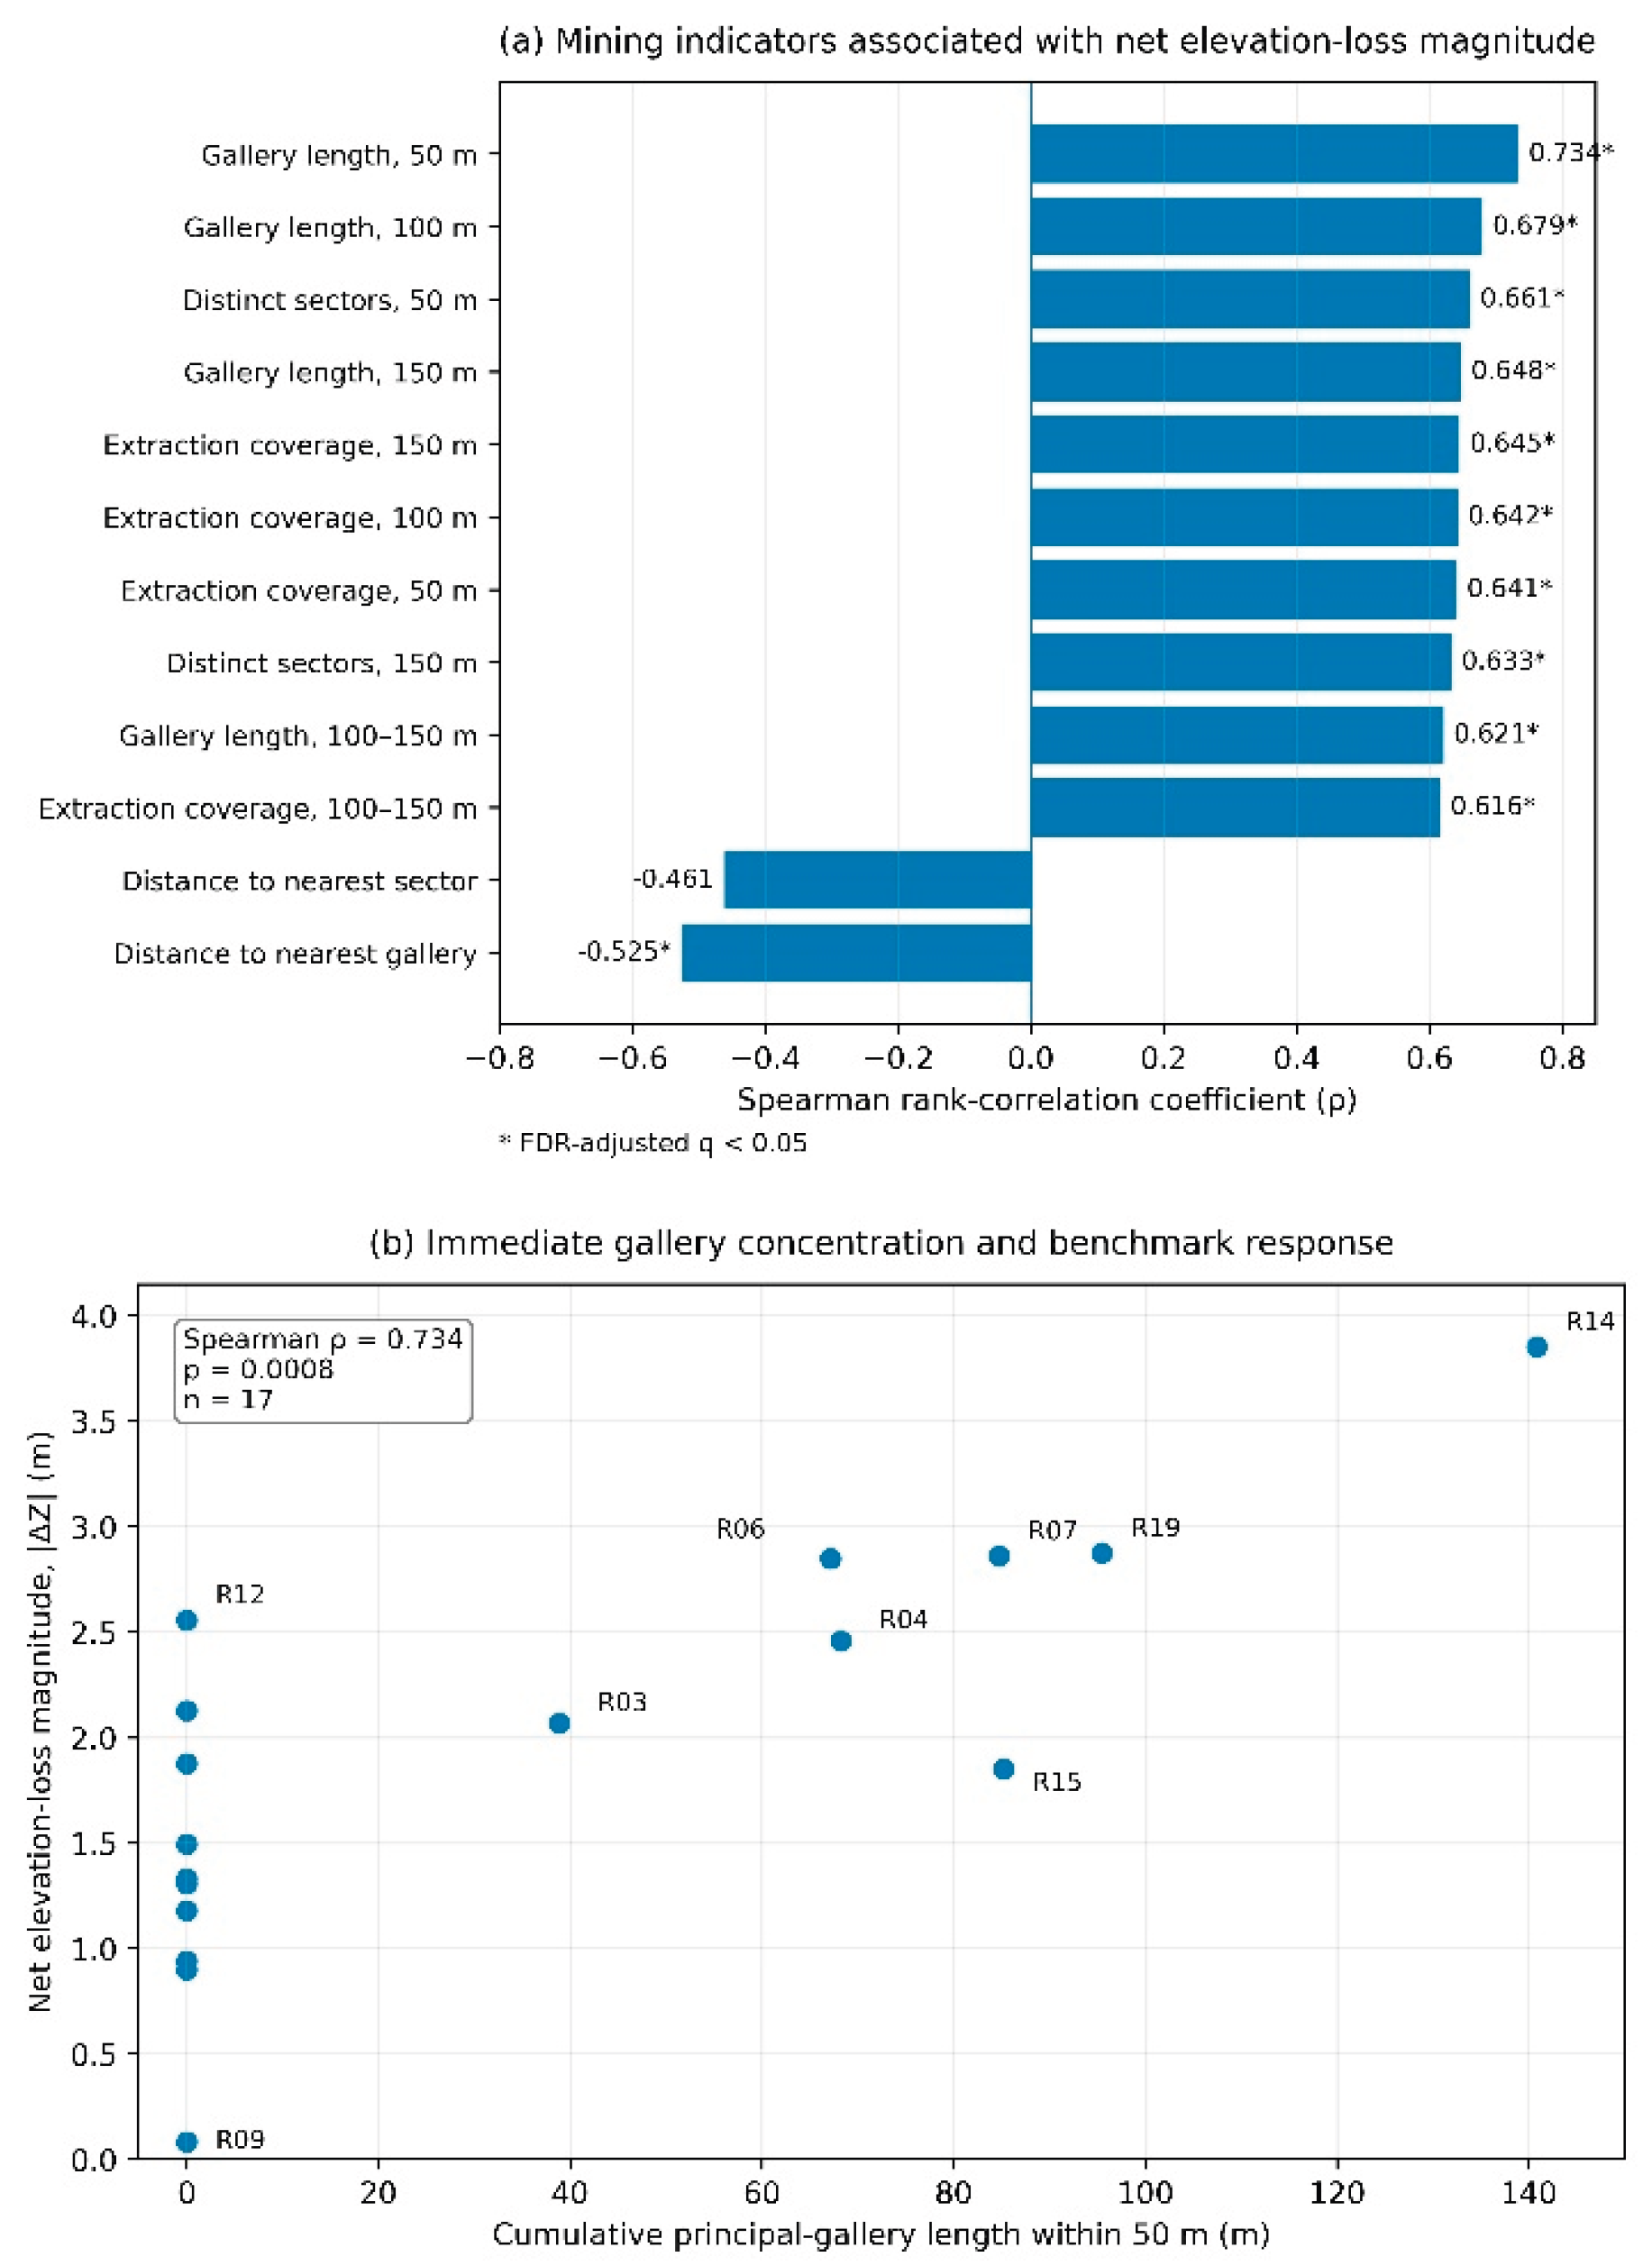

Table 1.
Mining sectors and chronological information reconstructed from the archival documentation. The intervals represent explicitly documented or approximately inferred plan-based activity periods rather than a complete operational history.
Table 1.
Mining sectors and chronological information reconstructed from the archival documentation. The intervals represent explicitly documented or approximately inferred plan-based activity periods rather than a complete operational history.
| Coal seam and mining block | Mining sector | Documentary evidence | Documented interval | Principal mapped elements |
|---|---|---|---|---|
| Coal Seam No. 3, Slice I, Block VI | Panel 3 North | Panel label, production annotation, and explicitly dated mining stages | 2000–2002; explicitly documented stages | Base, roof, and directional galleries; extraction limits |
| Coal Seam No. 3, Block VI | Panel 1 North | Panel label and spatial relationship with earlier documented workings | Earlier part of the reconstructed sequence; precise interval unavailable | Extraction limits and associated galleries |
| Coal Seam No. 3, Block VI | Panel 2 North submining | Dated extraction and infrastructure annotations | Approximately 2002–2007 | Base and roof galleries; ventilation and collector workings |
| Coal Seam No. 3, Blocks VI–VIA | Panel 4 submining | Panel label and dated mining stages associated with adjoining workings | Mainly after 2003 | Sector limits; access, ventilation, inclined, and collector workings |
Table 2.
Net 2007–2026 elevation differences and nearest-feature relationships for five representative benchmarks. Negative ΔZ values indicate elevation loss.
Table 2.
Net 2007–2026 elevation differences and nearest-feature relationships for five representative benchmarks. Negative ΔZ values indicate elevation loss.
| Benchmark | ΔZ (m) | Position relative to mapped extraction sectors | Distance to nearest extraction sector (m) | Distance to nearest principal gallery (m) |
|---|---|---|---|---|
| R14 | 3.853 | Outside | 39.08 | 41.82 |
| R19 | 2.876 | Outside; immediately adjacent | 2.34 | 14.86 |
| R07 | 2.860 | Outside | 32.52 | 23.17 |
| R06 | 2.848 | Outside | 29.97 | 36.91 |
| R09 | 0.082 | Outside; peripheral to reconstructed workings | 470.03 | 466.16 |
Table 3.
Multi-scale mining-exposure indicators for benchmarks intersecting at least one reconstructed extraction sector within 150 m. Negative ΔZ values indicate elevation loss.
Table 3.
Multi-scale mining-exposure indicators for benchmarks intersecting at least one reconstructed extraction sector within 150 m. Negative ΔZ values indicate elevation loss.
| Benchmark | ΔZ (m) | Coverage within 50 m (%) | Coverage within 150 m (%) | Coverage in 100–150 m annulus (%) | Gallery length within 150 m (m) | Distinct sectors within 150 m |
|---|---|---|---|---|---|---|
| R03 | 2.067 | 54.94 | 46.94 | 40.50 | 479.54 | 3 |
| R04 | 2.458 | 51.67 | 43.79 | 34.71 | 463.16 | 3 |
| R06 | 2.848 | 14.26 | 25.05 | 26.22 | 537.14 | 4 |
| R07 | 2.860 | 3.50 | 20.79 | 28.14 | 606.56 | 3 |
| R14 | 3.853 | 9.78 | 48.32 | 49.50 | 786.60 | 3 |
| R15 | 1.850 | 26.61 | 34.91 | 36.90 | 953.35 | 4 |
| R16 | 1.306 | 0.00 | 14.69 | 19.43 | 268.32 | 1 |
| R19 | 2.876 | 65.20 | 40.54 | 28.28 | 567.00 | 4 |
Table 4.
Exploratory Spearman rank correlations between the magnitude of the net 2007–2026 elevation difference, |ΔZ|, and selected planimetric mining indicators for the seventeen benchmarks. The q values represent Benjamini–Hochberg false-discovery-rate adjustments. The complete benchmark-level input dataset is provided in Supplementary Table S1.
Table 4.
Exploratory Spearman rank correlations between the magnitude of the net 2007–2026 elevation difference, |ΔZ|, and selected planimetric mining indicators for the seventeen benchmarks. The q values represent Benjamini–Hochberg false-discovery-rate adjustments. The complete benchmark-level input dataset is provided in Supplementary Table S1.
| Mining indicator | n | Spearman | p value | q value |
|---|---|---|---|---|
| Gallery length within 50 m | 17 | 0.734 | 0.0008 | 0.010 |
| Gallery length within 100 m | 17 | 0.679 | 0.0027 | 0.010 |
| Gallery length within 150 m | 17 | 0.648 | 0.0049 | 0.010 |
| Extraction-sector coverage within 50 m | 17 | 0.641 | 0.0056 | 0.010 |
| Extraction-sector coverage within 100 m | 17 | 0.642 | 0.0054 | 0.010 |
| Extraction-sector coverage within 150 m | 17 | 0.645 | 0.0052 | 0.010 |
| Distinct extraction sectors within 50 m | 17 | 0.661 | 0.0039 | 0.010 |
| Distinct extraction sectors within 150 m | 17 | 0.633 | 0.0064 | 0.010 |
| Gallery length within the 100–150 m annulus | 17 | 0.621 | 0.0078 | 0.011 |
| Extraction-sector coverage within the 100–150 m annulus | 17 | 0.616 | 0.0085 | 0.011 |
| Distance to nearest principal gallery | 17 | 0.525 | 0.0307 | 0.033 |
| Distance to nearest extraction sector | 17 | 0.461 | 0.0625 | 0.062 |
| Distinct extraction sectors within 100 m | 17 | 0.541 | 0.0250 | 0.029 |
| Distinct extraction sectors within the 100–150 m annulus | 17 | 0.633 | 0.0064 | 0.010 |
Table 5.
Exploratory sensitivity analysis based on Spearman rank correlations between the magnitude of the net 2007–2026 elevation difference, |ΔZ|, and mining-elevation indicators for the ten benchmarks with at least ten verified mining-elevation points within 150 m. The q values represent Benjamini–Hochberg false-discovery-rate adjustments.
Table 5.
Exploratory sensitivity analysis based on Spearman rank correlations between the magnitude of the net 2007–2026 elevation difference, |ΔZ|, and mining-elevation indicators for the ten benchmarks with at least ten verified mining-elevation points within 150 m. The q values represent Benjamini–Hochberg false-discovery-rate adjustments.
| Mining-elevation indicator | n | Spearman | p value | q value |
|---|---|---|---|---|
| Standard deviation of documented mining elevations | 10 | 0.952 | <0.0001 | <0.001 |
| Maximum documented mining elevation | 10 | 0.899 | 0.0004 | 0.002 |
| Median documented mining elevation | 10 | 0.851 | 0.0018 | 0.006 |
| Mean documented mining elevation | 10 | 0.842 | 0.0022 | 0.006 |
| Minimum documented mining elevation | 10 | 0.787 | 0.0069 | 0.013 |
| Mean vertical separation | 10 | 0.782 | 0.0075 | 0.013 |
| Minimum vertical separation | 10 | 0.721 | 0.0186 | 0.027 |
| Maximum vertical separation | 10 | 0.648 | 0.0425 | 0.053 |
| Number of verified elevation points | 10 | 0.588 | 0.0739 | 0.082 |
| Documented elevation range | 10 | 0.445 | 0.1974 | 0.197 |
Disclaimer/Publisher’s Note: The statements, opinions and data contained in all publications are solely those of the individual author(s) and contributor(s) and not of MDPI and/or the editor(s). MDPI and/or the editor(s) disclaim responsibility for any injury to people or property resulting from any ideas, methods, instructions or products referred to in the content. |
© 2026 by the authors. Licensee MDPI, Basel, Switzerland. This article is an open access article distributed under the terms and conditions of the Creative Commons Attribution (CC BY) license.
Copyright: This open access article is published under a Creative Commons CC BY 4.0 license, which permit the free download, distribution, and reuse, provided that the author and preprint are cited in any reuse.