

Submitted:
17 August 2026
Posted:
17 August 2026
You are already at the latest version
Abstract
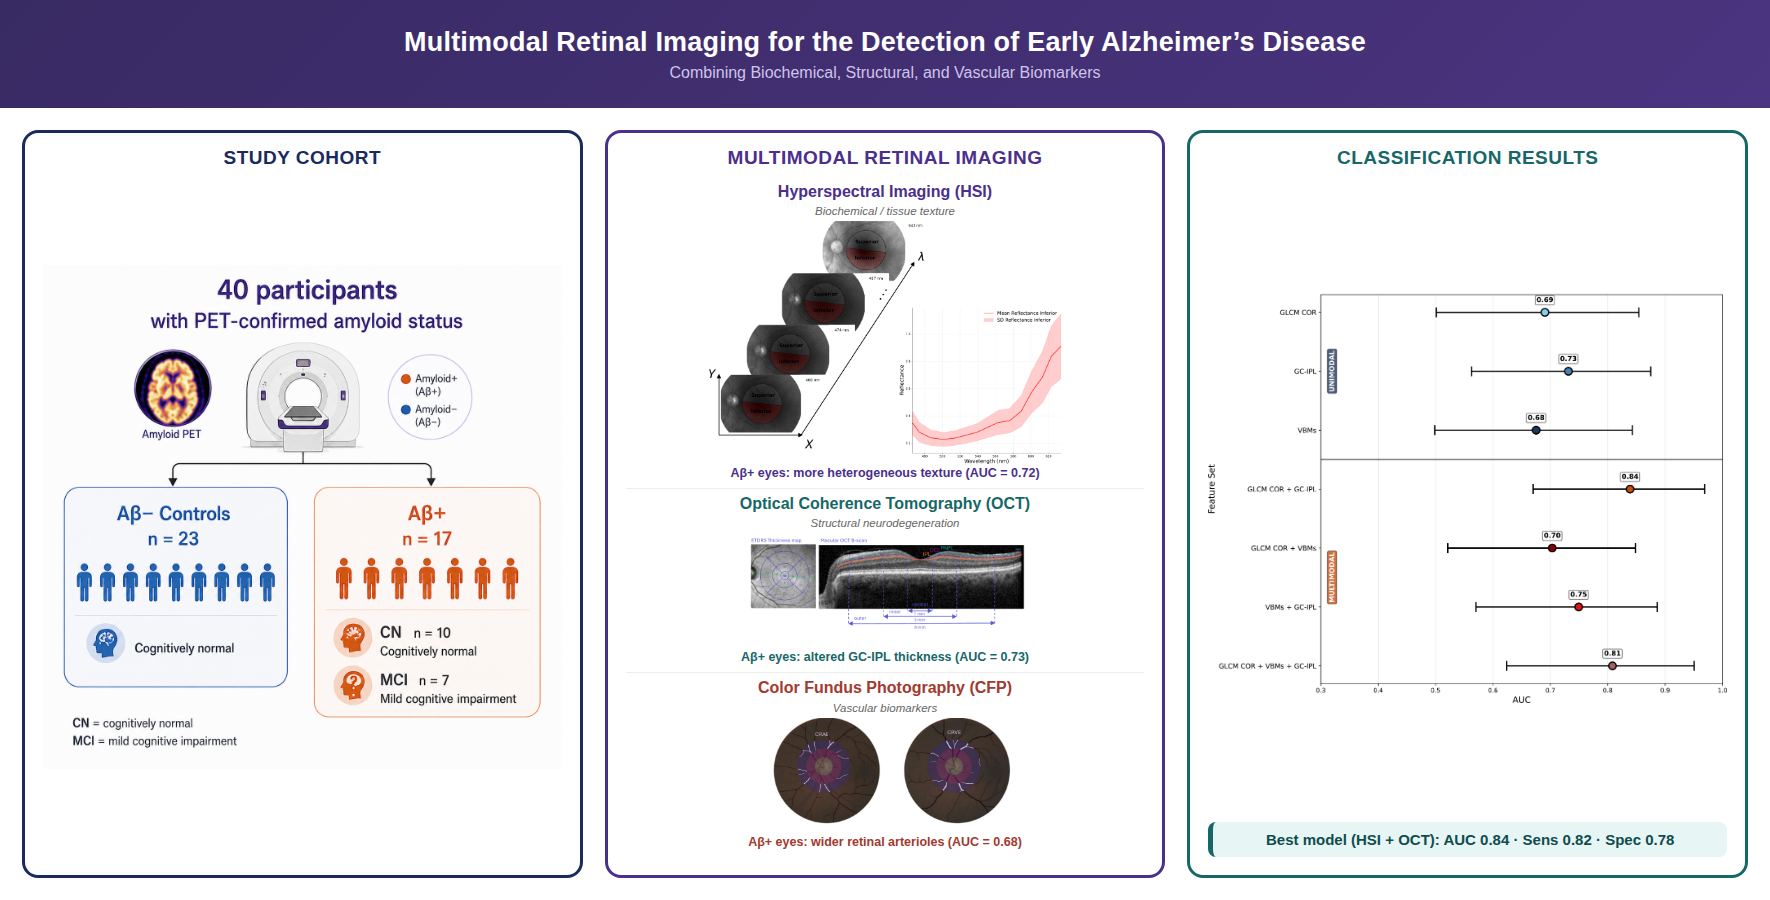
Alzheimer’s disease (AD) pathology is increasingly recognized to manifest in the retina, offering a non-invasive window for early biomarker discovery. This proof-of-concept study investigated whether multimodal retinal imaging—hyperspectral imaging (HSI), optical coherence tomography (OCT), and color fundus photography (CFP)—can differentiate individuals with and without cerebral amyloid-beta (Aβ) pathology in 40 participants with PET-confirmed Aβ status (17 Aβ+, cognitively normal or with mild cognitive impairment; 23 Aβ− cognitively normal controls). HSI-derived gray-level co-occurrence matrix (GLCM) texture, OCT-derived ganglion cell–inner plexiform layer (GC-IPL) thickness, and CFP-derived vascular biomarkers (VBMs) were extracted, and logistic regression with leave-one-out cross-validation assessed classification performance per modality, alone and combined; the cohort was supplemented with AD dementia patients for exploratory trajectory analyses. HSI showed significantly lower GLCM correlation at 466 nm in Aβ+ participants, most pronounced in the inferior macula (p = 0.01, AUC = 0.72), and GC-IPL thickness confirmed an “inferior vulnerability zone.” Combining HSI and GC-IPL features yielded the best performance (AUC = 0.84; sensitivity = 0.82; specificity = 0.78), whereas vascular biomarkers contributed minimally. HSI features followed a non-monotonic trajectory across the AD continuum, decreasing in early Aβ+ stages and rising again in dementia. These findings demonstrate synergy between HSI and OCT for detecting retinal biomarkers of early-stage AD, supporting multimodal retinal imaging as a scalable screening approach warranting validation in larger, longitudinal cohorts.
Keywords:
Alzheimer’s disease
; retinal imaging
; hyperspectral imaging
; optical coherence tomography
; vascular biomarkers
; machine learning
1. Introduction
Dementia is a major public health concern, with more than 150 million people expected to be affected by 2050 due to demographic aging [1]. Alzheimer’s disease (AD), the leading cause of dementia, progresses along a biological continuum that begins decades before clinical symptoms emerge, marked by the silent accumulation of amyloid-β (Aβ) and tau [2]. As the disease progresses, these protein aggregates trigger synaptic dysfunction and neuronal loss, alongside cerebral amyloid angiopathy, neuroinflammation, and gliosis, reflecting the multifactorial nature of the disease [3]. Current global estimates suggest that approximately 315 million individuals are in the preclinical phase (Aβ-positive but cognitively normal, CN), 69 million in the prodromal stage (mild cognitive impairment, MCI due to AD), and over 32 million live with AD dementia (ADD) [4]. Given this large at-risk population, there is an urgent need for effective early-detection strategies. The recent arrival of monoclonal antibodies as a promising therapeutic approach, showing moderate effect in decelerating cognitive decline, further underscores the importance of timely identification and intervention [5]. Moreover, early biomarker-based identification not only facilitates timely lifestyle interventions but also enables clinical trial recruitment, which is crucial for advancing the development of disease-modifying treatments [6,7]. Furthermore, understanding biomarkers trajectories across the disease continuum is crucial for monitoring disease progression [8]. However, current gold-standard biomarkers, such as cerebrospinal fluid analysis (CSF) assays and positron emission tomography (PET), are invasive, expensive, and unsuitable for population-level screening [9]. This has driven efforts towards non-invasive, scalable, and cost-effective alternatives [10], including promising blood-based biomarkers (BBMs) such as plasma phosphorylated tau (p-tau), which demonstrate high diagnostic accuracy [11].
Alternatively, due to its common embryological origin and direct anatomical continuity with the brain, the retina has gained prominence as a non-invasive biomarker site for detecting early AD-related changes [12,13,14]. Among the available retinal imaging modalities, hyperspectral imaging (HSI) offers a unique advantage by capturing both spatial and spectral information (Figure 1a), enabling detection of subtle biochemical alterations that may precede any discernible structural damage [15,16]. Furthermore, both postmortem and in vivo studies have demonstrated that HSI can identify spectral signatures associated with retinal Aβ deposition [15,16,17]. To mitigate the high inter-subject variability of raw spectral reflectance data [18,19], recent studies have incorporated texture features derived from the gray-level co-occurrence matrix (GLCM), which capture spatial relationships between pixel intensities and improve discrimination robustness [19]. Nonetheless, the potential of HSI remains underexplored in AD research. The macula has been suggested as a particularly susceptible site in preclinical AD, with several studies reporting subtle thinning of macular layers in individuals with MCI [20,21,22]. These findings indicate that the macula may exhibit early pathological changes, potentially before widespread neurodegeneration is detectable, which could be more sensitively captured through GLCM-based texture analysis [23]. Yet, no HSI study to date has systematically examined how texture alterations vary across the macula, representing a critical step toward identifying regions of early retinal vulnerability in AD. Moreover, establishing the measurement reliability of such novel features is critical for their validation as clinical biomarkers.
Adding to the biochemical insights from HSI, other complementary retinal imaging biomarkers can capture different aspects of AD pathology, such as structural and vascular changes. Optical coherence tomography (OCT) provides high-resolution cross-sectional imaging of the retina, enabling quantification of structural neurodegeneration through layers such as the retinal nerve fiber layer (RNFL) consisting of ganglion cell axons, the ganglion cell layer (GC) containing their cell bodies, and the inner plexiform layer (IPL) that includes their dendrites and synapses (Figure 1b) [22]. Standard OCT protocols often quantify the latter two as a single unit, the ganglion cell-inner plexiform layer (GC-IPL), which has emerged as a sensitive biomarker of neurodegeneration in MCI and AD [24]. In parallel, vascular biomarkers (VBMs) can shed light on the microvascular dysfunction known to contribute to AD progression [25].
Advances in machine learning (ML) and deep learning (DL) techniques are increasingly used in ophthalmic imaging for automated extraction of quantitative biomarkers and disease classification [26]. Using DL based segmentation of color fundus photography (CFP), VBMs such as the Central Retinal Arteriolar and Venular Equivalents (CRAE/CRVE) can be automatically extracted for large-scale analysis (Figure 1c) [27,28].
Prior studies have demonstrated the added value of combining imaging modalities. For instance, Sharafi et al. [19] used a support vector machine (SVM) to show that supplementing vascular measures with HSI-based texture features improved detection accuracy from 76% to 85%. Similarly, in our previous work, we demonstrated that a linear discriminant analysis (LDA) model combining HSI with OCT features outperformed HSI alone, enabling more accurate classification of individuals with established ADD [29]. Despite these insights, it remains unknown whether this diagnostic ability and synergy extend to the more subtle pathological changes present in early, Aβ PET-confirmed stages of AD. A comprehensive model integrating biochemical (HSI), structural (OCT), and vascular (CFP-based) biomarkers for early AD detection has yet to be systematically developed and validated.
To address these knowledge gaps, we conducted a proof-of-concept study focused on both early AD detection and biomarker trajectories. Our primary classification analyses were performed on a well-characterized cohort of CN and MCI participants with PET-confirmed Aβ status. For an exploratory analysis of how biomarkers behave across the disease continuum, this cohort was supplemented with a group of patients with ADD.
Our aims were threefold: (1) to evaluate HIS-derived texture features for classifying Aβ status and to identify topographic patterns of retinal vulnerability; (2) to explore the trajectory of the most salient HSI biomarker across the AD continuum using the augmented cohort; and (3) to systematically compare the diagnostic performance of biochemical (HSI), structural (OCT), and vascular (VBMs) biomarkers, both individually and in combination.
2. Materials and Methods
2.1. Study Participants and Cohort Definitions
To address the study aims, two distinct participant cohorts were included. The primary CN/MCI cohort was used for unimodal and multimodal classification analyses, while an additional CN/ADD cohort was combined with the primary cohort for exploratory analyses of biomarker trajectories across the AD continuum.
The primary CN/MCI cohort consisted of 40 participants recruited for the prospective, longitudinal biomarker study Multimodal Retinal Imaging in the Detection and Follow-up of Alzheimer’s Disease (RetAD) (ClinicalTrials.gov: NCT03466177). We included participants aged 50–85 years with complete multimodal retinal imaging and Aβ PET data. For each participant, a single study eye was selected and used consistently for all imaging modalities and follow-up visits. Exclusion criteria included major neurological disorders other than AD, large-vessel stroke, focal brain lesions on MRI, or ocular diseases other than refractive error or cataract (e.g. glaucoma). Participants underwent a standardized neuropsychological assessment to evaluate global cognition (Mini-Mental State Examination [MMSE]) and specific domains including memory (Auditory Verbal Learning Test [AVLT]), language (Boston Naming Test [BNT]), and verbal fluency (Animal Verbal Fluency [AVF]). Amyloid burden was assessed via static 18F-Flutemetamol PET scans acquired 90–110 min post-injection [30]. Standardized uptake value ratios (SUVRs) were converted to Centiloid (CL) values, with participants classified as Aβ positive (Aβ+) if CL values > 23.5 and Aβ negative (Aβ−) if CL ≤23.5 [31]. Study protocols were approved by the Ethics Committee of UZ Leuven and were conducted with the EU Directive on Clinical Trials (2001/20/EC) and the Declaration of Helsinki.
For the exploratory trajectory analysis, the primary cohort was supplemented with an additional CN/ADD cohort from our previously published study [29], comprising 22 CN controls and 17 patients with clinically or biomarker-confirmed ADD, with no overlap in participants between the cohorts.
2.2. Image Acquisition and Feature Extraction
2.2.1. Hyperspectral Retinal Imaging (HSI)
Acquisition and pre-processing
Macula-centered HSI was acquired using a MQ022HG-IM-SM4X4-VIS2 snapshot camera (Ximea, Münster, Germany) connected to a Topcon TRC-50DX fundus camera (Topcon Corporation, Japan), capturing 16 spectral bands in a single 0.2 ms exposure (50° field of view (FOV), 460-620 nm, bit depth 10, analog gain 3.2x) [32,33]. Following the acquisition protocol described by Lemmens et al. [29], raw images were pre-processed by computing relative reflectance using dark and white reference frames, followed by application of a spectral correction matrix [34]. This correction applied the sensor’s spectral response model to account for cross-talk between neighboring spectral bands, converting raw digital readings into effective spectral reflectance values and yielding 14 virtual bands per image for analysis.
All participants from both the CN/MCI and CN/ADD cohorts underwent HSI using the same imaging setup and protocol, ensuring full direct comparability of extracted HSI texture features across cohorts.
Quality control and regions of interest (ROIs)
Each pre-processed HSI underwent rigorous visual inspection, including evaluation of all 14 spectral bands, a pseudo-RGB reconstruction approximating a color fundus image, and the corresponding vessel segmentation mask generated by a DL model [27]. Images with poor vessel delineation [35], significant motion blur, or illumination artifacts were excluded from further analysis. For analysis of these high-quality images, a 6 mm circular macular grid was applied, corresponding to the diameter of the Early Treatment Diabetic Retinopathy Study (ETDRS) grid [36]. This grid was precisely centered on the fovea, which was manually annotated by an ophthalmologist on a pseudo-RGB HSI reconstruction. The optic disc (OD) center was automatically detected using a DL model [28]. This macular region was then divided into superior and inferior hemispheres using the line connecting the OD center and fovea as the boundary. To ensure consistent ROI sizing despite slight variations in eye position and field of view, the physical distance between the OD center and fovea (~4.5 mm) was mapped to pixel coordinates. These ROIs were then applied uniformly across all 14 spectral channels, after masking out retinal vessels [27].
Feature extraction
From each retinal vessel-masked ROI, two distinct feature sets were extracted for each of the 14 spectral bands:
- Normalized spectral reflectance: To minimize inter-subject variability arising from imaging factors (e.g. illumination differences), relative reflectance values within each ROI were standardized using the mean and standard deviation of the entire image, as described by Lemmens et al. [29]. The mean standardized reflectance value within each ROI was then calculated, yielding a 14-dimensional spectral feature vector.
- GLCM texture features: To quantify retinal tissue organization, five second-order statistical descriptors were derived from the Gray Level Co-occurrence Matrix (GLCM): contrast (CON), dissimilarity (DIS), homogeneity (HOM), energy (ENE), and correlation (COR) [23,37]. Using the “graycomatrix” function from the scikit-image Python package (version 0.23.2), GLCM features were calculated with a pixel-pair distance of 1 (capturing fine-grained local texture), averaged across four orientations (0°, 45°, 90°, and 135°) to ensure rotational invariance, and normalized to allow comparability across ROIs and imaging conditions.
2.2.2. Optical Coherence Tomography (OCT)
Spectral-domain OCT (SPECTRALIS, Heidelberg Engineering) was performed on a single study eye centered on the macula. The Heidelberg Eye Explorer software automatically extracted RNFL and GC-IPL thickness values across the nine-region ETDRS grid. Subsequently, GC-IPL thickness values were used as features, either from all nine regions combined (for the full macular grid) or from subsets corresponding to the HSI grids (e.g., Inner and Outer Inferior regions for the inferior hemisphere analysis).
2.2.3. Color Fundus Photography (CFP)
Disc-centered 30° field-of-view CFP were acquired using the Visucam PRO NM camera (Carl Zeiss Meditec, Germany). In case of multiple CFPs captured on the same day, the highest-quality image was manually selected for the analysis. Following the same protocol as in Fhima et al. [38], the arterioles and venules were segmented from the CFPs using a DL model, after which VBMs were extracted from the segmentation masks using the Python Vasculature BioMarker (PVBM) toolbox [28]. The CRAE and CRVE were calculated using the Knudtson method [39]. For one subject with discontinuous vessel segmentation, VBMs were imputed using the dataset mean.
2.3. Statistical Analysis
Group Comparisons
Differences in retinal features between Aβ− and Aβ+ participants were evaluated using two-sided Mann–Whitney U tests. As this study represents an exploratory biomarker screen aimed at identifying candidate features for classification, group differences were evaluated using unadjusted p-values without correction for multiple comparisons [40]. We recognize that this increases the likelihood of false positive findings (Type I error), and accordingly, all reported p-values should be interpreted as hypothesis-generating rather than confirmatory. Demographic variables (age and sex) were compared between groups using appropriate statistical tests following normality evaluation. For continuous variables (age), independent sample t-tests were used when data followed a normal distribution, otherwise Mann-Whitney U tests were applied. For multiple group comparisons, the Kruskal-Wallis test was used for continuous variables. For categorical variables, chi-square tests were performed for both pairwise and multiple group comparisons. To assess the overall effect of group differences on structural OCT measures (RNFL and GC-IPL), a multivariate analysis of covariance (MANCOVA) was conducted, with age and sex included as covariates, using Wilks' Lambda to test for significance (p < 0.05).
2.4. Repeatability and Reproducibility
To assess the robustness of the his-derived texture features (e.g. GLCM COR at 466 nm) across the defined macular ROIs, intra-visit repeatability and inter-visit reproducibility analyses were performed. For this, we utilized data from participants within the RetAD cohort who had the necessary repeated image acquisitions. Reliability was quantified using the Intraclass Correlation Coefficient (ICC) based on a two-way random-effects model for absolute agreement (ICC(2,1), pingouin Python package). Repeatability, defined as test-retest consistency across longitudinal timepoints (e.g., baseline vs. 6-month follow-up) with identical flash settings, was assessed using 20 unique subject-flash pairs from 14 subjects. Reproducibility, defined as consistency across different flash intensities within a single visit, was assessed using 31 distinct image pairs from 22 subjects. The number of image pairs exceeded the number of individual participants because some individuals contributed multiple eligible data points, for instance at different follow-up visits or with various acquisition settings.
2.5. Biomarker Trajectory Across AD Stages
For exploratory trajectory analysis, the combined cross-sectional cohort was organized into three distinct groups: (1) CN controls, comprising all Aβ− CN individuals from the primary cohort and the CN controls from the additional cohort; (2) early Aβ+ individuals, representing the preclinical (CN) or prodromal (MCI) group from the primary cohort; and (3) AD patients with clinical or biomarker-confirmed ADD from the additional cohort [29]. Comparison of the GLCM COR at 466 nm (full macular grid) were performed across these three groups. Group differences in age and sex were also assessed to evaluate potential confounding effects.
2.6. Classification and Model Evaluation
Logistic regression classifiers were trained to predict Aβ status (Aβ− vs. Aβ+) using various sets of input features, including GLCM COR (466 nm), VBMs, and GC-IPL thickness measures, both individually (unimodal) and in combination (multimodal). To obtain an unbiased performance estimate, model performance was evaluated using a leave-one-subject-out cross-validation (LOOCV) framework. Within each fold, feature scaling (z-score normalization) was applied using only the training set statistics to prevent data leakage. The logistic regression models were trained with L2 regularization, the liblinear solver, a maximum of 1000 iterations, and balanced class weights. Performance metrics included the area under the receiver operating characteristic curve (AUC), accuracy, sensitivity, specificity, precision, and the F1-score. Uncertainty was quantified using 95% confidence intervals for the AUC, estimated via 1000 bootstrap resamples.
3. Results
3.1. Participant Characteristics
The primary CN/MCI cohort consisted of 40 adults with PET-confirmed Aβ status. Seventeen participants were Aβ+, including 10 CN and 7 MCI, representing preclinical and prodromal AD stages [2]. The remaining 23 participants were Aβ− CN controls. There were no significant differences in age or sex (Table 1). Cognitive performance differed primarily in the Aβ+ MCI subgroup, which showed lower MMSE scores and worse performance on memory and language measures (auditory verbal learning test, Boston Naming Test, and animal verbal fluency) compared with CN participants. APOE genotype distributions showed a trend toward differences across subgroups. Additional subject-level demographics and cognitive test scores are provided in Supplementary File 2. Demographic characteristics for the additional ADD cohort have been described previously [29].
3.2. Hyperspectral Imaging Texture by Macular Region and Amyloid Status
The investigation of retinal biochemical alterations linked to amyloid pathology showed that normalized reflectance spectra demonstrated substantial overlap between Aβ− and Aβ+ participants in all regions, providing little discriminatory value. In contrast, texture features revealed a consistently different signal (Supplementary Figure 1). Among the five GLCM descriptors, COR at 466 nm emerged as the most discriminative feature. Aβ+ individuals showed significantly lower COR values, particularly in the inferior macula (p = 0.010) and full macular grid (p = 0.031), while the superior hemisphere did not differ significantly (p = 0.106) (Figure 2). These lower COR values indicate reduced similarity between neighboring pixel intensities and thus more heterogeneous local patterns.
To quantify the diagnostic utility of HSI, logistic regression classifiers were trained using GLCM COR at 466 nm as the input feature for each macular region. The inferior hemisphere model achieved the highest performance (AUC = 0.72), followed by the full macular grid (AUC = 0.69) and the superior hemisphere (AUC = 0.62). Reliability analysis indicated that the full macular grid exhibited the highest intra-visit repeatability (ICC = 0.60), while both the full macular grid and inferior hemisphere had excellent inter-visit reproducibility (ICC = 0.88) (Table 2).
3.3. Hyperspectral Imaging GLCM COR Across the AD Continuum
To examine retinal texture changes with disease progression, we assessed GLCM COR at 466 nm across CN controls (n = 45; 23 from the primary and 22 from the supplemented cohort), early Aβ+ individuals (n = 17), and ADD patients (n = 17). A clear stage-dependent trajectory was observed. Compared with CN controls, individuals in the preclinical/prodromal stage (CN/MCI Aβ+) showed significantly lower COR values (p = 0.015), reflecting increased local tissue heterogeneity. In contrast, COR values in the ADD group rose again, approaching levels observed in controls (CN) and showing no significant differences (p = 0.218) (Figure 3). This non-monotonic pattern suggests that the discriminative value of this feature may be strongest during the earliest stages of AD. Demographic comparisons confirmed that these group differences were unlikely to be explained by age (p = 0.644) or sex (p = 0.428) (Supplementary Table 1).
3.4. Optical Coherence Tomography-Based Thickness Analysis
To investigate whether the spatial pattern of macular neurodegeneration was associated with Aβ status, we performed separate MANCOVA analyses for GC-IPL and RNFL thickness, treating the values from all nine ETDRS regions as distinct outcomes (Table 3). This approach revealed a significant association between the overall GC-IPL thickness profile and Aβ status (p = 0.009), with sex also emerging as a significant factor (p = 0.041). In contrast, the RNFL thickness profile showed no association with Aβ status (p = 0.694), though it was significantly influenced by age (p = 0.024). Notable, when comparing GC-IPL thickness within individual ETDRS regions, no single region yielded statistically significant differences (Supplementary Fig. 2).
To assess the diagnostic value of these OCT structural measures, logistic regression models were constructed using GC-IPL thickness as input features. Model performance varied across retinal regions: inferior macular regions (II, IO) showed markedly higher discriminative ability (AUC = 0.71) compared with superior regions (AUC = 0.45). The model incorporating all nine macular regions achieved the highest overall classification performance overall (AUC = 0.73) (Table 4).
3.5. Color Fundus Photography-Based Vascular Biomarker Analysis
Finally, we assessed whether retinal vascular alterations were associated with amyloid status by extracting a comprehensive set of VBMs (Supplementary Table 2). Of the 24 vascular parameters evaluated, only two showed significant differences between the Aβ+ and Aβ− groups: the Aβ+ group had significantly wider arteriolar diameters (CRAE; p = 0.031) and a greater number of venous endpoints (Endp; p = 0.043). The remaining metrics, including those that measure tortuosity and fractal dimension, were comparable between groups (Supplementary Table 2).
To evaluate the diagnostic utility of these vascular changes, we built logistic regression models using the well-established vessel caliber parameters, CRAE and CRVE respectively (Figure 4) [41]. The significant arteriolar widening observed in the Aβ+ group translated into modest discriminatory power (AUC = 0.66). In contrast, the venular diameter (CRVE), which showed no group difference (p = 0.662), offered no classification value (AUC = 0.48). A model combining both metrics achieved the highest VBM-based performance with an AUC of 0.68 (Table 5).
3.6. Unimodal and Multimodal Retinal Imaging Classification Performance
To assess the synergistic added value of integrating multiple retinal imaging biomarkers, we compared the performance of unimodal and multimodal logistic regression models (Figure 5). The best overall classification performance was achieved by combining HSI-derived texture features (GLCM COR at 466, full macular grid) with GC-IPL thickness across the 9 ETDRS regions, yielding an AUC of 0.84, sensitivity of 0.82, and specificity of 0.78. Adding VBMs to this model did not yield further improvement (AUC = 0.81). Detailed classification results for all feature combinations across macular regions (full macular grid, superior, and inferior) are provided in Supplementary Table 2.
4. Discussion
4.1. Hyperspectral Imaging Texture Reflects Early Amyloid-Related Biochemical Changes
This study provides proof-of-concept evidence that multimodal retinal imaging, integrating HSI texture and OCT-derived GC-IPL thickness, can predict PET-confirmed amyloid status in the preclinical and prodromal stages of AD. This synergy suggests that different imaging modalities capture distinct, complementary aspects of early retinal pathology.
Notably, texture-based HSI features outperformed normalized spectral reflectance in discriminating Aβ status. The increased heterogeneity (lower GLCM COR) observed in Aβ+ individuals, particularly in the inferior macula, points to localized retinal disorganization. Although the full macular grid yielded slightly lower classification performance, it demonstrated higher repeatability over 6-months’ time intervals, indicating a potential trade-off between localized sensitivity and biomarker robustness. While Lemmens et al. [29] found spectral features discriminative in patients with ADD, Hadoux et al. reported that spectral data alone could not distinguish amyloid status, prompting them to apply dimensionality reduction to correct for non-AD related spectral variability [18]. Beyond spectral information, other studies have shown the added value of spatial patterns. The diagnostic potential of our texture-based approach is supported by the work of Sharafi et al. [19], who also found that GLCM texture features could discriminate Aβ status, albeit from perivascular regions. Collectively, these findings reinforce that robust spatial-spectral methods are needed to overcome low interclass discrimination and high intraclass variance inherent to pixel-wise spectral analysis in HSI [42,43].
While some histopathological studies report denser Aβ deposits in peripheral regions such as the superior-temporal and inferior-temporal retina [14,44,45], others have identified Aβ deposits in the central retina, particularly in the perifoveal ganglion cell layer [46]. In practice, however, taking peripheral retinal pictures in a consistent and reproducible way is more challenging than central retinal pictures, particularly in elderly individuals and patients with cognitive impairment, making central pictures a more attractive and feasible option. Aβ depositions has also been observed along retinal vasculature [47,48], raising the possibility that perivascular pathology may also contribute to our texture signal. GLCM COR quantifies the correlation between the gray levels of neighboring pixels in the co-occurrence matrix, with higher values indicating more similarity and lower values reflecting greater variability. Lower GLCM COR at 466 nm in Aβ+ participants indicates greater tissue heterogeneity and local disorganization. This finding is consistent with ex vivo work by Zaletel et al. [49], who reported that dense-core amyloid plaques in AD brain tissue exhibit lower GLCM COR values than diffuse plaques in non-AD tissue.
The most discriminative HSI-derived texture feature occurred at 466 nm in both the full macular grid and the inferior hemisphere, which corresponds to the shortest wavelength captured by our snapshot camera (Supplementary Figure S1). This finding aligns with prior literature linking Aβ accumulation to increased light scattering and altered reflectance in the blue-light spectrum. Vince and More reported reduced short-wavelength intensities (480–560 nm) in transgenic AD mice months before plaque formation, attributing this to Rayleigh scattering by sub-wavelength soluble Aβ [15]. Rayleigh scattering is more pronounced at shorter wavelengths, making this region particularly sensitive to small-scale tissue alterations, such as Aβ deposition, which can lead to localized changes in reflectance. Subsequent in vivo and clinical studies similarly identified strongest spectral deviations below 500 nm [16,17,50,51], while Hadoux et al. found the most discriminative bands below 565 nm [18]. Sharafi et al. extended these insights to spatial texture features, finding that the strongest group differences in retinal GLCM metrics emerged in the 450–550 nm range [19], further supporting 466 nm as a particularly informative wavelength for Aβ-related tissue disorganization.
Other pathological processes including deposition of phosphorylated tau, early neurodegeneration, or inflammatory responses may underlie the observed texture changes [44,52,53]. Phosphorylated tau has been detected in post-mortem retinas of AD patients [54,55], with recent evidence showing distinct light scattering signatures for both Aβ and tau [56]. Importantly, the presence of retinal Aβ remains contested: while many studies confirm its presence, others report negative findings [57,58,59]. Future research should validate these texture features against histopathology to determine their pathological specificity, clarify regional differences, and support the development of anatomically targeted imaging strategies.
4.1.1. Non-Monotonic Biomarker Dynamics Across the AD Continuum
Our exploratory analysis suggested that HSI-based retinal texture features may follow a non-monotonic, U-shaped trajectory across the AD continuum. This pattern is consistent with findings from More et al., who reported the largest spectral deviation from control subjects at the MCI stage (MMSE ⩾22), with the discriminative signal progressively weakening in more advanced dementia [16]. They attributed this peak sensitivity in early disease to small, soluble Aβ oligomers that are potent sources of Rayleigh scattering, while later stages feature larger and fibrillar Aβ. The initial decrease in GLCM COR in our cohort might thus reflect the increased local texture variation from this peak scattering effect, while we speculate the subsequent rise in the ADD group represents a more optically uniform texture resulting from the shift to fibrillar Aβ.
While this hypothesis provides a compelling biological rationale, our findings should be considered mainly exploratory. The analysis combined two cross-sectional cohorts with modest sample sizes, highlighting the need for validation in larger, longitudinal studies. Furthermore, while the imaging protocol was consistent, the potential influence of subtle confounders, such as variations in acquisition settings or noise on texture metrics, cannot be fully excluded. Our results contrast with those of Jin et al., who analyzed texture features within retinal layers (GC-IPL, OPL, OS, RPE) using cross-sectional (B-scan) OCT and reported a monotonic decline in GLCM COR features from CN to MCI to AD [23]. This divergence may reflect the differences in what both different imaging modalities and different imaging planes (en face and cross-sectional) capture. Our en face HSI provides a planar projection map that appears sensitive to the biochemical Aβ changes. In contrast, cross-sectional (B-scan) OCT yields high-resolution, depth-resolved measurements within isolated layers, which may probe a different facet of pathology and therefore produce a different trend.
These stage-specific patterns across the AD continuum have important implications. Models trained at one disease stage may not generalize to others. Future work should therefore develop stage-specific algorithms and prioritize longitudinal cohorts to map the full evolution of retinal biomarkers across the AD continuum.
4.2. Macular GC-IPL Measures Suggest Retinal Neurodegenerative Changes
Our structural analysis with OCT complements our biochemical findings, identifying the macular GC-IPL, rather than the macular RNFL, as the primary site of amyloid-related thickness changes. This reinforces previous findings that the macular GC-IPL is a more sensitive marker for AD-related pathology, likely due to its high ganglion cell density and lower inter-individual variability [22]. Consistent with this, macular thinning has been reported in cognitively unimpaired individuals with risk factors for AD (e.g. APOE ε4, family history) [60]. Moreover, GC-IPL thinning (but not RNFL) has been associated with higher pTau burden [61] and thinner GC-IPL at baseline carries an increased risk in cognitive decline [62].
At the same time, evidence from Jali et al. highlights a different challenge: although they observed progressive GC-IPL (p < 0.001) and RNFL (p = 0.030) thinning across the continuum from normal cognition to dementia, average GC-IPL (AUC = 0.60) and RNFL (AUC = 0.56) measures showed limited discriminatory utility for distinguishing normal or mildly cognitively impaired individuals from those with more advanced disease stages [63]. This limited utility may stem from non-uniform retinal thickness changes in AD, as studies have shown dynamic patterns with GC-IPL and RNFL thickening occurring alongside thinning, possibly reflecting glial hyperplasia in early disease stages [64,65]. This variability underscores the limitations of relying solely on average thickness measures for early AD screening, as subtle yet clinically relevant changes might be missed. In our cohort, using all nine GC-IPL regions as input features achieved the strongest OCT-based classification performance (AUC = 0.73). By contrast, a model using a single global GC-IPL thickness feature, using the mean of those same nine sectors, resulted in classification performance around chance level (AUC = 0.45), suggesting that spatial heterogeneity provides discriminative signal that is lost when averaging across larger areas.
Interestingly, we observed regional asymmetry in discriminative power. The inferior ETDRS regions (II and IO) yielded an AUC of 0.71, while the superior regions (SI and SO) performed poorly (AUC = 0.45). This spatial bias mirrored our HSI findings, with both modalities converging on an “inferior vulnerability zone”, where inferior regions consistently showed stronger group differences. These patterns resemble those seen in glaucoma, suggesting a potential shared regional susceptibility across glaucoma and AD [66,67].
In our cohort, age was significantly associated with macular RNFL but not GC-IPL thickness, while sex was significantly associated with GC-IPL but not RNFL. This pattern is somewhat unexpected, as previous studies generally report both age- and sex-related differences across several macular layers [68,69]. Overall, the literature indicates that macular thickness measures are influenced by demographic factors, underscoring the importance of adjusting for these confounders. The divergent associations we observed may therefore reflect cohort-specific variations, such as a narrow age range and our modest sample size, rather than a true biological absence of effects.
Beyond thickness, OCT images can also be analyzed using texture metrics. In a recent study, OCT-based GLCM features outperformed average thickness measures in distinguishing AD and MCI from controls (AUC = 0.935 CN/AD; AUC = 0.830 CN/MCI vs. 0.795 and 0.705, respectively) [23]. Furthermore, emerging DL models that process full GC-IPL or RNFL thickness maps directly, rather than relying on handcrafted features, have shown promising results in AD and MCI classification [70]. Despite promising performance, the lack of large, publicly available OCT datasets remains a major limitation for DL, with most studies based on small, private cohorts collected across heterogeneous clinical settings [71].
4.3. Wider Arteriolar Diameters Indicate Early Vascular Involvement
Our comprehensive analysis of 24 VBMs revealed that most were not associated with amyloid status, with the notable exception of wider retinal arterioles (CRAE) in the Aβ+ group. When used as a combined input, CRAE and CRVE yielded modest classification performance. Our results align with Sharafi et al. [19], who also reported wider arteriolar diameters in Aβ+ subjects, suggesting early vascular changes may accompany biochemical and structural alteration. Conversely, a meta-analysis pooling results from four studies reported no significant association between CRAE or CRVE and cognitive impairment [72]. The analysis revealed substantial heterogeneity between studies (I² = 93%), pointing to possible differences in study design, disease stage, imaging protocols, and vascular measurement techniques as contributing factors. Further nuance comes from research investigating both OCT angiography (OCTA) and dynamic vessel analysis (DVA) in MCI and ADD subjects. Whereas no significant structural vessel changes were observed, impaired vascular reactivity to flicker stimulation was detected in individuals with MCI, suggesting that functional alterations may precede morphological changes in retinal vessels [73]. Functional vascular imaging, such as DVA, may offer greater sensitivity to early AD-related changes and should be explored further. In this context, we are currently collecting DVA data in the ongoing RetAD trial, which will be analyzed in future work to further elucidate early functional vascular alterations in AD.
4.4. Multimodal Retinal Imaging Maps onto the ATV(N) Framework
The AT(N) framework classifies AD biomarkers by the pathological processes they measure: Aβ deposition (A), pathologic tau (T), and neurodegeneration (N) [74]. Our results indicate that HSI may reflect biochemical changes related to amyloid (A), while others have found HSI scattering signatures specific to tau (T) [56]. OCT thickness measures, in turn, are indicative of neurodegeneration (N), highlighting how each retinal imaging modality targets a distinct facet of AD pathology.
Although adding VBMs to the multimodal model did not further improve classification performance in this cohort, these findings are hypothesis-generating and suggest that retinal vascular alterations may still warrant further investigation in larger studies. Notably, the 2024 revised criteria for AD diagnosis and staging expanded the classic AT(N) framework to include vascular brain injury (V) as a marker of non-AD co-pathology [2]. Supporting this, Chun et al. showed that vascular burden, defined by severe white matter hyperintensities, significantly accelerates cognitive decline, particularly in individuals with early Alzheimer’s pathological changes (A+T−) [75]. Such evidence underscores the value of VBMs as potential early indicators of risk [76]. Within this context, our multimodal approach provides a strong biological rationale for integrating complementary retinal imaging modalities, offering a more comprehensive view of retinal involvement in AD and improving the specificity of screening strategies [74,75].
4.5. Strengths and Limitations
A key strength is the use of a well-characterized cohort in the earliest preclinical and prodromal stages of AD, where scalable screening tools are most needed. Critically, amyloid PET imaging served as the gold-standard reference for AD pathology, enhancing the diagnostic validity of the outcome labels. Moreover, the use of a snapshot HSI camera allows for rapid imaging acquisition, reducing potential motion artifacts and screening time [33].
The primary limitation is the modest sample size, which increases the risk of overfitting and is reflected in the wide AUC confidence intervals. Therefore, our findings require external validation in larger cohorts to confirm their generalizability. Furthermore, as our study excluded individuals with other neurodegenerative or common retinal diseases (e.g. Parkinson’s disease or glaucoma), the specificity of these biomarkers remains untested. Future research should test whether the observed retinal changes are specific to AD or also present in other conditions, which is critical for clinical translation.
5. Conclusions
Multimodal retinal imaging, combining HSI-derived texture features and OCT-based structural measurements, shows promise as a non-invasive screening tool for early-stage AD. Integrating complementary biomarkers improved diagnostic accuracy, potentially capturing distinct aspects of AD pathophysiology. However, confirming the robustness and specificity of these findings will require validation in larger, longitudinal cohorts that include other neurodegenerative and ocular diseases. Upon such validation, this approach could become a scalable and cost-effective tool for population screening and clinical trial enrichment, leveraging existing ophthalmic infrastructure.
Supplementary Materials
The following supporting information can be downloaded at the website of this paper posted on Preprints.org. File S1: Supplementary Figure S1: HSI spectral reflectance and GLCM COR across macular regions by amyloid status; Supplementary Figure S2: GC-IPL thickness by ETDRS region and amyloid status; Supplementary Table S1: demographics of the combined cohorts; Supplementary Table S2: retinal vascular biomarker summary; Supplementary Table S3: classification performance for all unimodal and multimodal feature sets. File S2: Excel file with detailed demographic information and cognitive scores per subject.
Author Contributions
Conceptualization, I.S., R.V., S.L., J.V.E., W.C., J.C., M.V., K.V.K., M.D.V. and E.C.; data curation, T.V.C., G.V., K.V.L. and J.S.; formal analysis, M.G., E.C., A.G. and M.D.V.; investigation, I.S., M.D.V., M.G., L.B., A.G., T.J., J.V.E., E.C., Z.W., L.D.G. and Y.D.G.; writing—original draft preparation, M.G.; supervision, I.S. and M.D.V.; writing—review and editing, all authors. All authors have read and agreed to the published version of the manuscript.
Funding
E.C. is supported by funding from the Research Foundation Flanders (FWO; grant 12ZZM23N). Y.D.G. and L.D.G. are supported by the Research Foundation Flanders (FWO) (PhD fellowship 1SHC824N), Stichting Alzheimer Onderzoek (2020/0032, 2021/0036), and the EU Joint Programme–Neurodegenerative Disease Research (FWO-ERANET S007721N). M.V. is supported by the Research Foundation Flanders (FWO) grant G0C0319N, KU Leuven Fund C24/18/095, and the Sequoia Fund for Research on Ageing and Mental Health. G.V. is supported by a Research Foundation Flanders (FWO) junior postdoctoral fellowship (1292326N). J.S. is supported by an FWO senior postdoctoral fellowship (12Y1623N). Data collection was supported by an FWO grant (G093218N) and KU Leuven internal C2 funding (C24-17-063).
Institutional Review Board Statement
The study was conducted in accordance with the Declaration of Helsinki (2013), the ICH Good Clinical Practice (GCP) guidelines, and the European Union Directive on Clinical Trials (2001/20/EC), and was approved by the Ethics Committee of University Hospitals Leuven (protocol code S60932).
Informed Consent Statement
Informed consent was obtained from all subjects involved in the study. Written informed consent has been obtained from the participant to publish the anonymized retinal images included in Figure 1.
Data Availability Statement
The datasets analyzed during the current study are available from the corresponding author on reasonable request. The code used for statistical analysis and classification will be made publicly available in an online repository upon publication.
Acknowledgments
The authors thank Sarah Spileers and Lies Prové for their assistance with data collection. During the preparation of this manuscript, the authors used ChatGPT for the purpose of language editing (e.g., improving clarity and correcting grammar). The authors have reviewed and edited the output and take full responsibility for the content of this publication.
Conflicts of Interest
I.S. has received honoraria/consulting fees from AbbVie, Alcon, Bausch & Lomb, Omikron, Santen, and Théa; has received grant/research support from AbbVie, Bausch & Lomb, Heidelberg, and Santen; has participated in clinical trials with Bausch & Lomb, Omikron, Théa, and Santen; and holds investments (stock options, etc.) in Mona. The remaining authors declare no conflicts of interest. The funders had no role in the design of the study; in the collection, analyses, or interpretation of data; in the writing of the manuscript; or in the decision to publish the results.
References
- Nichols, E.; Steinmetz, J.D.; Vollset, S.E.; Fukutaki, K.; Chalek, J.; Abd-Allah, F.; Abdoli, A.; Abualhasan, A.; Abu-Gharbieh, E.; Akram, T.T.; et al. Estimation of the Global Prevalence of Dementia in 2019 and Forecasted Prevalence in 2050: An Analysis for the Global Burden of Disease Study 2019. Lancet Public Health 2022, 7, e105–e125. [Google Scholar] [CrossRef] [PubMed]
- Jack, C.R., Jr.; Andrews, J.S.; Beach, T.G.; Buracchio, T.; Dunn, B.; Graf, A.; Hansson, O.; Ho, C.; Jagust, W.; McDade, E.; et al. Revised Criteria for Diagnosis and Staging of Alzheimer’s Disease: Alzheimer’s Association Workgroup. Alzheimers Dement. 2024, 20, 5143–5169. [Google Scholar] [CrossRef] [PubMed]
- Greenberg, S.M.; Bacskai, B.J.; Hernandez-Guillamon, M.; Pruzin, J.; Sperling, R.; van Veluw, S.J. Cerebral Amyloid Angiopathy and Alzheimer Disease—One Peptide, Two Pathways. Nat. Rev. Neurol. 2020, 16, 30–42. [Google Scholar] [CrossRef] [PubMed]
- Gustavsson, A.; Norton, N.; Fast, T.; Frölich, L.; Georges, J.; Holzapfel, D.; Kirabali, T.; Krolak-Salmon, P.; Rossini, P.M.; Ferretti, M.T.; et al. Global Estimates on the Number of Persons Across the Alzheimer’s Disease Continuum. Alzheimers Dement. 2023, 19, 658–670. [Google Scholar] [CrossRef] [PubMed]
- van Dyck, C.H.; Swanson, C.J.; Aisen, P.; Bateman, R.J.; Chen, C.; Gee, M.; Kanekiyo, M.; Li, D.; Reyderman, L.; Cohen, S.; et al. Lecanemab in Early Alzheimer’s Disease. N. Engl. J. Med. 2023, 388, 9–21. [Google Scholar] [CrossRef] [PubMed]
- Livingston, G.; Huntley, J.; Liu, K.Y.; Costafreda, S.G.; Selbæk, G.; Alladi, S.; Ames, D.; Banerjee, S.; Burns, A.; Brayne, C.; et al. Dementia Prevention, Intervention, and Care: 2024 Report of the Lancet Standing Commission. Lancet 2024, 404, 572–628. [Google Scholar] [CrossRef] [PubMed]
- Cummings, J.L.; Zhou, Y.; Lee, G.; Zhong, K.; Fonseca, J.; Leisgang-Osse, A.M.; Cheng, F. Alzheimer’s Disease Drug Development Pipeline: 2025. Alzheimers Dement. Transl. Res. Clin. Interv. 2025, 11, e70098. [Google Scholar] [CrossRef] [PubMed]
- Bilgel, M.; An, Y.; Walker, K.A.; Moghekar, A.R.; Ashton, N.J.; Kac, P.R.; Karikari, T.K.; Blennow, K.; Zetterberg, H.; Jedynak, B.M.; et al. Longitudinal Changes in Alzheimer’s-Related Plasma Biomarkers and Brain Amyloid. Alzheimers Dement. 2023, 19, 4335–4345. [Google Scholar] [CrossRef] [PubMed]
- Palmqvist, S.; Zetterberg, H.; Mattsson, N.; Johansson, P.; Minthon, L.; Blennow, K.; Olsson, M.; Hansson, O.; et al. Detailed Comparison of Amyloid PET and CSF Biomarkers for Identifying Early Alzheimer Disease. Neurology 2015, 85, 1240–1249. [Google Scholar] [CrossRef] [PubMed]
- Cummings, J.; Aisen, P.S.; DuBois, B.; Frölich, L.; Jack, C.R.; Jones, R.W.; Morris, J.C.; Raskin, J.; Dowsett, S.A.; Scheltens, P. Drug Development in Alzheimer’s Disease: The Path to 2025. Alzheimers Res. Ther. 2016, 8, 39. [Google Scholar] [CrossRef] [PubMed]
- Hansson, O.; Blennow, K.; Zetterberg, H.; Dage, J. Blood Biomarkers for Alzheimer’s Disease in Clinical Practice and Trials. Nat. Aging 2023, 3, 506–519. [Google Scholar] [CrossRef] [PubMed]
- London, A.; Benhar, I.; Schwartz, M. The Retina as a Window to the Brain—From Eye Research to CNS Disorders. Nat. Rev. Neurol. 2013, 9, 44–53. [Google Scholar] [CrossRef] [PubMed]
- Christinaki, E.; Kulenovic, H.; Hadoux, X.; Baldassini, N.; Van Eijgen, J.; De Groef, L.; Stalmans, I.; van Wijngaarden, P. Retinal Imaging Biomarkers of Neurodegenerative Diseases. Clin. Exp. Optom. 2022, 105, 194–204. [Google Scholar] [CrossRef] [PubMed]
- Gaire, B.P.; Koronyo, Y.; Fuchs, D.-T.; Shi, H.; Rentsendorj, A.; Danziger, R.; Vit, J.-P.; Mirzaei, N.; Doustar, J.; Sheyn, J.; et al. Alzheimer’s Disease Pathophysiology in the Retina. Prog. Retin. Eye Res. 2024, 101, 101273. [Google Scholar] [CrossRef] [PubMed]
- More, S.S.; Vince, R. Hyperspectral Imaging Signatures Detect Amyloidopathy in Alzheimer’s Mouse Retina Well Before Onset of Cognitive Decline. ACS Chem. Neurosci. 2015, 6, 306–315. [Google Scholar] [CrossRef] [PubMed]
- More, S.S.; Beach, J.M.; McClelland, C.; Mokhtarzadeh, A.; Vince, R. In Vivo Assessment of Retinal Biomarkers by Hyperspectral Imaging: Early Detection of Alzheimer’s Disease. ACS Chem. Neurosci. 2019, 10, 4492–4501. [Google Scholar] [CrossRef] [PubMed]
- Vandenabeele, M.; Veys, L.; Lemmens, S.; Hadoux, X.; Gelders, G.; Masin, L.; Serneels, L.; Theunis, J.; Saito, T.; Saido, T.C.; et al. The AppNL-G-F Mouse Retina Is a Site for Preclinical Alzheimer’s Disease Diagnosis and Research. Acta Neuropathol. Commun. 2021, 9, 6. [Google Scholar] [CrossRef] [PubMed]
- Hadoux, X.; Hui, F.; Lim, J.K.H.; Masters, C.L.; Pébay, A.; Chevalier, S.; Ha, J.; Loi, S.; Fowler, C.J.; Rowe, C.; et al. Non-Invasive In Vivo Hyperspectral Imaging of the Retina for Potential Biomarker Use in Alzheimer’s Disease. Nat. Commun. 2019, 10, 4227. [Google Scholar] [CrossRef] [PubMed]
- Sharafi, S.M.; Sylvestre, J.-P.; Chevrefils, C.; Soucy, J.-P.; Beaulieu, S.; Pascoal, T.A.; Arbour, J.D.; Rhéaume, M.-A.; Robillard, A.; Chayer, C.; et al. Vascular Retinal Biomarkers Improves the Detection of the Likely Cerebral Amyloid Status from Hyperspectral Retinal Images. Alzheimers Dement. Transl. Res. Clin. Interv. 2019, 5, 610–617. [Google Scholar] [CrossRef] [PubMed]
- Byun, M.S.; Park, S.W.; Lee, J.H.; Yi, D.; Jeon, S.Y.; Choi, H.J.; Joung, H.; Ghim, U.H.; Park, U.C.; Kim, Y.K.; et al. Association of Retinal Changes with Alzheimer Disease Neuroimaging Biomarkers in Cognitively Normal Individuals. JAMA Ophthalmol. 2021, 139, 548–556. [Google Scholar] [CrossRef] [PubMed]
- Almeida, A.L.M.; Pires, L.A.; Figueiredo, E.A.; Costa-Cunha, L.V.F.; Zacharias, L.C.; Preti, R.C.; Monteiro, M.L.R.; Cunha, L.P. Correlation Between Cognitive Impairment and Retinal Neural Loss Assessed by Swept-Source Optical Coherence Tomography in Patients with Mild Cognitive Impairment. Alzheimers Dement. (Amst) 2019, 11, 659–669. [Google Scholar] [CrossRef] [PubMed]
- Chan, V.T.T.; Sun, Z.; Tang, S.; Chen, L.J.; Wong, A.; Tham, C.C.; Wong, T.Y.; Chen, C.; Ikram, M.K.; Whitson, H.E.; et al. Spectral-Domain OCT Measurements in Alzheimer’s Disease: A Systematic Review and Meta-Analysis. Ophthalmology 2019, 126, 497–510. [Google Scholar] [CrossRef] [PubMed]
- Jin, Z.; Wang, X.; Lang, Y.; Song, Y.; Zhan, H.; Shama, W.; Shen, Y.; Zeng, G.; Zhou, F.; Gao, H.; et al. Retinal Optical Coherence Tomography Intensity Spatial Correlation Features as New Biomarkers for Confirmed Alzheimer’s Disease. Alzheimers Res. Ther. 2025, 17, 33. [Google Scholar] [CrossRef] [PubMed]
- Liu, Y.-L.; Hsieh, Y.-T.; Chen, T.-F.; Chiou, J.-M.; Tsai, M.-K.; Chen, J.-H.; Chen, Y.-C. Retinal Ganglion Cell–Inner Plexiform Layer Thickness Is Nonlinearly Associated with Cognitive Impairment in the Community-Dwelling Elderly. Alzheimers Dement. (Amst) 2018, 11, 19–27. [Google Scholar] [CrossRef] [PubMed]
- Rebouças, S.C.L.; Cougnard-Gregoire, A.; Arnould, L.; Delyfer, M.-N.; Schweitzer, C.; Korobelnik, J.-F.; Foubert-Samier, A.; Cheung, C.Y.; Wong, T.Y.; Delcourt, C.; et al. Retinal Microvasculature and Incident Dementia over 10 Years: The Three-City-Alienor Cohort. Alzheimers Dement. (Amst) 2023, 15, e12480. [Google Scholar] [CrossRef] [PubMed]
- Bahr, T.; Vu, T.A.; Tuttle, J.J.; Iezzi, R. Deep Learning and Machine Learning Algorithms for Retinal Image Analysis in Neurodegenerative Disease: Systematic Review of Datasets and Models. Transl. Vis. Sci. Technol. 2024, 13, 16. [Google Scholar] [CrossRef] [PubMed]
- Fhima, J.; Van Eijgen, J.; Billen Moulin-Romsée, M.I.; Brackenier, H.; Kulenovic, H.; Debeuf, V.; Vangilbergen, M.; Freiman, M.; Stalmans, I.; Behar, J.A. LUNet: Deep Learning for the Segmentation of Arterioles and Venules in High Resolution Fundus Images. Physiol. Meas. 2024, 45, 055002. [Google Scholar] [CrossRef] [PubMed]
- Fhima, J.; Van Eijgen, J.; Stalmans, I.; Men, Y.; Freiman, M.; Behar, J.A. PVBM: A Python Vasculature Biomarker Toolbox Based on Retinal Blood Vessel Segmentation. In Computer Vision – ECCV 2022 Workshops; Karlinsky, L., Michaeli, T., Nishino, K., Eds.; Springer Nature Switzerland: Cham, Switzerland, 2023; pp. 296–312. [Google Scholar] [CrossRef]
- Lemmens, S.; Van Craenendonck, T.; Van Eijgen, J.; De Groef, L.; Bruffaerts, R.; Andrade de Jesus, D.; Charle, W.; Jayapala, M.; Sunaric-Mégevand, G.; Standaert, A.; et al. Combination of Snapshot Hyperspectral Retinal Imaging and Optical Coherence Tomography to Identify Alzheimer’s Disease Patients. Alzheimers Res. Ther. 2020, 12, 144. [Google Scholar] [CrossRef] [PubMed]
- Schaeverbeke, J.M.; Gabel, S.; Meersmans, K.; Luckett, E.S.; De Meyer, S.; Adamczuk, K.; Nelissen, N.; Goovaerts, V.; Radwan, A.; Sunaert, S.; et al. Baseline Cognition Is the Best Predictor of 4-Year Cognitive Change in Cognitively Intact Older Adults. Alzheimers Res. Ther. 2021, 13, 75. [Google Scholar] [CrossRef] [PubMed]
- Klunk, W.E.; Koeppe, R.A.; Price, J.C.; Benzinger, T.L.; Devous, M.D., Sr.; Jagust, W.J.; Johnson, K.A.; Mathis, C.A.; Minhas, D.; Pontecorvo, M.J.; et al. The Centiloid Project: Standardizing Quantitative Amyloid Plaque Estimation by PET. Alzheimers Dement. 2015, 11, 1–15.e4. [Google Scholar] [CrossRef] [PubMed]
- Lambrechts, A.; Gonzalez, P.; Geelen, B.; Soussan, P.; Tack, K.; Jayapala, M. A CMOS-Compatible, Integrated Approach to Hyper- and Multispectral Imaging. In Proceedings of the 2014 IEEE International Electron Devices Meeting (IEDM), San Francisco, CA, USA, 15–17 December 2014; pp. 10.5.1–10.5.4. [Google Scholar] [CrossRef]
- Geelen, B.; Tack, N.; Lambrechts, A. A Compact Snapshot Multispectral Imager with a Monolithically Integrated Per-Pixel Filter Mosaic. In Advanced Fabrication Technologies for Micro/Nano Optics and Photonics VII; von Freymann, G., Schoenfeld, W.V., Rumpf, R.C., Eds.; SPIE: Bellingham, WA, USA, 2014; Volume 8974, pp. 80–87. [Google Scholar] [CrossRef]
- Pichette, J.; Goossens, T.; Vunckx, K.; Lambrechts, A. Hyperspectral Calibration Method for CMOS-Based Hyperspectral Sensors. In Photonic Instrumentation Engineering IV; Soskind, Y.G., Olson, C., Eds.; SPIE: Bellingham, WA, USA, 2017; pp. 132–144. [Google Scholar] [CrossRef]
- Giancardo, L.; Meriaudeau, F.; Karnowski, T.P.; Chaum, E.; Tobin, K. Quality Assessment of Retinal Fundus Images Using Elliptical Local Vessel Density. In New Developments in Biomedical Engineering; Campolo, D., Ed.; IntechOpen: Rijeka, Croatia, 2010; pp. 169–190. [Google Scholar] [CrossRef] [PubMed]
- Early Treatment Diabetic Retinopathy Study Design and Baseline Patient Characteristics: ETDRS Report Number 7. Ophthalmology 1991, 98, 741–756. [CrossRef] [PubMed]
- Haralick, R.M.; Shanmugam, K.; Dinstein, I. Textural Features for Image Classification. IEEE Trans. Syst. Man. Cybern. 1973, SMC-3, 610–621. [Google Scholar] [CrossRef]
- Fhima, J.; Van Eijgen, J.; Reiner-Benaim, A.; Beeckmans, L.; Abramovich, O.; Stalmans, I.; Behar, J.A. Computerized Analysis of the Eye Vasculature in a Mass Dataset of Digital Fundus Images: The Example of Age, Sex, and Primary Open-Angle Glaucoma. Ophthalmol. Sci. 2025, 5, 100778. [Google Scholar] [CrossRef] [PubMed]
- Knudtson, M.D.; Lee, K.E.; Hubbard, L.D.; Wong, T.Y.; Klein, R.; Klein, B.E.K. Revised Formulas for Summarizing Retinal Vessel Diameters. Curr. Eye Res. 2003, 27, 143–149. [Google Scholar] [CrossRef] [PubMed]
- Bender, R.; Lange, S. Adjusting for Multiple Testing—When and How? J. Clin. Epidemiol. 2001, 54, 343–349. [Google Scholar] [CrossRef] [PubMed]
- Lee, S.J.V.; Goh, Y.Q.; Rojas-Carabali, W.; Cifuentes-González, C.; Cheung, C.Y.; Arora, A.; de-la-Torre, A.; Gupta, V.; Agrawal, R. Association Between Retinal Vessels Caliber and Systemic Health: A Comprehensive Review. Surv. Ophthalmol. 2025, 70, 184–199. [Google Scholar] [CrossRef] [PubMed]
- Kumar, B.; Dikshit, O.; Gupta, A.; Singh, M.K. Feature Extraction for Hyperspectral Image Classification: A Review. Int. J. Remote Sens. 2020, 41, 6248–6287. [Google Scholar] [CrossRef]
- He, L.; Li, J.; Liu, C.; Li, S. Recent Advances on Spectral–Spatial Hyperspectral Image Classification: An Overview and New Guidelines. IEEE Trans. Geosci. Remote Sens. 2018, 56, 1579–1597. [Google Scholar] [CrossRef]
- Koronyo, Y.; Rentsendorj, A.; Mirzaei, N.; Regis, G.C.; Sheyn, J.; Shi, H.; Barron, E.; Cook-Wiens, G.; Rodriguez, A.R.; Medeiros, R.; et al. Retinal Pathological Features and Proteome Signatures of Alzheimer’s Disease. Acta Neuropathol. 2023, 145, 409–438. [Google Scholar] [CrossRef] [PubMed]
- Koronyo, Y.; Biggs, D.; Barron, E.; Boyer, D.S.; Pearlman, J.A.; Au, W.J.; Kile, S.J.; Blanco, A.; Fuchs, D.T.; Ashfaq, A.; et al. Retinal Amyloid Pathology and Proof-of-Concept Imaging Trial in Alzheimer’s Disease. JCI Insight 2017, 2, e93621. [Google Scholar] [CrossRef] [PubMed]
- Lee, S.; Jiang, K.; McIlmoyle, B.; To, E.; Xu, Q.; Hirsch-Reinshagen, V.; Mackenzie, I.R.; Hsiung, G.Y.R.; Eadie, B.D.; Sarunic, M.V.; et al. Amyloid Beta Immunoreactivity in the Retinal Ganglion Cell Layer of the Alzheimer’s Eye. Front. Neurosci. 2020, 14, 758. [Google Scholar] [CrossRef] [PubMed]
- Gonzales, M.; Fuchs, D.T.; Doustar, J.; Koronyo, Y.; Sherman, D.S.; Lyden, P.D.; Sicotte, N.L.; Black, K.L.; Kremen, S.; Dumitrascu, O.M.; et al. Integrated Analysis of In Vivo Retinal Perivascular Amyloid Imaging and Cognition. Alzheimers Dement. 2025, 21, e70366. [Google Scholar] [CrossRef] [PubMed]
- Dumitrascu, O.M.; Doustar, J.; Fuchs, D.T.; Koronyo, Y.; Sherman, D.S.; Miller, M.S.; Johnson, K.O.; Carare, R.O.; Verdooner, S.R.; Lyden, P.D.; et al. Retinal Peri-Arteriolar Versus Peri-Venular Amyloidosis, Hippocampal Atrophy, and Cognitive Impairment: Exploratory Trial. Acta Neuropathol. Commun. 2024, 12, 109. [Google Scholar] [CrossRef] [PubMed]
- Zaletel, I.; Milutinović, K.; Bajčetić, M.; Nowakowski, R.S. Differentiation of Amyloid Plaques Between Alzheimer’s Disease and Non-Alzheimer’s Disease Individuals Based on Gray-Level Co-Occurrence Matrix Texture Analysis. Microsc. Microanal. 2021, 27, 1146–1153. [Google Scholar] [CrossRef] [PubMed]
- More, S.S.; Beach, J.M.; Vince, R. Early Detection of Amyloidopathy in Alzheimer’s Mice by Hyperspectral Endoscopy. Investig. Ophthalmol. Vis. Sci. 2016, 57, 3231–3238. [Google Scholar] [CrossRef] [PubMed]
- Oba, R.; Ujike, N.; Ono, Y.; Okano, T.; Murakami, T. Label-Free Autofluorescence and Hyperspectral Imaging of Cerebral Amyloid-β Lesions in Aged Squirrel Monkeys. J. Vet. Diagn. Investig. 2024, 36, 41–45. [Google Scholar] [CrossRef] [PubMed]
- Gaire, B.P.; Koronyo, Y.; Fuchs, D.-T.; Shi, H.; Rentsendorj, A.; Danziger, R.; Vit, J.-P.; Mirzaei, N.; Doustar, J.; Sheyn, J.; et al. Alzheimer’s Disease Pathophysiology in the Retina. Prog. Retin. Eye Res. 2024, 101, 101273. [Google Scholar] [CrossRef] [PubMed]
- Salajková, Z.; Barolo, L.; Baiocco, P.; Ruzicka, B.; Mura, F.; Di Lorenzo, F.; Boffi, A.; Ricco, V.; Ruocco, G.; Leonetti, M. Optical Signature of Retinal Tau Fibrillation. Sci. Rep. 2025, 15, 7792. [Google Scholar] [CrossRef] [PubMed]
- Davis, M.R.; Robinson, E.; Koronyo, Y.; Salobrar-Garcia, E.; Rentsendorj, A.; Gaire, B.P.; Mirzaei, N.; Kayed, R.; Sadun, A.A.; Ljubimov, A.V.; et al. Retinal Ganglion Cell Vulnerability to Pathogenic Tau in Alzheimer’s Disease. Acta Neuropathol. Commun. 2025, 13, 31. [Google Scholar] [CrossRef] [PubMed]
- Walkiewicz, G.; Ronisz, A.; Van Ginderdeuren, R.; Lemmens, S.; Bouwman, F.H.; Hoozemans, J.J.M.; Morrema, T.H.J.; Rozemuller, A.J.; Hart de Ruyter, F.J.; De Groef, L.; et al. Primary Retinal Tauopathy: A Tauopathy with a Distinct Molecular Pattern. Alzheimers Dement. 2024, 20, 330–340. [Google Scholar] [CrossRef] [PubMed]
- Du, X.; Koronyo, Y.; Mirzaei, N.; Yang, C.; Fuchs, D.T.; Black, K.L.; Koronyo-Hamaoui, M.; Gao, L. Label-Free Hyperspectral Imaging and Deep-Learning Prediction of Retinal Amyloid β-Protein and Phosphorylated Tau. PNAS Nexus 2022, 1, pgac164. [Google Scholar] [CrossRef] [PubMed]
- Williams, E.A.; McGuone, D.; Frosch, M.P.; Hyman, B.T.; Laver, N.; Stemmer-Rachamimov, A. Absence of Alzheimer Disease Neuropathologic Changes in Eyes of Subjects with Alzheimer Disease. J. Neuropathol. Exp. Neurol. 2017, 76, 376–383. [Google Scholar] [CrossRef] [PubMed]
- Schön, C.; Hoffmann, N.A.; Ochs, S.M.; Burgold, S.; Filser, S.; Steinbach, S.; Seeliger, M.W.; Arzberger, T.; Goedert, M.; Kretzschmar, H.A.; et al. Long-Term In Vivo Imaging of Fibrillar Tau in the Retina of P301S Transgenic Mice. PLoS ONE 2012, 7, e53547. [Google Scholar] [CrossRef] [PubMed]
- Ho, C.-Y.; Troncoso, J.C.; Knox, D.; Stark, W.; Eberhart, C.G. Beta-Amyloid, Phospho-Tau and Alpha-Synuclein Deposits Similar to Those in the Brain Are Not Identified in the Eyes of Alzheimer’s and Parkinson’s Disease Patients. Brain Pathol. 2014, 24, 25–32. [Google Scholar] [CrossRef] [PubMed]
- López-Cuenca, I.; Marcos-Dolado, A.; Yus-Fuertes, M.; Salobrar-García, E.; Elvira-Hurtado, L.; Fernández-Albarral, J.A.; Salazar, J.J.; Ramírez, A.I.; Sánchez-Puebla, L.; Fuentes-Ferrer, M.E.; et al. The Relationship Between Retinal Layers and Brain Areas in Asymptomatic First-Degree Relatives of Sporadic Forms of Alzheimer’s Disease: An Exploratory Analysis. Alzheimers Res. Ther. 2022, 14, 79. [Google Scholar] [CrossRef] [PubMed]
- López-de-Eguileta, A.; López-García, S.; Lage, C.; Pozueta, A.; García-Martínez, M.; Kazimierczak, M.; Bravo, M.; Irure, J.; López-Hoyos, M.; Muñoz-Cacho, P.; et al. The Retinal Ganglion Cell Layer Reflects Neurodegenerative Changes in Cognitively Unimpaired Individuals. Alzheimers Res. Ther. 2022, 14, 57. [Google Scholar] [CrossRef] [PubMed]
- Eppenberger, L.S.; Li, C.; Wong, D.; Tan, B.; Garhöfer, G.; Hilal, S.; Chong, E.; Toh, A.Q.; Venketasubramanian, N.; Chen, C.L.H.; et al. Retinal Thickness Predicts the Risk of Cognitive Decline over Five Years. Alzheimers Res. Ther. 2024, 16, 273. [Google Scholar] [CrossRef] [PubMed]
- Jali, V.; Zhang, Q.; Chong, J.R.; Wong, D.; Tan, B.; Garhöfer, G.; Hilal, S.; Lai, M.K.P.; Schmetterer, L.; Chen, C.L.-H.; et al. Diagnosis of Cognitive Impairment and Dementia: Blood Plasma and Optical Coherence Tomography. Brain Commun. 2025, 7, fcae472. [Google Scholar] [CrossRef] [PubMed]
- Lad, E.M.; Mukherjee, D.; Stinnett, S.S.; Cousins, S.W.; Potter, G.G.; Burke, J.R.; Farsiu, S.; Whitson, H.E. Evaluation of Inner Retinal Layers as Biomarkers in Mild Cognitive Impairment to Moderate Alzheimer’s Disease. PLoS ONE 2018, 13, e0192646. [Google Scholar] [CrossRef] [PubMed]
- Jáñez-Escalada, L.; Jáñez-García, L.; Salobrar-García, E.; Santos-Mayo, A.; de Hoz, R.; Yubero, R.; Gil, P.; Ramírez, J.M. Spatial Analysis of Thickness Changes in Ten Retinal Layers of Alzheimer’s Disease Patients Based on Optical Coherence Tomography. Sci. Rep. 2019, 9, 13000. [Google Scholar] [CrossRef] [PubMed]
- Hood, D.C.; Raza, A.S.; de Moraes, C.G.V.; Liebmann, J.M.; Ritch, R. Glaucomatous Damage of the Macula. Prog. Retin. Eye Res. 2013, 32, 1–21. [Google Scholar] [CrossRef] [PubMed]
- Sen, S.; Saxena, R.; Tripathi, M.; Vibha, D.; Dhiman, R. Neurodegeneration in Alzheimer’s Disease and Glaucoma: Overlaps and Missing Links. Eye 2020, 34, 1546–1553. [Google Scholar] [CrossRef] [PubMed]
- Nieves-Moreno, M.; Martínez-de-la-Casa, J.M.; Morales-Fernández, L.; Sánchez-Jean, R.; Sáenz-Francés, F.; García-Feijoó, J. Impacts of Age and Sex on Retinal Layer Thicknesses Measured by Spectral Domain Optical Coherence Tomography with Spectralis. PLoS ONE 2018, 13, e0194169. [Google Scholar] [CrossRef] [PubMed]
- Romero-Bascones, D.; Ayala, U.; Alberdi, A.; Erramuzpe, A.; Galdós, M.; Gómez-Esteban, J.C.; Murueta-Goyena, A.; Teijeira, S.; Gabilondo, I.; Barrenechea, M. Spatial Characterization of the Effect of Age and Sex on Macular Layer Thicknesses and Foveal Pit Morphology. PLoS ONE 2022, 17, e0278925. [Google Scholar] [CrossRef] [PubMed]
- Chua, J.; Li, C.; Antochi, F.; Toma, E.; Wong, D.; Tan, B.; Garhöfer, G.; Hilal, S.; Popa-Cherecheanu, A.; Chen, C.L.-H.; et al. Utilizing Deep Learning to Predict Alzheimer’s Disease and Mild Cognitive Impairment with Optical Coherence Tomography. Alzheimers Dement. (Amst) 2025, 17, e70041. [Google Scholar] [CrossRef] [PubMed]
- Turkan, Y.; Tek, F.B.; Arpaci, F.; Arslan, O.; Toslak, D.; Bulut, M.T.; Yaman, A. Automated Diagnosis of Alzheimer’s Disease Using OCT and OCTA: A Systematic Review. IEEE Access 2024, 12, 104031–104051. [Google Scholar] [CrossRef]
- Wu, H.; Wang, C.; Chen, C.; Xu, X.; Zhu, Y.; Sang, A.; Jiang, K.; Dong, J. Association Between Retinal Vascular Geometric Changes and Cognitive Impairment: A Systematic Review and Meta-Analysis. J. Clin. Neurol. 2020, 16, 19–28. [Google Scholar] [CrossRef] [PubMed]
- Querques, G.; Borrelli, E.; Sacconi, R.; De Vitis, L.; Leocani, L.; Santangelo, R.; Magnani, G.; Comi, G.; Bandello, F. Functional and Morphological Changes of the Retinal Vessels in Alzheimer’s Disease and Mild Cognitive Impairment. Sci. Rep. 2019, 9, 63. [Google Scholar] [CrossRef] [PubMed]
- Jack, C.R., Jr.; Bennett, D.A.; Blennow, K.; Carrillo, M.C.; Dunn, B.; Budd Haeberlein, S.; Holtzman, D.M.; Jagust, W.J.; Jessen, F.; Karlawish, J.; et al. NIA-AA Research Framework: Toward a Biological Definition of Alzheimer’s Disease. Alzheimers Dement. 2018, 14, 535–562. [Google Scholar] [CrossRef] [PubMed]
- Chun, M.Y.; Jang, H.; Kim, S.-J.; Park, Y.H.; Yun, J.; Lockhart, S.N.; Weiner, M.; De Carli, C.; Moon, S.H.; Choi, J.Y.; et al. Emerging Role of Vascular Burden in AT(N) Classification in Individuals with Alzheimer’s and Concomitant Cerebrovascular Burdens. J. Neurol. Neurosurg. Psychiatry 2024, 95, 44–51. [Google Scholar] [CrossRef] [PubMed]
- Iturria-Medina, Y.; Sotero, R.C.; Toussaint, P.J.; Mateos-Pérez, J.M.; Evans, A.C. Early Role of Vascular Dysregulation on Late-Onset Alzheimer’s Disease Based on Multifactorial Data-Driven Analysis. Nat. Commun. 2016, 7, 11934. [Google Scholar] [CrossRef] [PubMed]
Figure 1.
Multimodal retinal images from a cognitively normal, Aβ− subject. (a) HSI captures both spatial and spectral information, enabling biochemical analysis of retinal structures. The mean and SD reflectance values of pixels in the inferior hemisphere are shown. (b) OCT provides structural measurements, including RNFL, GC and IPL thickness, across the regions of interest defined by the ETDRS grid, indicative of neurodegeneration. (c) CFP enables VBM extraction via DL-based artery and vein segmentation. As shown, arteriolar (left) and venular (right) diameters can be quantified using CRAE and CRVE, respectively. Aβ = amyloid-beta; HSI = hyperspectral imaging; SD = standard deviation; OCT = optical coherence tomography; RNFL = retinal nerve fiber layer; GC = ganglion cell layer; IPL = inner plexiform layer; ETDRS = Early Treatment Diabetic Retinopathy Study; CFP = color fundus photography; VBM = vascular biomarker; DL = deep learning; CRAE = central retinal arteriolar equivalent; CRVE = central retinal venular equivalent.
Figure 1.
Multimodal retinal images from a cognitively normal, Aβ− subject. (a) HSI captures both spatial and spectral information, enabling biochemical analysis of retinal structures. The mean and SD reflectance values of pixels in the inferior hemisphere are shown. (b) OCT provides structural measurements, including RNFL, GC and IPL thickness, across the regions of interest defined by the ETDRS grid, indicative of neurodegeneration. (c) CFP enables VBM extraction via DL-based artery and vein segmentation. As shown, arteriolar (left) and venular (right) diameters can be quantified using CRAE and CRVE, respectively. Aβ = amyloid-beta; HSI = hyperspectral imaging; SD = standard deviation; OCT = optical coherence tomography; RNFL = retinal nerve fiber layer; GC = ganglion cell layer; IPL = inner plexiform layer; ETDRS = Early Treatment Diabetic Retinopathy Study; CFP = color fundus photography; VBM = vascular biomarker; DL = deep learning; CRAE = central retinal arteriolar equivalent; CRVE = central retinal venular equivalent.
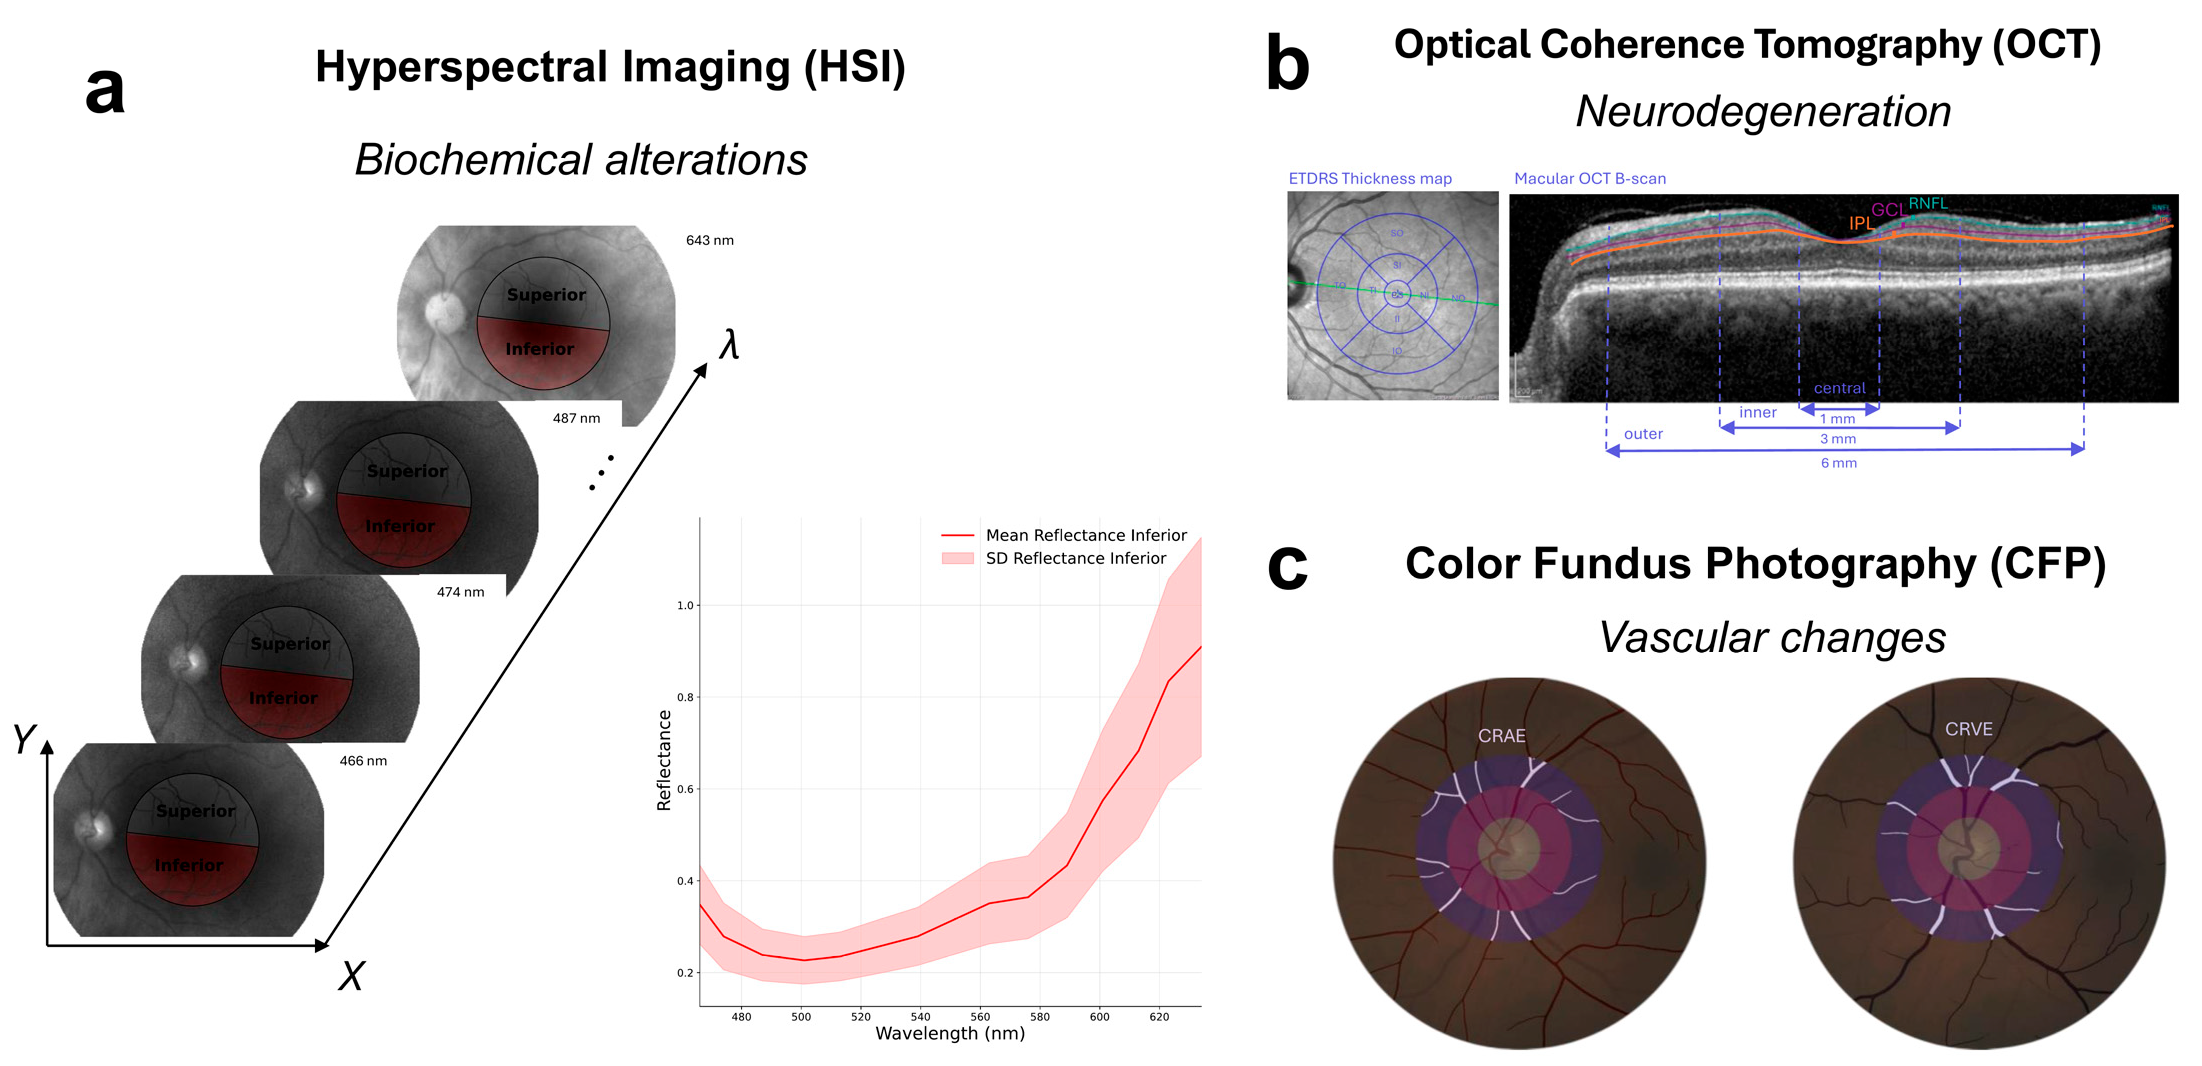
Figure 2.
Regional HSI texture analysis by macular region and amyloid status for the primary CN/MCI cohort. HSI texture analysis was performed on the full macular grid, superior hemisphere, and inferior hemisphere. Box plots show the distribution of GLCM COR at 466 nm for Aβ− (blue) and Aβ+ (red) participants. P values are computed using the Mann-Whitney U test. Higher GLCM COR values suggest smoother, local texture; lower values indicate more heterogeneous local texture. HSI = Hyperspectral Imaging; CN = cognitively normal; MCI = mild cognitive impairment; GLCM = gray-level co-occurrence matrix; COR = correlation; Aβ+ = amyloid-beta positive; Aβ− = amyloid-beta negative.
Figure 2.
Regional HSI texture analysis by macular region and amyloid status for the primary CN/MCI cohort. HSI texture analysis was performed on the full macular grid, superior hemisphere, and inferior hemisphere. Box plots show the distribution of GLCM COR at 466 nm for Aβ− (blue) and Aβ+ (red) participants. P values are computed using the Mann-Whitney U test. Higher GLCM COR values suggest smoother, local texture; lower values indicate more heterogeneous local texture. HSI = Hyperspectral Imaging; CN = cognitively normal; MCI = mild cognitive impairment; GLCM = gray-level co-occurrence matrix; COR = correlation; Aβ+ = amyloid-beta positive; Aβ− = amyloid-beta negative.
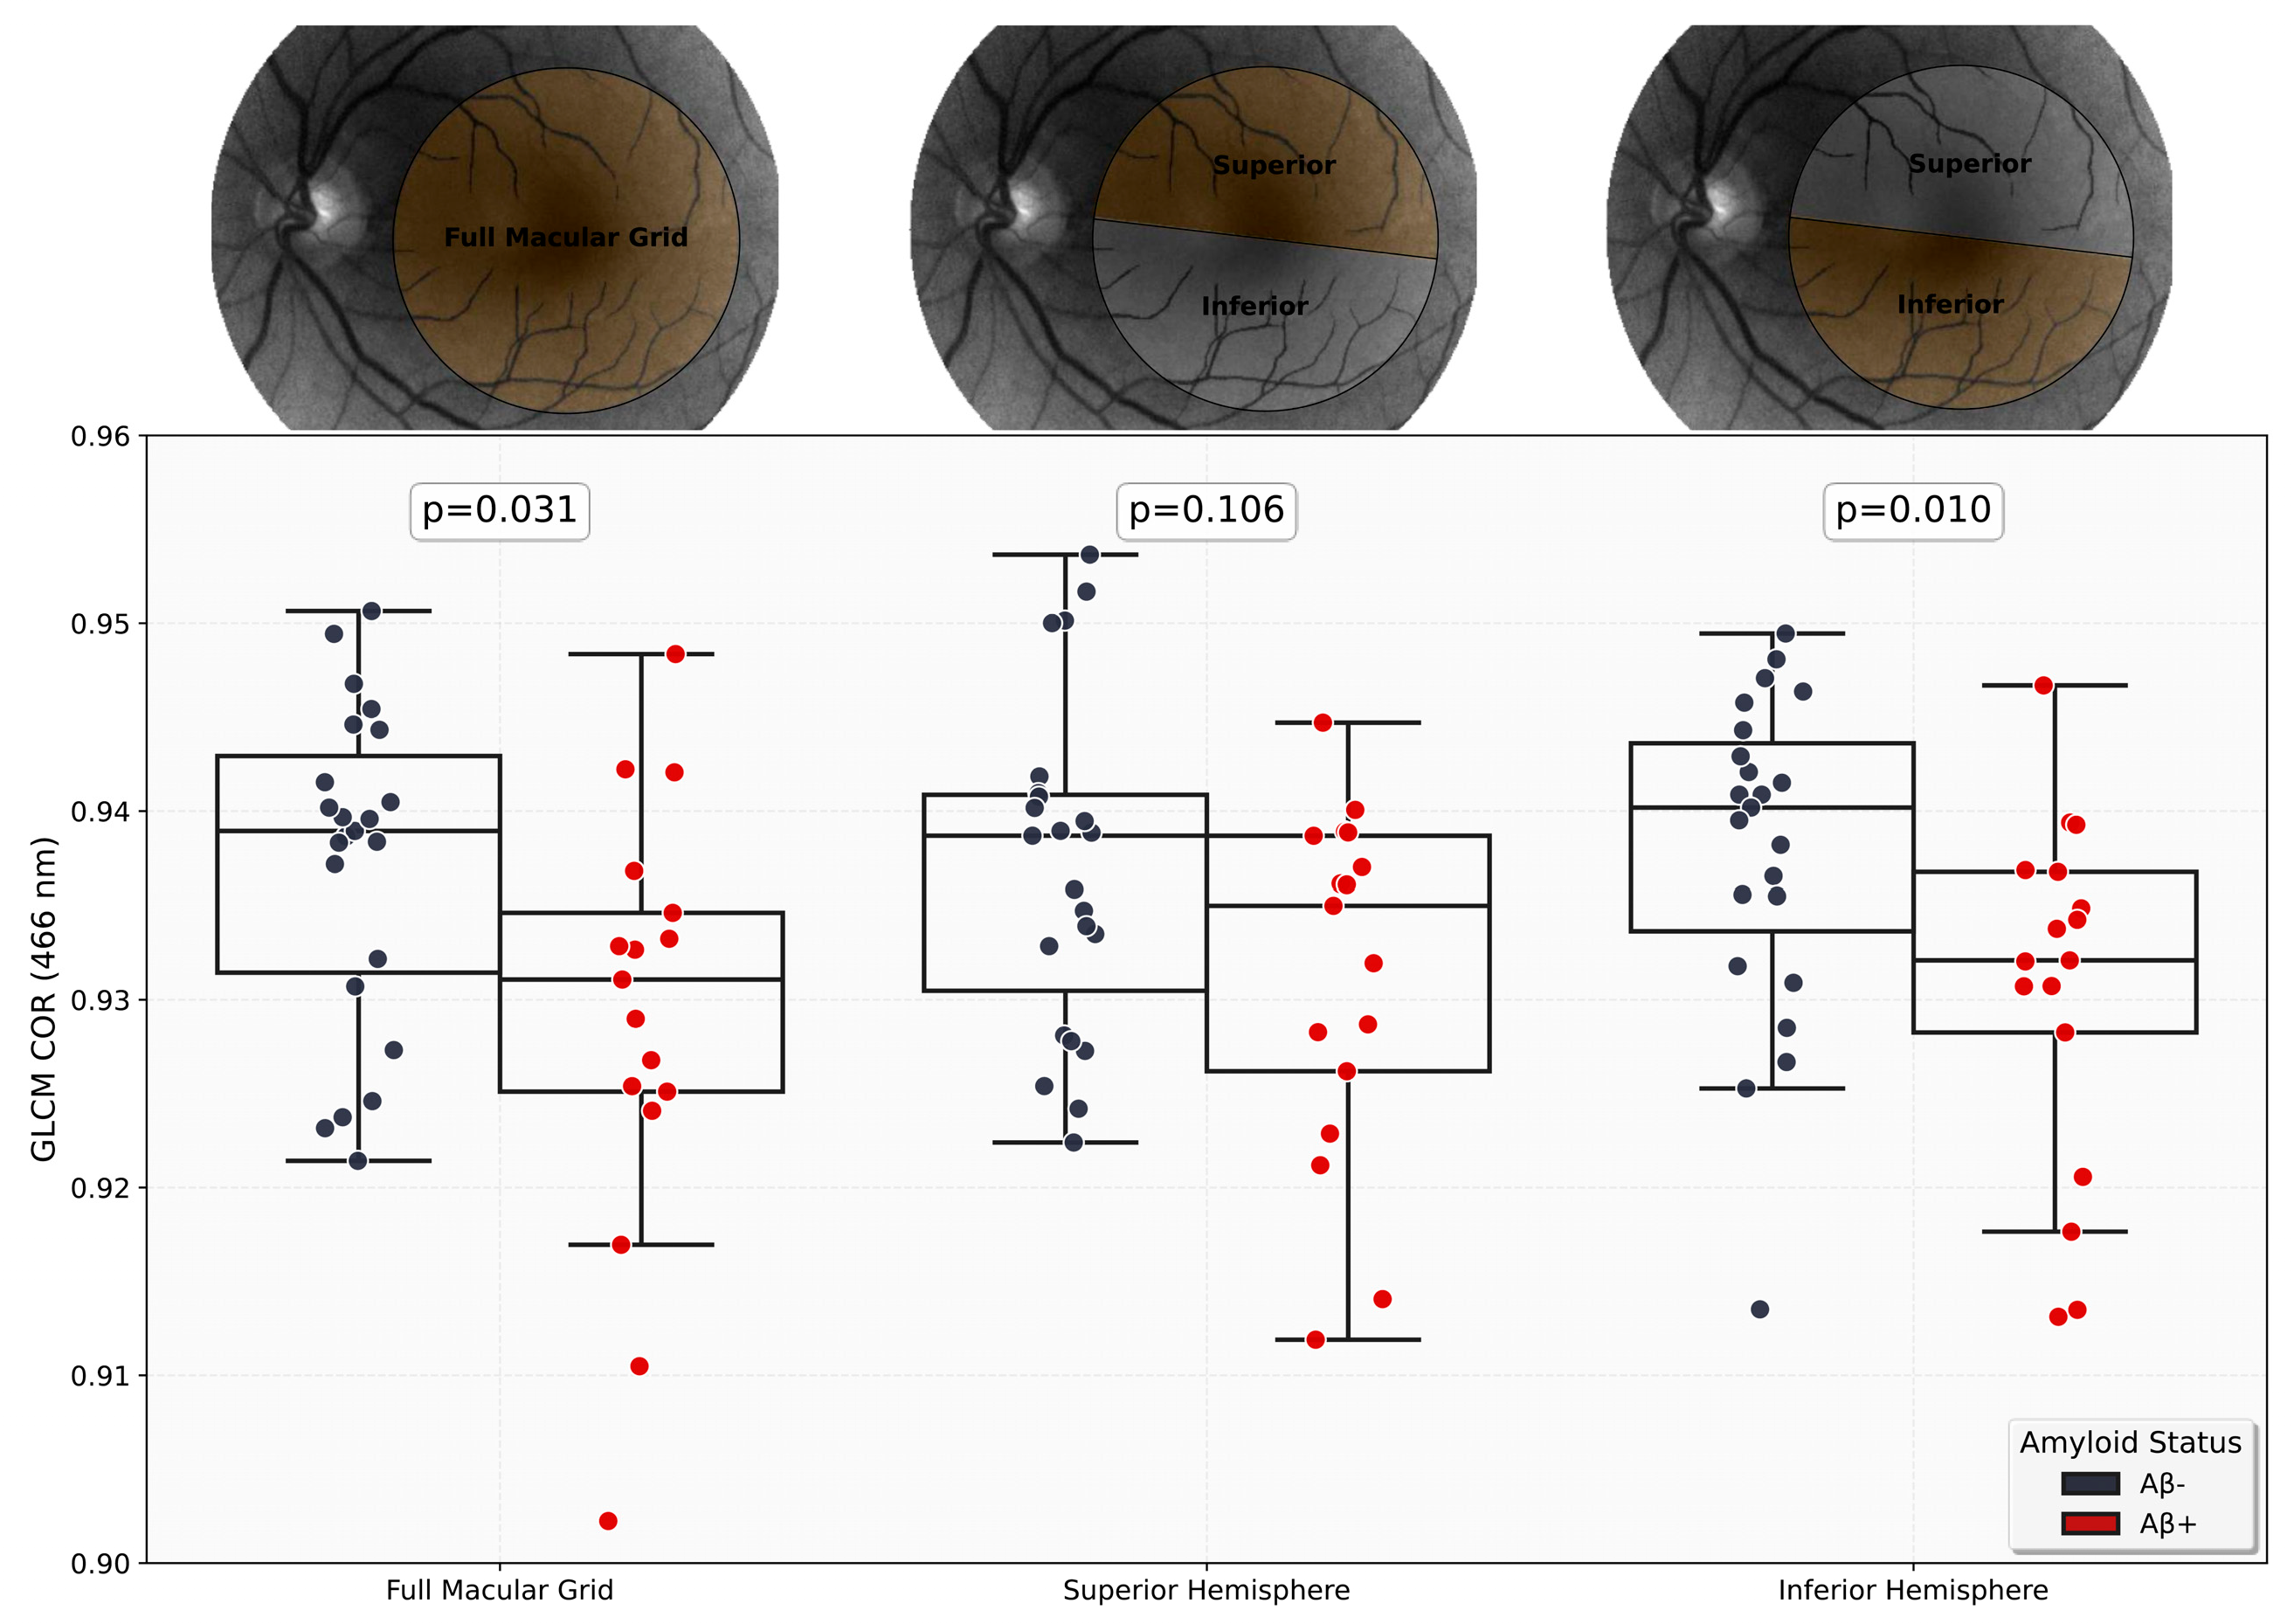
Figure 3.
Stage-dependent changes in HSI GLCM COR across the AD continuum. Box plots show the distribution of HSI GLCM COR (full macular grid, 466 nm) across three distinct groups: CN, CN/MCI with Aβ+, and ADD. P values are computed using the Mann-Whitney U test. HSI = hyperspectral imaging; GLCM = gray-level co-occurrence matrix; COR = correlation; AD = Alzheimer's disease; CN = cognitively normal; Aβ = amyloid-beta; MCI = mild cognitive impairment; ADD = Alzheimer's disease dementia.
Figure 3.
Stage-dependent changes in HSI GLCM COR across the AD continuum. Box plots show the distribution of HSI GLCM COR (full macular grid, 466 nm) across three distinct groups: CN, CN/MCI with Aβ+, and ADD. P values are computed using the Mann-Whitney U test. HSI = hyperspectral imaging; GLCM = gray-level co-occurrence matrix; COR = correlation; AD = Alzheimer's disease; CN = cognitively normal; Aβ = amyloid-beta; MCI = mild cognitive impairment; ADD = Alzheimer's disease dementia.
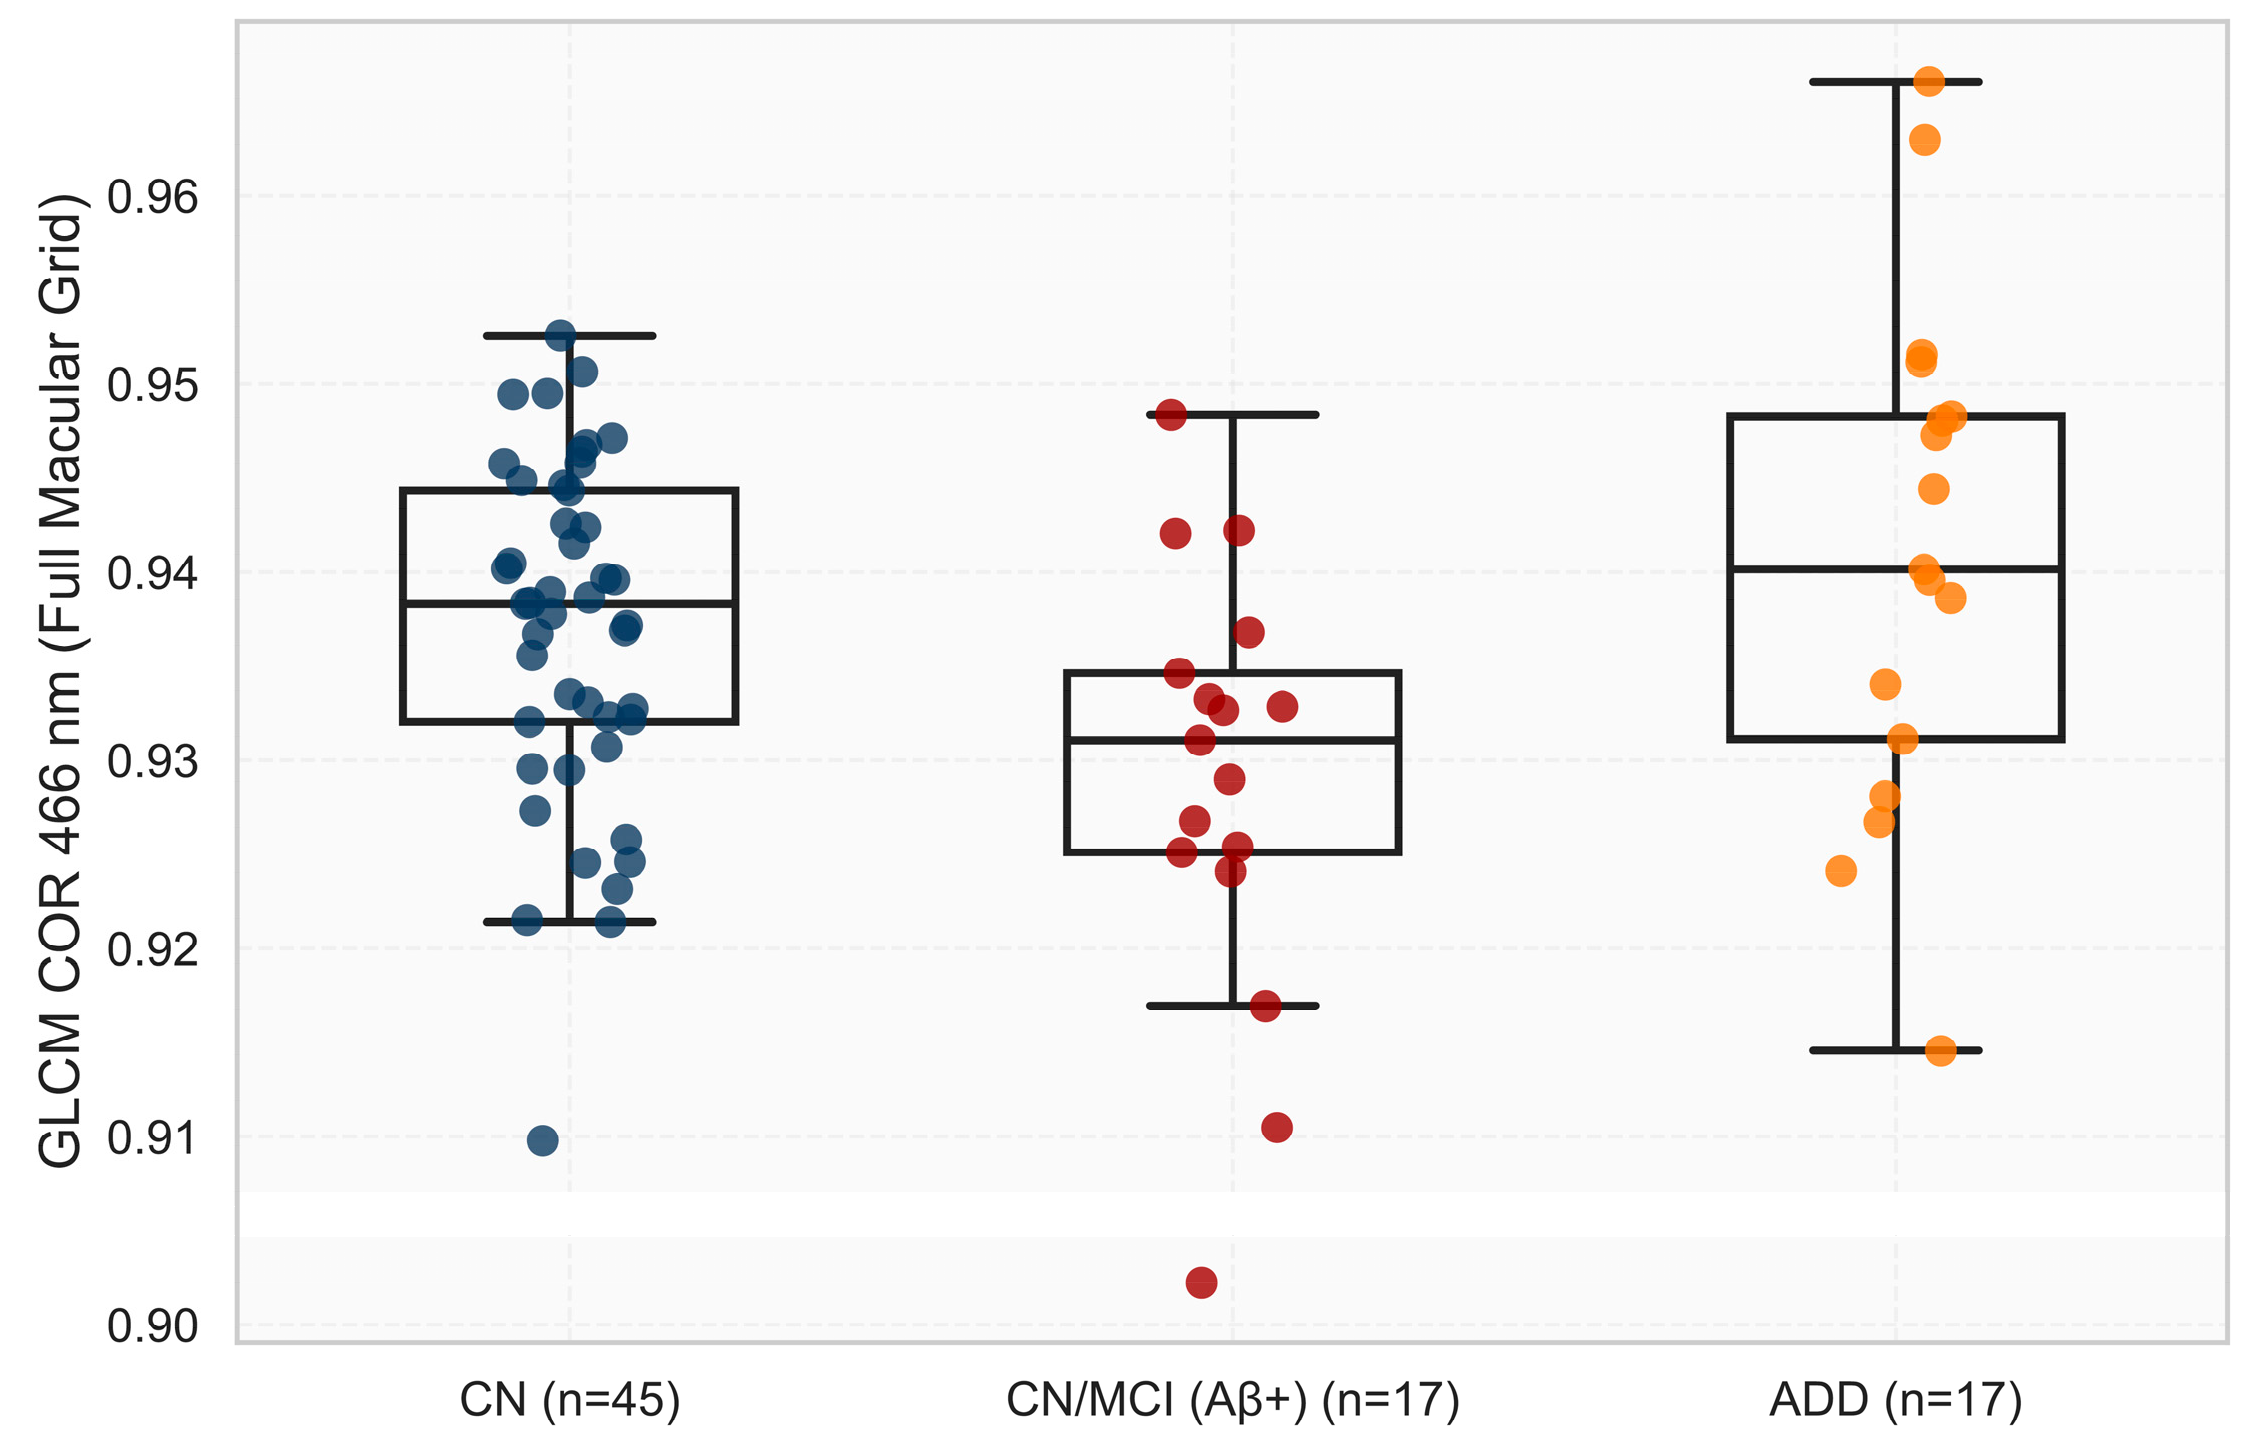
Figure 4.
Vascular biomarker distribution by amyloid status. Box plots show the distribution of CRAE (a) and CRVE (b) for Aβ− (blue) and Aβ+ (red) participants. P values are computed using the Mann-Whitney U test. Aβ = amyloid-beta; CRAE = Central Retinal Arteriolar Equivalent; CRVE = Central Retinal Venular Equivalent.
Figure 4.
Vascular biomarker distribution by amyloid status. Box plots show the distribution of CRAE (a) and CRVE (b) for Aβ− (blue) and Aβ+ (red) participants. P values are computed using the Mann-Whitney U test. Aβ = amyloid-beta; CRAE = Central Retinal Arteriolar Equivalent; CRVE = Central Retinal Venular Equivalent.
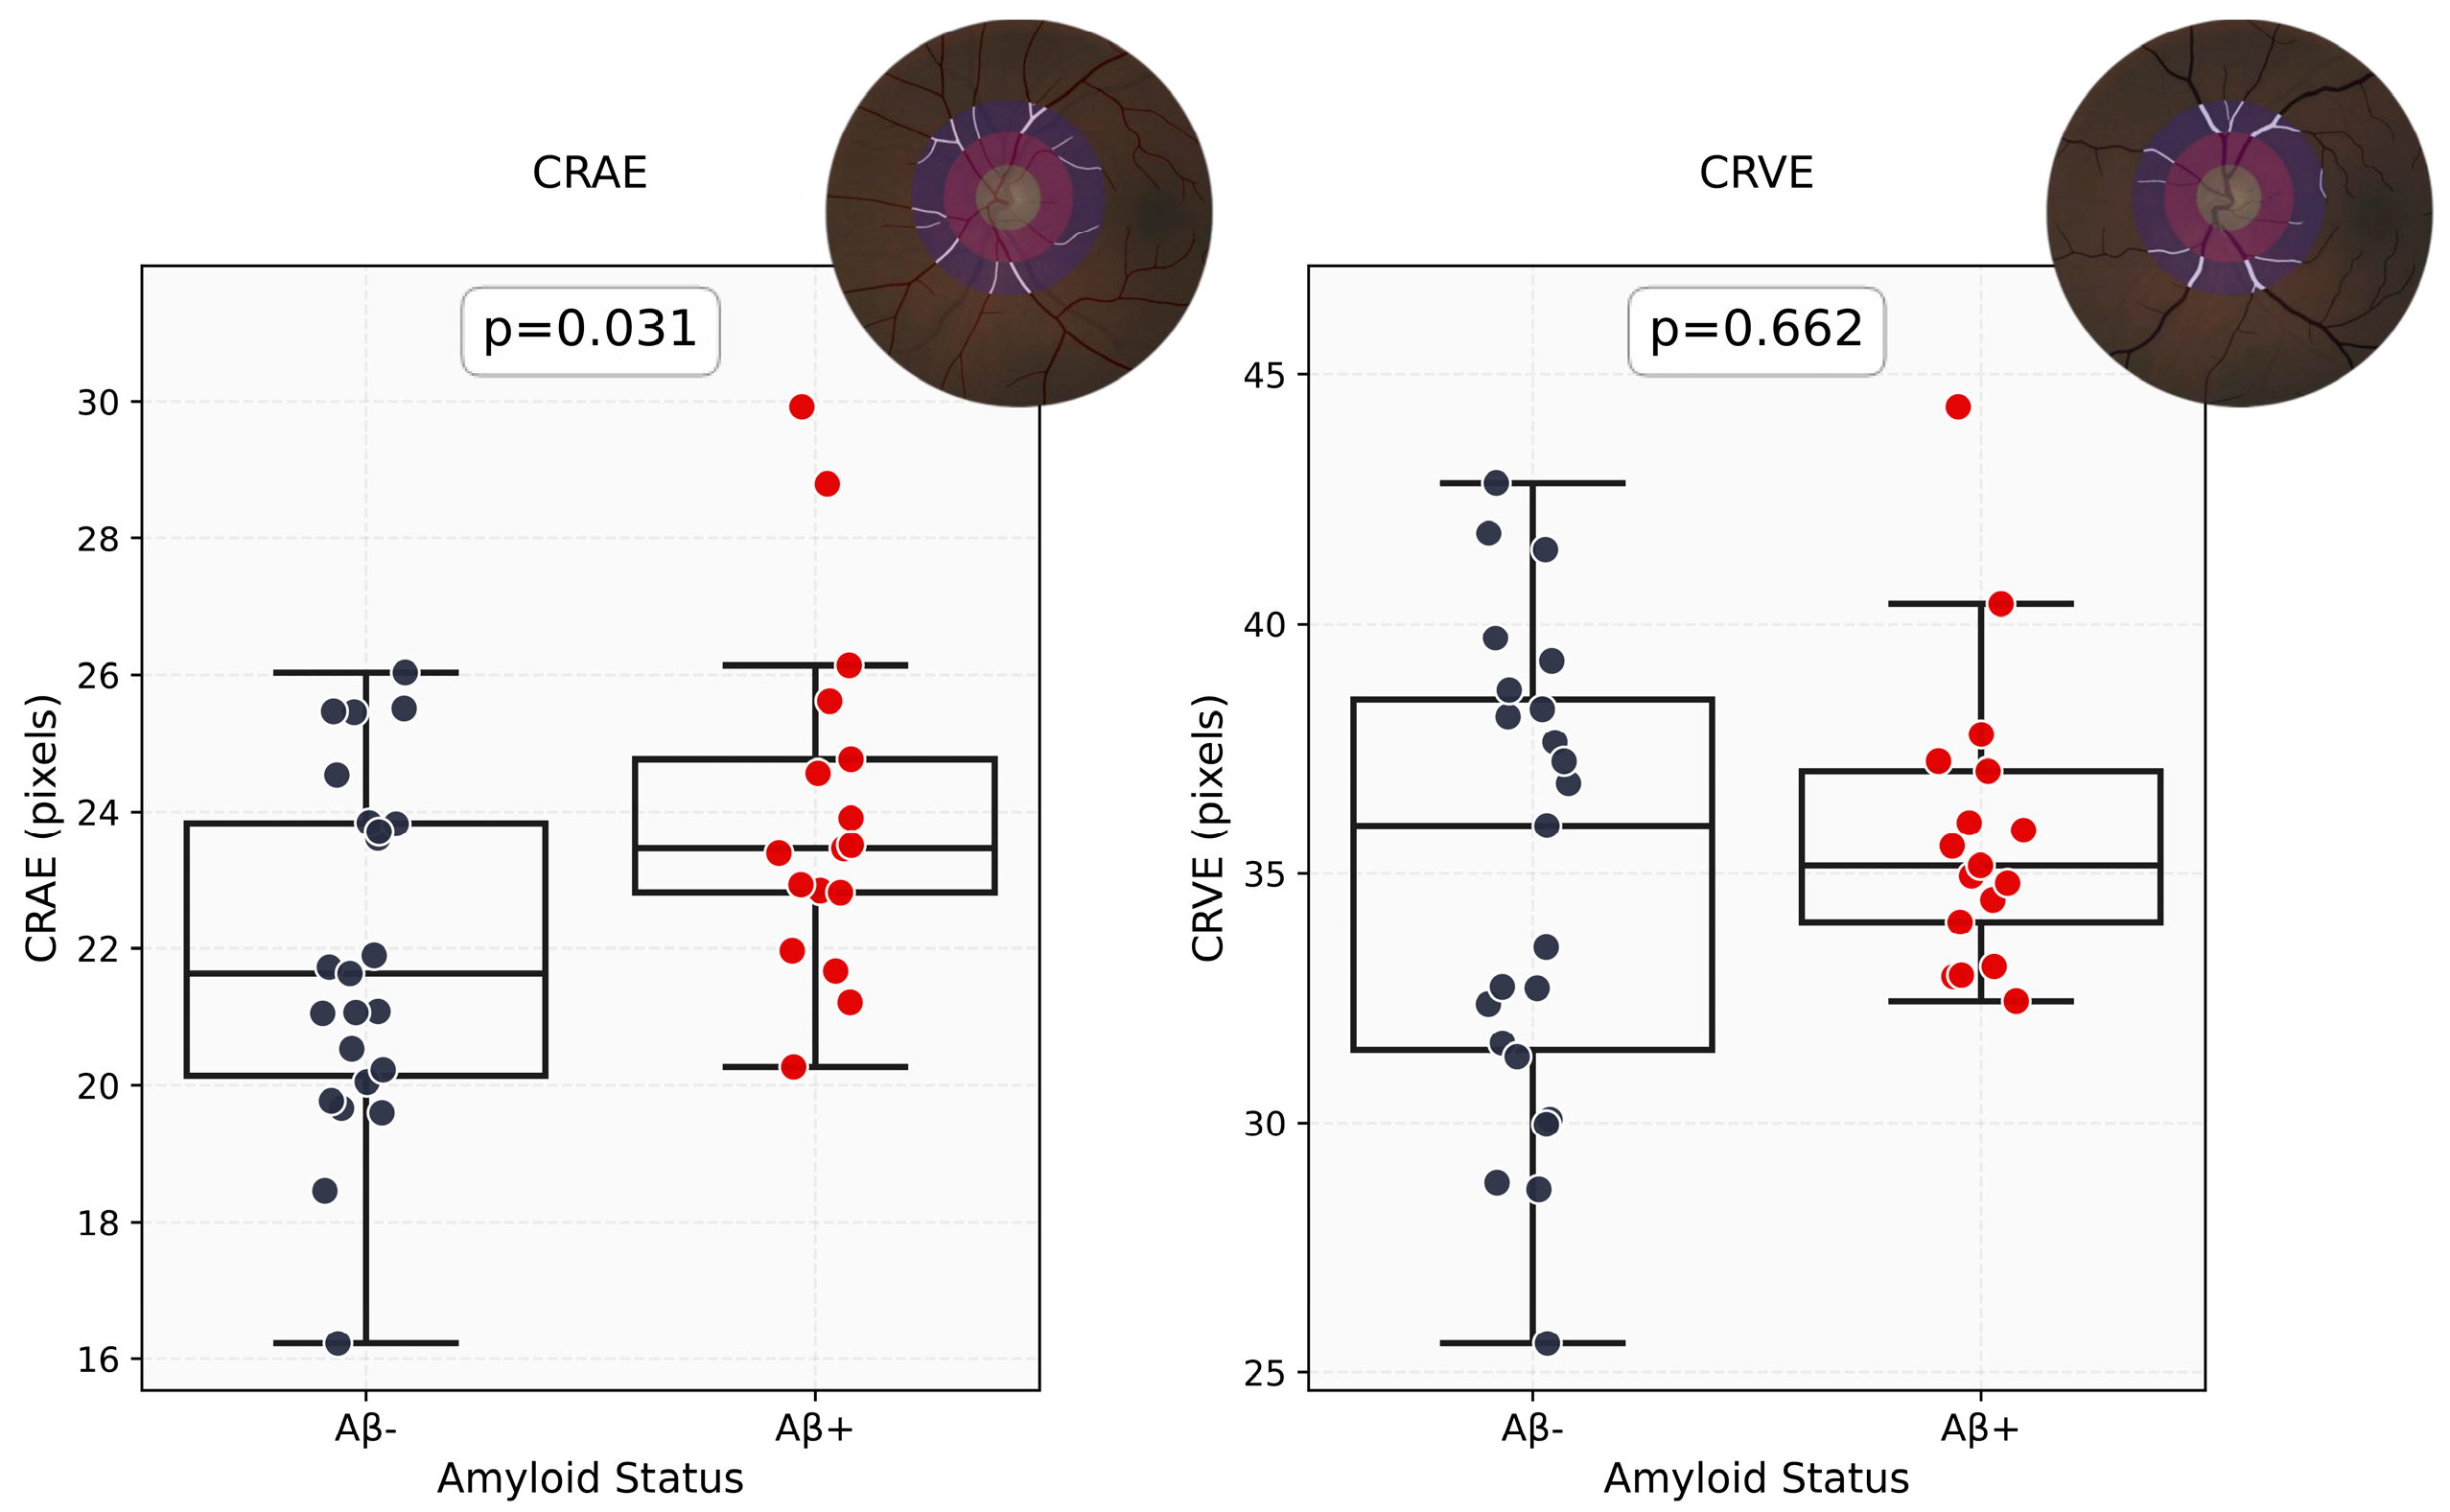
Figure 5.
Classification performance (AUC) for unimodal and multimodal feature sets. Bars show mean AUC with 95% confidence intervals. The number of input features for each model is shown in parentheses (n). AUC = area under the curve; HSI = hyperspectral imaging; CRAE = central retinal arteriolar equivalent; CRVE = central retinal venular equivalent; GC-IPL = ganglion cell–inner plexiform layer.
Figure 5.
Classification performance (AUC) for unimodal and multimodal feature sets. Bars show mean AUC with 95% confidence intervals. The number of input features for each model is shown in parentheses (n). AUC = area under the curve; HSI = hyperspectral imaging; CRAE = central retinal arteriolar equivalent; CRVE = central retinal venular equivalent; GC-IPL = ganglion cell–inner plexiform layer.
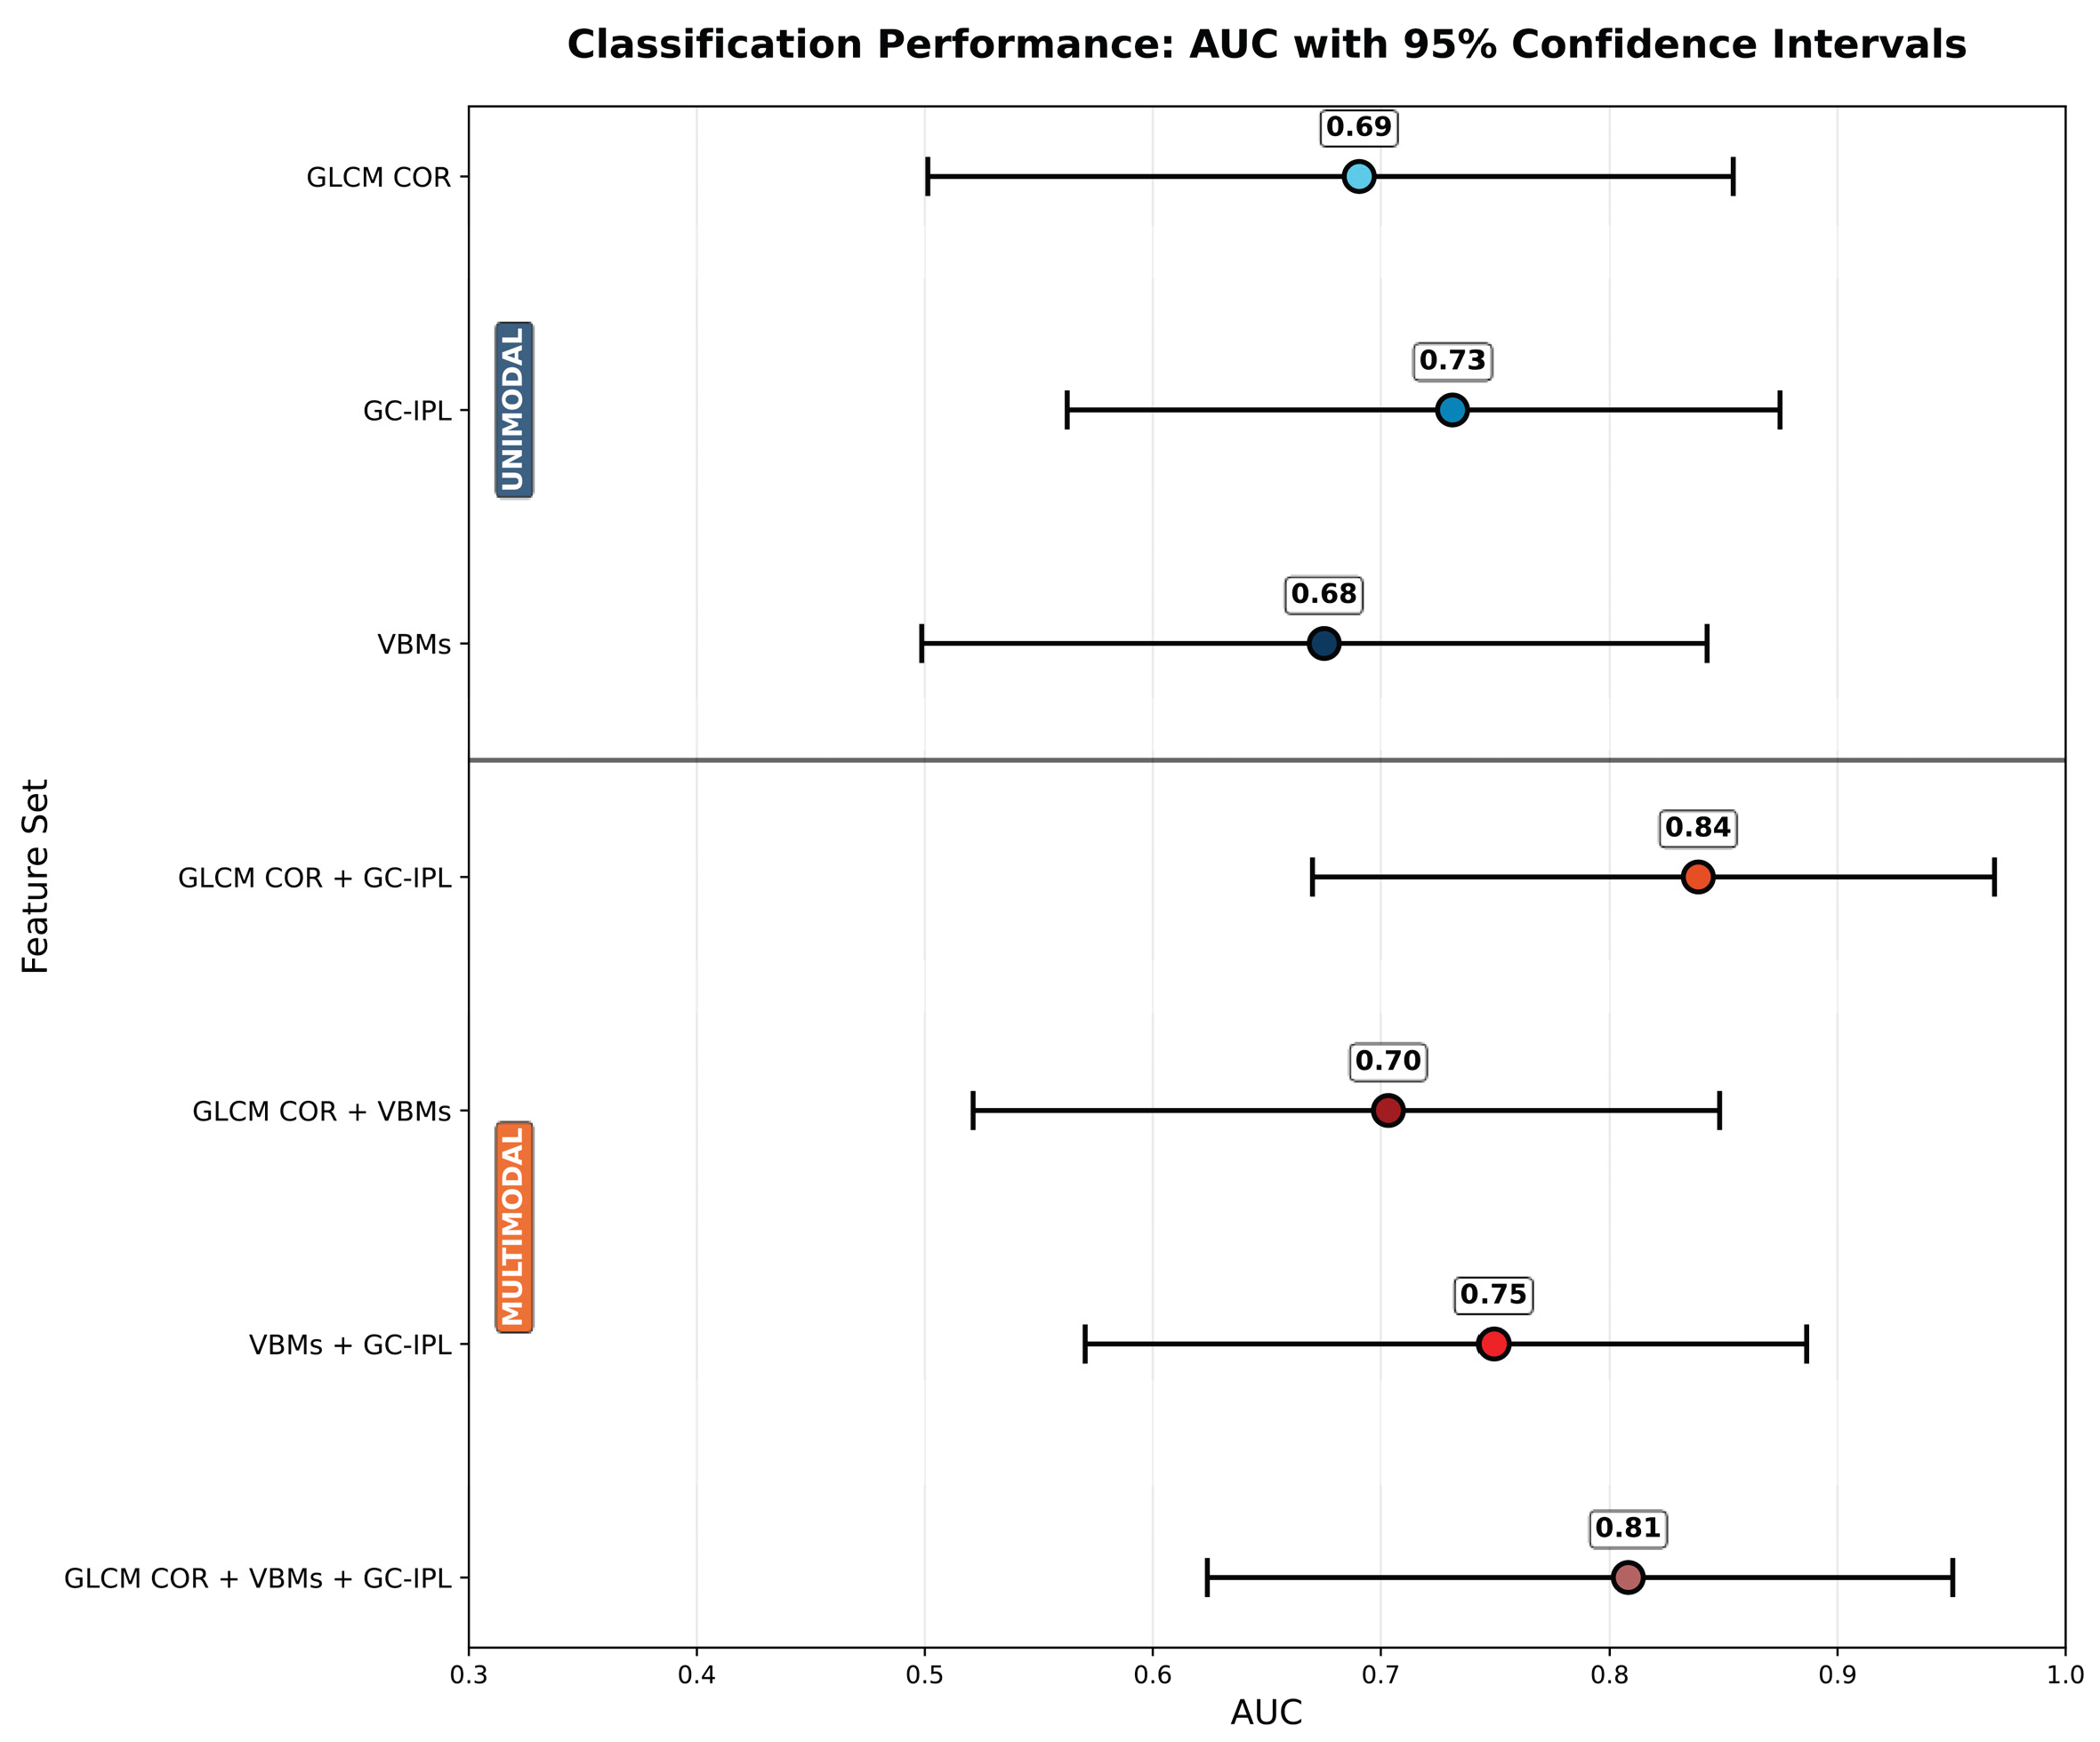

Table 1.
Demographic characteristics and cognitive scores of Aβ− and Aβ+ participants in the CN/MCI cohort.
Table 1.
Demographic characteristics and cognitive scores of Aβ− and Aβ+ participants in the CN/MCI cohort.
| Aβ− (N = 23) CN |
Aβ+ (N = 17) CN |
Aβ+ (N = 17) MCI |
P-value | |
|---|---|---|---|---|
| Total Participants | 23 | 10 | 7 | - |
| Sex (M/F) | 9/14 | 3/7 | 2/5 | 0.815 ‡ |
| Age (yrs: Mean ± SD) | 76.2 ± 7.1 | 76.2 ± 3.9 | 70.3 ± 10.4 | 0.284 † |
| MMSE (Mean ± SD) | 29.0 ± 1.1 | 29.2 ± 0.8 | 21.1 ± 5.2 | 0.000 † |
| APOE genotype, n (%) | 0.052 ‡ | |||
| ε2/ε2 | 0 (0.0) | 0 (0.0) | 0 (0.0) | |
| ε2/ε3 | 0 (0.0) | 0 (0.0) | 0 (0.0) | |
| ε3/ε3 | 12 (52.2) | 4 (40.0) | 1 (14.3) | |
| ε2/ε4 | 1 (4.3) | 0 (0.0) | 0 (0.0) | |
| ε3/ε4 | 10 (43.5) | 6 (60.0) | 4 (57.1) | |
| ε4/ε4 | 0 (0.0) | 0 (0.0) | 2 (28.6) | |
| AVLT total learning (Mean ± SD) * | 47.0 ± 9.9 | 47.6 ± 7.3 | 19.1 ± 6.8 | 0.000 † |
| BNT * | 55.2 ± 3.3 | 55.2 ± 3.5 | 45.6 ± 5.9 | 0.004 † |
| AVF * | 20.0 ± 5.7 | 17.5 ± 6.7 | 12.9 ± 2.3 | 0.008 † |
Aβ− = amyloid-beta negative; Aβ+ = amyloid-beta positive; SD = standard deviation; M = male; F = female; CN = cognitively normal; MCI = mild cognitive impairment; MMSE = mini-mental state examination; APOE = apolipoprotein E; yrs = years; AVLT = auditory verbal learning test; BNT = Boston naming test; AVF = Animal Verbal Fluency; ‡ Chi-square test; † Kruskal-Wallis test; * No measurements for 5 CN subjects, see Supplementary File 2.
Table 2.
HSI classification performance, repeatability, and reproducibility by macular grid.
| Macular Region | AUC (95% CI) | Sensitivity | Specificity | Repeatability ICC | Reproducibility ICC |
|---|---|---|---|---|---|
| Full Macular Grid | 0.69 (0.50–0.85) | 0.71 | 0.70 | 0.60 | 0.88 |
| Superior Hemisphere | 0.62 (0.43–0.79) | 0.47 | 0.61 | 0.48 | 0.64 |
| Inferior Hemisphere | 0.72 (0.54–0.87) | 0.65 | 0.74 | 0.51 | 0.88 |
The highest value per performance metric within each column is highlighted in bold. HSI = hyperspectral imaging; AUC = area under the curve; CI = confidence interval; ICC = intraclass correlation coefficient.
Table 3.
MANCOVA results for retinal thickness measures.
| OCT Layer | Aβ Status (p) | Sex (p) | Age (p) |
|---|---|---|---|
| GC-IPL | 0.009 | 0.041 | 0.600 |
| RNFL | 0.694 | 0.059 | 0.024 |
Significant p-values are highlighted in bold. MANCOVA = multivariate analysis of covariance; OCT = optical coherence tomography; GC-IPL = ganglion cell–inner plexiform layer; RNFL = retinal nerve fiber layer; Aβ = amyloid-beta.
Table 4.
OCT-based classification performance using GC-IPL thickness measures.
| GC-IPL Features | AUC (95% CI) | Sensitivity | Specificity |
|---|---|---|---|
| 9 ETDRS regions | 0.73 (0.56–0.88) | 0.53 | 0.65 |
| Superior (SI, SO) | 0.45 (0.25–0.65) | 0.41 | 0.44 |
| Inferior (II, IO) | 0.71 (0.54–0.87) | 0.53 | 0.61 |
The highest value per performance metric within each column is highlighted in bold. OCT = optical coherence tomography; GC-IPL = ganglion cell–inner plexiform layer; ETDRS = Early Treatment Diabetic Retinopathy Study; SI = superior inner; SO = superior outer; II = inferior inner; IO = inferior outer; AUC = area under the receiver operating characteristic curve; CI = confidence interval.
Table 5.
VBM-based classification performance.
| VBMs | AUC (95% CI) | Sensitivity | Specificity |
|---|---|---|---|
| CRAE + CRVE | 0.68 (0.50–0.84) | 0.65 | 0.65 |
| CRAE | 0.66 (0.48–0.83) | 0.59 | 0.61 |
| CRVE | 0.48 (0.27–0.67) | 0.47 | 0.48 |
The highest value per performance metric within each column is highlighted in bold. VBM = vascular biomarker; CRAE = Central Retinal Arteriolar Equivalent; CRVE = Central Retinal Venular Equivalent; AUC = area under the receiver operating characteristic curve; CI = confidence interval.
Disclaimer/Publisher’s Note: The statements, opinions and data contained in all publications are solely those of the individual author(s) and contributor(s) and not of MDPI and/or the editor(s). MDPI and/or the editor(s) disclaim responsibility for any injury to people or property resulting from any ideas, methods, instructions or products referred to in the content. |
© 2026 by the authors. Licensee MDPI, Basel, Switzerland. This article is an open access article distributed under the terms and conditions of the Creative Commons Attribution (CC BY) license (http://creativecommons.org/licenses/by/4.0/).
Copyright: This open access article is published under a Creative Commons CC BY 4.0 license, which permit the free download, distribution, and reuse, provided that the author and preprint are cited in any reuse.