
Submitted:
17 August 2026
Posted:
17 August 2026
You are already at the latest version
Abstract
Extreme heat is the deadliest weather-related hazard globally, yet the role of agricultural land management, specifically post-harvest transitions from dense vegetative canopies to exposed bare soil, in amplifying urban heat exposure remains critically unquantified in disaster risk management (DRM) frameworks. This study investigates Land Surface Temperature (LST) dynamics before and after the annual harvest season across seven consecutive years (2020–2026) at the interface between an agricultural plain and the city of Lleida, Catalonia, Spain. Framing the analysis explicitly within the Sendai Framework for Disaster Risk Reduction 2015–2030 , we utilize open-access Landsat 8/9 Collection 2 Level 2 surface temperature products alongside Sentinel-2 Level-2A surface reflectance imagery to derive LST, Normalized Difference Vegetation Index (NDVI), Normalized Difference Moisture Index (NDMI), and Short-Wave Infrared (SWIR) reflectance at a co-registered 20-meter spatial resolution. Across all seven years, post-harvest mean city LST consistently exceeded pre-harvest baselines by 16.4 °C to 38.1 °C, surpassing local emergency thermal risk thresholds in every year evaluated. Strong, spatially co-registered pixel-wise correlations between LST and NDMI (mean r≈-0.74) and LST and NDVI (mean r ~-0.70), along with positive correlations with SWIR (mean r≈+0.74), confirm that rapid loss of canopy moisture and soil evapotranspiration drives severe microclimatic heating beyond natural background summer warming. Since agricultural harvest dates follow highly predictable calendar windows, this phenomenon represents a unique class of predictable spatial hazards. We demonstrate how integrating satellite-tracked agricultural phenology into urban early warning systems and spatial planning directly advances Sendai Framework Priorities 1 and 4.
Keywords:
land surface temperature (LST)
; urban heat island (UHI)
; disaster risk management
; sendai framework
; agricultural harvest
; early warning systems
; remote sensing
1. Introduction
Extreme heat is among significant weather-related natural hazards globally, responsible for more human fatalities annually than floods, storms, or earthquakes in many temperate and semi-arid regions (Oke, 1982; IPCC, 2022). The 2003 European heatwave alone caused more than 70,000 excess deaths (Robine et al., 2008), and global climate projections indicate that the frequency, intensity, and duration of extreme thermal events will continue to escalate under all future emissions scenarios (IPCC, 2022). In response, the Sendai Framework for Disaster Risk Reduction 2015–2030 explicitly identifies extreme thermal events as a priority hazard and calls for enhanced risk assessment, early warning capabilities, and spatial governance to mitigate heat exposure (UNDRR., 2015; Aitsi-Selmi et al., 20215). However, extreme heat remains systematically under-represented in national disaster risk management (DRM) frameworks compared to rapid-onset hydro-meteorological hazards such as flash floods or tropical cyclones (Berrang-Ford et al., 2021; Campbell et al., 2018).
The Urban Heat Island (UHI) effect, wherein built environments exhibit persistently higher temperatures than surrounding rural landscapes, is a well-established driver of urban heat vulnerability (Oke, 1982; Voogt & Oke, 2003; Imhoff et al., 2010). Broad remote sensing literature has extensively documented how urban impervious surfaces alter surface radiative balance, energy partitioning, and local atmospheric dynamics (Peng et al., 2012; Zhou et al., 2019; Zhao et al., 2014). Yet, while urban core properties are widely studied, the thermal dynamics occurring at the peri-urban and agricultural fringe have received disproportionately little attention in both thermal remote sensing and DRM policy (Berrang-Ford et al., 2021; Peng et al., 2012; Zhang et al., 2010). This oversight represents a critical gap. Globally, hundreds of medium and large cities are embedded within extensive agricultural basins where seasonal land management practices abruptly alter land surface characteristics across thousands of hectares adjacent to high-density populations.
In agricultural systems dominated by winter cereals or seasonal cash crops, the annual harvest marks an extreme biophysical transition. Prior to harvest, dense vegetative canopies maintain low surface temperatures through shading and robust rates of evapotranspiration, the dominant latent heat flux mechanism transferring energy from the terrestrial surface to the atmosphere as water vapor (Kustas & Norman, 1996; Kalnay & Cai, 2003). Following harvest, the rapid removal of vegetation exposes dry, unshaded soil and crop residue. This sudden transition severely reduces latent heat flux, increases sensible heat flux, intervenes in surface albedo, and results in a rapid surge in Land Surface Temperature (LST) (Peng et al., Kustas & Norman, 1996; Zhang et al., 2009).
From a disaster risk perspective, the critical paradigm shift lies in recognizing that post-harvest thermal surges are not accidental, unpredictable weather events. Instead, they represent predictable spatial hazards tied directly to local agricultural calendars and phenology. Because crop maturity and harvest dates can be anticipated weeks in advance, the resulting spatial heat footprint can be integrated into proactive disaster preparedness and public health intervention frameworks, a temporal advantage rarely available for other natural hazards.
Satellite remote sensing provides the necessary spatial and temporal capabilities to monitor these fine-scale surface transitions (Voogt & Oke, 2003; Wan, 2014). Instruments such as the Landsat 8/9 Operational Land Imager (OLI) and Thermal Infrared Sensor (TIRS) deliver 30-meter thermal retrievals optimal for evaluating field and neighborhood-level temperature variations (Roy et al., 2014). Concurrently, European Space Agency (ESA) Sentinel-2 Multispectral Instrument (MSI) data provide high-resolution spectral indices, including the Normalized Difference Vegetation Index (NDVI) and Normalized Difference Moisture Index (NDMI) (Strashok et al., 2022; Gao, 1996). Cloud computing platforms like Google Earth Engine (GEE) further enable multi-year, open-access, and globally reproducible spatiotemporal processing across these large Earth observation data streams (Feizizadeh et al., 2023, Omarzadeh et al., 2021).
Despite growing recognition of urban-rural thermal interactions, multi-year empirical studies that quantitatively link agricultural harvest transitions to urban heat exposure within an explicit DRM and Sendai Framework context remain scarce. To address this gap, this study investigates the multi-year (2020–2026) pre- and post-harvest thermal dynamics around the city of Lleida, Spain as a representative Mediterranean city embedded within an intensive agricultural plain.
The specific objectives of this study are:
- Quantify LST Surges: Evaluate the magnitude and inter-annual variability of LST change in the peri-urban agricultural matrix before and after harvest across seven consecutive years (2020–2026).
- Identify Thermodynamic Drivers: Conduct co-registered, pixel-wise correlation analyses between LST and multi-spectral indicators of canopy density (NDVI), surface moisture (NDMI), and bare soil exposure (SWIR) to isolate the biophysical drivers of heating.
- Assess Urban Exposure: Measure city-level thermal exposure relative to local emergency public health risk thresholds.
- Advance DRM Practice: Translate empirical satellite observations into actionable early warning and spatial governance recommendations aligned with Sendai Framework Priorities 1 and 4.
2. Study Area
The study area is centered on the city of Lleida and its surrounding agricultural hinterland, located in the western region of Catalonia (Figure 1). Lleida is a mid-sized European city with a municipal population of approximately 140,000 residents. The urban area is situated in the central depression of the Ebro River basin, sitting along the Segre River at an average elevation of 150 meters above sea level.
The surrounding plain (the Pla de Lleida) is one of Spain’s most intensive agricultural hubs. The agricultural landscape is dominated by winter cereal crops, primarily barley (Hordeum vulgare) and wheat (Triticum aestivum), interspersed with irrigated fruit orchards. Winter cereals follow a strict annual phenological cycle: sowing occurs between October and December, rapid vegetative growth and canopy closure peak between April and May, and harvest takes place rapidly between late June and mid-July. This phenological sequence causes an abrupt, spatially broad transformation from dense green canopies (high NDVI, high evapotranspiration) to fully exposed bare soil and crop stubble across thousands of contiguous hectares adjacent to the urban fringe (Kalnay and Cai, 2003).
Climatically, the region falls under a semi-arid Mediterranean climate (Köppen-Geiger., 2006; Martınez et al., 2008), characterized by hot, dry summers and low annual precipitation. Summer maximum air temperatures frequently exceed 35 °C during synoptic heatwaves, creating elevated baseline thermal stress for urban residents (WHO, 2023; IPCC, 2022). The region’s low cloud cover during summer months ensures high thermal infrared clarity for satellite remote sensing acquisitions (Roy et al., 2014; Wan, 2014).
From a DRM perspective, Lleida serves as an ideal representative benchmark. Hundreds of small to medium-sized cities globally, across the Po Valley (Italy), the Ebro Basin (Spain), the Central Valley (USA), the Indo-Gangetic Plain (India), and the Nile Basin (Egypt), share this similar urban-agricultural layout where post-harvest land management directly borders vulnerable urban populations (Peng et al., 2012; Zhou et al., 2019).
3. Methodology
To capture the biophysical conditions before and after the annual harvest, a multi-sensor dataset spanning seven consecutive years (2020–2026) was constructed using open-access Earth Observation data.
Landsat 8 and 9 Collection 2 Level 2 Surface Temperature products were acquired via USGS EarthExplorer and Google Earth Engine (Gorelick et al., 2017; Roy et al., 2014). Atmospheric corrections were performed using the USGS internal algorithm based on MODIS atmospheric profiles and the MODTRAN radiative transfer model (Wan, 2014). Scenes were selected for two distinct phenological windows each year:
- Pre-Harvest (Vegetated Baseline): Late April to mid-May (peak canopy cover and maximum evapotranspiration).
- Post-Harvest (Bare Soil Transition): Early July to late July (complete vegetative removal).
To derive high-resolution vegetation and canopy moisture metrics, European Space Agency (ESA) Sentinel-2 Level-2A (MSI) Surface Reflectance imagery co-located within days of the Landsat acquisitions was ingested (Lastovicka et al., 2020).
3.1. Land Surface Temperature (LST) Calculation
Digital numbers from Landsat Thermal Infrared Sensor Band 10 (ST_B10) were converted to physical units of Land Surface Temperature (, in °C) using the official USGS Collection 2 linear transformation parameters (Roy et al., 2014; Wan, 2014):
where is the raw digital number of the thermal band, is the multiplicative scale factor, is the additive offset factor, and converts absolute temperature from Kelvin to Celsius.
3.2. Spectral Index Computation
Three complementary optical indices were derived from Sentinel-2 Surface Reflectance () bands:
- Normalized Difference Vegetation Index (NDVI): Quantifies canopy greenness using Red (, 665 nm) and Near-Infrared (, 842 nm) reflectance (Gao, 1996):
- Normalized Difference Moisture Index (NDMI): Measures canopy liquid water content by contrasting Near-Infrared () with Short-Wave Infrared 1 (, 1610 nm) (Gao, 1996):
- Short-Wave Infrared Reflectance (SWIR-2): Serves as a direct proxy for exposed dry bare soil and crop residue abundance using Band 12 (, 2190 nm) (Zhang et al., 2009).
Because Sentinel-2 spectral indices are produced at native 10 m resolution, while Landsat thermal retrievals are resampled to 30 m spatial resolution, spatial harmonization was necessary to perform valid pixel-by-pixel comparisons. All Sentinel-2 derived rasters were reprojected onto the Landsat reference grid (UTM Zone 31N, WGS84 Datum) at a uniform 30 m pixel spacing using bilinear spatial interpolation.
3.3. Statistical Analysis and Thermal Drivers
To isolate the biophysical factors governing the post-harvest heat surge, bivariate Pearson correlation coefficients () were computed across all the study domain:
where represents the target Land Surface Temperature (), represents the co-registered biophysical spectral index (, , or ), and and denote their respective spatial means across all valid pixels.
3.4. Disaster Risk Management (DRM) Integration Framework
To translate thermal remote sensing measurements into actionable disaster risk intelligence aligned with the Sendai Framework for Disaster Risk Reduction 2015-2030 (UNDRR, 2015), post-harvest LST values were cross-referenced against regional public health emergency thresholds:
Moderate Thermal Stress:
Severe Heat Warning:
Extreme Thermal Hazard:
4. Results
The spatial maps consistently reveal a coherent and physically interpretable pattern of land surface change across all years studied (Figure 2 1 to 7). In the pre-harvest period, the agricultural zone surrounding the city was characterized by dense, spatially extensive green canopy cover, reflected in high NDVI values that dominate the landscape. This vegetated state is mirrored in the NDMI maps, which show broadly positive moisture values across the same agricultural parcels, confirming that canopy water content is high during the growing season. Correspondingly, SWIR reflectance remains low and spatially homogeneous before harvest, consistent with the strong absorption of shortwave infrared radiation by moist, healthy vegetation. Pre-harvest LST follows the same spatial logic, with the agricultural zone exhibiting relatively cool surface temperatures and only the urban core of Lleida standing out as a marginally warmer patch against the surrounding vegetated landscape.
Following harvest, every variable undergoes a striking and spatially coherent reversal that is visually unambiguous across all seven years of the study period. NDVI collapses across the agricultural parcels, with the dense green canopy replaced by sparse, fragmented green patches concentrated in irrigation canals, orchards, and un-harvested remnants, the contrast between pre and post-harvest NDVI is among the most visually compelling features of the maps and requires no statistical analysis to perceive. NDMI follows NDVI closely in both spatial pattern and direction of chang showing the high-moisture agricultural zone transitions to predominantly dry, low-moisture values after harvest, making NDMI effectively a spatial mirror of the NDVI signal throughout the study period. SWIR reflectance behaves as the inverse of NDMI, increasing markedly across the harvested zone as dry soil and cereal residue replace moist green canopy, the spatial alignment between SWIR increase and NDMI decrease is tight and consistent across all years, confirming that the two indices are measuring opposite ends of the same vegetation-moisture continuum at the landscape scale.
LST tells the same story from a thermal perspective. The post-harvest LST maps show a dramatic and spatially extensive increase across the agricultural zone in every single year studied, with the heating pattern aligning almost precisely with the areas of greatest NDVI and NDMI decline and greatest SWIR increase. The correspondence between LST and SWIR is particularly striking in the spatial maps, the two variables track each other consistently year after year, with the warmest pixels coinciding with the highest SWIR reflectance values and the lowest vegetation/moisture index values. This spatial alignment is not a statistical abstraction; it is directly visible in the maps as a coherent, landscape-scale pattern repeated reliably across the entire study period, providing strong visual corroboration of the pixel-wise correlation analysis and underpinning the central argument that harvest-driven vegetation and moisture loss is the primary spatial driver of post-harvest surface heating in the study area.
Figure 2.
1. 2020.
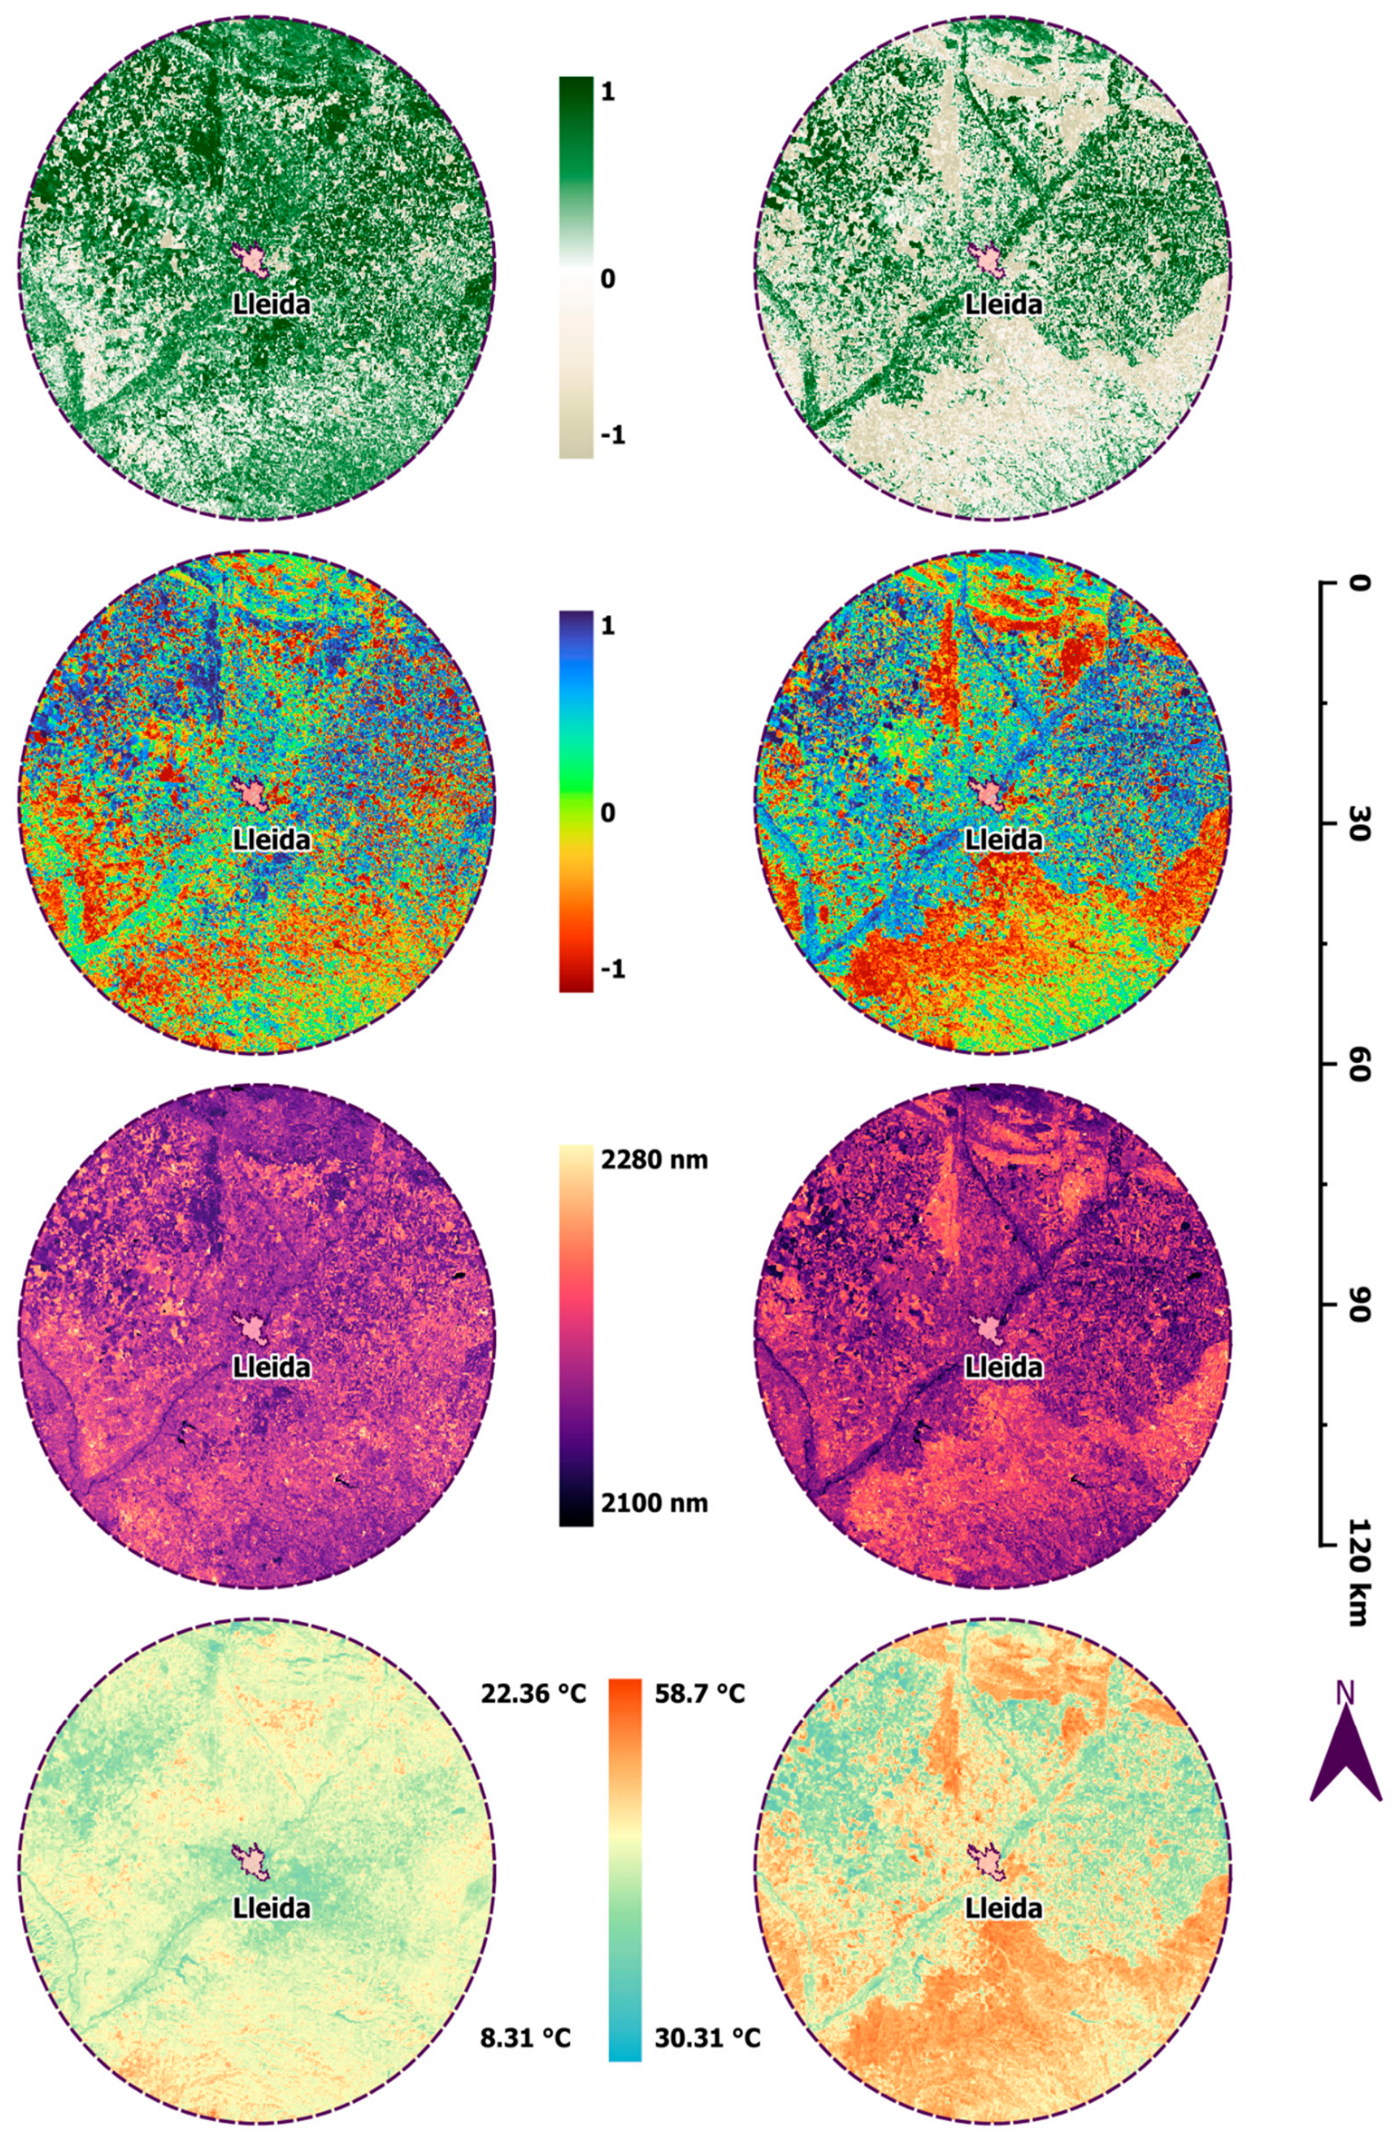
Figure 2.
2. 2021.
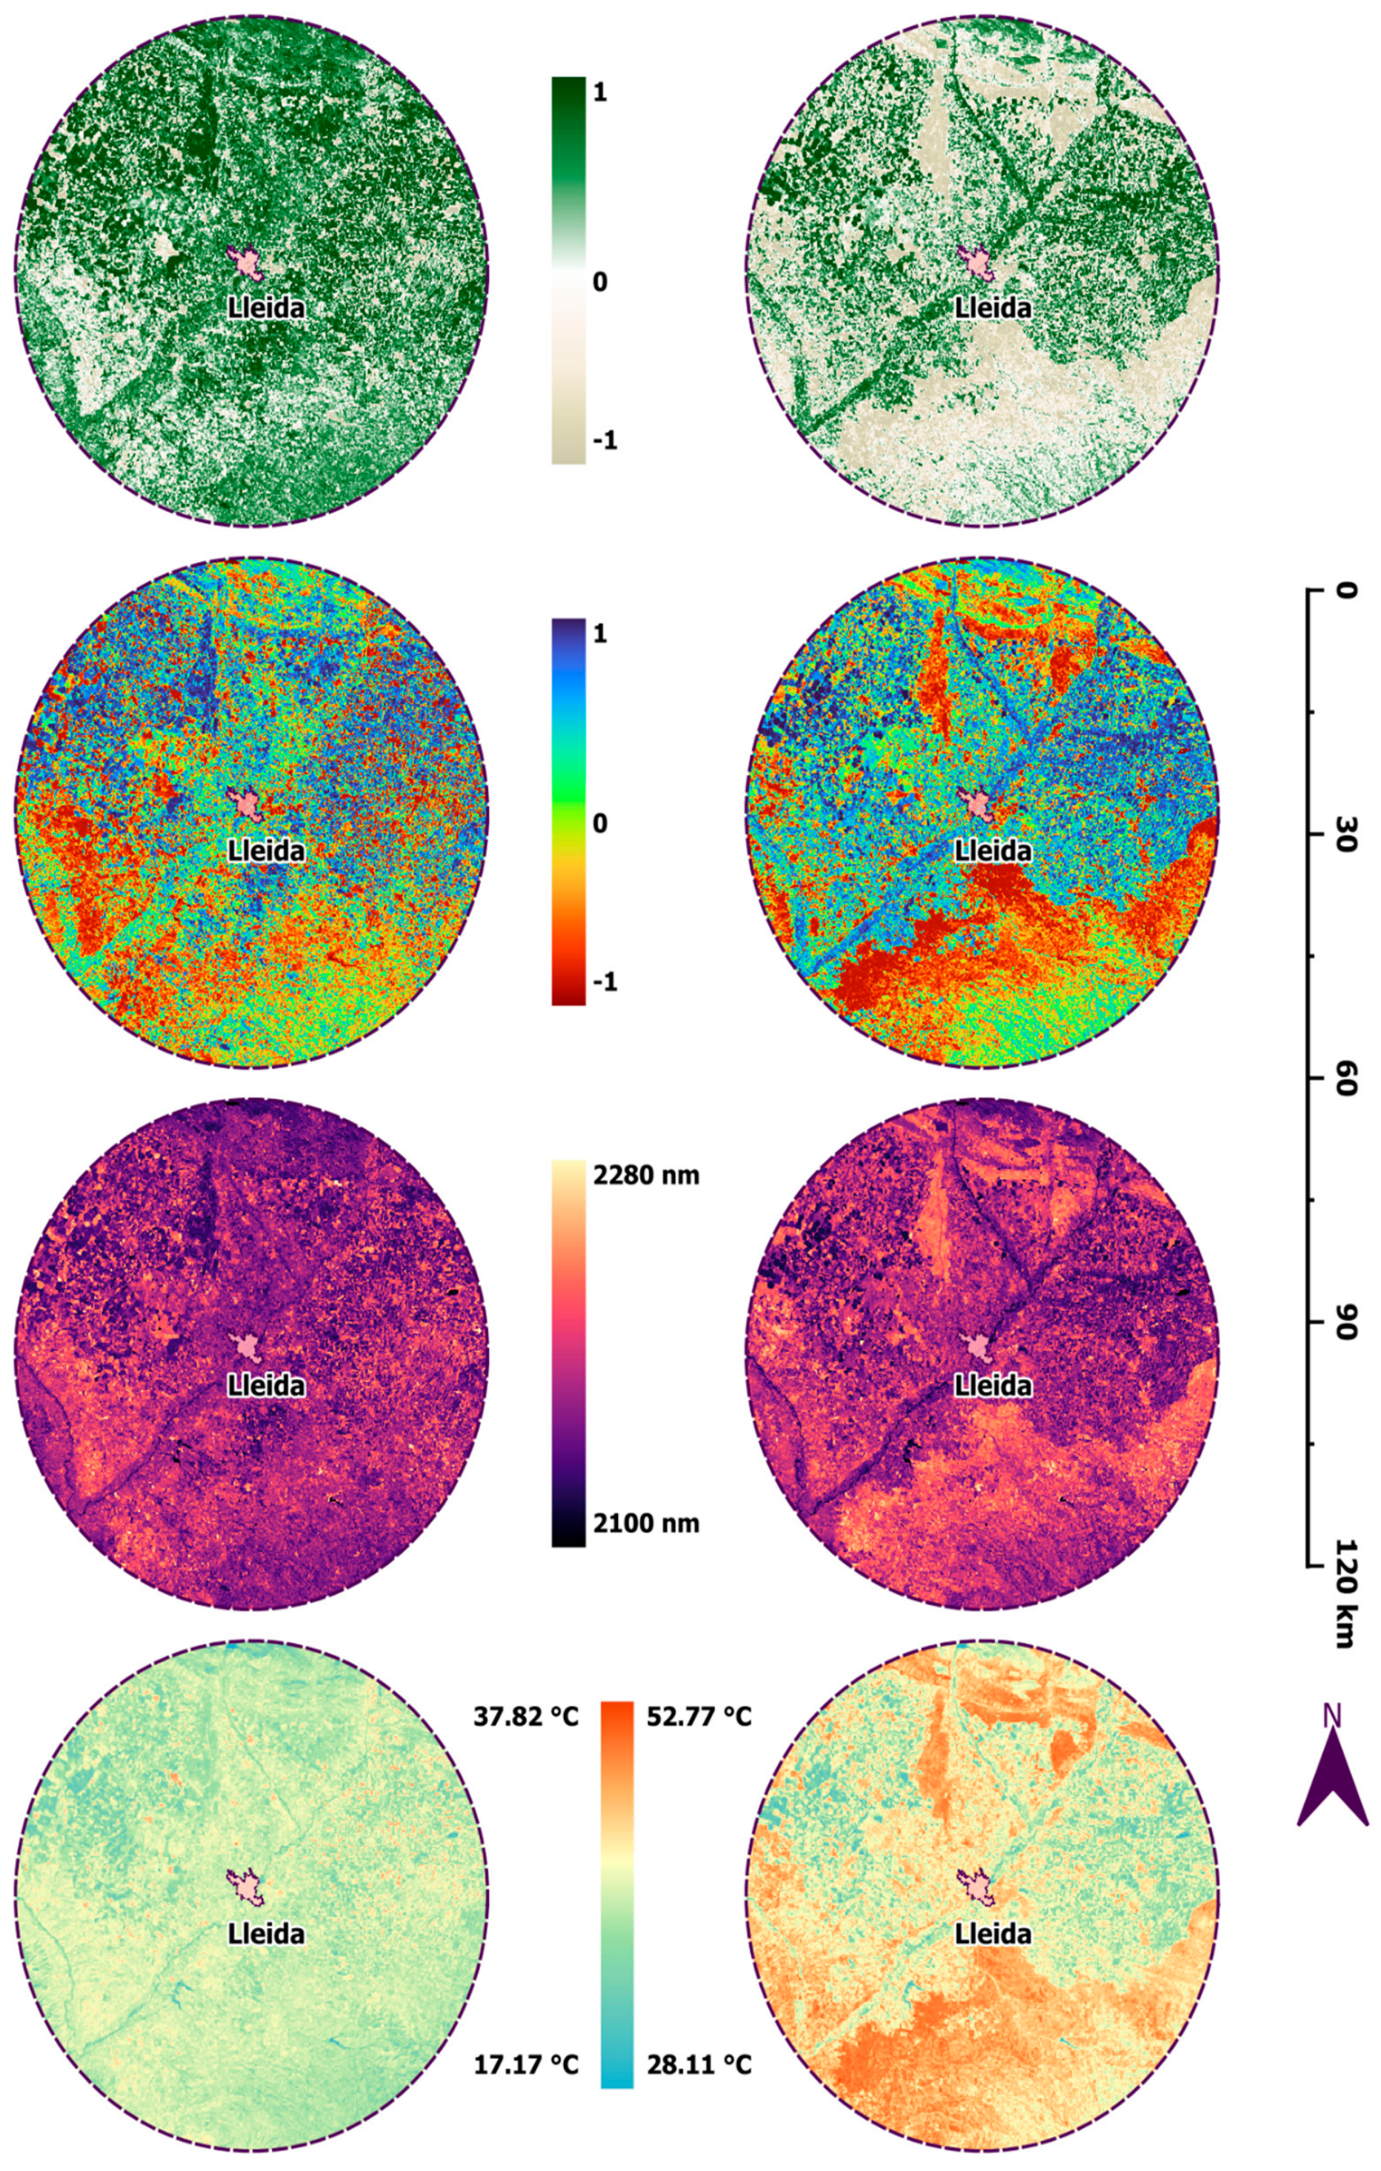
Figure 2.
3. 2022.
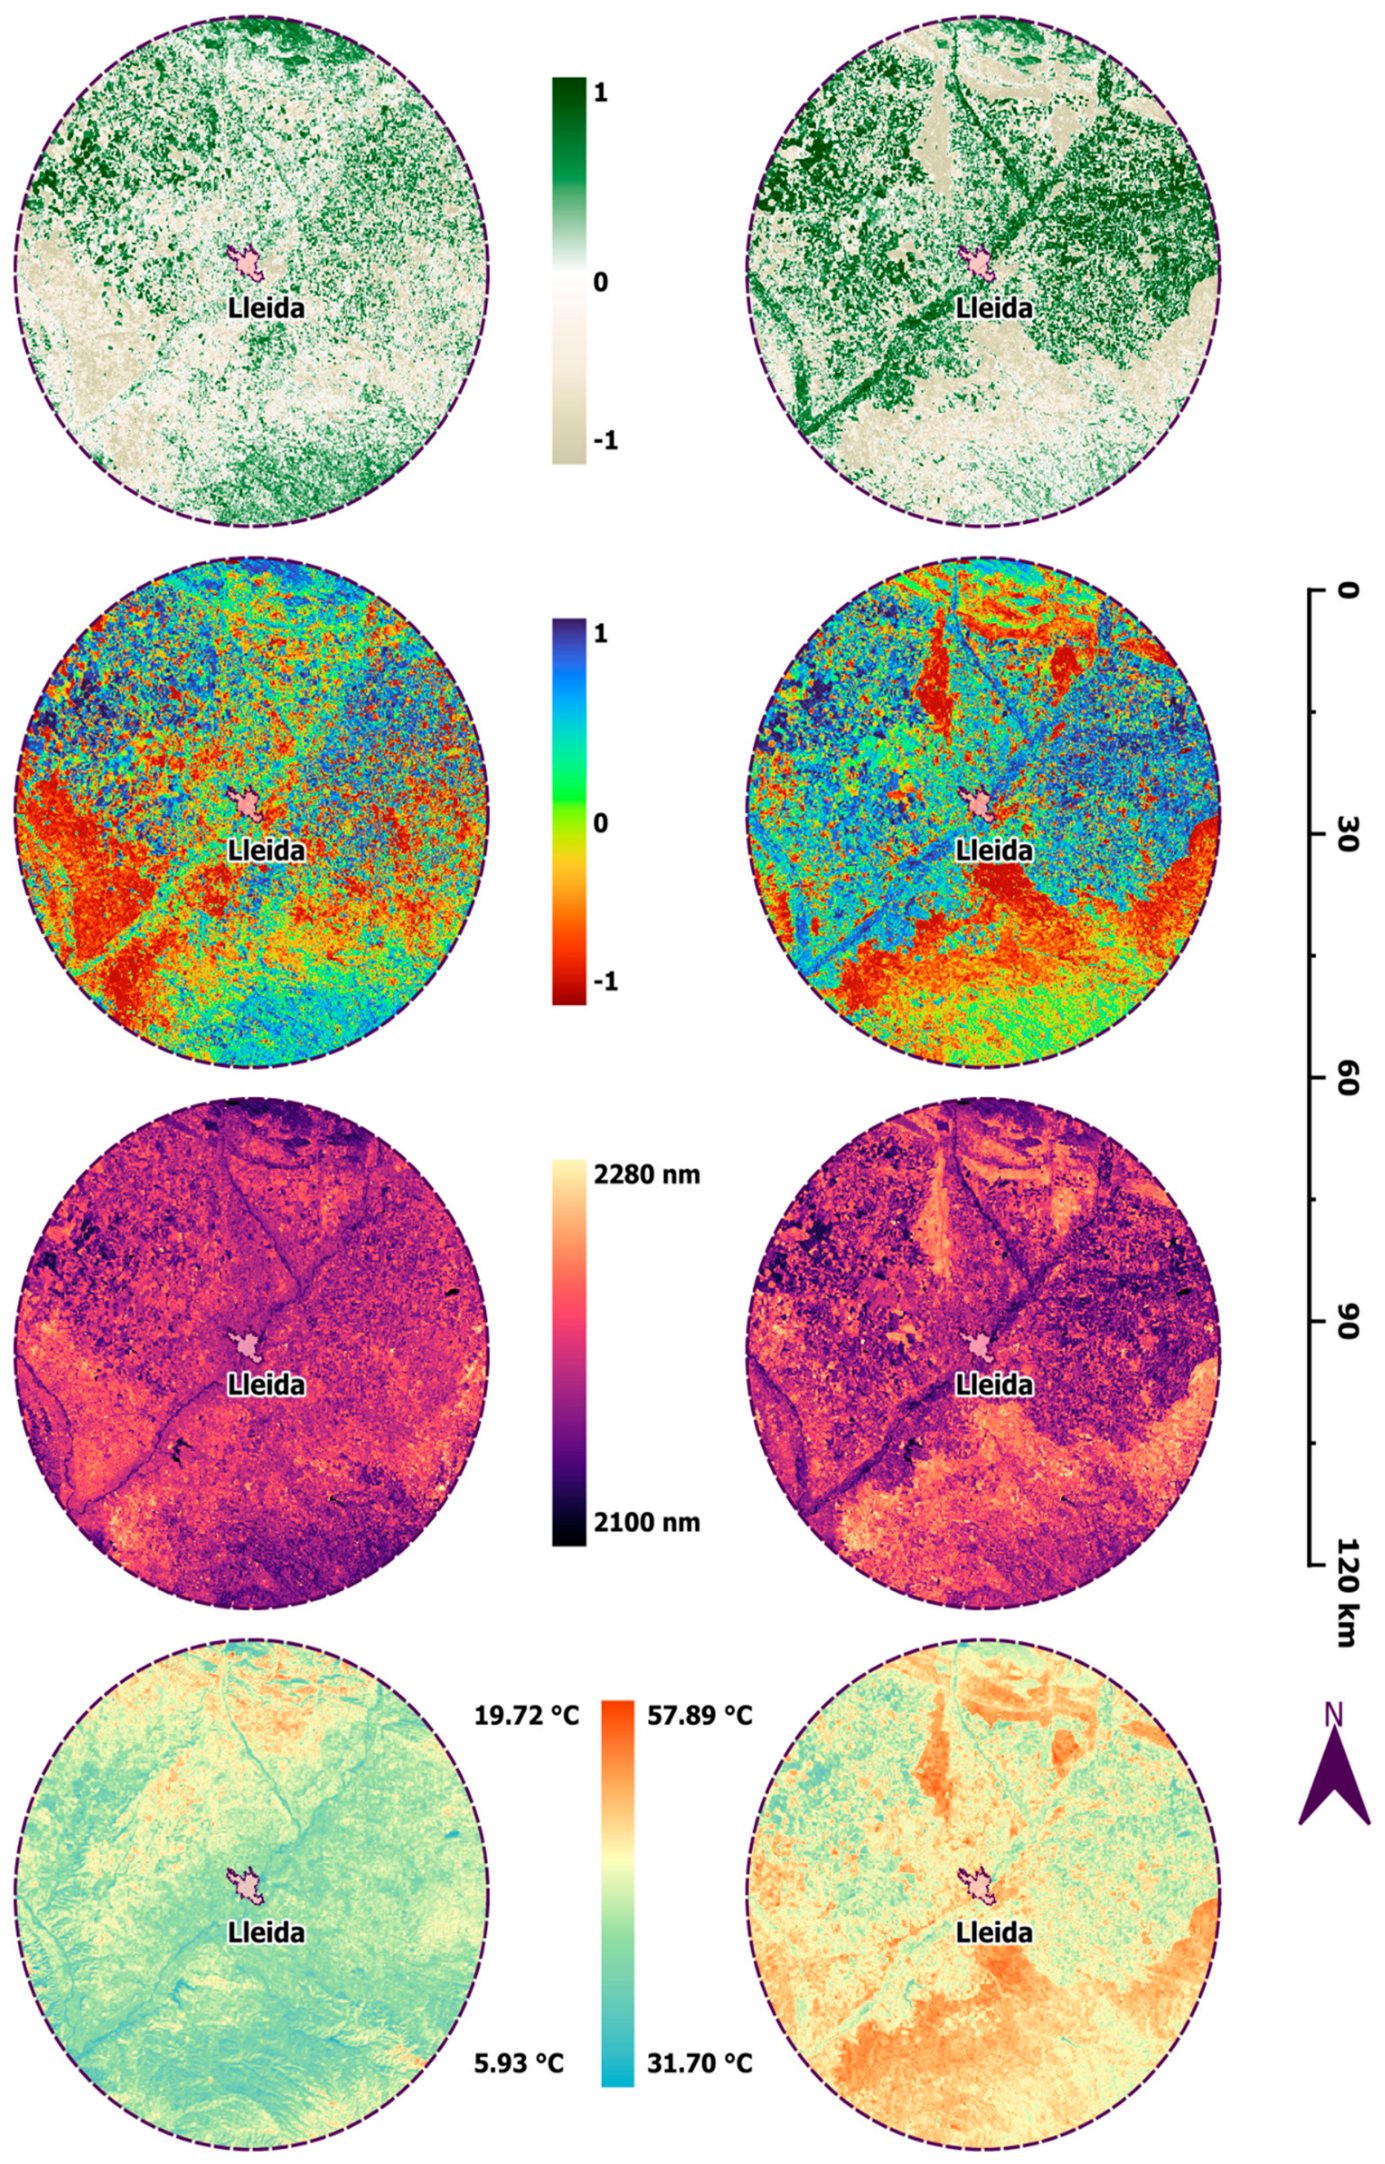
Figure 2.
4. 2023.
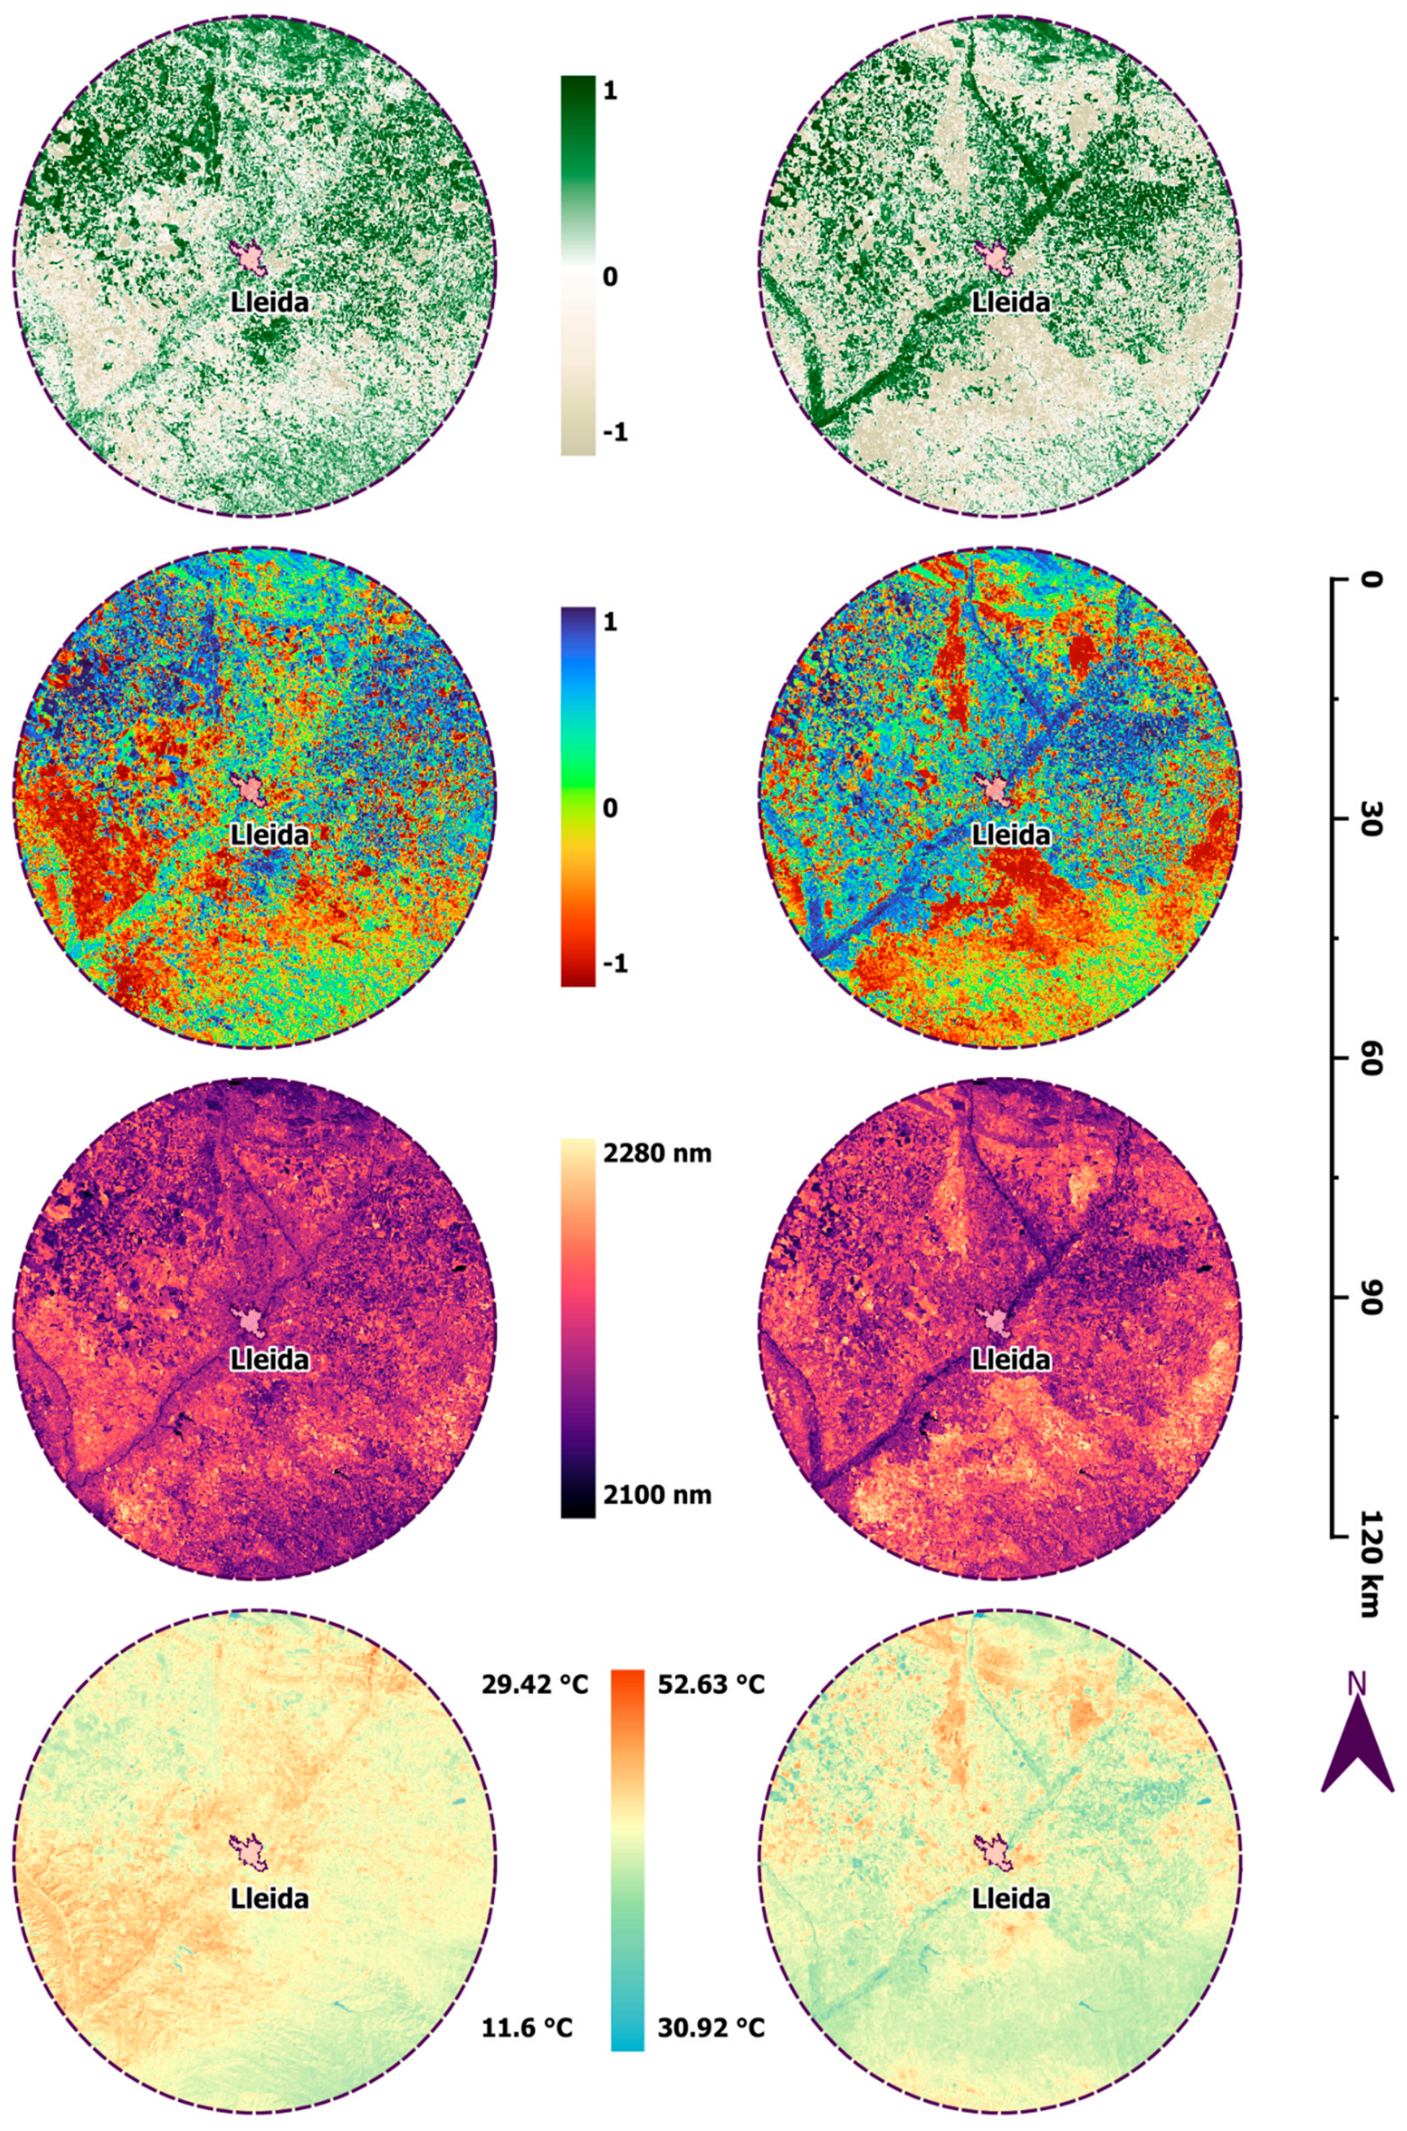
Figure 2.
5. 2024.
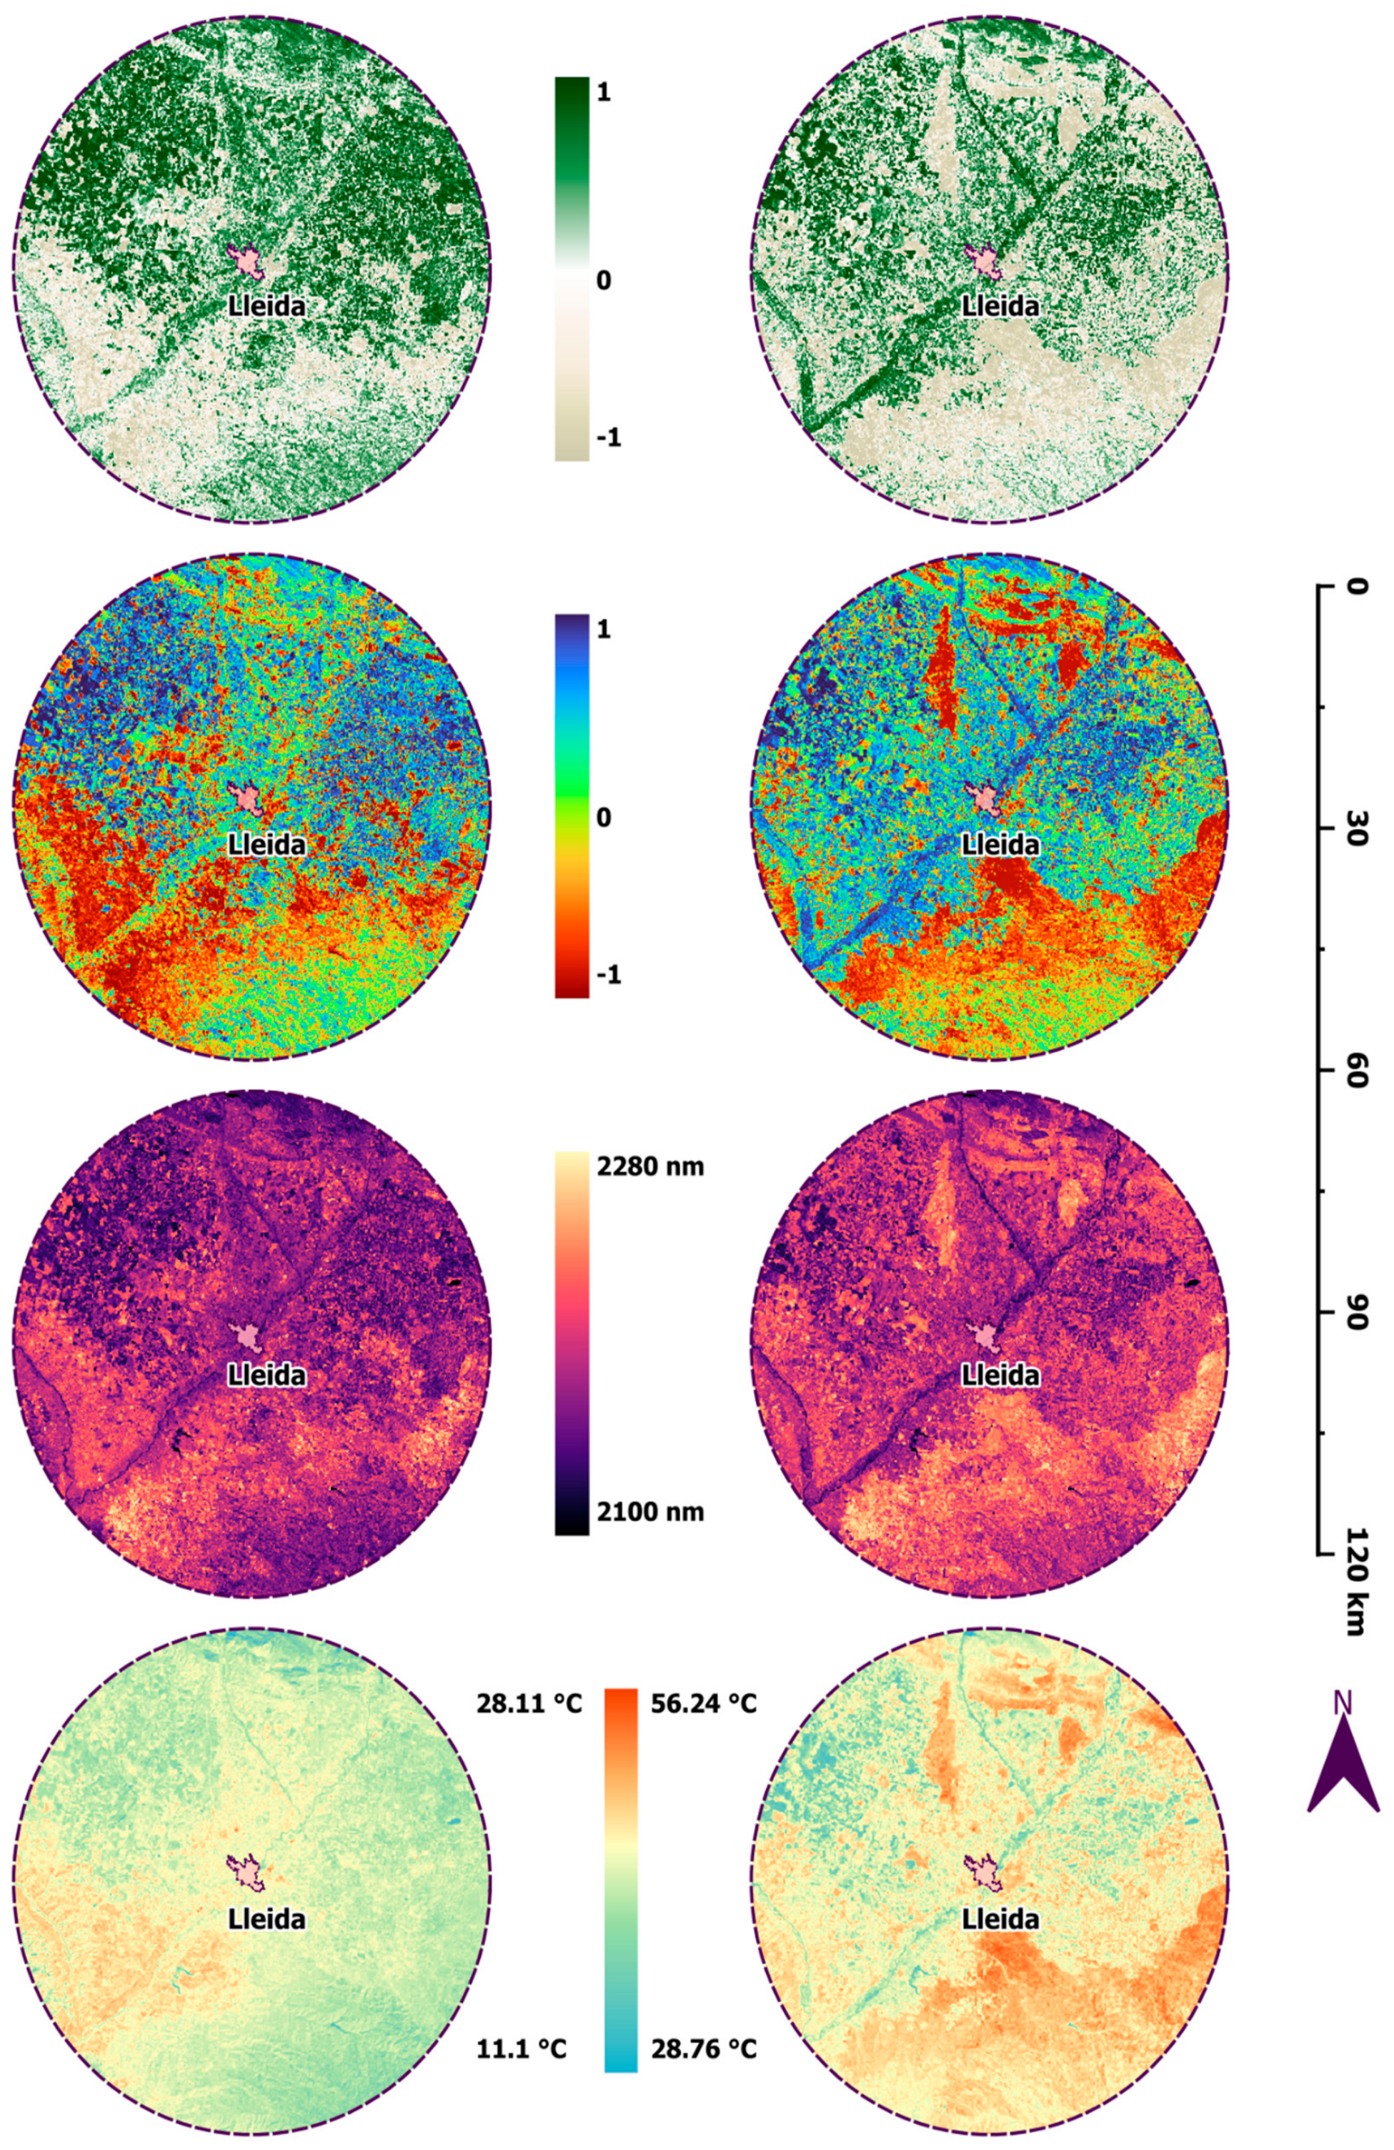
Figure 2.
6. 2025.
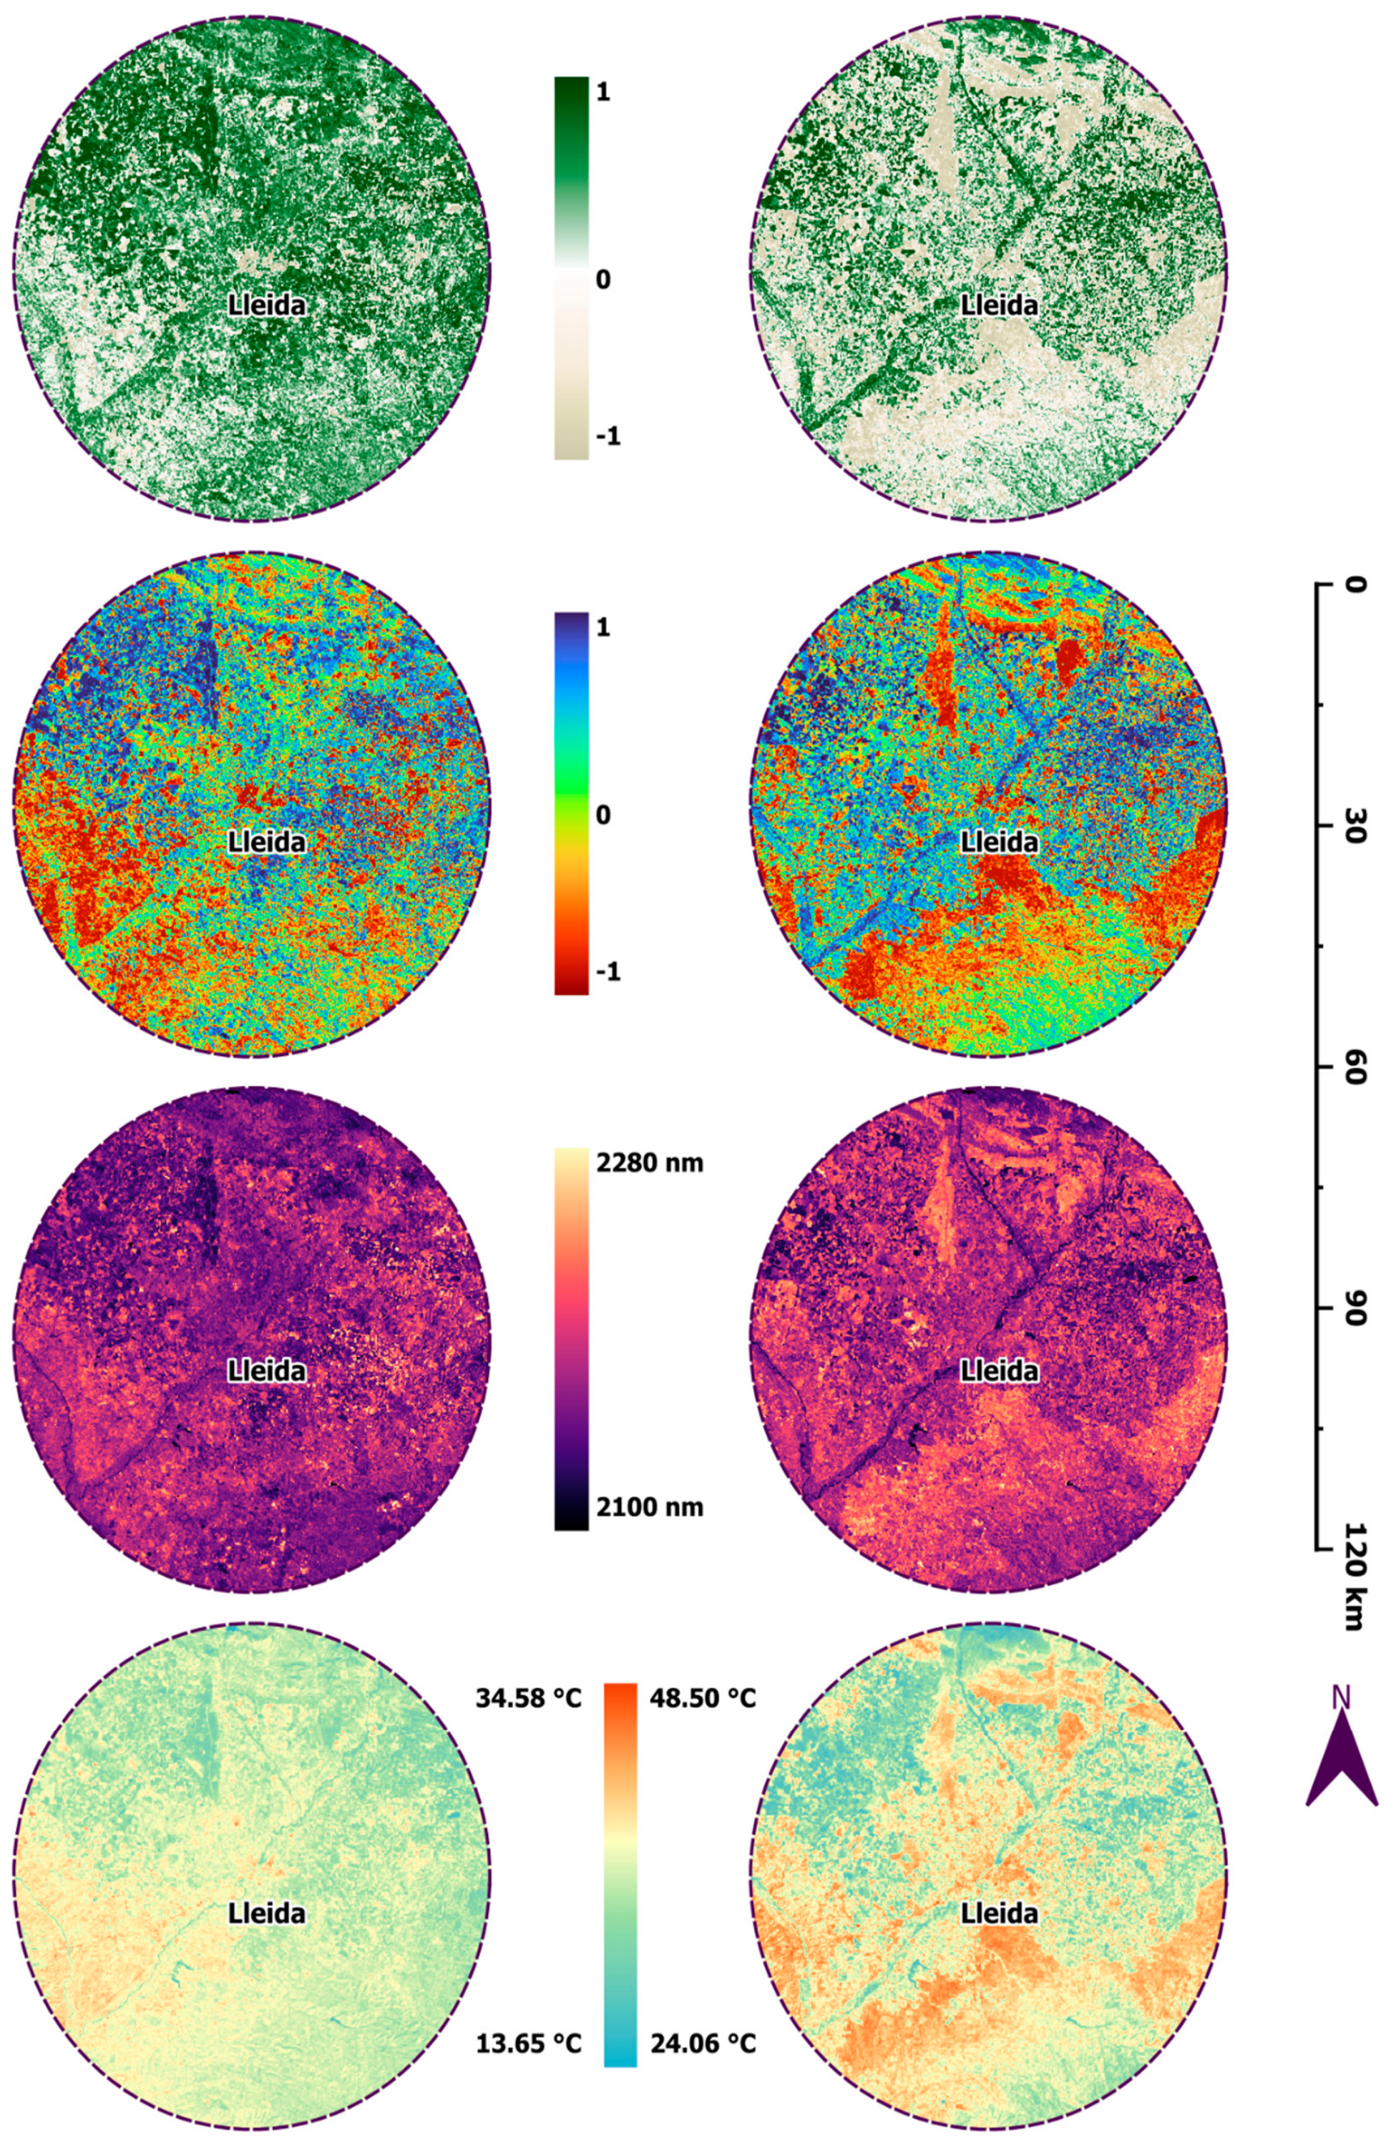
Figure 2.
7. 2026.
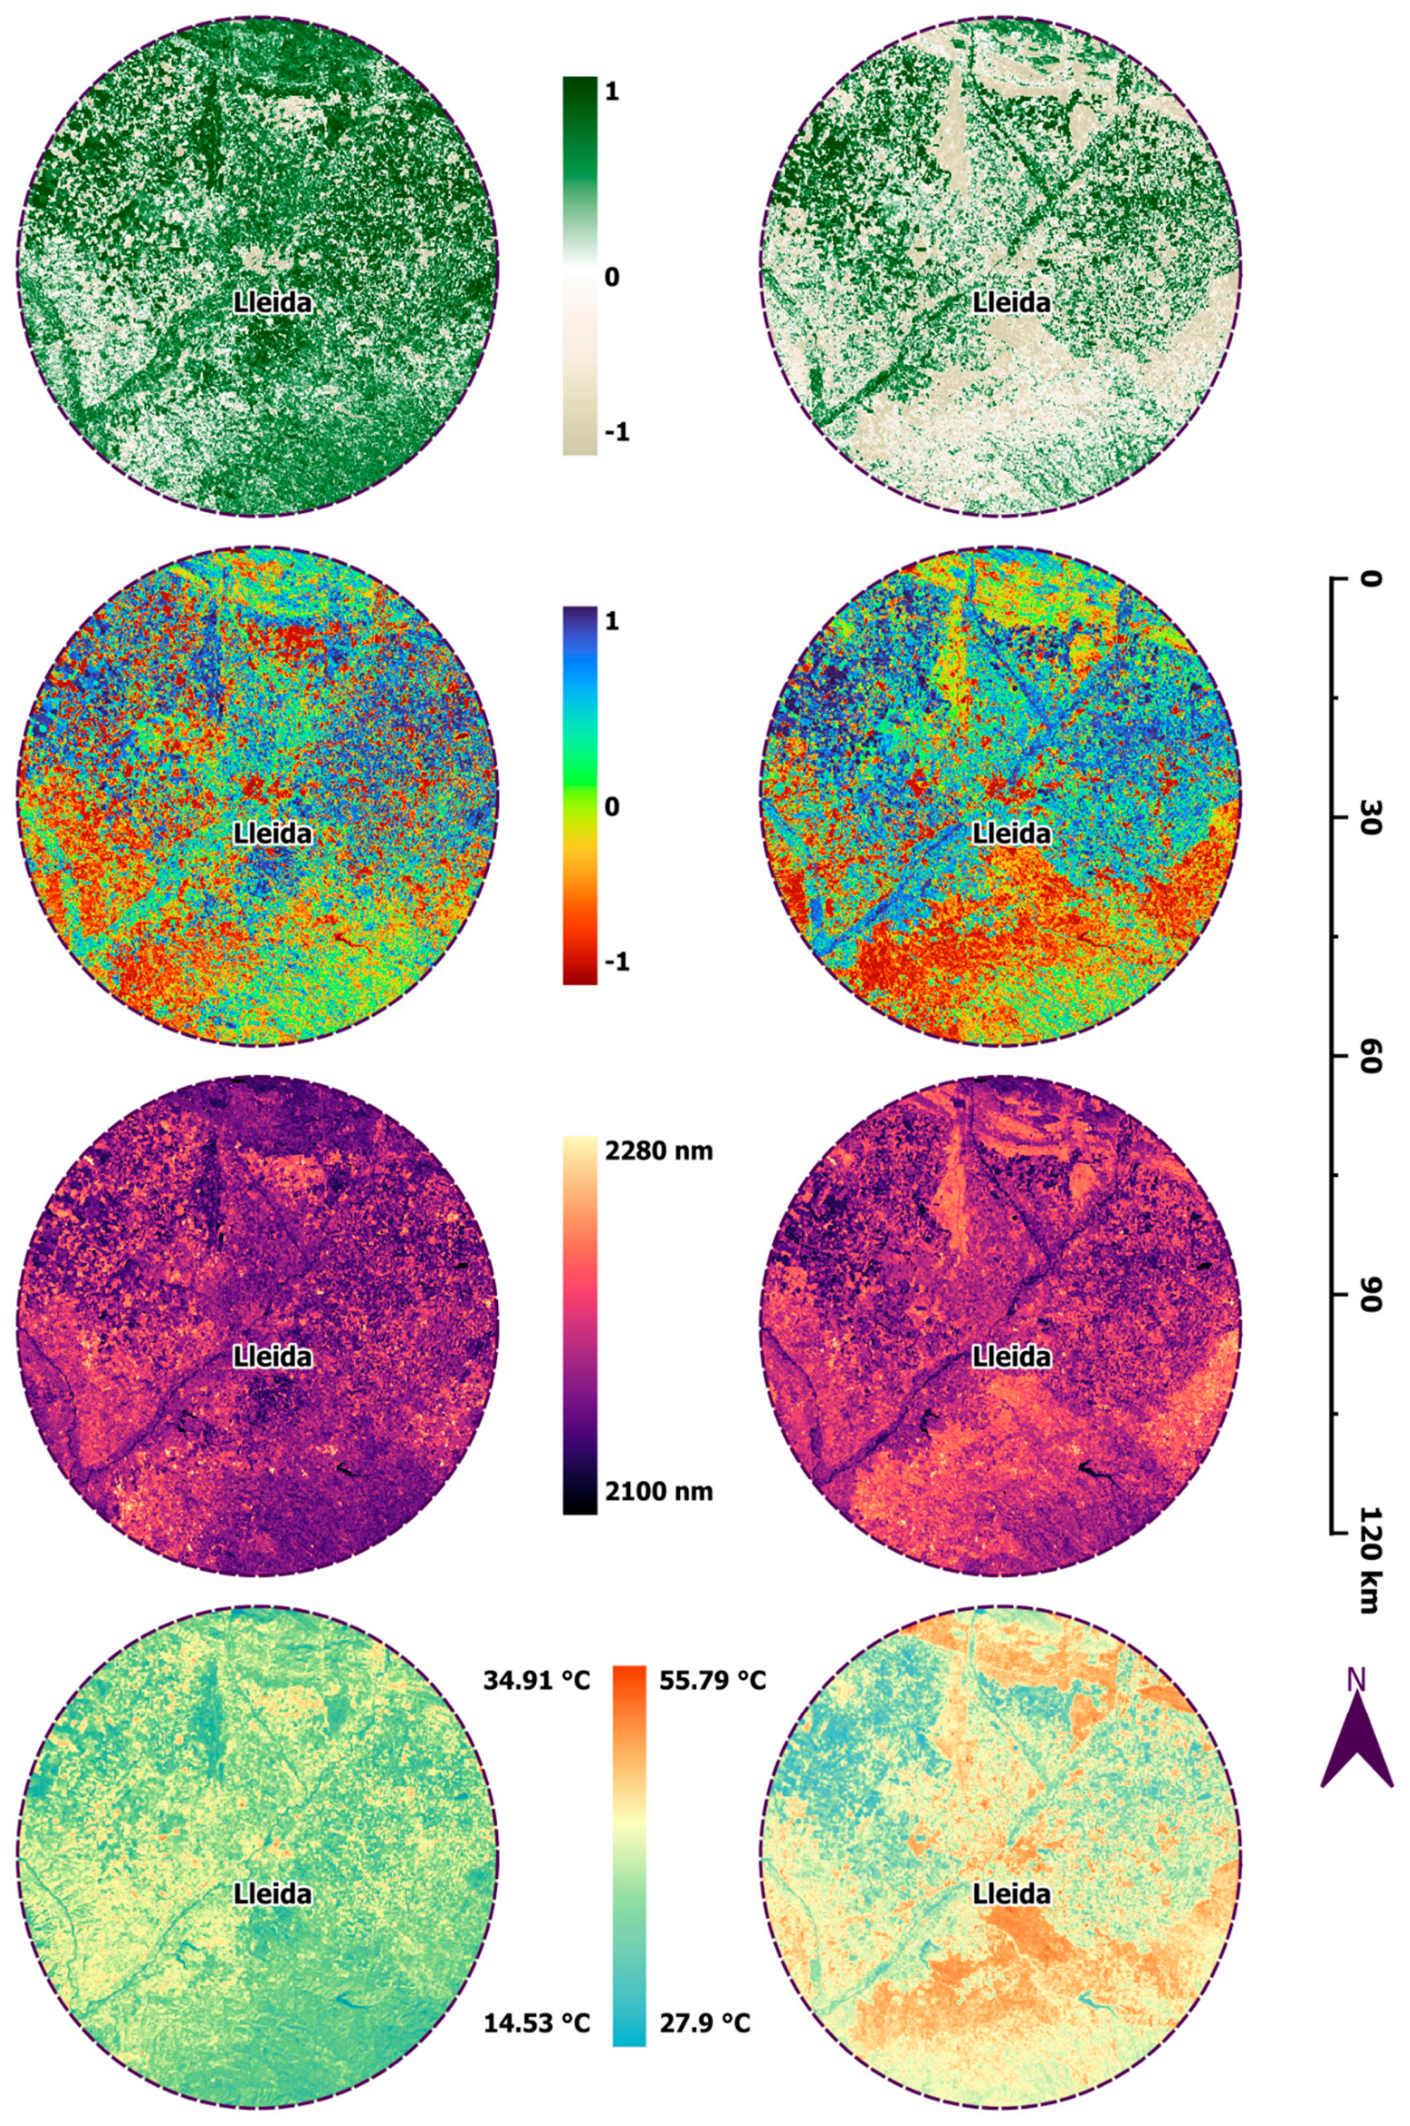
The seven-year satellite evaluation reveals a striking and highly consistent post-harvest thermal transformation across both the agricultural hinterland and the urban core of Lleida (Figure 3).
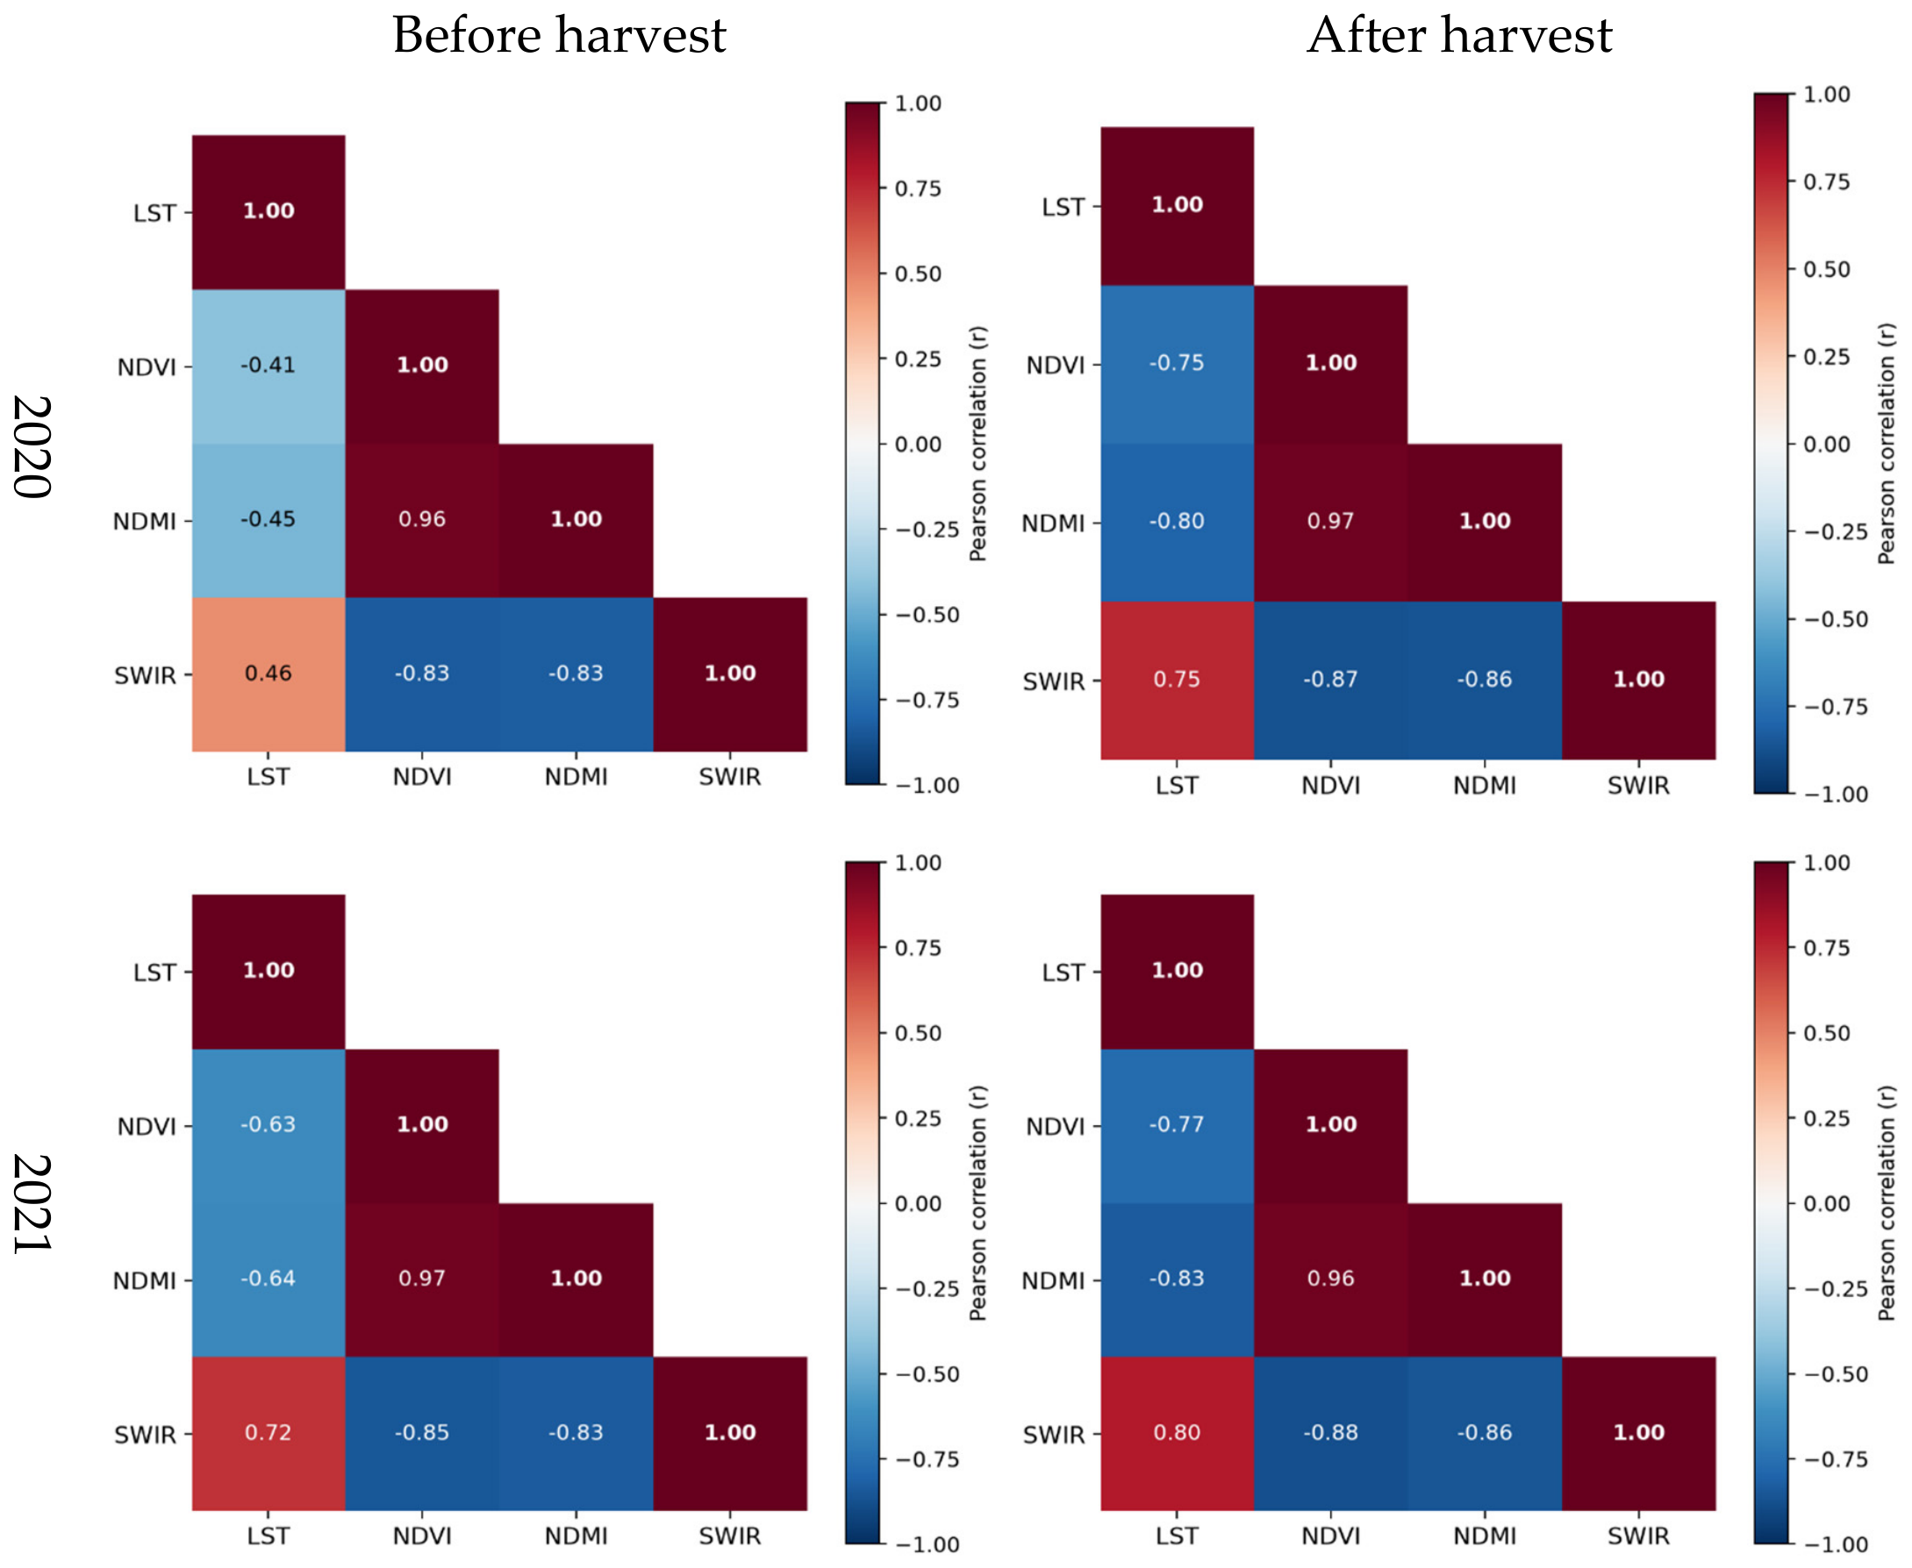
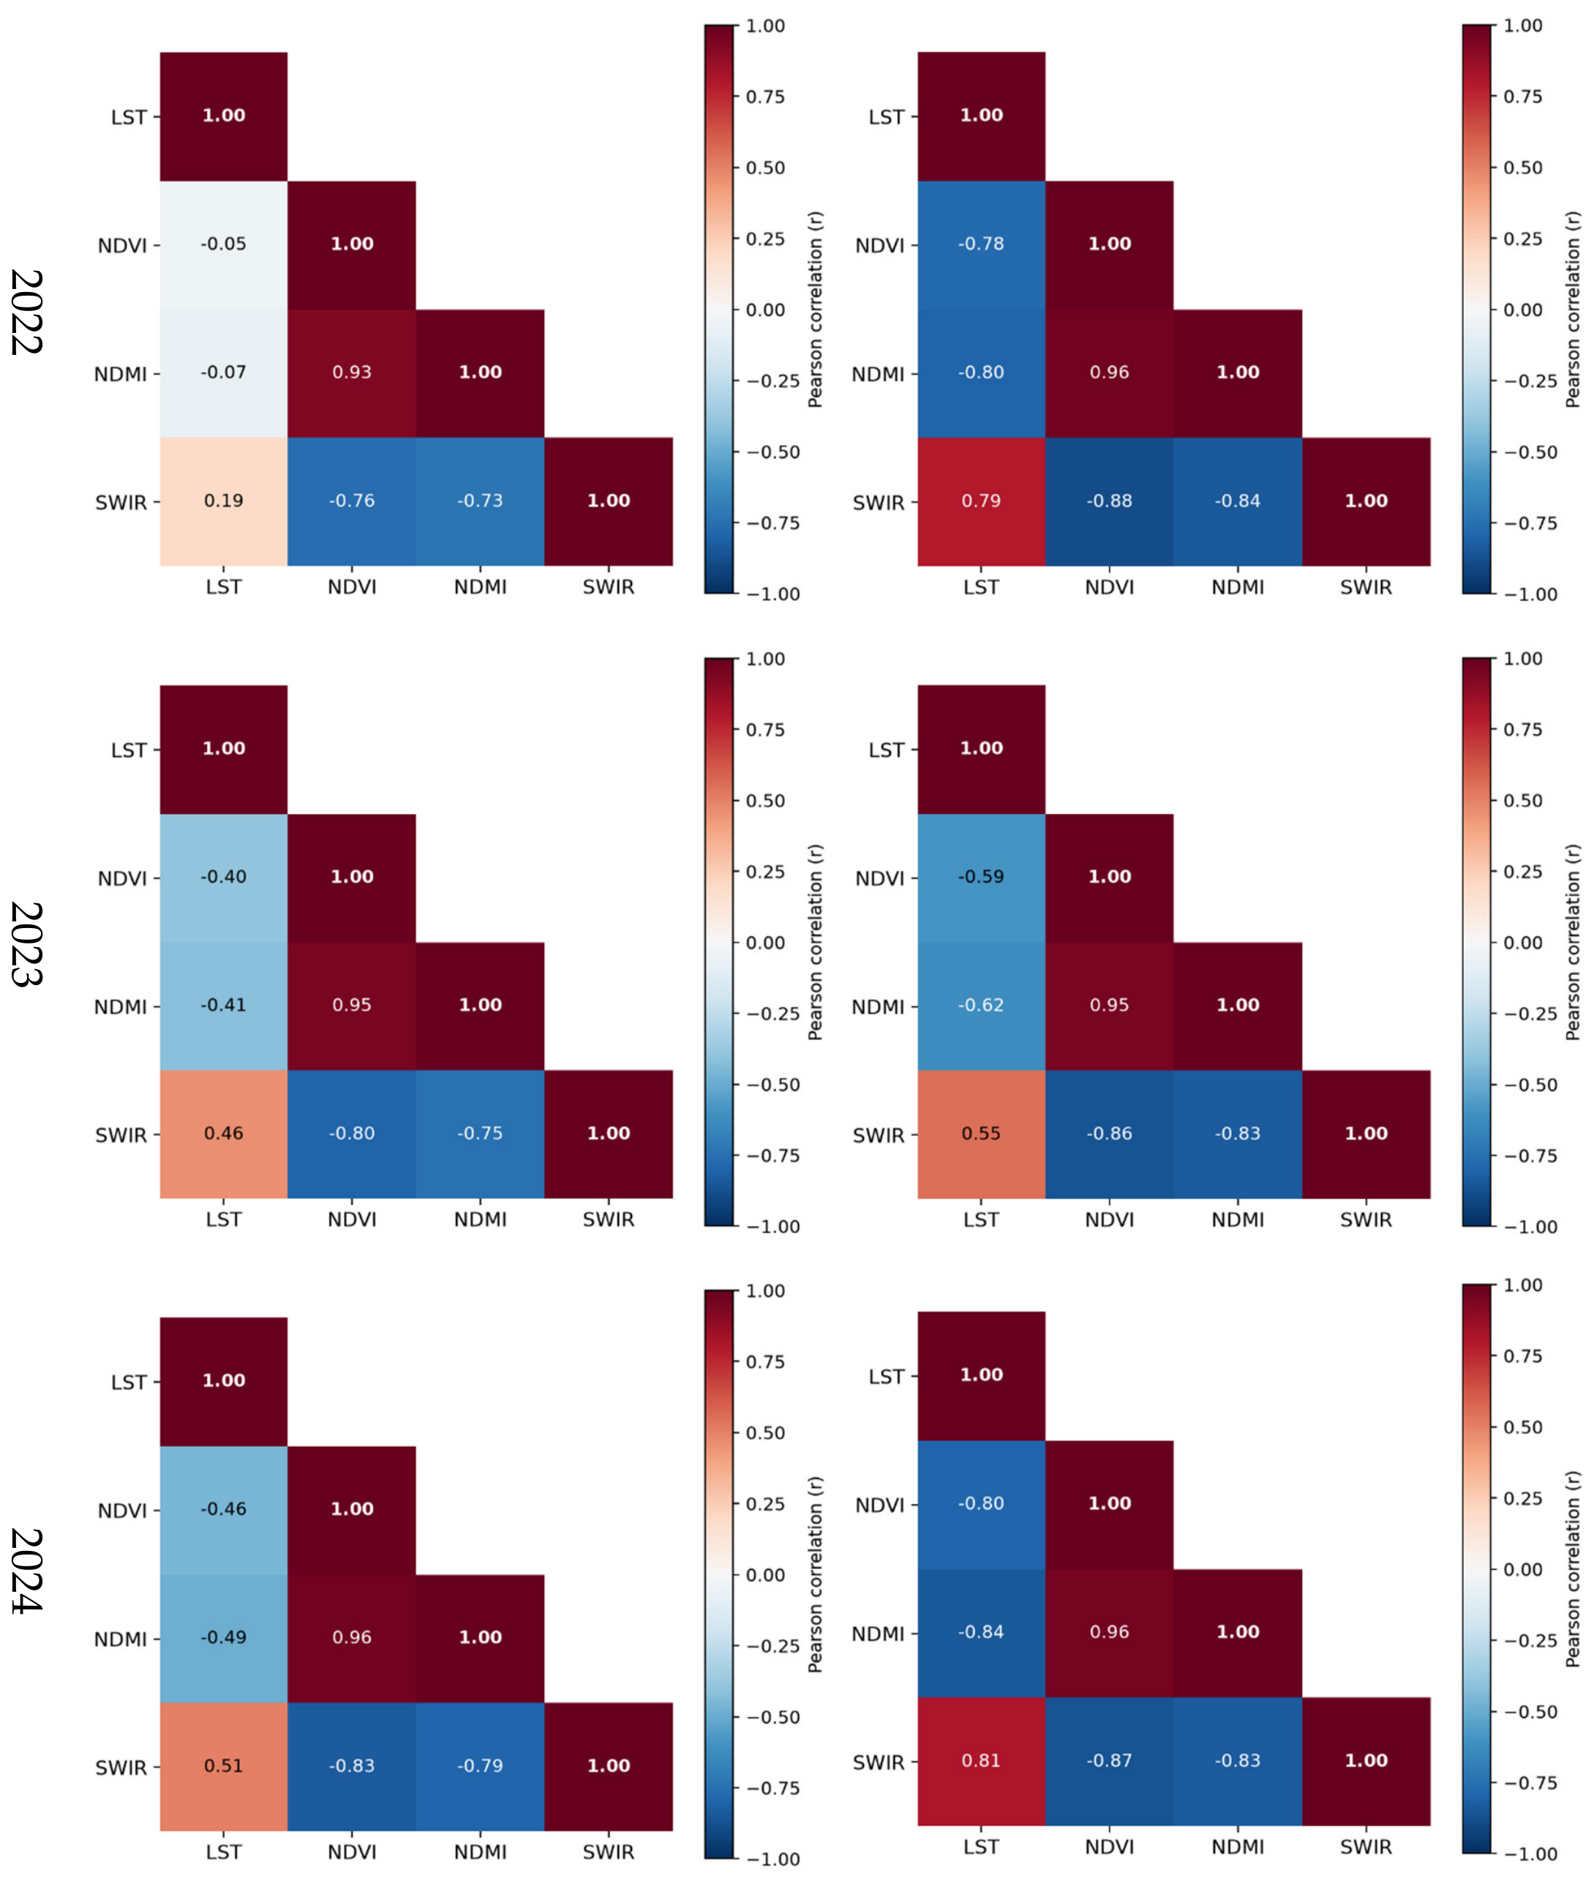
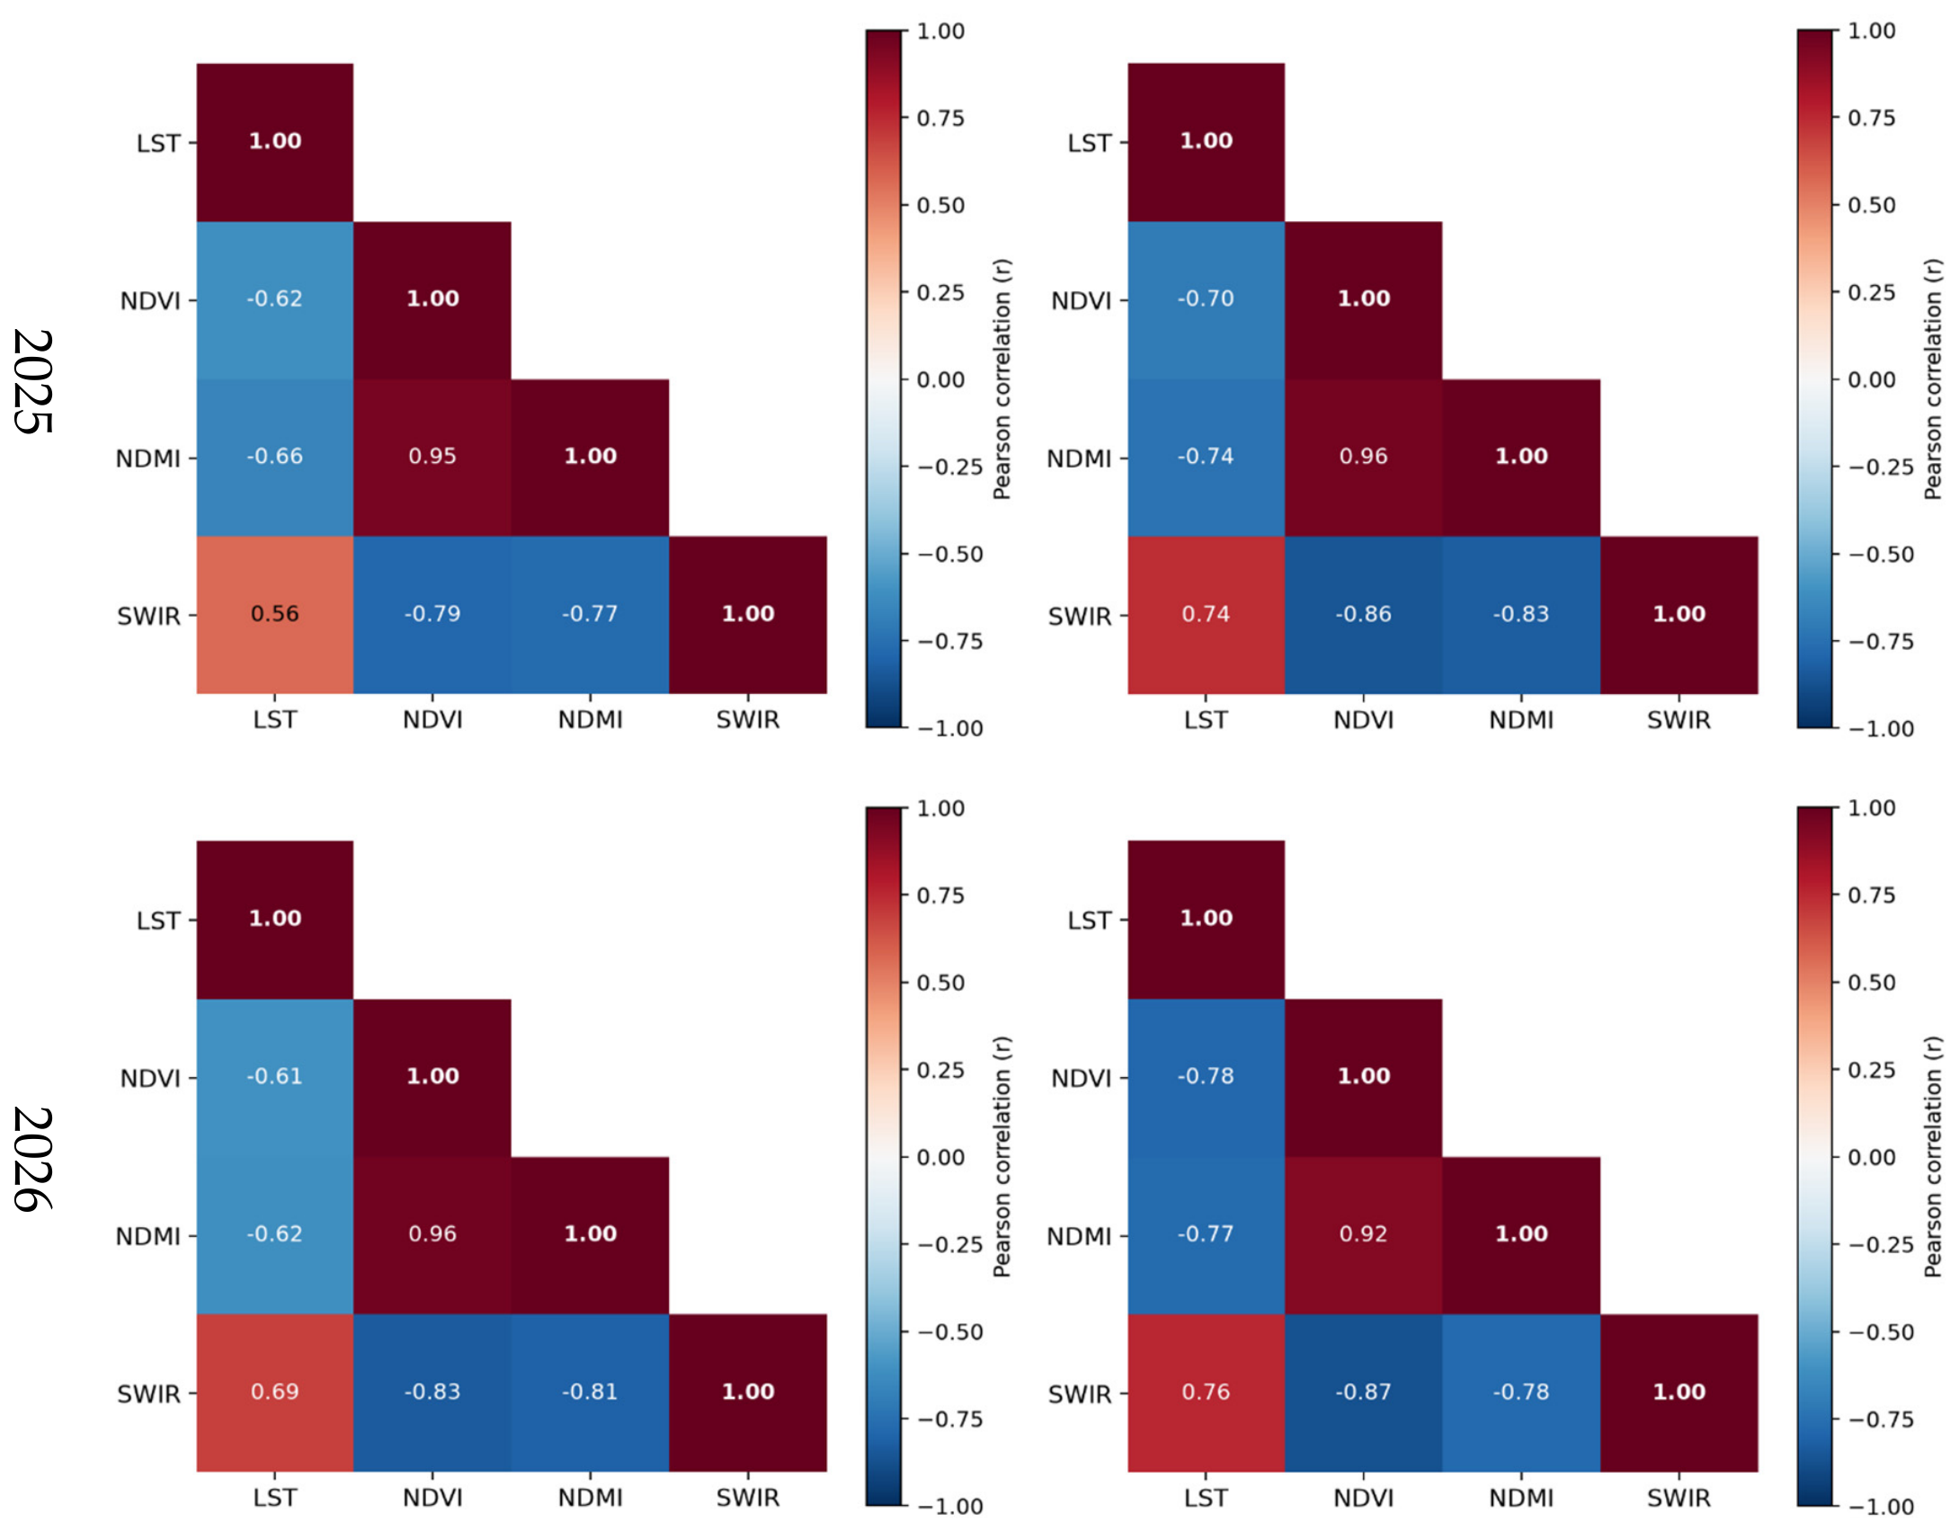
Pixel-by-pixel correlation analysis confirmed that moisture depletion (NDMI) is the single strongest driver of post-harvest LST elevation (mean ), followed closely by vegetative removal (NDVI, mean ) and bare soil exposure (SWIR, mean ) (Figure 4). This proves that severe loss of evapotranspirative cooling is the primary engine behind harvest-induced heating.
5. Discussion
The empirical findings of this study challenge a deeply embedded assumption in urban disaster risk management: that extreme heat is primarily an unpredictable atmospheric phenomenon driven by large-scale meteorological conditions beyond local governance control. By demonstrating that peri-urban agricultural harvesting induces large-scale, spatially extensive surface temperature surges exceeding 40 °C (repeatedly, consistently, and across seven independent annual observations) this research reframes post-harvest land surface change as a predictable, recurring, and spatially mappable heat hazard. This reframing has profound consequences for how cities surrounded by agricultural land should approach heat risk governance, emergency preparedness, and long-term climate adaptation planning.
The predictability of the hazard is its most operationally significant characteristic. Unlike flash floods, earthquakes, or convective storm events, which offer warning windows measured in hours or days at best, the harvest-driven heat surge follows an agricultural calendar that is known weeks to months in advance. Farmers, agricultural cooperatives, and regional land management authorities possess this calendar as routine operational knowledge. What has been missing, and what this study provides for the first time in a systematic, multi-year, open-data framework, is the quantitative evidence linking harvest timing to urban thermal exposure at sufficient spatial resolution and temporal consistency to justify its integration into formal disaster risk governance structures.
The findings align directly and substantively with three Priority Areas of the Sendai Framework for Disaster Risk Reduction 2015–2030 (UNDRR, 2015), which remains the primary international framework guiding national and subnational disaster risk policy through 2030 and beyond.
Under Sendai Priority 1 (Understanding Disaster Risk), the study contributes a multi-year, pixel-level characterization of a heat hazard profile that is currently absent from most national risk atlases and urban vulnerability assessments. The consistent post-harvest city-level LST values exceeding 40° C across all seven years, the strong spatial correlation between vegetation/moisture loss and surface heating (r ~ −0.70 to −0.74), and the clear visual correspondence between NDVI collapse and LST surge together constitute a robust, evidence-based characterization of the hazard. Crucially, this characterization is not site-specific, the methodology requires only freely available open data and open-source tools, meaning any municipality adjacent to agricultural land anywhere in the world can generate an equivalent hazard profile for its own territory without specialist infrastructure, proprietary software, or international technical assistance. This directly addresses the data and knowledge gap that Sendai Priority 1 identifies as the foundational barrier to effective risk governance, particularly in low- and middle-income countries where official heat risk assessments remain largely absent.
Under Sendai Priority 2 (Strengthening Disaster Risk Governance), the findings point to a structural gap in how urban heat governance is currently organized. In most jurisdictions, heat emergency management sits within meteorological services and public health authorities, while land use and agricultural policy sits within entirely separate ministries and regulatory bodies. The harvest-urban heat connection identified in this study cuts directly across this institutional divide: effective governance of harvest-driven heat risk requires coordination between agricultural extension services, land management authorities, civil protection agencies, and municipal health departments as a multi-sector integration that is rarely formalized in current governance arrangements. Addressing this gap need not require new legislation or institutional restructuring; it requires, at minimum, the inclusion of harvest phenology data in municipal heat vulnerability mapping, and the establishment of formal information-sharing protocols between agricultural and civil protection authorities ahead of the harvest season each year. The open methodology demonstrated here provides the technical basis for such protocols, supplying spatially explicit, annually updatable heat hazard maps that can serve as a shared evidence base across institutional boundaries.
Under Sendai Priority 4 (Enhancing Disaster Preparedness for Effective Response and to “Build Back Better”), the calendrical nature of the hazard enables a level of anticipatory preparedness that reactive heat monitoring systems cannot provide. A harvest-linked heat early warning system, triggered not by exceeding a meteorological temperature threshold, but by satellite-detected vegetation senescence in the peri-urban agricultural zone in the weeks preceding peak harvest, would allow public health authorities to activate cooling centers, issue targeted advisories to outdoor workers and elderly residents in the urban fringe, and coordinate with agricultural operators on irrigation scheduling or post-harvest residue management before the thermal peak occurs rather than in response to it. This anticipatory logic is already embedded in flood risk management (where rising river stages trigger staged response protocols days before peak flow) and wildfire risk management (where fuel moisture monitoring triggers pre-emptive resource pre-positioning); there is no technical or conceptual barrier to applying the same anticipatory framework to harvest-driven heat risk, and this study provides the empirical foundation to do so.
Beyond the Sendai Framework, the findings carry important implications for urban climate adaptation planning under the Paris Agreement and national adaptation plans increasingly required of signatory countries. As background temperatures continue to rise under even moderate emissions scenarios, the absolute magnitude of the harvest-driven heat surge will increase, because it is superimposed on a rising seasonal baseline. A post-harvest LST peak that currently reaches 50° C in the hottest years will, under mid-century warming projections, reach values with no historical precedent in this landscape. Early integration of harvest phenology into urban heat adaptation strategies is therefore not merely a near-term operational improvement but a long-term resilience investment, buying lead time before the hazard escalates to magnitudes that overwhelm reactive response capacity.
Finally, the strong and consistent alignment between LST and SWIR across all seven years of the study deserves specific attention from a monitoring and early warning perspective. SWIR reflectance responds to surface moisture and vegetation status faster and more sensitively than thermal infrared retrievals under some atmospheric conditions, and Sentinel-2’s 10-meter SWIR products are available at higher spatial resolution and shorter revisit frequency than Landsat thermal data. The demonstrated spatial correspondence between SWIR and LST suggests that SWIR-based vegetation moisture monitoring could serve as a leading indicator of impending thermal stress as a proxy early warning signal available before the full thermal signature develops, providing an additional operational tool for disaster risk managers seeking to maximize lead time before harvest-driven heat peaks.
6. Conclusion
This study establishes, through seven years of consistent, spatially explicit, multi-sensor satellite evidence, that agricultural harvesting constitutes a major, highly predictable, and currently underappreciated driver of extreme heat hazard in urban areas surrounded by agricultural land. The post-harvest transition from dense crop canopy to bare soil drives dramatic surface temperature increases, exceeding 40° C at the city scale in every year studied, whose spatial structure is directly and consistently linked to the loss of vegetation cover and surface moisture, as evidenced by strong pixel-wise correlations between LST, NDVI, NDMI, and SWIR across all years and both study periods. These are not marginal or statistically borderline findings, but they are visually unambiguous in the spatial maps, numerically robust in the correlation analysis, and temporally consistent across an observation record long enough to rule out inter-annual atmospheric variability as an alternative explanation.
The methodological contribution of this study is as significant as the empirical one. By implementing the entire analytical pipeline using freely available satellite data (Landsat 8/9 Collection 2, Sentinel-2 Level-2A) and open-source processing tools (Google Earth Engine, Python, QGIS), and by requiring only a study-area shapefile and two acquisition dates per year as site-specific inputs, this study demonstrates a globally scalable workflow for identifying, characterizing, and monitoring post-harvest thermal surges at any agricultural-urban interface in the world. The barrier to replication is deliberately minimal since any national meteorological service, regional environmental agency, or municipal planning authority with internet access and basic geospatial literacy can generate an equivalent analysis for their own territory, without proprietary data, without specialist computing infrastructure, and without international technical assistance.
The disaster risk management implications of these findings are direct and actionable. Harvest-driven heat amplification is a predictable hazard, governed by an agricultural calendar that is known in advance, spatial in character (and therefore mappable), consistent in its annual recurrence (and therefore insurable and plannable), and physically linked to land management decisions that are, at least in part, subject to policy influence. This combination of predictability, spatial explicitness, and policy relevance makes it an ideal candidate for integration into the anticipatory governance frameworks that the Sendai Framework for Disaster Risk Reduction 2015–2030 calls for, but which, in the domain of heat risk, remain underdeveloped relative to other hazard types such as flooding and seismic risk.
The path forward requires action at multiple scales simultaneously. At the local level, municipalities should incorporate harvest phenology into annual heat emergency preparedness cycles, establishing formal coordination with agricultural authorities and activating heat risk protocols ahead of the harvest-period thermal surge. At the national level, disaster risk registers and heat vulnerability assessments should explicitly recognize the urban-agricultural interface as a primary heat hazard zone, integrating remote-sensing-based harvest monitoring into national heat early warning systems. At the international level, the open methodology demonstrated here offers a practical contribution to the Sendai Framework’s call for globally accessible, evidence-based disaster risk information, one that is immediately deployable in the regions where heat risk is rising fastest, and risk governance capacity remains most constrained.
Agricultural land and urban settlements have coexisted and co-evolved for centuries. The thermal consequences of their interaction have always existed; what has changed is our capacity to observe, quantify, and act on them at the resolution and consistency required for effective governance. This study demonstrates that the observational capacity is now available, freely, to anyone who needs it. The remaining task is institutional to ensure that the evidence reaches the decision-makers who can translate it into the anticipatory, cross-sectoral, spatially informed heat risk governance that the scale of the challenge demands.
| 1 | The Sendai Framework for Disaster Risk Reduction 2015-2030 is a 15-year international agreement adopted by UN Member States on March 18, 2015. It aims to prevent new risks, reduce existing disaster losses, and build socioeconomic resilience across natural, technological, and biological hazards [Link]. |
References
- Aitsi-Selmi, A., Egawa, S., Sasaki, H., Wannous, C. and Murray, V., 2015. The Sendai framework for disaster risk reduction: Renewing the global commitment to people’s resilience, health, and well-being. International journal of disaster risk science, 6(2), pp.164-176. [CrossRef]
- Drusch, M., Del Bello, U., Carlier, S., Colin, O., Fernandez, V., Gascon, F., ... & Bargellini, P. (2012). Sentinel-2: ESA’s optical high-resolution mission for GMES operational services. Remote Sensing of Environment, 120, 25–36. [CrossRef]
- Lastovicka, J., Svec, P., Paluba, D., Kobliuk, N., Svoboda, J., Hladky, R. and Stych, P., 2020. Sentinel-2 data in an evaluation of the impact of the disturbances on forest vegetation. Remote Sensing, 12(12), p.1914. [CrossRef]
- Strashok, O., Ziemiańska, M. and Strashok, V., 2022. Evaluation and Correlation of Sentinel-2 NDVI and NDMI in Kyiv (2017–2021). Journal of Ecological Engineering, 23(9). [CrossRef]
- Gao, B. C. (1996). NDWI—A normalized difference water index for remote sensing of vegetation liquid water from space. Remote Sensing of Environment, 58(3), 257–266. [CrossRef]
- Campbell, S., Remenyi, T.A., White, C.J. and Johnston, F.H., 2018. Heatwave and health impact research: A global review. Health & place, 53, pp.210-218. [CrossRef]
- Feizizadeh, B., Omarzadeh, D., Kazemi Garajeh, M., Lakes, T. and Blaschke, T., 2023. Machine learning data-driven approaches for land use/cover mapping and trend analysis using Google Earth Engine. Journal of Environmental Planning and Management, 66(3), pp.665-697. [CrossRef]
- Omarzadeh, D., Afraz, M., Akbari, M., Eftekhari, M. and Noghani, Z., 2021. Evaluation of changes in the Forest Environment in Guilan Province using a combination of Remote Sensing Data. The Malaysian Forester, 84(1), pp.65-83.
- Kottek, M., Grieser, J., Beck, C., Rudolf, B. and Rubel, F., 2006. World map of the Köppen-Geiger climate classification updated.
- Martınez, D., Cuxart, J. and Cunillera, J., 2008. Conditioned climatology for stably stratified nights in the Lleida area. Journal of Weather & Climate of the Western Mediterranean, 5, pp.13-24. [CrossRef]
- Berrang-Ford, L., Sietsma, A.J., Callaghan, M., Minx, J.C., Scheelbeek, P.F., Haddaway, N.R., Haines, A. and Dangour, A.D., 2021. Systematic mapping of global research on climate and health: A machine learning review. The Lancet Planetary Health, 5(8), pp.e514-e525. [CrossRef]
- Peng, S., Piao, S., Ciais, P., Friedlingstein, P., Ottle, C., Bréon, F.M., Nan, H., Zhou, L. and Myneni, R.B., 2012. Surface urban heat island across 419 global big cities. Environmental science & technology, 46(2), pp.696-703. [CrossRef]
- Gorelick, N., Hancher, M., Dixon, M., Ilyushchenko, S., Thau, D., & Moore, R. (2017). Google Earth Engine: Planetary-scale geospatial analysis for everyone. Remote Sensing of Environment, 202, 18–27. [CrossRef]
- Imhoff, M. L., Zhang, P., Wolfe, R. E., & Bounoua, L. (2010). Remote sensing of the urban heat island effect across biomes in the continental USA. Remote Sensing of Environment, 114(3), 504–513. [CrossRef]
- IPCC (2022). Climate Change 2022: Impacts, Adaptation and Vulnerability. Contribution of Working Group II to the Sixth Assessment Report of the Intergovernmental Panel on Climate Change. Cambridge University Press. [CrossRef]
- Kalnay, E., & Cai, M. (2003). Impact of urbanization and land-use change on climate. Nature, 423(6939), 528–531. [CrossRef]
- Kustas, W. P., & Norman, J. M. (1996). Use of remote sensing for evapotranspiration monitoring over land surfaces. Hydrological Sciences Journal, 41(4), 495–516. [CrossRef]
- Oke, T. R. (1982). The energetic basis of the urban heat island. Quarterly Journal of the Royal Meteorological Society, 108(455), 1–24. [CrossRef]
- Peng, S., Piao, S., Ciais, P., Friedlingstein, P., Ottle, C., Bréon, F. M., ... & Myneni, R. B. (2012). Surface urban heat island across 419 global big cities. Environmental Science & Technology, 46(2), 696–703. [CrossRef]
- Robine, J. M., Cheung, S. L. K., Le Roy, S., Van Oyen, H., Griffiths, C., Michel, J. P., & Herrmann, F. R. (2008). Death toll exceeded 70,000 in Europe during the summer of 2003. Comptes Rendus Biologies, 331(2), 171–178. [CrossRef]
- Roy, D. P., Wulder, M. A., Loveland, T. R., Woodcock, C. E., Allen, R. G., Anderson, M. C., ... & Zhu, Z. (2014). Landsat-8: Science and product vision for terrestrial global change research. Remote Sensing of Environment, 145, 154–172. [CrossRef]
- UNDRR (2015). Sendai Framework for Disaster Risk Reduction 2015–2030. United Nations Office for Disaster Risk Reduction, Geneva.
- Voogt, J. A., & Oke, T. R. (2003). Thermal remote sensing of urban climates. Remote Sensing of Environment, 86(3), 370–384. [CrossRef]
- Wan, Z. (2014). New refinements and validation of the collection-6 MODIS land-surface temperature/emissivity product. Remote Sensing of Environment, 140, 36–45. [CrossRef]
- World Health Organization (WHO) (2023). Heat and Health Fact Sheet. Geneva, Switzerland.
- Zhang, P., Imhoff, M. L., Wolfe, R. E., & Bounoua, L. (2010). Characterizing urban heat islands of global settlements using MODIS and nighttime light products. Canadian Journal of Remote Sensing, 36(3), 185–196. [CrossRef]
- Zhang, Y., Odeh, I. O., & Han, C. (2009). Bi-temporal characterization of land surface temperature in relation to impervious surface area, NDVI and NDBI, using a sub-pixel image analysis. International Journal of Applied Earth Observation and Geoinformation, 11(4), 256–264. [CrossRef]
- Zhao, L., Lee, X., Smith, R. B., & Oleson, K. (2014). Strong contributions of local background climate to urban heat islands. Nature, 511(7508), 216–219. [CrossRef]
- Zhou, D., Xiao, J., Bonafoni, S., Berger, C., Deilami, K., Zhou, Y., ... & Sobrino, J. A. (2019). Satellite remote sensing of surface urban heat islands: Progress, challenges, and perspectives. Remote Sensing, 11(1), 48. [CrossRef]
Figure 1.
Study area location.
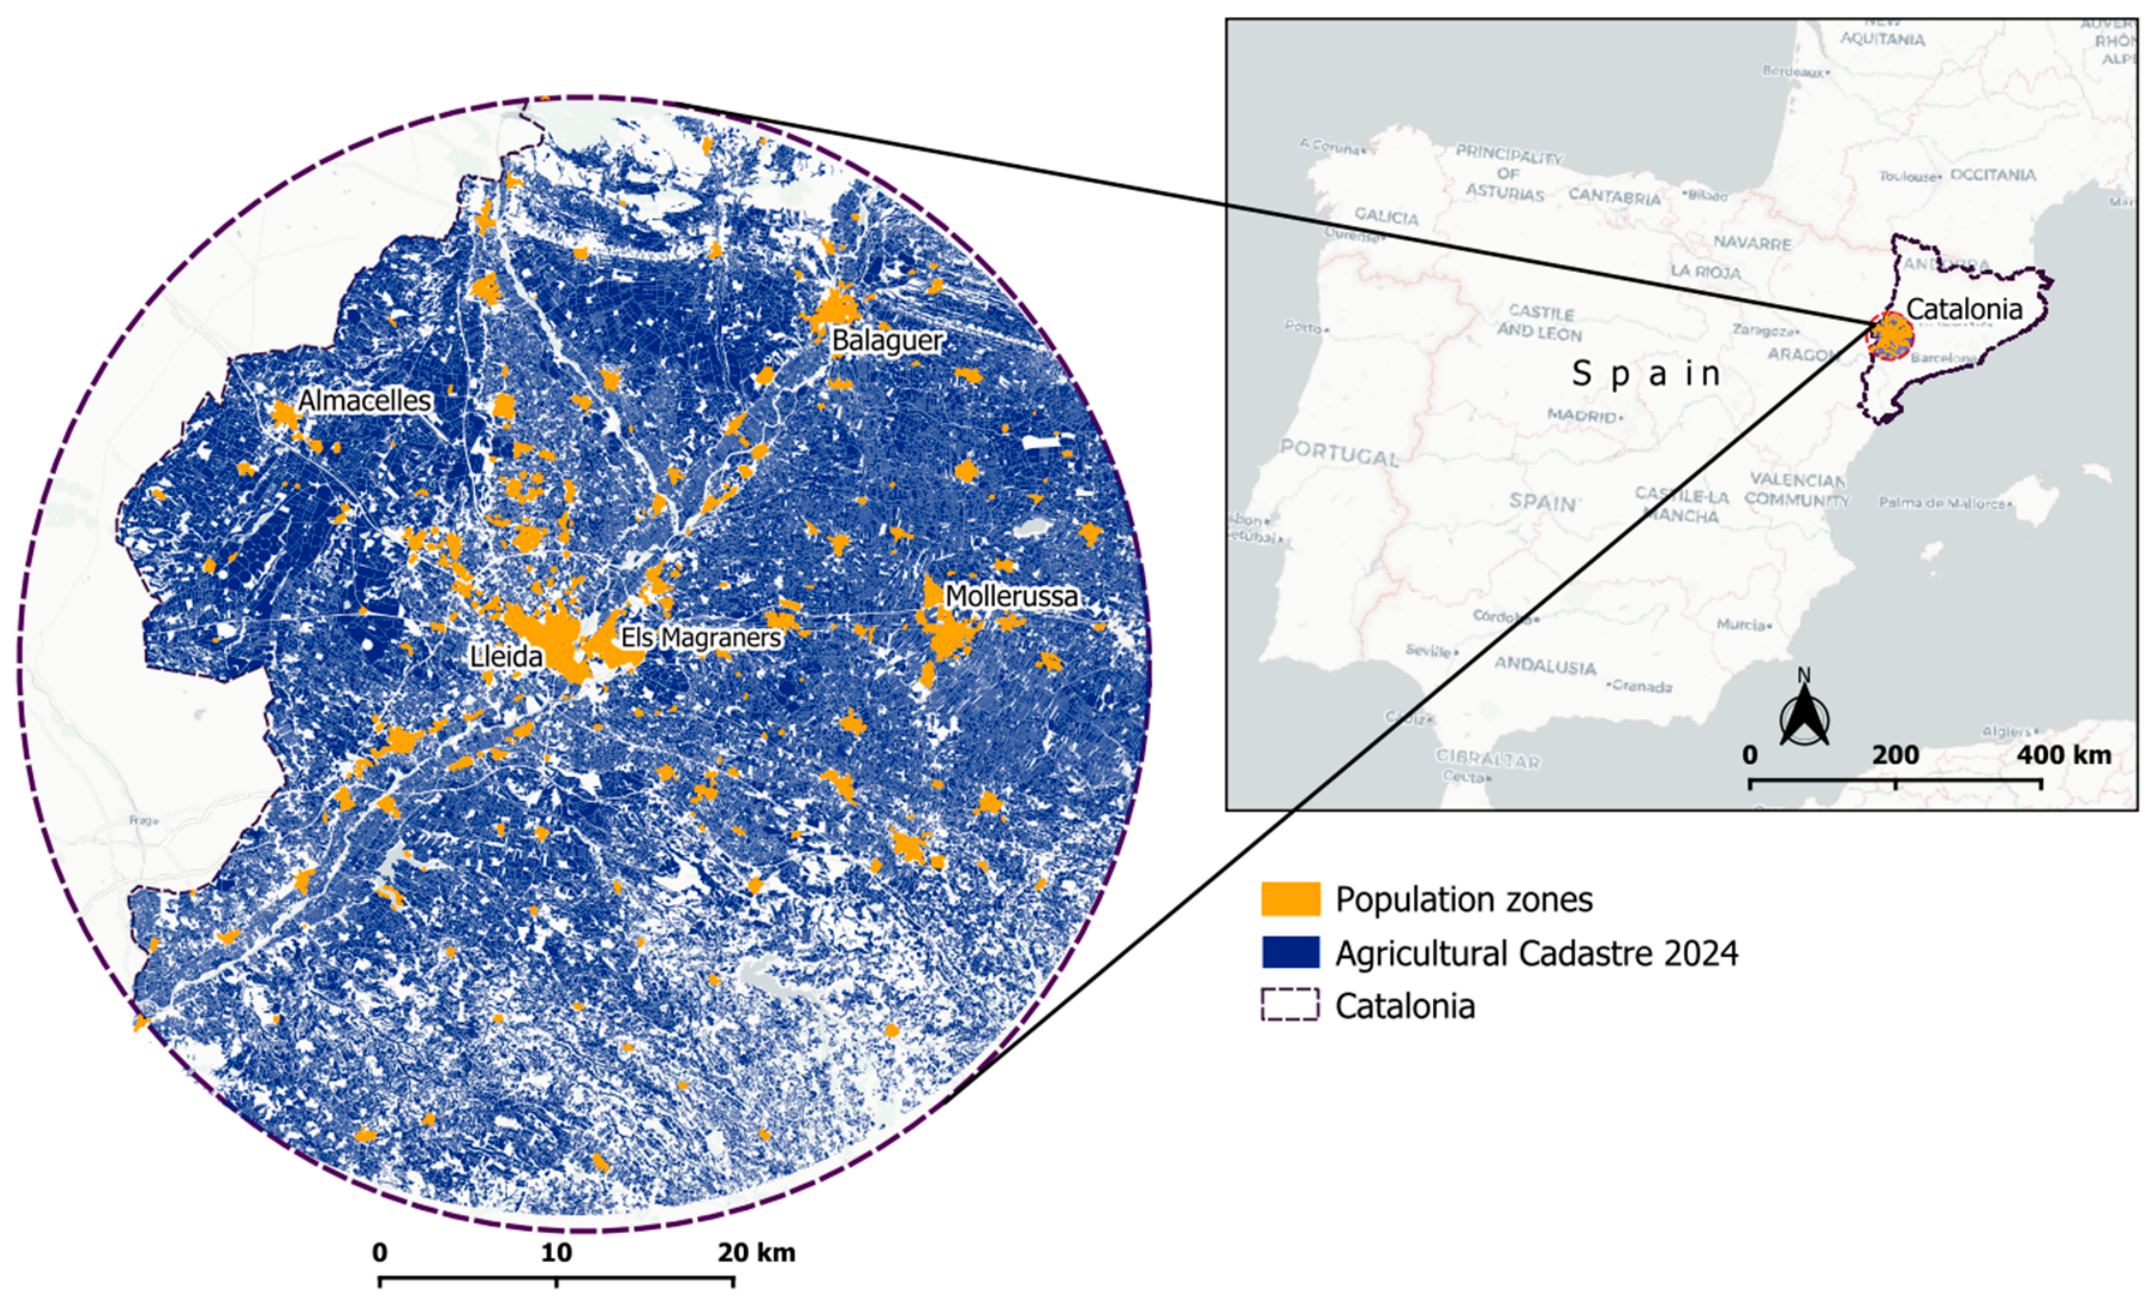
Figure 3.
City and AOI-level Land Surface Temperature (LST) statistics for before and after harvest across 2020–2026. Across every single year evaluated, the city mean LST for the post-harvest exceeded the critical severe heat warning threshold of 40 °C.
Figure 3.
City and AOI-level Land Surface Temperature (LST) statistics for before and after harvest across 2020–2026. Across every single year evaluated, the city mean LST for the post-harvest exceeded the critical severe heat warning threshold of 40 °C.
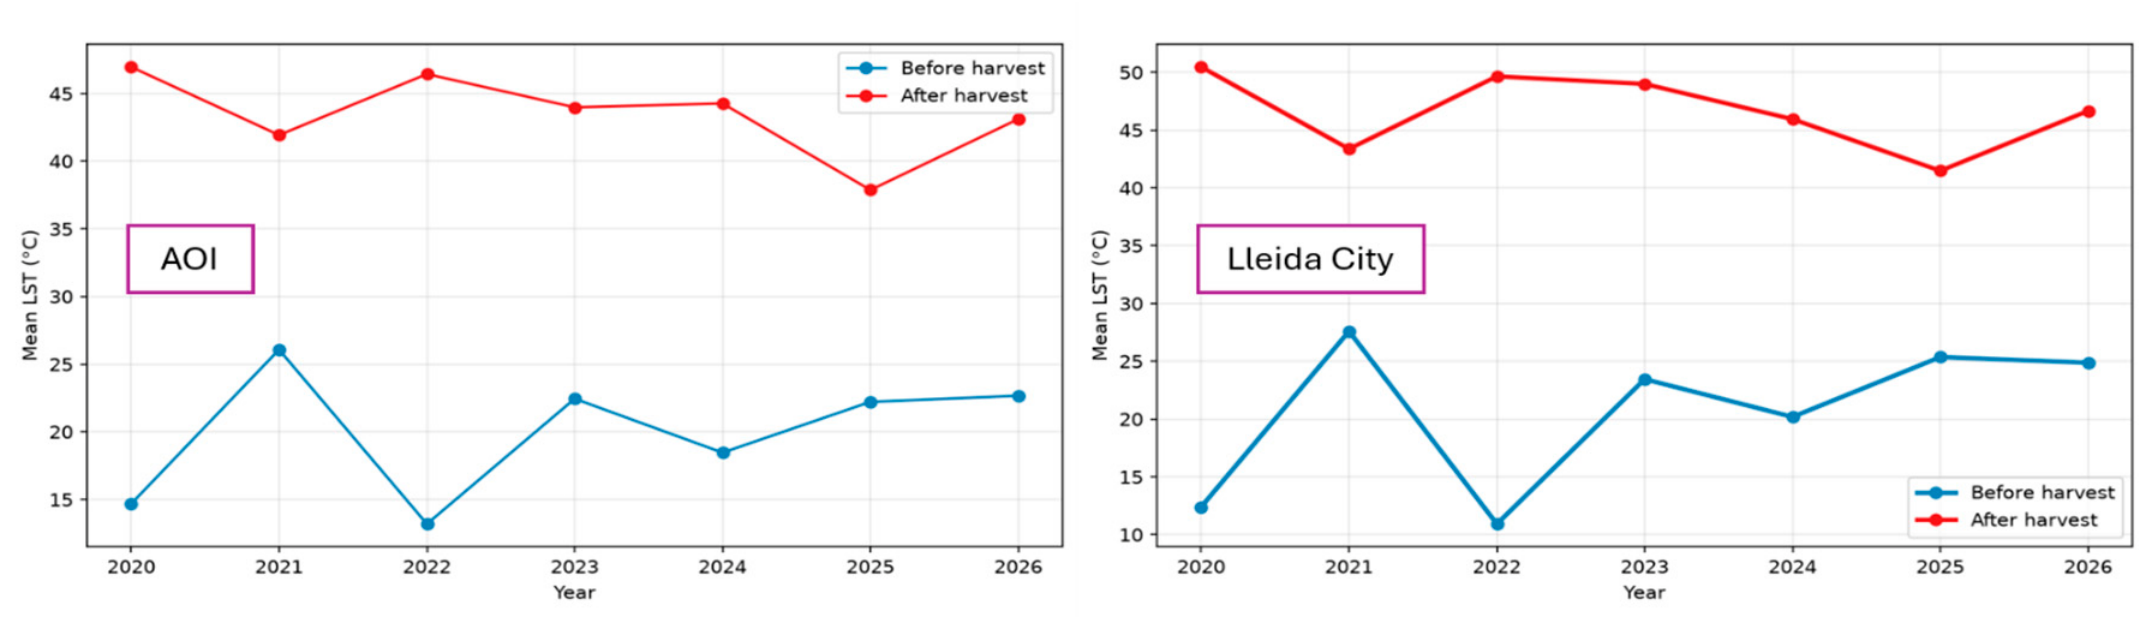
Figure 4.
Pixel-wise Pearson correlation matrices between Land Surface Temperature (LST, Landsat 8/9), Normalized Difference Vegetation Index (NDVI, Sentinel-2), Normalized Difference Moisture Index (NDMI, Sentinel-2), and Short-Wave Infrared reflectance (SWIR Band 12, Sentinel-2) for the pre-harvest (left column) and post-harvest (right column) periods across all seven study years (2020–2026). Each matrix displays the lower triangle of pairwise Pearson correlation coefficients (r) computed across all spatially co-registered, cloud-free, valid pixels within the study AOI. The diverging color scale (dark red = strong positive correlation, blue = strong negative correlation, white = no correlation) is fixed at (−1, +1) across all panels to enable direct visual comparison across years and periods. Diagonal cells (r = 1.00, bold) represent each variable’s self-correlation. The consistent negative LST–NDVI and LST–NDMI relationships, and the consistent positive LST–SWIR relationship, visible across all 14 panels, confirm the robustness and inter-annual stability of the harvest-driven vegetation–temperature coupling identified in this study. The near-perfect NDVI–NDMI correlation (r > 0.90 in all panels) reflects the co-variation of vegetation biomass and canopy moisture content throughout the agricultural growing and senescence cycle.
Figure 4.
Pixel-wise Pearson correlation matrices between Land Surface Temperature (LST, Landsat 8/9), Normalized Difference Vegetation Index (NDVI, Sentinel-2), Normalized Difference Moisture Index (NDMI, Sentinel-2), and Short-Wave Infrared reflectance (SWIR Band 12, Sentinel-2) for the pre-harvest (left column) and post-harvest (right column) periods across all seven study years (2020–2026). Each matrix displays the lower triangle of pairwise Pearson correlation coefficients (r) computed across all spatially co-registered, cloud-free, valid pixels within the study AOI. The diverging color scale (dark red = strong positive correlation, blue = strong negative correlation, white = no correlation) is fixed at (−1, +1) across all panels to enable direct visual comparison across years and periods. Diagonal cells (r = 1.00, bold) represent each variable’s self-correlation. The consistent negative LST–NDVI and LST–NDMI relationships, and the consistent positive LST–SWIR relationship, visible across all 14 panels, confirm the robustness and inter-annual stability of the harvest-driven vegetation–temperature coupling identified in this study. The near-perfect NDVI–NDMI correlation (r > 0.90 in all panels) reflects the co-variation of vegetation biomass and canopy moisture content throughout the agricultural growing and senescence cycle.
Disclaimer/Publisher’s Note: The statements, opinions and data contained in all publications are solely those of the individual author(s) and contributor(s) and not of MDPI and/or the editor(s). MDPI and/or the editor(s) disclaim responsibility for any injury to people or property resulting from any ideas, methods, instructions or products referred to in the content. |
© 2026 by the authors. Licensee MDPI, Basel, Switzerland. This article is an open access article distributed under the terms and conditions of the Creative Commons Attribution (CC BY) license (http://creativecommons.org/licenses/by/4.0/).
Copyright: This open access article is published under a Creative Commons CC BY 4.0 license, which permit the free download, distribution, and reuse, provided that the author and preprint are cited in any reuse.