
Submitted:
16 August 2026
Posted:
17 August 2026
You are already at the latest version
Abstract
This study proposes an explainable artificial intelligence (XAI) engineering workflow for provider-level healthcare claim audit prioritization using SHAP-guided hybrid retrieval-augmented generation (RAG). The framework integrates provider-level claim aggregation, tree-based risk screening, SHAP explanation, exploratory group-level SHAP clustering, policy concept retrieval, and constrained large language model audit narrative generation. Experiments on a public Medicare provider fraud dataset use the dataset-provided PotentialFraud label as a weak audit prioritization label rather than a legal determination of fraud. The results show that reimbursement exposure, utilization duration, claim repetition, deductible patterns, and beneficiary case mix contribute to provider-level risk scores. Additional cross-validation, calibration, threshold, and scale-confounding analyses indicate that provider size and financial exposure are important confounders, while non-scale and contextual features also retain predictive information. Beyond prediction, the framework organizes local SHAP drivers into exploratory provider archetypes and maps explanation patterns to audit-relevant policy concepts. Compared with pure embedding retrieval, the SHAP-guided hybrid retriever increases policy concept diversity and explanation alignment, although these retrieval metrics do not replace independent expert audit validation. Because the public dataset does not include referral pathways, inter-facility transfers, provider-network relationships, or care-coordination records, the framework cannot determine whether utilization patterns are explained by clinically appropriate referrals, regional access constraints, or multi-level care pathways. Its current applicability is therefore limited to provider-level audit prioritization using the available claims and beneficiary variables. The proposed system is positioned as a reproducible engineering prototype for cautious, human-reviewed audit support rather than a comprehensive or automated fraud determination system.
Keywords:
trustworthy AI
; explainable AI engineering
; healthcare claim audit
; SHAP
; retrieval augmented generation
; large language models
; audit prioritization
; policy grounded decision support
1. Introduction
Artificial intelligence has become an increasingly important component of engineering decision support systems, enabling data driven prediction, optimization, and automation in complex operational environments. However, in high stakes settings, predictive performance alone is not sufficient. AI systems that support financial, medical, industrial, or regulatory decisions must also provide transparent reasoning, traceable evidence, and mechanisms for human oversight. This requirement is consistent with broader trustworthy AI principles, which emphasize validity, reliability, accountability, transparency, explainability, interpretability, privacy, and fairness [1]. Prior work has also cautioned that black box models can be problematic in high stakes decision making when their outputs cannot be meaningfully inspected or challenged [2]. Therefore, the central engineering challenge is not only how to build accurate AI models, but also how to transform model outputs into explanations that are understandable, useful, and aligned with human decision processes [3]. Feature attribution methods such as SHAP provide an important technical foundation for this goal by assigning local contribution values to input features for individual predictions [4].
Healthcare claim audit is a representative engineering decision support problem in which prediction, explanation, and operational accountability must be considered together. Fraud, waste, and abuse in healthcare claims can take multiple forms, including billing for services not provided, billing at a higher level of complexity than the service actually provided or documented, duplicate or repeated billing, and improper coding. The Centers for Medicare and Medicaid Services describes Medicare fraud examples such as knowingly billing for services not furnished and billing for a higher level of service than actually provided or documented [5]. The Office of Inspector General of the U.S. Department of Health and Human Services also identifies upcoding as a common type of false claim, in which billing codes reflect a more severe illness or more expensive treatment than actually existed or was provided [6]. These examples show that healthcare claim audit is not only a classification problem. It is also an operational review problem that requires auditors to understand why a provider was flagged and what type of documentation or claim pattern should be examined. Accordingly, model outputs in this setting should be treated as audit prioritization evidence rather than as automatic fraud determinations.
Machine learning has been widely explored for healthcare fraud detection because claims data are large, heterogeneous, and difficult to review manually. Prior work has proposed machine learning approaches for Medicare fraud detection using publicly available claims data and provider labels, showing the feasibility of supervised learning for identifying suspicious providers [7]. More recent reviews also show that machine learning methods are increasingly used in healthcare insurance claim fraud detection, while continuing to face challenges related to class imbalance, feature engineering, data quality, evaluation, and interpretability [8]. Tree ensemble methods are especially attractive for tabular claim data because they can model nonlinear interactions among financial, utilization, coding, and beneficiary level variables. XGBoost, for example, provides a scalable gradient boosted tree framework that has been widely used for structured data modeling [9]. Nevertheless, a high performing fraud screening model is not sufficient for audit practice if its predictions cannot be translated into actionable review logic. Moreover, provider level fraud labels in public datasets are often weak labels rather than adjudicated legal findings, which requires careful interpretation of model performance and downstream explanations.
Explainable artificial intelligence (XAI) addresses part of this gap by exposing the model drivers behind individual predictions. SHAP is particularly useful because it provides both global feature importance and local provider level explanations [4]. In healthcare claim audit, however, raw SHAP values alone are not enough. A SHAP explanation may indicate that total reimbursement, admission duration, claims per beneficiary, or chronic condition burden influenced a prediction, but an auditor still needs to interpret these model drivers in operational terms. For example, high reimbursement may require high value claim review, long admission duration may require medical necessity review, repeated claim behavior may require duplicate or frequency based billing review, and beneficiary case mix should be treated as contextual information rather than evidence of misconduct. Therefore, explainability must be connected to domain knowledge and audit policy concepts before it can support practical decision making.
Retrieval augmented generation (RAG) provides a promising way to connect model explanations with external knowledge. RAG combines a parametric language model with a nonparametric retrieval component, allowing generated text to be grounded in retrieved passages rather than relying only on model parameters [10]. This mechanism is attractive for audit support because it can retrieve relevant policy or governance concepts and then generate human readable explanations. However, pure semantic retrieval may retrieve generic policy text that is not sufficiently aligned with provider specific model drivers, especially when many high risk providers share similar financial or utilization patterns. In this setting, the retrieval module should be guided not only by the surface similarity between a query and a policy document, but also by the feature groups that actually drive the model prediction.
To address these limitations, this study proposes an XAI engineering workflow for healthcare claim audit prioritization using SHAP guided hybrid RAG. The framework first aggregates inpatient claims, outpatient claims, and beneficiary information into provider level financial intensity, claim volume and repetition, temporal utilization, coding complexity, physician structure, and beneficiary case mix features. Tree based classifiers are evaluated for provider level risk screening, and XGBoost is used as the main workflow model for the downstream explanation and retrieval experiments. SHAP is used to explain both global model behavior and local provider specific predictions. To move beyond individual feature ranking, this study further applies group level SHAP clustering as an exploratory method for identifying explanation based provider risk archetypes. Finally, a policy knowledge base is constructed, and a SHAP guided hybrid retrieval strategy is developed by combining embedding similarity with feature group based rule boosting. Retrieved policy concepts are then used by a constrained language model to generate cautious, policy grounded audit narratives and provider specific review checklists.
The proposed framework is designed for audit prioritization rather than automatic fraud determination. This distinction is important because the provider label used in the dataset indicates potential fraud risk and should not be interpreted as a legal conclusion or adjudicated ground truth. The language model is not used as a fraud classifier. Instead, it serves as a constrained explanation layer that converts structured SHAP outputs and retrieved policy concepts into human readable audit reports. In this design, the risk model ranks providers for possible review, SHAP explains why the model assigned a high risk score, group level SHAP clustering characterizes exploratory explanation patterns, and hybrid RAG maps the explanation to audit relevant policy concepts. The intended output is a transparent decision support artifact for human auditors, not a substitute for expert review, documentation assessment, or compliance adjudication.
Because the dataset does not include referral pathways, inter-facility transfers, provider-network relationships, or care-coordination records, the framework is not intended to assess referral appropriateness, care-pathway quality, or network-level utilization management. Its present scope is limited to provider-level audit prioritization using the available claims and beneficiary variables.
The main contributions of this study are fourfold. First, it develops a provider level AI engineering workflow for healthcare claim audit prioritization by integrating claim aggregation, supervised risk screening, explainable machine learning, policy concept retrieval, and constrained language generation. Second, it applies group level SHAP clustering as an exploratory explanation typology method and examines whether high risk providers exhibit different explanation profiles. Third, it proposes a SHAP guided hybrid retrieval strategy for policy grounded RAG, where embedding similarity is combined with feature group based rule boosting to better align retrieved audit concepts with provider specific model explanations. Fourth, it evaluates the framework on a public Medicare provider fraud dataset using additional cross validation, calibration, threshold, scale confounding, clustering robustness, and retrieval ablation analyses, while explicitly treating generated audit reports as cautious decision support narratives rather than fraud determinations.
2. Related Work
2.1. Healthcare Fraud Detection and Claim Audit Analytics
Healthcare fraud detection has long been studied as a data driven decision support problem. Early statistical and data mining studies examined how unusual billing patterns, provider behavior, and claim relationships could be used to detect suspicious activities in healthcare systems. Li et al. surveyed statistical methods for healthcare fraud detection and summarized approaches such as rule based screening, outlier detection, clustering, and supervised classification [11]. This early literature established an important foundation: fraud detection is not only a prediction task, but also an audit prioritization problem in which limited investigative resources must be directed toward cases with unusual or high risk patterns.
With the increasing availability of large scale claims data, machine learning has become a common approach for healthcare fraud screening. Bauder and Khoshgoftaar investigated Medicare fraud detection using publicly available claims data and excluded provider labels, demonstrating the feasibility of supervised learning for identifying potentially fraudulent Medicare providers [12]. Bauder, Khoshgoftaar, and Seliya also reviewed the state of healthcare upcoding fraud analysis and detection, emphasizing that coding and billing behavior can provide important fraud indicators [13]. More recently, du Preez et al. conducted a systematic review of machine learning for healthcare claims fraud detection. Their review identified supervised, unsupervised, and hybrid approaches, while also highlighting challenges related to scarce fraudulent cases, inconsistent data, privacy concerns, data standardization, and interpretability [8]. These findings indicate that healthcare claim fraud detection remains an active and challenging research area.
Although existing machine learning studies demonstrate the predictive value of claims data, many of them focus mainly on classification performance. In practical claim audit settings, however, a risk score alone is not enough. Auditors must understand whether a provider was flagged because of reimbursement intensity, repeated claims, inpatient utilization, coding complexity, beneficiary case mix, or physician involvement patterns. This need is reinforced by official fraud and abuse guidance. For example, the Centers for Medicare and Medicaid Services describes fraud examples such as knowingly billing for services not furnished, while the Office of Inspector General of the U.S. Department of Health and Human Services describes upcoding as the use of billing codes that reflect more severe illness or more expensive treatment than actually existed or was provided [5,6]. These examples suggest that healthcare claim audit requires policy relevant interpretation in addition to statistical risk detection.
A further challenge is that provider level fraud labels used in public datasets are often proxy or weak labels. They may reflect exclusion lists, administrative flags, or dataset specific annotations rather than adjudicated legal findings. As a result, a model trained on such labels may learn patterns associated with provider size, reimbursement exposure, patient complexity, or institutional selection effects rather than confirmed abusive behavior. This issue is especially important in healthcare claims analysis because large or specialized providers may naturally submit more claims and receive higher reimbursement. Therefore, fraud screening models require careful interpretation, sensitivity analysis, and explicit separation between audit prioritization and fraud determination.
Recent studies in adjacent compliance and disclosure settings also highlight the growing importance of interpretable anomaly detection and semantic risk analysis. Sun et al. modeled structural deviation in 10-K risk factor disclosures, where a 10-K is an annual report filed by publicly traded firms with the U.S. Securities and Exchange Commission, using semantic anomaly detection and explainable AI [14]. Although that work focuses on corporate disclosure rather than healthcare claims, it is related to the present study because both problems involve high stakes risk screening, anomaly interpretation, and the need to translate model outputs into decision support evidence.
2.2. Explainable AI for High Stakes Decision Support
Explainability is especially important when AI systems are used in high stakes decision support. Rudin argued that black box models are problematic in high stakes settings when decisions cannot be inspected, challenged, or understood [2]. Miller further emphasized that effective explanations should be understandable to human users and aligned with how people reason about decisions [3]. These arguments are directly relevant to healthcare claim audit, where a model output can influence audit prioritization and operational review. In such settings, explainability is not only a technical feature but also a governance requirement. The NIST AI Risk Management Framework similarly emphasizes trustworthy AI characteristics such as validity, reliability, accountability, transparency, explainability, interpretability, privacy, and fairness [1].
SHAP has become one of the most widely used approaches for explaining machine learning predictions. Lundberg and Lee proposed SHAP as a unified approach to interpreting model predictions based on Shapley values, enabling both global feature importance analysis and local explanation for individual predictions [4]. For tree based models, SHAP can identify how each feature contributes to a specific prediction. In healthcare claim audit, this allows provider level risk predictions to be decomposed into interpretable model drivers such as total reimbursement, admission duration, claim frequency, deductible amount, and beneficiary case mix. However, raw SHAP values are still technical artifacts. They can show which variables influenced a prediction, but they do not automatically translate those variables into audit concepts such as medical necessity review, duplicate claim review, high value reimbursement review, or case mix adjustment.
Prior work on healthcare fraud detection has increasingly recognized the need for interpretable or explainable models. The systematic review by du Preez et al. notes that explainable artificial intelligence is an important future direction for healthcare claims fraud detection [8]. The present study follows this direction but treats SHAP not only as a post hoc visualization tool. Instead, SHAP values are used at multiple stages of an audit support workflow: global model explanation, provider specific local explanation, exploratory group level explanation clustering, and retrieval guidance for policy concept selection.
2.3. Retrieval Augmented Generation and Policy Grounded Explanation
Retrieval augmented generation provides a mechanism for connecting language generation with external knowledge. Lewis et al. introduced RAG models that combine parametric memory in a pretrained language model with nonparametric memory accessed through retrieval, enabling generated outputs to be grounded in retrieved knowledge [10]. This idea is relevant to audit support because a language model can use retrieved policy or governance concepts to generate explanations that are more domain aligned than explanations based only on the model’s internal knowledge.
Recent work has extended RAG to document question answering, financial compliance, and structured policy understanding. Huang et al. proposed a multi hop retrieval augmented generation framework with LLaMA 3 for document level question answering, showing how retrieval, context fusion, and multi hop reasoning can improve complex document QA [15]. Shinde et al. proposed a secure Graph-RAG framework for financial compliance question answering with redaction and access control, illustrating how retrieval based generation can be adapted to regulated decision support environments [16]. These studies show that RAG and language model based systems are increasingly being used to support knowledge intensive reasoning over policy, compliance, and document based evidence.
In the context of healthcare claim audit, RAG can help bridge the gap between numerical model explanations and human readable audit reports. A SHAP explanation may identify total reimbursement, claim count, or admission duration as important drivers, but auditors need those drivers to be mapped to concepts such as high value reimbursement review, claim volume outlier review, medical necessity review, or documentation review. A retrieval module can provide relevant policy context, while a constrained language model can convert the model explanation and retrieved knowledge into a cautious audit narrative. However, pure semantic retrieval may not be sufficient. When many high risk providers share similar financial patterns, embedding based retrieval can become concentrated around generic reimbursement and case mix concepts, while under retrieving concepts related to claim repetition or temporal utilization. This limitation motivates a retrieval strategy that uses both semantic similarity and structured information from model explanations.
2.4. Research Gap and Positioning of This Study
The reviewed literature suggests three main gaps. First, healthcare fraud detection studies often emphasize predictive performance but provide limited support for provider level audit interpretation. Second, explainability methods such as SHAP can identify important model drivers, but raw attribution values do not directly map those drivers to policy relevant audit concepts. Third, RAG can ground generated explanations in external knowledge, but pure embedding retrieval may retrieve generic policy information that is not sufficiently aligned with provider specific explanation patterns.
The present study is positioned at the intersection of these gaps. It does not claim that a public provider level label is a definitive fraud ground truth, nor does it claim that generated audit narratives replace expert audit judgment. Instead, it proposes and evaluates an engineering workflow that connects weak label risk screening, SHAP based explanation, exploratory provider archetyping, policy concept retrieval, and constrained narrative generation for audit prioritization.

Table 1.
Positioning of the proposed workflow relative to related research streams.
| Research stream | Typical focus | Position of this study |
|---|---|---|
| Healthcare fraud detection | Predict potentially suspicious providers or claims using statistical or machine learning models | Uses provider level risk screening as one component of an audit prioritization workflow rather than as a standalone fraud determination system |
| Explainable AI for tabular models | Explain feature contributions using global and local attribution methods | Uses SHAP outputs not only for interpretation but also for exploratory clustering and retrieval guidance |
| RAG and compliance question answering | Retrieve relevant textual evidence to support generated answers | Uses SHAP feature groups as structured retrieval signals to align policy concepts with provider specific model explanations |
| Audit decision support | Support human review, documentation checks, and prioritization | Generates cautious checklist style narratives while preserving human responsibility for final audit judgment |
Accordingly, the novelty of this work lies less in any single component, such as XGBoost, SHAP, or RAG, and more in the way these components are connected into a reproducible audit prioritization workflow. The workflow explicitly separates risk scoring, explanation, retrieval, and narrative generation, and it evaluates this pipeline using predictive validation, scale confounding sensitivity, clustering robustness checks, and retrieval ablation analysis.
3. Methodology
3.1. Overview of the Proposed Framework
This study proposes an explainable AI engineering workflow for healthcare claim audit support. The framework, as shown in Figure 1, is designed to transform provider level claim records into risk scores, model explanations, exploratory risk archetypes, policy concept retrieval results, and human readable audit narratives. The overall workflow consists of seven major stages. First, inpatient claims, outpatient claims, and beneficiary records are merged and aggregated into provider level features. Second, supervised learning models are evaluated for provider level audit prioritization, with XGBoost used as the main model for the downstream SHAP and RAG experiments. Third, SHAP is used to generate global feature importance and local provider level explanations. Fourth, local SHAP values are aggregated into feature group level explanation profiles, which are then clustered to identify exploratory provider risk archetypes. Fifth, a compact policy knowledge base is constructed to represent audit concepts related to financial intensity, claim volume and repetition, temporal utilization, coding complexity, beneficiary case mix, physician structure, and audit governance. Sixth, retrieval strategies are compared, including pure embedding retrieval, rule only SHAP group retrieval, and SHAP guided hybrid retrieval. Seventh, retrieved policy concepts and SHAP explanations are provided to a constrained language model to generate cautious audit reports and provider specific review checklists.
The framework is intentionally designed for audit prioritization rather than automatic fraud determination. The supervised model estimates a dataset label associated with potential fraud risk, but the final output is not a legal or administrative determination of fraud. The language model is also not used as a classifier. Instead, it functions as a constrained explanation layer that translates structured model outputs and retrieved policy concepts into human readable audit support text.
3.2. Data Source, Label Definition, and Ethics
The empirical analysis uses a public Medicare provider fraud benchmark dataset distributed through Kaggle and mirrored in public research repositories [17]. The files used in this study include provider label mapping files, inpatient claims, outpatient claims, and beneficiary information. The original files include Train-1542865627584.csv, Train_Inpatientdata-1542865627584.csv, Train_Outpatientdata-1542865627584.csv, and Train_Beneficiarydata-1542865627584.csv. The dataset is used as a secondary public dataset; no new patient recruitment, intervention, or direct contact with human subjects was conducted. Therefore, the present analysis did not require new institutional review board approval.
The target variable is PotentialFraud, which identifies whether a provider is labeled as potentially fraudulent in the dataset. Because the label is provided at the provider level rather than the individual claim level, the prediction task is formulated as provider level binary classification. This label is treated as a weak audit prioritization label rather than adjudicated ground truth. It should not be interpreted as a legal finding that a provider committed fraud. Possible label noise, misclassification, selection bias, and institutional reporting bias are therefore important limitations of the empirical setting.
Let i index providers. For each provider i, claim and beneficiary records are aggregated into a feature vector . The corresponding target label is denoted as , where indicates a provider labeled as potentially fraudulent in the dataset and indicates a non flagged provider. The learning objective is to estimate a provider level audit prioritization score
where is interpreted as a model based ranking score for audit prioritization. The score is used to rank providers, select high risk cohorts for explanation analysis, and construct provider specific audit narratives; it is not interpreted as a calibrated legal probability of fraud.
3.3. Provider Level Feature Aggregation
The raw data contain claim level and beneficiary level records. Since the target label is provider level, all features are aggregated to the provider level. Inpatient and outpatient claims are first concatenated after adding a claim type indicator. Claim start and end dates are used to compute claim duration. Admission and discharge dates are used to compute inpatient admission duration. Beneficiary birth date and death date are used to construct age and mortality indicators. Chronic condition indicators are transformed into binary variables, and an aggregate chronic condition count is computed.
Provider level features are organized into audit meaningful groups based on variable semantics, common claim review concepts, CMS/OIG fraud and abuse guidance, and prior healthcare fraud detection literature. No external auditor panel was used to define these groups; therefore, the grouping should be interpreted as a domain informed feature mapping rather than expert validated taxonomy.
Table 2.
Provider level feature groups used for modeling, SHAP aggregation, and retrieval guidance.
| Feature group | Representative features | Audit interpretation |
|---|---|---|
| Financial intensity | Total reimbursement, deductible amount, annual inpatient and outpatient reimbursement, reimbursement per beneficiary | High payment exposure, high value claim review, reimbursement intensity review |
| Claim volume and repetition | Total claim count, unique beneficiaries, claims per beneficiary, inpatient and outpatient claim counts | Claim volume outlier review, repeated service review, frequency based audit checks |
| Temporal utilization | Claim duration, admission duration, maximum inpatient stay duration | Medical necessity review, duration outlier review, length of stay documentation |
| Coding complexity | Diagnosis code counts, procedure code counts, admit diagnosis indicators | Coding intensity, diagnosis procedure consistency, upcoding related review |
| Beneficiary case mix | Age, mortality indicator, renal disease, chronic condition burden | Patient complexity context and case mix adjustment |
| Physician structure | Attending, operating, and other physician involvement | Provider operation structure and physician participation pattern |
| Beneficiary diversity | Race, state, and county diversity | Demographic and geographic context |
| Other provider profile | Derived ratios and auxiliary provider level indicators | Supporting provider level context |
Missing values are handled using median imputation during model training. Infinite values created by ratios are replaced before modeling. All categorical identifiers that do not represent provider level numeric information are excluded from the model feature matrix. The public dataset does not include referral pathways, inter facility transfers, provider network relationships, care coordination history, or originating provider diagnostic capability. These missing care pathway variables limit the ability of the current model to distinguish inappropriate referral behavior, unnecessary transfers, or cases where referral may have been clinically warranted but absent.
3.4. Supervised Risk Screening Models and Validation
Four supervised learning models are evaluated as provider level audit prioritization baselines: logistic regression, decision tree, random forest, and XGBoost. These models were selected because they represent commonly used tabular data baselines with different levels of complexity and interpretability. Neural networks were not used as the primary comparison because the dataset contains 5,410 provider level observations, the feature matrix is structured and tabular, and the central goal of the study is explainable audit support rather than maximizing black box predictive performance.
Class imbalance is addressed using class weights or positive class weighting. For XGBoost, the positive class weight is calculated from the training data:
where is the number of non flagged providers and is the number of potentially fraudulent providers in the training set.
XGBoost is trained with a binary logistic objective. Although SHAP can be applied to multiple tree based models, XGBoost is used as the main downstream workflow model because it provides competitive predictive performance, efficient TreeSHAP computation, and a stable basis for the subsequent explanation, clustering, and retrieval experiments. This choice is not intended to imply that XGBoost is uniquely explainable or uniformly superior to random forest.
Model performance is evaluated using ROC AUC, PR AUC, accuracy, precision, recall, and F1 score. ROC AUC measures general ranking ability, while PR AUC is particularly relevant because the target class is imbalanced. Precision, recall, and F1 score are used to evaluate fixed threshold operating points. To strengthen validation beyond a single 75/25 split, the revised analysis also includes stratified five fold cross validation, bootstrap confidence intervals on the held out test set, threshold sensitivity analysis, Brier score calculation, and calibration curve analysis.
Because provider size and financial exposure may confound the dataset label, an additional sensitivity analysis compares three feature settings: the full feature set, a scale only feature set containing aggregate exposure variables such as claim counts and reimbursement totals, and a non scale/context feature set that excludes direct volume and exposure variables. This analysis is used to assess whether predictive performance is driven mainly by provider size or whether normalized and contextual features also retain predictive information.
3.5. SHAP Based Global and Local Explanation
SHAP is used to interpret the trained XGBoost model [4]. For a provider i, SHAP decomposes the model output into a baseline value and feature level contributions:
where is the expected model output and is the SHAP value of feature j for provider i. A positive SHAP value increases the predicted audit prioritization score, while a negative SHAP value decreases it.
Global feature importance is calculated using the mean absolute SHAP value:
where represents the global contribution of feature j. Local explanations are generated for high risk providers by identifying the top positive and negative SHAP drivers for each provider. These local SHAP explanations serve as the structured input for both provider level audit prompts and policy retrieval.
3.6. Group Level SHAP Clustering for Provider Risk Typology
Raw feature level SHAP values are useful, but they can be dominated by a small number of high magnitude financial variables. To generate a more interpretable audit typology, this study aggregates SHAP values into domain informed feature groups. Let denote the set of features belonging to group k. For provider i, the absolute SHAP contribution of group k is calculated as
The group level SHAP share is then computed as
Each high risk provider is therefore represented by a vector of group level SHAP shares. High risk providers are selected based on the top 20 percent of predicted risk scores. K means clustering is applied to the standardized group level SHAP share matrix. Here, K denotes the number of clusters in K means, not the number of feature groups. Candidate values of K are evaluated using silhouette scores, and clustering stability is assessed across multiple random seeds using adjusted Rand index. The solution is used for the main archetype description because it provides interpretable audit patterns with acceptable silhouette scores and high seed stability. It should therefore be interpreted as an exploratory explanation typology rather than a clinically or legally validated provider taxonomy.
To reduce overinterpretation, clustering results are reported as descriptive explanation patterns among high risk providers. The clusters are not used to train the predictive model, and they are not interpreted as independent evidence of fraud. Sensitivity analyses are used to compare clustering behavior on high risk providers selected from the held out test set and from the full dataset scored by the training derived model.
3.7. Policy Knowledge Base Construction
A compact policy knowledge base is constructed to support policy grounded retrieval. Each entry contains a policy identifier, source description, audit concept, associated risk indicator, policy summary, and audit use case. The knowledge base covers the following risk indicator categories: financial intensity, claim volume and repetition, temporal utilization, coding complexity, beneficiary case mix, physician structure, and general audit governance.
Examples of audit concepts include high value reimbursement review, excessive reimbursement intensity, deductible and cost sharing review, claim volume outlier review, repeated services review, medical necessity review, long admission duration review, upcoding, diagnosis procedure consistency review, chronic condition context, age related utilization context, physician involvement pattern, documentation review workflow, and non automatic fraud determination. The knowledge base is curated for methodological demonstration and does not represent a complete legal, regulatory, payer specific, or expert validated policy database.
3.8. Pure Embedding Retrieval
The first retrieval strategy is pure embedding retrieval. Each policy knowledge entry is converted into a retrieval text by combining its audit concept, risk indicator, policy summary, and audit use case. OpenAI text-embedding-3-small embeddings are used to convert each retrieval text into a vector representation. For each provider, the structured SHAP explanation is also converted into a retrieval query and embedded using the same embedding model.
Let be the embedding vector of provider i’s SHAP based retrieval query, and let be the embedding vector of policy entry m. Pure embedding retrieval ranks policy entries using cosine similarity:
The top retrieved policy entries are used as the policy context for audit report generation.
3.9. SHAP Guided Hybrid Retrieval
Pure embedding retrieval may retrieve generic policy concepts when many high risk providers share similar financial patterns. To improve provider specificity, this study proposes a SHAP guided hybrid retrieval strategy. The hybrid strategy combines semantic similarity with a rule based boost derived from the feature groups appearing in the provider specific SHAP explanation.
First, the provider specific SHAP drivers are parsed to identify active feature groups, such as financial intensity, claim volume and repetition, temporal utilization, coding complexity, beneficiary case mix, and physician structure. Second, a rule boost is assigned to policy entries whose risk indicator or audit concept matches the active feature groups. For example, financial intensity features boost high value reimbursement and excessive reimbursement concepts; claim volume and repetition features boost claim volume outlier and repeated billing concepts; temporal utilization features boost medical necessity and duration review concepts; coding complexity features boost upcoding and code consistency concepts; beneficiary case mix features boost patient complexity concepts; and physician structure features boost physician involvement concepts.
The final hybrid retrieval score is calculated as
where is the normalized embedding similarity, is the normalized rule boost, and controls the balance between semantic retrieval and SHAP guided rule alignment. In the main experiment, , the rule boost weight is 0.45, and the top six policy entries are retrieved for each provider. Retrieval is evaluated on the 100 providers with the highest predicted risk scores.
To address the possibility that the hybrid method is rewarded for the same feature group rules used in retrieval, a retrieval ablation analysis is also conducted. The ablation compares pure embedding retrieval, rule only SHAP group retrieval, and SHAP guided hybrid retrieval. This allows the study to distinguish semantic retrieval behavior from rule enforced feature group alignment.
3.10. Constrained LLM Audit Narrative Generation
Retrieved policy concepts are combined with provider information, predicted risk score, top positive SHAP drivers, top negative SHAP drivers, and feature meanings to form a constrained prompt for audit narrative generation. The generation model used in the experiment is gpt-4.1-mini, with temperature set to 0.2. The prompt instructs the model to generate an audit narrative, a policy grounded interpretation, a provider specific audit checklist, and a caution statement.
The prompt contains explicit safety constraints. The model is instructed not to state that a provider committed fraud, not to invent facts beyond the structured explanation and retrieved policy knowledge, and not to make a legal conclusion. The generated report must use cautious language such as “may indicate,” “is associated with,” “could warrant,” and “requires further review.” The report is also required to state that the output supports audit prioritization rather than automatic fraud determination.
The LLM layer is evaluated as a constrained narrative generation component rather than as an independent audit decision maker. Rule based checks are used to verify whether generated reports contain cautious language, avoid definitive accusations, include checklist items, and mention audit relevant concepts. These checks assess prompt compliance and formatting behavior; they do not establish clinical correctness, legal correctness, or expert audit usefulness.
3.11. Evaluation of Retrieval and Generated Audit Reports
The framework is evaluated at four levels. First, predictive performance is evaluated using standard classification metrics, five fold cross validation, bootstrap confidence intervals, threshold analysis, and calibration metrics. Second, confounding sensitivity is evaluated by comparing full feature, scale only, and non scale/context feature settings. Third, explainability is evaluated using global SHAP importance, local SHAP explanations, group level SHAP clustering, silhouette scores, and seed stability. Fourth, retrieval and language generation are evaluated using retrieval diversity, retrieval ablation, driver-policy alignment checks, and rule based audit report compliance checks.
For retrieval evaluation, pure embedding retrieval, rule only SHAP group retrieval, and SHAP guided hybrid retrieval are compared using the number of unique retrieved audit concepts, the number of unique policy entries, the number of unique risk indicator categories, and concept concentration. Concept concentration is measured using the Herfindahl Hirschman Index:
where is the share of retrieved entries belonging to concept c. A lower HHI indicates a less concentrated and more diverse retrieval distribution.
Additional retrieval alignment metrics measure whether the retrieved policy risk indicator matches one of the detected SHAP feature groups and whether the retrieved audit concept shares driver related keywords with the provider specific SHAP explanation. These metrics provide a structured retrieval diagnostic, but they do not replace independent expert relevance judgments.
For generated audit reports, rule based checks are applied to verify whether each report contains cautious language, avoids definitive fraud accusations, includes an audit checklist, and mentions policy or audit relevant concepts. These checks are not intended to certify legal correctness. They are used to evaluate whether generated reports follow the intended audit support framing.
4. Results
4.1. Provider Level Cohort and Analytical Setting
After aggregating inpatient claims, outpatient claims, and beneficiary information to the provider level, the analytical dataset contained 5,410 providers and 91 numeric provider level features. Among these providers, 506 were labeled as potentially fraudulent and 4,904 were non flagged, corresponding to a positive label rate of 9.35%. The dataset was split using stratified sampling into 4,057 training providers and 1,353 held out test providers. The test set contained 127 providers with the PotentialFraud label and 1,226 non flagged providers.
Because PotentialFraud is a dataset provided weak label rather than an adjudicated fraud determination, all performance results should be interpreted as audit prioritization performance against the available benchmark label. The results do not establish that the model detects legally confirmed fraud.
Table 3.
Provider level analytical cohort.
| Item | Count | Percentage |
|---|---|---|
| Total providers | 5,410 | 100.00% |
| Non flagged providers | 4,904 | 90.65% |
| Potentially fraudulent providers | 506 | 9.35% |
| Provider level numeric features | 91 | – |
| Training providers | 4,057 | 75.00% |
| Test providers | 1,353 | 25.00% |
| Training potentially fraudulent providers | 379 | 9.34% |
| Test potentially fraudulent providers | 127 | 9.39% |
4.2. Predictive Performance and Cross Validation
Four supervised learning models were evaluated as provider level audit prioritization baselines: logistic regression, decision tree, random forest, and XGBoost. These models were included to compare a linear baseline, a simple tree model, a bagging based tree ensemble, and a gradient boosted tree ensemble on the same provider level feature set. Because the positive class is relatively rare, ROC AUC, PR AUC, precision, recall, and F1 score were considered together rather than relying only on accuracy.
Table 4.
Predictive performance of provider level audit prioritization models on the held out test set.
Table 4.
Predictive performance of provider level audit prioritization models on the held out test set.
| Model | ROC AUC | PR AUC | Accuracy | Precision | Recall | F1 |
|---|---|---|---|---|---|---|
| Logistic regression | 0.955 | 0.744 | 0.888 | 0.449 | 0.858 | 0.589 |
| Decision tree | 0.932 | 0.663 | 0.897 | 0.473 | 0.906 | 0.622 |
| Random forest | 0.961 | 0.742 | 0.925 | 0.568 | 0.850 | 0.681 |
| XGBoost | 0.957 | 0.736 | 0.921 | 0.553 | 0.819 | 0.660 |
On the held out test set, random forest achieved the highest ROC AUC and F1 score, while XGBoost achieved comparable performance. Therefore, XGBoost is not presented as the uniquely best classifier. It is used as the main downstream workflow model because it provides competitive performance and an efficient basis for TreeSHAP based explanation, group level SHAP analysis, and retrieval guided audit narrative generation.
To strengthen validation beyond a single train test split, stratified five fold cross validation was performed. Table 5 reports mean and standard deviation values across folds. XGBoost achieved a mean ROC AUC of 0.951, PR AUC of 0.736, and F1 score of 0.655. Random forest achieved a similar F1 score of 0.652 and ROC AUC of 0.948. These results indicate that the two tree ensemble models provide broadly comparable audit prioritization performance under cross validation.
The cross validation results support using XGBoost as a representative tree ensemble model for the remainder of the workflow, but they also show that the predictive component is not the main methodological novelty of the paper. The contribution of the study lies in connecting risk screening with SHAP based explanation, exploratory explanation archetyping, policy concept retrieval, and constrained audit narrative generation.
4.3. Threshold Sensitivity, Calibration, and Size Confounding
Audit prioritization depends on the operating threshold and available review capacity. A lower threshold identifies more providers for review and increases recall, while a higher threshold increases precision but misses more providers with the dataset positive label. Table 6 shows the XGBoost precision recall tradeoff across representative thresholds.
These results show that the predicted score is best interpreted as a ranking and triage score rather than a fixed decision rule. For example, a lower threshold may be appropriate when the audit objective is broad screening and high recall, whereas a higher threshold may be appropriate when review capacity is limited and higher precision is preferred. In this study, the score is used to rank providers, select the top risk cohort for explanation based analysis, and provide contextual information for generated audit narratives. It is not used as an automatic fraud determination.
Calibration was also examined using Brier score and calibration curves. On the held out test set, XGBoost achieved a Brier score of 0.057, while random forest achieved a Brier score of 0.055. These values suggest that the predicted scores are usable for prioritization against the benchmark label. However, because PotentialFraud is a weak dataset label rather than adjudicated fraud ground truth, the scores should not be interpreted as legally calibrated probabilities of fraud.
A central methodological concern is that provider size and financial exposure may confound the prediction task. The strongest global predictors include total reimbursement, total claim count, inpatient claim count, and deductible totals, which may partly reflect provider scale rather than inappropriate billing behavior. To examine this issue, three feature settings were compared using XGBoost and stratified five fold cross validation: the full feature set, a scale only feature set, and a non scale/context feature set that excludes direct aggregate exposure variables.
Table 7.
Scale confounding sensitivity analysis using five fold cross validation with XGBoost.
| Feature setting | ROC AUC | PR AUC | F1 |
|---|---|---|---|
| Full features | |||
| Scale only features | |||
| Non scale/context features |
The scale only model achieved substantial performance, confirming that provider size and financial exposure are important confounders in this dataset. However, the non scale/context feature model retained performance close to the full model, suggesting that normalized utilization, case mix, coding, physician structure, and contextual variables also carry predictive information. These results support retaining the full workflow while explicitly acknowledging that residual size confounding remains a limitation. Future work should incorporate stronger peer group adjustment, provider specialty information, facility size measures, regional controls, and prospective expert audit review.
4.4. Global SHAP Explanation
The trained XGBoost model was interpreted using SHAP to identify the main provider level model drivers. Figure 2 shows the top 20 features ranked by mean absolute SHAP value. The most important feature was total insurance claim reimbursement, indicating that cumulative payment exposure was the dominant global driver of the model. Other highly ranked features included maximum admission duration, claims per beneficiary, total deductible amount, median reimbursed amount per claim, total claim count, and reimbursement per beneficiary. These features should be interpreted as model drivers for the dataset label rather than as direct evidence of fraudulent behavior. In particular, reimbursement totals and claim counts may reflect provider scale, specialization, case volume, or patient population in addition to potential audit risk.
To further assess how concentrated the global explanation was, the cumulative SHAP importance curve was examined. As shown in Figure 3, the top 10 features accounted for approximately 49.3% of the total mean absolute SHAP importance. Approximately 36 features were required to explain 80% of the total importance, and 49 features were required to explain 90%. This pattern indicates that the model was driven by a relatively concentrated set of leading variables, while still incorporating a broader set of contextual provider level features.
The SHAP results reinforce the scale confounding analysis. Financial exposure variables were prominent, which means that the model may partly learn provider size and billing volume. However, temporal utilization, claims per beneficiary, deductible patterns, and beneficiary case mix also contributed to prediction. This supports the need for human audit interpretation, peer comparison, and contextual review rather than direct accusation based on model output.
To move from individual features to broader audit concepts, features were grouped into domain informed categories. Figure 4 summarizes the share of total mean absolute SHAP importance by feature group. Financial intensity accounted for the largest share of model explanation, followed by beneficiary case mix, temporal utilization, and claim volume and repetition. This result confirms that payment related variables dominate the global model behavior, but it also shows that the model incorporated patient complexity and utilization patterns. Importantly, beneficiary case mix variables should be interpreted as contextual factors rather than evidence of improper billing. Their contribution suggests that the model uses patient complexity to contextualize provider utilization and reimbursement patterns.
Overall, the global SHAP analysis shows that the model learned a multi dimensional provider risk profile under the available weak label. Financial intensity was the leading model driver, but temporal utilization, claim frequency, deductible patterns, and case mix also contributed to prediction. Because several leading features may be correlated with provider scale, these explanations should be used to guide review questions and peer adjusted analysis rather than to draw conclusions about misconduct. This motivates the subsequent group level SHAP clustering analysis, which examines whether high risk providers can be separated into different explanation based risk archetypes.
4.5. Explanation Based Provider Risk Archetypes
To further examine whether high risk providers shared a common explanation pattern or represented different types of audit prioritization profiles, group level SHAP clustering was performed on providers in the top 20 percent of predicted risk scores. Instead of clustering providers using raw claim variables, each provider was represented by the percentage contribution of major feature groups to its local SHAP explanation. This approach groups providers according to why the model assigned a high risk score, making the resulting clusters more directly interpretable for audit support.
The revised analysis treats these clusters as exploratory explanation archetypes rather than validated clinical, operational, or legal categories. Candidate cluster numbers from to were evaluated using silhouette scores, and clustering stability was assessed across random seeds using adjusted Rand index. Here, K denotes the number of clusters in K means.
Table 8.
Robustness checks for group level SHAP clustering with .
| Analysis scope | Providers | Silhouette score | Mean adjusted Rand index |
|---|---|---|---|
| Held out test high risk providers | 271 | 0.221 | 0.908 |
| Full dataset scored by training derived model | 1,082 | 0.194 | 0.993 |
The solution was not the maximum silhouette solution across all candidate values. However, it provided a compact and interpretable archetype structure with high random seed stability. Therefore, was retained for the main descriptive analysis. The resulting clusters should be interpreted as explanation based patterns among high risk providers, not as proof of distinct fraud mechanisms.
Table 9 summarizes the four explanation based clusters. Cluster 0 contained 80 providers and had the highest dataset positive label rate of 92.5%, with a mean predicted risk score of 0.973. Its SHAP explanation profile was dominated by financial intensity and temporal utilization. This cluster was therefore interpreted as an extreme high cost inpatient pattern. Providers in this group may require review of high value reimbursement claims, inpatient service intensity, admission duration, and medical necessity documentation.
Cluster 1 contained 428 providers and had a dataset positive label rate of 31.5%, with a mean predicted risk score of 0.559. Its explanation profile combined financial intensity, temporal utilization, and beneficiary case mix. This cluster was interpreted as a mixed utilization and case mix pattern. Because beneficiary complexity contributed substantially to the explanation profile, providers in this cluster require cautious interpretation and peer adjusted review.
Cluster 2 contained 493 providers and had a dataset positive label rate of 45.6%, with a mean predicted risk score of 0.702. Its explanation profile was dominated by financial intensity, beneficiary case mix, and temporal utilization. This cluster was interpreted as a financial intensity with complex case mix pattern. Providers in this group may require reimbursement review together with patient complexity and utilization context.
Cluster 3 contained 81 providers and had a dataset positive label rate of 75.3%, with a mean predicted risk score of 0.850. Its explanation profile combined financial intensity with claim volume and repetition. This cluster was interpreted as a high volume repeated claim pattern. Providers in this group may require claim frequency analysis, beneficiary level repetition checks, and review of potentially duplicate or repeated services.
Table 9.
Exploratory explanation based provider risk archetypes identified by group level SHAP clustering. Positive rate refers to the dataset PotentialFraud label and should not be interpreted as an adjudicated fraud rate.
Table 9.
Exploratory explanation based provider risk archetypes identified by group level SHAP clustering. Positive rate refers to the dataset PotentialFraud label and should not be interpreted as an adjudicated fraud rate.
| Cluster | Suggested archetype | Providers | Positive rate | Mean risk | Top feature groups |
|---|---|---|---|---|---|
| 0 | Extreme high cost inpatient pattern | 80 | 0.925 | 0.973 | Financial; temporal |
| 1 | Mixed utilization and case mix pattern | 428 | 0.315 | 0.559 | Financial; temporal; case mix |
| 2 | Financial intensity with complex case mix | 493 | 0.456 | 0.702 | Financial; case mix; temporal |
| 3 | High volume repeated claim pattern | 81 | 0.753 | 0.850 | Financial; claim volume; case mix |
Figure 5 visualizes the cluster level SHAP feature group composition. The heatmap shows that all clusters were influenced by financial intensity, but the relative contribution of temporal utilization, beneficiary case mix, and claim volume differed across clusters. This supports the interpretation that high risk providers were not homogeneous in their explanation profiles.
Figure 6 further shows that the clusters differed not only in explanation structure but also in mean predicted risk score and dataset positive label rate. Cluster 0 had the highest mean risk score and dataset positive label rate, while Cluster 1 had the lowest. Cluster 3 had fewer providers but a relatively high dataset positive label rate and a distinct claim volume component.
Overall, the clustering analysis suggests that high risk providers can be described using different explanation profiles, such as high cost inpatient intensity, mixed utilization and case mix, and high volume repeated claim patterns. However, these archetypes remain exploratory. They are useful for organizing audit review questions and retrieved policy concepts, but they require expert validation before being used as operational audit categories.
4.6. Policy Concept Alignment Across Provider Archetypes
After identifying exploratory SHAP based provider archetypes, the next analysis examined whether these archetypes were associated with different retrieved audit concepts. The purpose of this analysis was not to validate the clusters as fraud categories, but to assess whether the retrieval layer produced different policy concept profiles for providers with different explanation patterns.
This analysis is descriptive. Because the policy knowledge base is curated and the hybrid retriever includes feature group based rule boosting, concept alignment should be interpreted as evidence that the engineering workflow behaves as intended, not as independent proof of policy relevance or audit correctness.
Figure 7 presents the cluster by policy concept heatmap. Across all clusters, common concepts such as high value reimbursement review and excessive reimbursement intensity appeared frequently, reflecting the strong contribution of financial intensity features across the high risk cohort. However, the distribution of other retrieved concepts differed by cluster. Claim volume related concepts appeared more often in the high volume repeated claim pattern, while inpatient utilization and duration related concepts appeared more often in clusters with stronger temporal utilization contributions. Case mix related concepts appeared more prominently in clusters where beneficiary complexity contributed more strongly to the SHAP explanation profile.
To further examine relative overrepresentation, Figure 8 presents the cluster by policy concept lift heatmap. Lift values compare the within cluster frequency of a retrieved policy concept with its overall frequency across all clusters. Values greater than 1 indicate that a concept is overrepresented within a given cluster. The lift analysis reinforces the descriptive interpretation of the provider archetypes. In particular, the high volume repeated claim pattern showed stronger relative association with duplicate or repeated claim related concepts, while the high cost inpatient pattern showed stronger association with inpatient utilization and documentation review concepts.
These results suggest that explanation based provider archetypes can be connected to differentiated audit review questions. A high cost inpatient pattern may motivate review of high value claims, length of stay, and medical necessity documentation. A mixed utilization and case mix pattern may require peer comparison and case mix adjustment before drawing conclusions. A high volume repeated claim pattern may motivate claim frequency analysis, beneficiary level repetition checks, and review of potentially duplicate services.
At an organizational level, repeated archetype level patterns may also provide signals for internal compliance monitoring, staff training, and audit resource allocation. For example, recurring claim volume and repetition patterns may indicate a need for billing workflow review, while recurring temporal utilization patterns may motivate additional documentation training for inpatient stays. These implications remain preliminary because the present study does not include expert auditor validation or operational deployment data.
4.7. Comparison and Ablation of Retrieval Strategies
To evaluate whether SHAP guided retrieval changed the policy grounding layer, pure embedding retrieval was compared with SHAP guided hybrid retrieval. Both methods were evaluated on 100 high risk providers, and each method retrieved six policy entries per provider. Therefore, each retrieval method produced 600 retrieved policy entries. Pure embedding retrieval ranked policy entries only by embedding based cosine similarity, while the hybrid method combined embedding similarity with a SHAP feature group based rule boost.
A retrieval ablation analysis was added to address the concern that hybrid retrieval may be rewarded for the same feature group rules used in the scoring function. The ablation compares three strategies: pure embedding retrieval, rule only SHAP group retrieval, and SHAP guided hybrid retrieval. Pure embedding retrieval measures semantic similarity alone. Rule only retrieval measures the effect of feature group based policy boosting without embedding similarity. Hybrid retrieval combines both components.
Table 10.
Retrieval diversity and ablation comparison across retrieval strategies.
| Retrieval method | Providers | Retrievals | Unique concepts | Risk categories | Concept HHI |
|---|---|---|---|---|---|
| Pure embedding | 100 | 600 | 9 | 4 | 0.163 |
| SHAP guided hybrid | 100 | 600 | 15 | 5 | 0.131 |
| Rule only SHAP group | 100 | 600 | 18 | 6 | 0.121 |
Compared with pure embedding retrieval, the SHAP guided hybrid method increased the number of unique retrieved audit concepts from 9 to 15, expanded represented risk categories from 4 to 5, and reduced concept concentration from 0.163 to 0.131. The rule only method produced even greater concept diversity and lower concentration, confirming that part of the hybrid method’s improvement comes from the manually specified SHAP group boost. Therefore, the hybrid method should be interpreted as an engineering tradeoff between semantic similarity and explanation guided retrieval control, not as independent proof of superior audit relevance.
Figure 9 further compares the top retrieved audit concepts between pure embedding retrieval and SHAP guided hybrid retrieval. Pure embedding retrieval was concentrated around broadly relevant concepts such as high value reimbursement review, excessive reimbursement intensity, chronic condition context, case mix adjustment, billing for higher level services, and physician diversity review. In comparison, SHAP guided hybrid retrieval retained the major financial and case mix concepts while also retrieving a wider range of concepts, including claim volume outlier review, age related utilization context, inpatient utilization anomaly, duration outlier documentation review, and renal disease case mix context. This broader concept coverage is useful because provider risk explanations are not limited to reimbursement intensity alone.
Figure 10 compares the distribution of retrieved risk indicator categories. The largest difference occurred in claim volume and repetition. Pure embedding retrieval retrieved only 1 claim volume and repetition entry across 600 retrievals, while SHAP guided hybrid retrieval retrieved 65 such entries. The hybrid method also introduced temporal utilization concepts, which were absent under pure embedding retrieval. At the same time, the hybrid method reduced the overrepresentation of physician structure concepts.
The retrieval comparison supports the main engineering motivation for hybrid retrieval. In healthcare claim audit, retrieval should not only identify semantically similar policy text; it should also reflect the specific model drivers that caused a provider to be prioritized. However, because the hybrid score explicitly includes SHAP feature group rules, higher risk category coverage is partly expected by design. Independent expert evaluation, manual relevance judgments, or comparison with reranking methods would be required to determine whether the retrieved concepts are more useful in operational audit practice.
4.8. Provider Level Case Study
To illustrate how the proposed framework translates model outputs into audit support language, a provider level case study was examined using the SHAP guided hybrid RAG output. Provider PRV56560 was selected because it received one of the highest predicted risk scores in the high risk cohort. The provider had a predicted risk score of 0.999 and was labeled as potentially fraudulent in the dataset.
This case study is intended to demonstrate the workflow mechanics rather than to establish that the provider committed fraud. The dataset label, risk score, SHAP explanation, retrieved concepts, and generated narrative are all treated as audit prioritization information requiring human review.
The local SHAP explanation showed that the provider’s risk score was primarily driven by financial intensity, claim volume and repetition, and temporal utilization features. The strongest positive driver was total insurance claim reimbursement, with a provider level value of 3,212,000 and a SHAP value of 2.081. The second strongest driver was total claim count, with 2,313 submitted claims and a SHAP value of 1.545. Additional positive drivers included maximum admission duration of 36 days, claims per beneficiary of 2.517, and 248 inpatient claims. These values indicate why the model assigned a high prioritization score, but they do not by themselves establish inappropriate billing or misconduct.
The SHAP guided hybrid retrieval module retrieved six policy concepts for this provider: claim volume outlier review, high value reimbursement review, excessive reimbursement intensity, chronic condition context, case mix adjustment, and age related utilization context. This retrieval profile is consistent with the provider’s local explanation. Claim volume outlier review corresponds to the high claim count and claims per beneficiary model drivers. High value reimbursement review and excessive reimbursement intensity correspond to the large total reimbursed amount. Chronic condition context, case mix adjustment, and age related utilization context provide cautionary context for interpreting utilization intensity, especially when beneficiary complexity may partly explain service use.
Table 11.
Provider level case study using SHAP guided hybrid RAG. The case illustrates audit prioritization workflow behavior and does not represent a fraud determination.
Table 11.
Provider level case study using SHAP guided hybrid RAG. The case illustrates audit prioritization workflow behavior and does not represent a fraud determination.
| Item | Case detail |
|---|---|
| Provider ID | PRV56560 |
| Predicted risk score | 0.999 |
| Dataset label | Potentially fraudulent |
| Main positive SHAP drivers | Total reimbursement; total claim count; maximum admission duration; claims per beneficiary; inpatient claim count |
| Detected feature groups | Financial intensity; claim volume and repetition; temporal utilization; beneficiary case mix |
| Retrieved policy concepts | Claim volume outlier review; high value reimbursement review; excessive reimbursement intensity; chronic condition context; case mix adjustment; age related utilization context |
| Audit interpretation | High reimbursement exposure and high claim volume may warrant documentation review, peer comparison, and claim frequency analysis |
| Caution | Audit prioritization only; not a fraud determination |
The generated audit report did not state that the provider committed fraud. Instead, it framed the model output as an audit prioritization signal. The report recommended verifying high value claims, assessing whether the claim volume was consistent with provider capacity and patient population, reviewing inpatient records with extended durations, comparing reimbursement intensity against peer benchmarks, and considering beneficiary case mix before drawing conclusions.
This example illustrates how numerical risk scores, SHAP drivers, retrieved policy concepts, and constrained language generation can be connected into a human review artifact. It does not validate the correctness of the audit recommendation without independent expert assessment.
5. Discussion
5.1. Main Findings and Revised Interpretation
The results show that provider level claim audit prioritization can be extended beyond binary prediction into an explainable and policy connected workflow. However, the revised analysis also clarifies the boundaries of this claim. The framework should be interpreted as an engineering workflow for audit prioritization under a weak provider level label, not as a validated fraud determination system. The PotentialFraud label provides a useful benchmark for methodological evaluation, but it does not establish adjudicated misconduct.
The supervised models achieved strong benchmark performance, but the predictive component is not the main methodological novelty of the study. Random forest slightly outperformed XGBoost on the held out test set, while XGBoost achieved comparable performance under five fold cross validation. XGBoost was therefore used as the main downstream workflow model because it provides a stable and efficient basis for TreeSHAP based explanation, group level SHAP analysis, and retrieval guided narrative generation. This choice should not be interpreted as evidence that XGBoost is uniquely superior or uniquely explainable.
The additional validation analyses strengthen the empirical foundation of the study. Five fold cross validation showed that XGBoost achieved a mean ROC AUC of 0.951, PR AUC of 0.736, and F1 score of 0.655. Threshold sensitivity analysis showed that different operating points produce different precision recall tradeoffs, supporting the use of the model score as a triage and ranking score rather than as a fixed decision rule. Calibration analysis further suggested that the scores can be used for prioritization against the benchmark label, but not as legally calibrated probabilities of fraud.
The global SHAP analysis showed that financial intensity was the dominant driver of provider risk prediction. This finding is expected because reimbursement and deductible related variables directly reflect payment exposure. At the same time, this result must be interpreted cautiously. High reimbursement, high claim count, and inpatient claim volume may reflect provider size, specialization, regional practice patterns, or patient population rather than abusive behavior. The scale confounding sensitivity analysis confirmed this concern: scale only features were strongly predictive, although non scale and contextual features also retained substantial predictive information.
These findings support a more careful interpretation of the framework. The model can help prioritize providers for review and identify the feature groups that contributed to prioritization, but the output should not be used to accuse providers or replace human audit judgment. The appropriate use of the framework is to generate structured review questions, highlight model drivers, retrieve relevant audit concepts, and support documentation review by human auditors.
5.2. Explanation Archetypes and Organizational Audit Use
The group level SHAP clustering analysis suggests that high risk providers are not homogeneous in their explanation profiles. Four exploratory archetypes were identified: an extreme high cost inpatient pattern, a mixed utilization and case mix pattern, a financial intensity with complex case mix pattern, and a high volume repeated claim pattern. These archetypes help translate model outputs from individual feature attributions into broader audit review themes.
The revised robustness analysis supports a cautious interpretation of these clusters. The solution showed high random seed stability, but it was not selected as a mathematically optimal clustering solution based only on silhouette score. Therefore, the clusters should be interpreted as exploratory explanation archetypes rather than validated clinical, organizational, or legal categories.
From an audit workflow perspective, the archetypes can support differentiated review planning. A high cost inpatient pattern may motivate review of high value claims, length of stay, medical necessity documentation, and inpatient service intensity. A high volume repeated claim pattern may motivate claim frequency analysis, beneficiary level repetition checks, and review of potentially duplicate services. A mixed utilization and case mix pattern requires more cautious interpretation because patient complexity may partly explain elevated utilization or reimbursement.
Beyond individual provider review, recurring archetype level patterns may also provide organizational learning signals. For example, repeated claim volume patterns may indicate a need to review billing workflows, coding practices, or staff training around repeated services. Temporal utilization patterns may suggest the need for documentation training related to length of stay or medical necessity. Case mix dominated patterns may indicate that peer group comparison and patient complexity adjustment should be strengthened before drawing audit conclusions.
These organizational implications are preliminary. The current study does not include longitudinal deployment, expert auditor review, provider specialty controls, or internal compliance outcome data. Therefore, the archetypes should be used as structured hypotheses for human review rather than as automatic triggers for organizational policy changes. Future work should evaluate whether recurring explanation archetypes correspond to meaningful audit findings, training needs, or compliance improvement opportunities in operational settings.
5.3. SHAP Guided Retrieval and LLM Narrative Generation
The retrieval results show that incorporating SHAP feature group information changes the policy concepts retrieved for high risk providers. Compared with pure embedding retrieval, the SHAP guided hybrid method retrieved more unique audit concepts, covered more risk indicator categories, and reduced concept concentration. This suggests that model explanation structure can be used to guide downstream retrieval rather than being consumed only as a post hoc interpretation artifact.
However, the revised ablation analysis also clarifies the limits of this finding. The rule only SHAP group retrieval strategy produced even higher concept diversity and lower concentration than the hybrid strategy. This confirms that part of the improvement observed under hybrid retrieval is induced by the manually specified feature group boost. Therefore, the hybrid retriever should not be interpreted as independently proving superior policy relevance. Instead, it should be understood as an engineering mechanism that trades off semantic similarity with explanation guided retrieval control.
This distinction is important for audit support. Pure semantic retrieval may retrieve broadly relevant but generic policy concepts, especially when many providers share reimbursement related language in their SHAP explanations. SHAP guided retrieval can force greater attention to the specific feature groups that contributed to the model score, such as claim volume and repetition or temporal utilization. At the same time, retrieval diversity and feature group coverage are diagnostic metrics, not substitutes for expert relevance judgments. A concept can be diverse and aligned with a SHAP group while still being less useful to an auditor in a specific case.
The constrained language model layer further illustrates how structured model explanations and retrieved policy concepts can be converted into audit support narratives. The generated reports used cautious language, avoided definitive accusations, included checklist items, and connected model drivers with audit concepts. This behavior is useful because high stakes audit support requires the language model to avoid converting a risk score into a fraud accusation.
Nevertheless, the rule based evaluation of generated reports remains limited. Checking whether a report contains cautious wording, a checklist, or audit terminology primarily evaluates prompt compliance and report format. It does not establish factual correctness, legal correctness, clinical appropriateness, or operational usefulness. The generated narratives should therefore be treated as draft audit support artifacts that require review by qualified auditors or compliance professionals.
Future work should evaluate the retrieval and narrative layers using independent expert annotation, blinded policy relevance judgments, comparison with stronger retrieval baselines such as cross encoder reranking, and prospective assessment of whether generated checklists improve audit efficiency or decision quality.
5.4. Care Pathway and Referral Data Extensions
The current empirical analysis is based on inpatient claims, outpatient claims, beneficiary information, and provider level aggregation. These data sources are useful for modeling reimbursement intensity, claim volume, utilization duration, coding complexity, physician involvement, and beneficiary case mix. However, they do not fully represent the broader care pathway surrounding a claim.
Referral behavior and care coordination data could provide important additional context for healthcare claim audit. For example, referral related variables may help identify unusual referral concentration, excessive inter facility transfers, repeated referral loops, inappropriate treatment pathways, or cases where patients were not referred despite limited diagnostic or treatment capability at the originating provider. Such patterns may be relevant not only to fraud, waste, and abuse screening, but also to healthcare quality, provider capability, continuity of care, and operational governance.
This limitation is particularly important in rural healthcare systems and multi-level care networks. In such settings, elevated utilization, repeated transfers, or concentration of services at a higher-level provider may reflect limited local diagnostic capacity, specialist shortages, long travel distances, or clinically appropriate escalation of care rather than inappropriate billing behavior. Without referral origin, referral destination, transfer reason, facility capability, and network-level care coordination information, the present framework cannot reconstruct the full clinical pathway that precedes a claim. Consequently, its outputs should not be used to evaluate referral appropriateness, transfer necessity, continuity of care, or network-level utilization management.
The public dataset used in this study does not include referral pathways, inter facility transfers, provider network edges, care coordination records, provider specialty, facility size, regional referral patterns, or originating provider diagnostic capability. As a result, the current model cannot distinguish whether elevated utilization reflects inappropriate treatment behavior, legitimate specialization, referral center status, regional access constraints, or complex patient pathways.
The proposed workflow is nevertheless modular. If referral and care coordination data were available, they could be added during the provider level aggregation stage, represented as additional feature groups, incorporated into SHAP based explanation, included in explanation archetype analysis, and mapped to care coordination or referral review concepts in the retrieval layer. For example, provider to provider referral graph features could be used to measure referral concentration, inbound and outbound referral imbalance, or repeated transfer patterns. Facility capability indicators could help distinguish appropriate referral behavior from potentially concerning care pathway deviations.
Future work should therefore extend the framework beyond claim level and provider level billing aggregation toward care pathway aware audit support. Such extensions would allow the system to generate review questions not only about reimbursement intensity or repeated billing, but also about whether the care trajectory, referral pattern, and provider capability context are consistent with appropriate clinical and operational practice.
5.5. Positioning Relative to Prior Work
The proposed framework builds on established components rather than introducing a new classifier, a new feature attribution method, or a new language model architecture. XGBoost, SHAP, and RAG are all existing methods. The contribution of this study lies in connecting these components into a provider level audit prioritization workflow and evaluating the interaction between prediction, explanation, retrieval, and narrative generation under a weak label healthcare claims setting.
Compared with conventional healthcare fraud detection studies, the present work does not focus only on classification performance. Instead, it examines how a provider level risk score can be decomposed into local model drivers, organized into explanation based archetypes, linked to policy concepts, and translated into cautious audit support language. This distinction is important because audit practice requires not only identifying which providers should be reviewed, but also understanding why they were prioritized and what review questions may be appropriate.
Compared with standard post hoc explainability studies, the present workflow uses SHAP values beyond feature ranking. SHAP outputs are aggregated into feature groups, used to construct exploratory explanation archetypes, and used as structured signals for policy concept retrieval. This use of explanation outputs as retrieval control signals is the central engineering idea of the framework.
Compared with general RAG applications, the retrieval layer is not driven only by semantic similarity between a query and a document. Instead, retrieval is partly guided by the feature groups that explain the provider level model score. This design makes the retrieved policy concepts more directly connected to model specific drivers such as reimbursement intensity, claim volume, temporal utilization, coding complexity, or case mix. At the same time, the revised ablation analysis shows that this design also introduces rule induced alignment, so the results should be interpreted as workflow behavior rather than independent proof of audit relevance.
Overall, the study should be understood as a rigorously revised engineering prototype for explainable audit prioritization. Its novelty lies in the workflow integration and in the use of SHAP guided retrieval for audit narrative generation, while its current empirical evidence remains limited by weak labels, public dataset constraints, lack of expert validation, and the absence of prospective deployment.
6. Limitations and Future Work
This study has several limitations. First, the empirical analysis is based on a public Medicare provider fraud dataset in which the target variable is PotentialFraud. This label should be interpreted as a dataset provided weak label for audit prioritization rather than an adjudicated legal determination of fraud. The labeling process may contain misclassification, selection bias, reporting bias, or institutional bias. Therefore, the reported predictive performance measures how well the models reproduce the available benchmark label, not how well they identify legally confirmed fraudulent behavior. Future work should evaluate the framework using datasets with clearer label provenance, expert adjudication, or confirmed audit outcomes.
Second, provider size and financial exposure are important confounding factors. The SHAP analysis showed that total reimbursement, claim count, deductible totals, and other aggregate exposure variables were major model drivers. The scale confounding sensitivity analysis confirmed that scale only features were strongly predictive, although non scale and contextual features also retained substantial predictive information. This means that the model may partly learn provider volume, specialization, referral center status, or patient population rather than inappropriate billing behavior. Future work should incorporate stronger peer group adjustment, provider specialty information, facility size controls, regional controls, service line stratification, and prospective expert review.
Third, the analysis is conducted at the provider level because the label is defined at the provider level. Although this design is appropriate for provider screening, aggregation of inpatient claims, outpatient claims, and beneficiary records may simplify claim level sequences, service level details, temporal ordering, and beneficiary level interactions. Future work could extend the framework to multi level modeling that combines provider level prioritization with claim level, beneficiary level, and episode level explanations.
Fourth, the public dataset does not include referral pathways, referral origin and destination, inter-facility transfers, provider-network relationships, care-coordination records, provider specialty, facility capability, facility size, regional referral patterns, or originating-provider diagnostic capacity. These missing variables are especially consequential in rural healthcare systems and multi-level care networks, where elevated utilization or transfer patterns may reflect limited local resources, specialist shortages, referral-center status, geographic access barriers, or clinically appropriate escalation of care. The current model therefore cannot determine whether a utilization pattern reflects inappropriate treatment behavior, unnecessary transfer, legitimate specialization, or an appropriate care pathway. Accordingly, the framework is limited to provider-level audit prioritization based on available billing, utilization, physician, and beneficiary variables; it is not a comprehensive care-pathway auditing or referral-appropriateness assessment system. Future work should incorporate referral and care-coordination data so that audit narratives can consider whether the care trajectory, transfer pattern, and provider-capability context are clinically and operationally plausible.
Fifth, the group level SHAP clusters should be interpreted as exploratory explanation archetypes. Although the revised analysis reports silhouette scores and random seed stability, the clusters were not validated by clinicians, auditors, or compliance experts. The selected solution was chosen for interpretability and stability, not because it was mathematically optimal across all clustering criteria. Future studies should evaluate whether these archetypes correspond to meaningful audit findings or operational categories in real audit workflows.
Sixth, the policy knowledge base used in the RAG module is compact and curated for methodological demonstration. It covers major audit concepts related to reimbursement intensity, claim volume, temporal utilization, coding complexity, case mix, physician structure, and audit governance, but it does not represent a complete legal, regulatory, payer specific, or expert validated policy database. Future work should connect the retrieval module to larger and regularly updated policy sources, including official Medicare manuals, payer rules, local coverage determinations, medical necessity guidance, audit protocols, and organization specific compliance policies.
Seventh, the retrieval evaluation relies on diversity, concentration, feature group alignment, and ablation metrics. These metrics describe retrieval behavior but do not establish expert policy relevance. The ablation analysis shows that part of the hybrid retriever’s improved diversity and alignment is induced by the SHAP group rule boost. Future work should include blinded manual relevance judgments, healthcare auditor evaluation, gold standard policy relevance benchmarks, and comparisons with stronger retrieval methods such as cross encoder reranking.
Eighth, the generated audit reports were evaluated using rule based checks for cautious language, absence of definitive accusations, checklist structure, and audit terminology. These checks assess prompt compliance and report format, not factual correctness, legal correctness, clinical appropriateness, or operational usefulness. Future studies should involve healthcare auditors or compliance professionals to assess whether generated reports improve audit efficiency, reduce review burden, or support better documentation review.
Finally, SHAP explains how the trained model uses input features, but it does not establish causality. Case mix variables, for example, should be interpreted as contextual factors rather than causes of fraudulent behavior. Future work could incorporate causal analysis, counterfactual explanation, peer adjusted benchmarking, prospective validation, and human in the loop audit studies to better distinguish suspicious provider behavior from legitimate variation driven by patient complexity, specialization, or care access constraints.
7. Conclusion
This study proposed an explainable AI engineering workflow for healthcare claim audit prioritization using SHAP guided hybrid retrieval augmented generation. The framework integrates provider level claim aggregation, supervised risk screening, SHAP based explanation, exploratory group level SHAP clustering, policy concept retrieval, and constrained large language model audit narrative generation. The workflow is designed to support human audit prioritization and review, not to make automatic fraud determinations.
The empirical analysis on a public Medicare provider fraud dataset showed that provider level risk scores were strongly influenced by financial intensity, temporal utilization, claim volume and repetition, deductible patterns, and beneficiary case mix. Additional validation analyses showed that XGBoost achieved competitive five fold cross validation performance, with a mean ROC AUC of 0.951, PR AUC of 0.736, and F1 score of 0.655. Threshold and calibration analyses supported the use of the model score as an audit prioritization signal, while also showing that it should not be interpreted as a legally calibrated probability of fraud.
The scale confounding analysis confirmed that provider size and financial exposure are important drivers in this dataset. Scale only features were strongly predictive, but non scale and contextual features retained performance close to the full model. This finding supports the use of explanation and contextual review, while reinforcing the need for peer group adjustment, provider specialty controls, and expert audit validation in future work.
Group level SHAP analysis organized high risk providers into exploratory explanation archetypes, including high cost inpatient intensity, mixed utilization and case mix, financial intensity with complex case mix, and high volume repeated claim patterns. Robustness checks showed that the selected clustering solution had high random seed stability, but the archetypes should be interpreted as descriptive explanation profiles rather than validated fraud categories.
The retrieval experiments showed that SHAP guided hybrid retrieval increased policy concept diversity and reduced retrieval concentration compared with pure embedding retrieval. The retrieval ablation further showed that rule only SHAP group retrieval produced even greater diversity, indicating that part of the hybrid method’s improvement is induced by the rule based feature group boost. Therefore, the hybrid retriever is best understood as an engineering mechanism for balancing semantic similarity and explanation guided retrieval control, not as independent proof of audit relevance.
Overall, the study demonstrates a reproducible pathway for connecting provider level risk screening, explainable machine learning, policy concept retrieval, and cautious audit narrative generation. Its current contribution is a rigorously evaluated engineering prototype for audit prioritization under weak label constraints. Future work should incorporate expert auditor evaluation, larger policy knowledge bases, referral and care coordination data, peer adjusted benchmarking, and prospective deployment studies to assess operational usefulness in real audit settings.
Author Contributions
Author Contributions: Conceptualization, D.H., L.S. and W.C.; methodology, D.H., L.S. and W.C.; software, D.H. and L.S.; validation, Y.C., S.H. and R.W.; formal analysis, D.H., L.S. and Y.C.; investigation, S.H., R.W. and H.S.; resources, H.S. and W.C.; data curation, D.H. and L.S.; writing—original draft preparation, D.H., L.S. and W.C.; writing—review and editing, Y.C., S.H., R.W., H.S. and W.C.; visualization, D.H. and L.S.; supervision, W.C.; project administration, W.C. All authors have read and agreed to the published version of the manuscript.
Funding
This research received no external funding.
Data Availability Statement
The data analyzed in this study are publicly available in the Kaggle dataset “Healthcare Provider Fraud Detection Analysis,” as cited in Reference [17]. The analysis used the provider label, inpatient claims, outpatient claims, and beneficiary data files described in Section 3.2. No new patient-level or proprietary clinical data were collected for this study. The processed provider-level features, analysis code, and additional implementation materials are available from the corresponding author upon reasonable request.
Conflicts of Interest
The authors declare no conflicts of interest.
References
- National Institute of Standards and Technology. Artificial Intelligence Risk Management Framework (AI RMF 1.0); Technical Report NIST AI 100-1; National Institute of Standards and Technology, 2023. [Google Scholar] [CrossRef]
- Rudin, C. Stop explaining black box machine learning models for high stakes decisions and use interpretable models instead. Nat. Mach. Intell. 2019, 1, 206–215. [Google Scholar] [CrossRef] [PubMed]
- Miller, T. Explanation in artificial intelligence: Insights from the social sciences. Artif. Intell. 2019, 267, 1–38. [Google Scholar] [CrossRef]
- Lundberg, S.M.; Lee, S.I. A Unified Approach to Interpreting Model Predictions. In Proceedings of the Advances in Neural Information Processing Systems, 2017; Vol. 30. [Google Scholar]
- Centers for Medicare and Medicaid Services. Medicare Fraud & Abuse: Prevent, Detect, Report. ICN MLN4649244; Medicare Learning Network Booklet. 2021. Updated March 2021. [Google Scholar]
- U.S. Department of Health and Human Services, Office of Inspector General. A Roadmap for New Physicians: Fraud and Abuse Laws. Physician Education Training Materials, 2020. Section on physician relationships with payers and upcoding.
- Bauder, R.A.; Khoshgoftaar, T.M.; Seliya, N. A Survey on the State of Healthcare Upcoding Fraud Analysis and Detection. In Proceedings of the Proceedings of the Thirty-First International Florida Artificial Intelligence Research Society Conference, 2018. [Google Scholar]
- du Preez, A.; et al. Fraud detection in healthcare claims using machine learning. Artif. Intell. Med. Systematic literature review. 2025. [Google Scholar] [CrossRef] [PubMed]
- Chen, T.; Guestrin, C. XGBoost: A Scalable Tree Boosting System. In Proceedings of the Proceedings of the 22nd ACM SIGKDD International Conference on Knowledge Discovery and Data Mining, 2016; pp. 785–794. [Google Scholar] [CrossRef]
- Lewis, P.; Perez, E.; Piktus, A.; Petroni, F.; Karpukhin, V.; Goyal, N.; K"uttler, H.; Lewis, M.; Yih, W.t.; Rockt"aschel, T.; et al. Retrieval-Augmented Generation for Knowledge-Intensive NLP Tasks. Proc. Adv. Neural Inf. Process. Syst. 2020, Vol. 33, 9459–9474. [Google Scholar]
- Li, J.; Huang, K.Y.; Jin, J.; Shi, J. A survey on statistical methods for health care fraud detection. Health Care Manag. Sci. 2008, 11, 275–287. [Google Scholar] [CrossRef] [PubMed]
- Bauder, R.A.; Khoshgoftaar, T.M. The Detection of Medicare Fraud Using Machine Learning Methods with Excluded Provider Labels. In Proceedings of the Proceedings of the Thirty-First International Florida Artificial Intelligence Research Society Conference, 2018; pp. 404–409. [Google Scholar]
- Bauder, R.A.; Khoshgoftaar, T.M.; Seliya, N. A survey on the state of healthcare upcoding fraud analysis and detection. Health Serv. Outcomes Res. Methodol. 2017, 17, 31–55. [Google Scholar] [CrossRef]
- Sun, F.; He, S.; Wang, R.; Ke, L.; Shen, H.; Liao, Q. Modeling Structural Deviation in 10-K Risk Factors: A Semantic Anomaly Detection and Explainable AI Approach. Risks 2026, 14, 87. [Google Scholar] [CrossRef]
- Huang, X.; Lin, Z.; Sun, F.; Zhang, W.; Tong, K.; Liu, Y. Enhancing Document-Level Question Answering via Multi-Hop Retrieval-Augmented Generation with LLaMA 3. In Proceedings of the Proceedings of the 2025 5th International Symposium on Computer Technology and Information Science; IEEE, 2025; pp. 1339–1343. [Google Scholar]
- Shinde, T.; Menon, S.; Chivukula, S.; Samavedi, S.; Rajappa, S.; Liu, G.; Melton, H.; Oguejiofor, O.; Srinivasan, V.; Chitturu, Y.; et al. Building a Secure Graph-RAG Framework for Financial Compliance Question Answering with Redaction and Access Control. In Proceedings of the 2025 IEEE International Symposium on Technology and Society (ISTAS), 2025; pp. 1–10. [Google Scholar] [CrossRef]
- Kaggle. Healthcare Provider Fraud Detection Analysis. Kaggle dataset. 2026. (accessed on 21 June 2026).
Figure 1.
Overview of the proposed framework. Inpatient claims, outpatient claims, and beneficiary data are aggregated into an integrated provider level dataset for audit prioritization. A tree based risk model provides provider level risk scores, while SHAP provides global explanation, local explanation, and exploratory group level risk archetypes. The policy grounding layer combines a policy knowledge base with SHAP guided hybrid retrieval to obtain audit relevant policy concepts. A constrained language model then generates provider specific audit narratives and checklist style review suggestions.
Figure 1.
Overview of the proposed framework. Inpatient claims, outpatient claims, and beneficiary data are aggregated into an integrated provider level dataset for audit prioritization. A tree based risk model provides provider level risk scores, while SHAP provides global explanation, local explanation, and exploratory group level risk archetypes. The policy grounding layer combines a policy knowledge base with SHAP guided hybrid retrieval to obtain audit relevant policy concepts. A constrained language model then generates provider specific audit narratives and checklist style review suggestions.
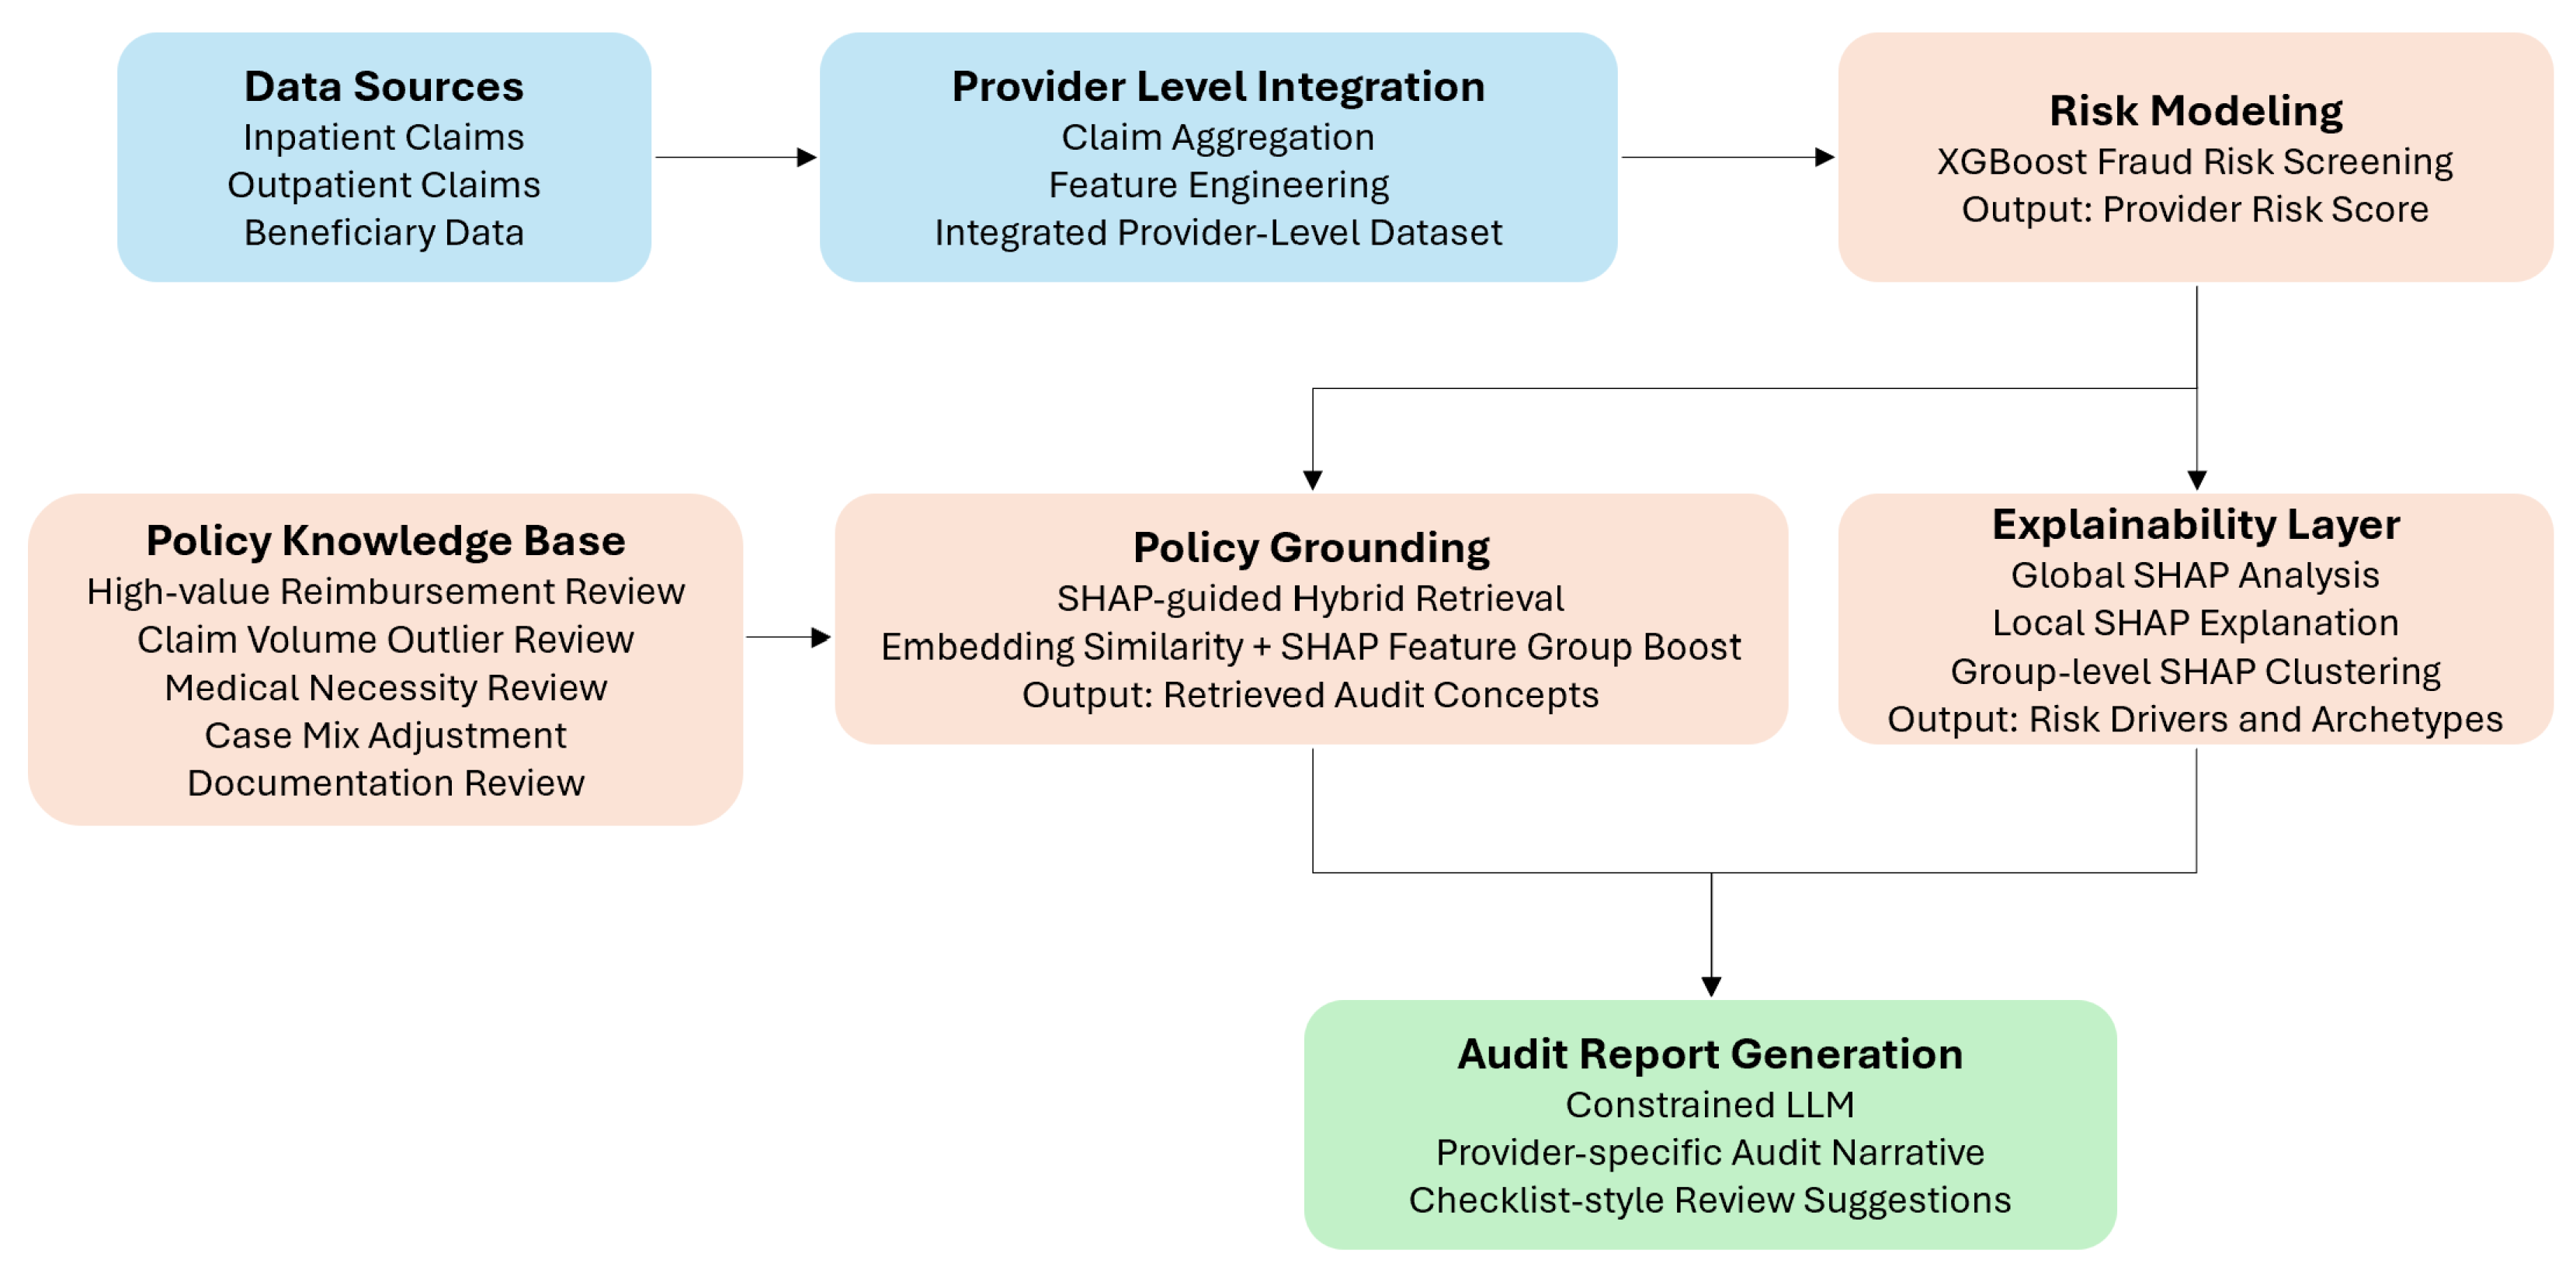
Figure 2.
Top 20 provider level features ranked by mean absolute SHAP value. Total insurance claim reimbursement was the strongest global driver, while admission duration, claims per beneficiary, deductible amount, total claim count, and reimbursement per beneficiary also contributed substantially to the XGBoost audit prioritization score. These variables should be interpreted as model drivers for review prioritization rather than as standalone evidence of fraud.
Figure 2.
Top 20 provider level features ranked by mean absolute SHAP value. Total insurance claim reimbursement was the strongest global driver, while admission duration, claims per beneficiary, deductible amount, total claim count, and reimbursement per beneficiary also contributed substantially to the XGBoost audit prioritization score. These variables should be interpreted as model drivers for review prioritization rather than as standalone evidence of fraud.
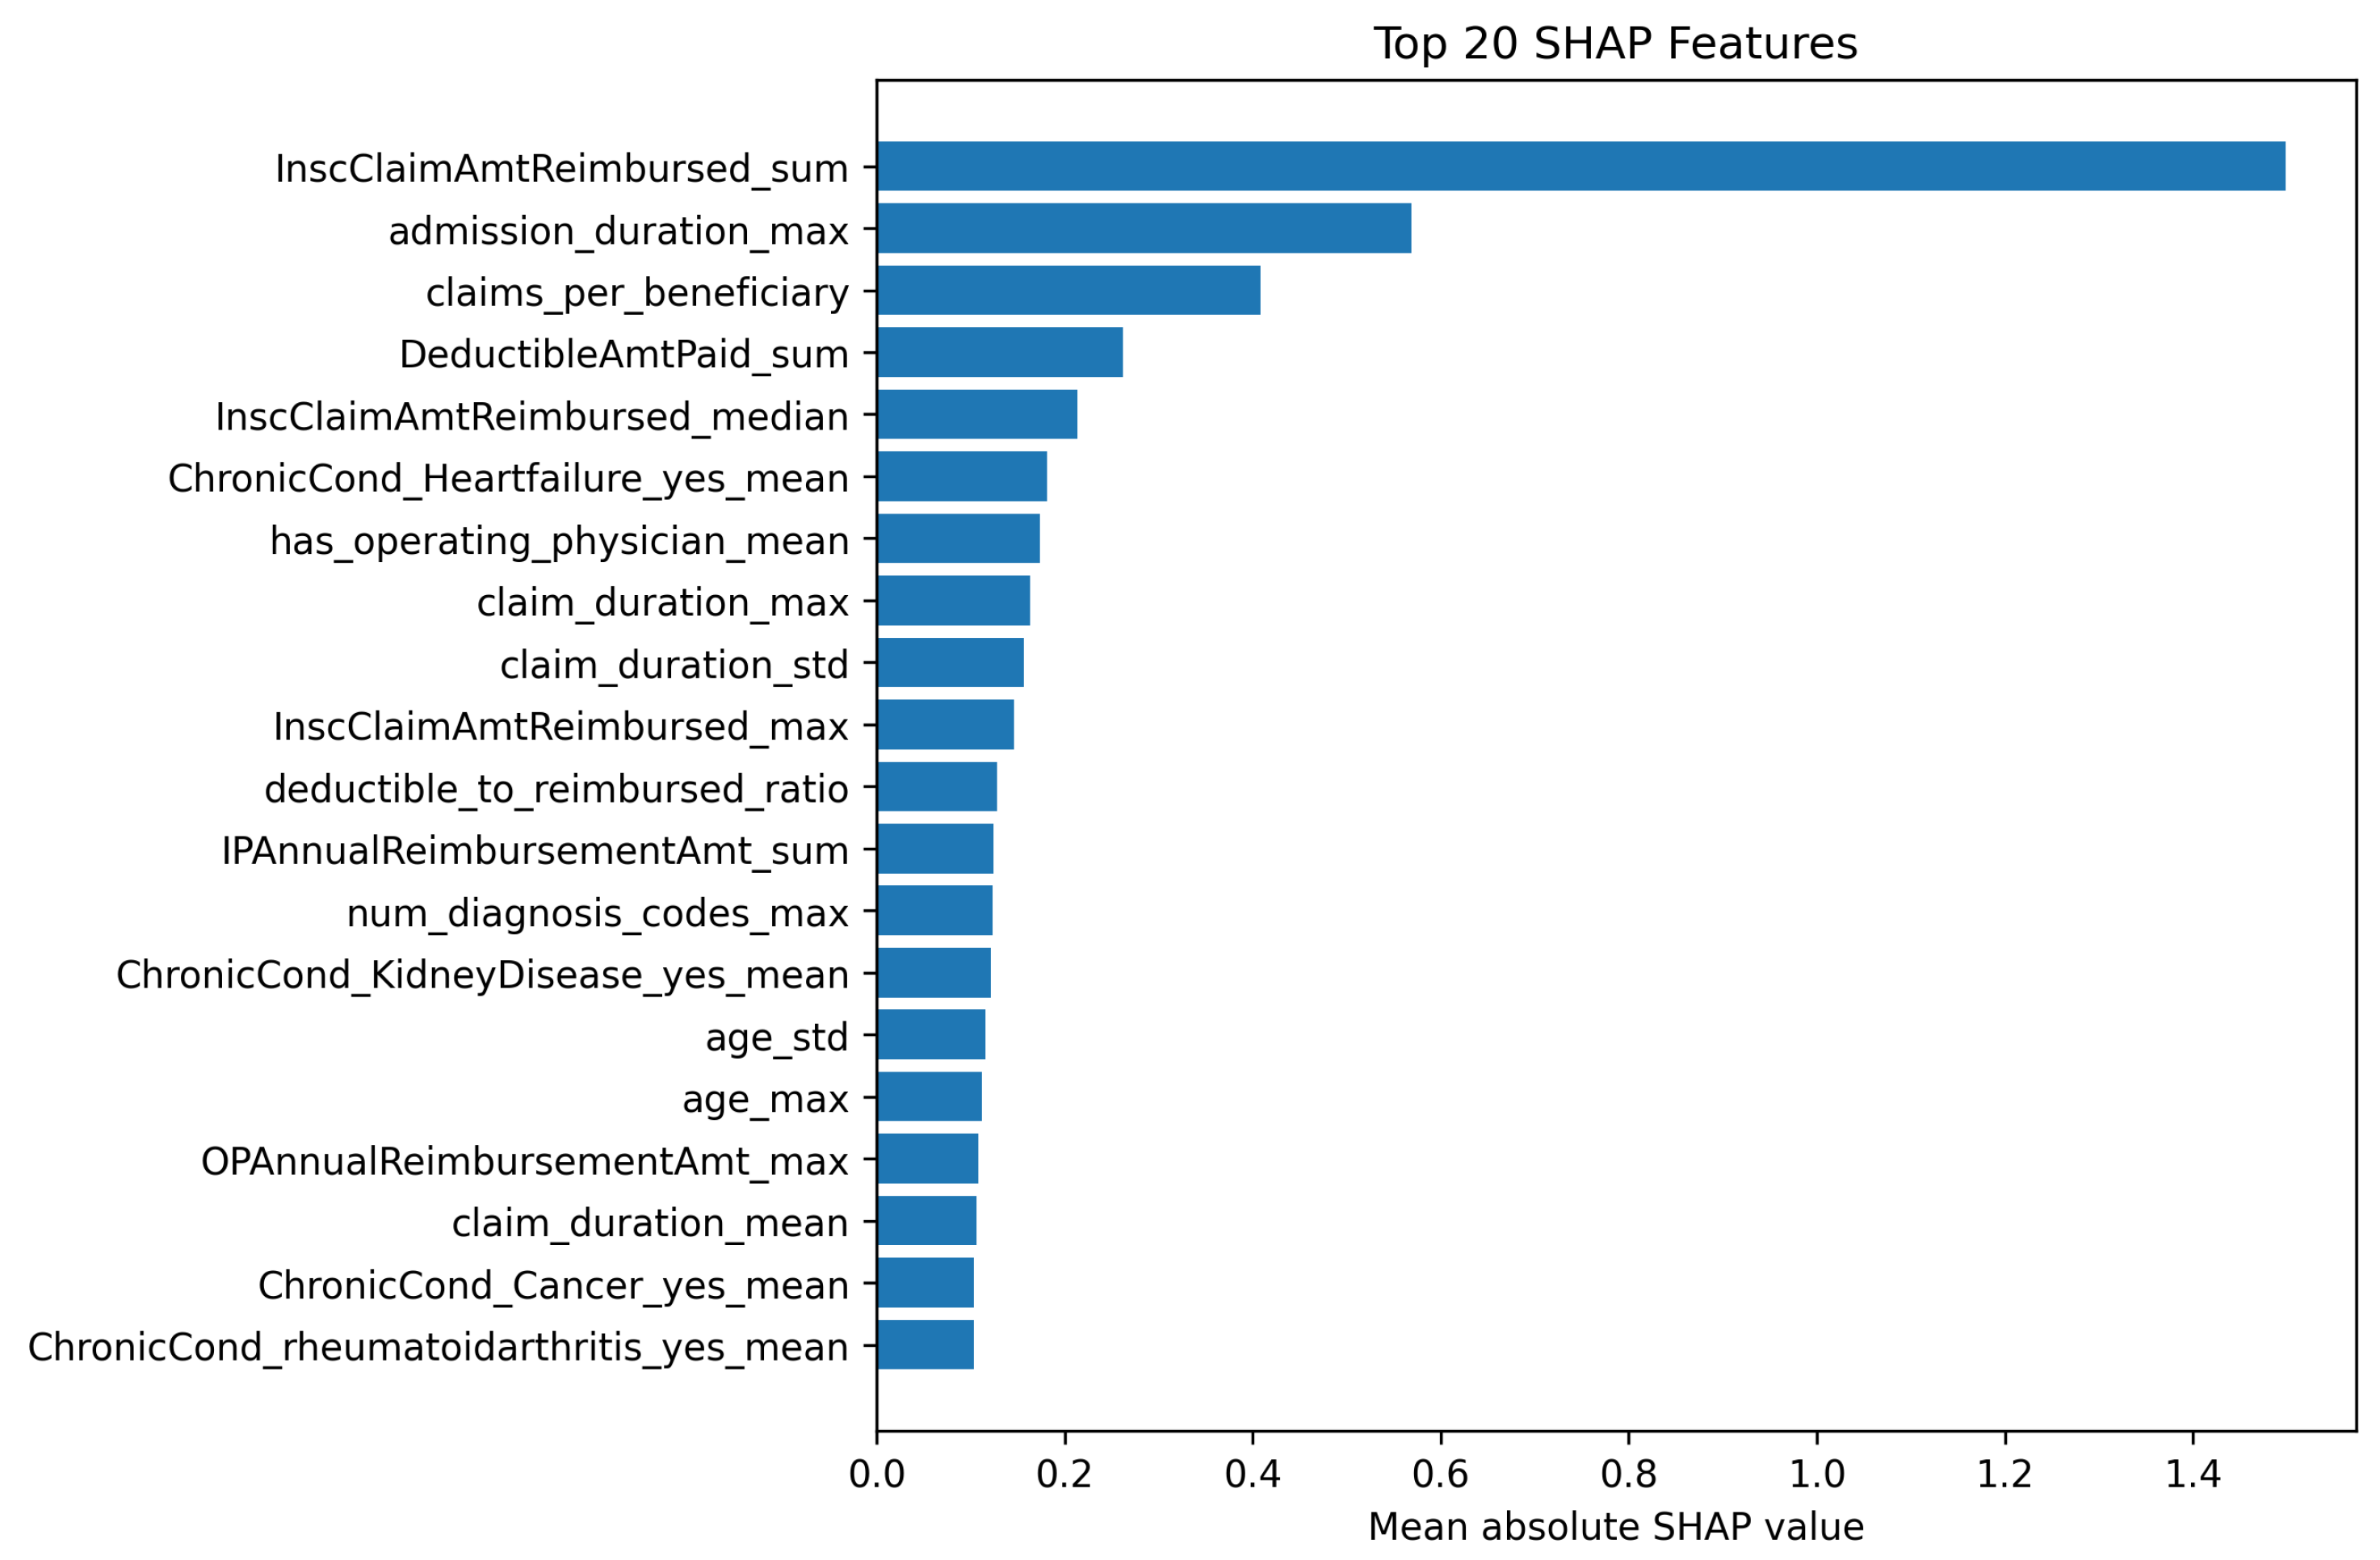
Figure 3.
Cumulative SHAP importance curve based on mean absolute SHAP values. The top 10 features explained approximately 49.3% of the total importance, while 36 and 49 features were required to explain approximately 80% and 90%, respectively.
Figure 3.
Cumulative SHAP importance curve based on mean absolute SHAP values. The top 10 features explained approximately 49.3% of the total importance, while 36 and 49 features were required to explain approximately 80% and 90%, respectively.
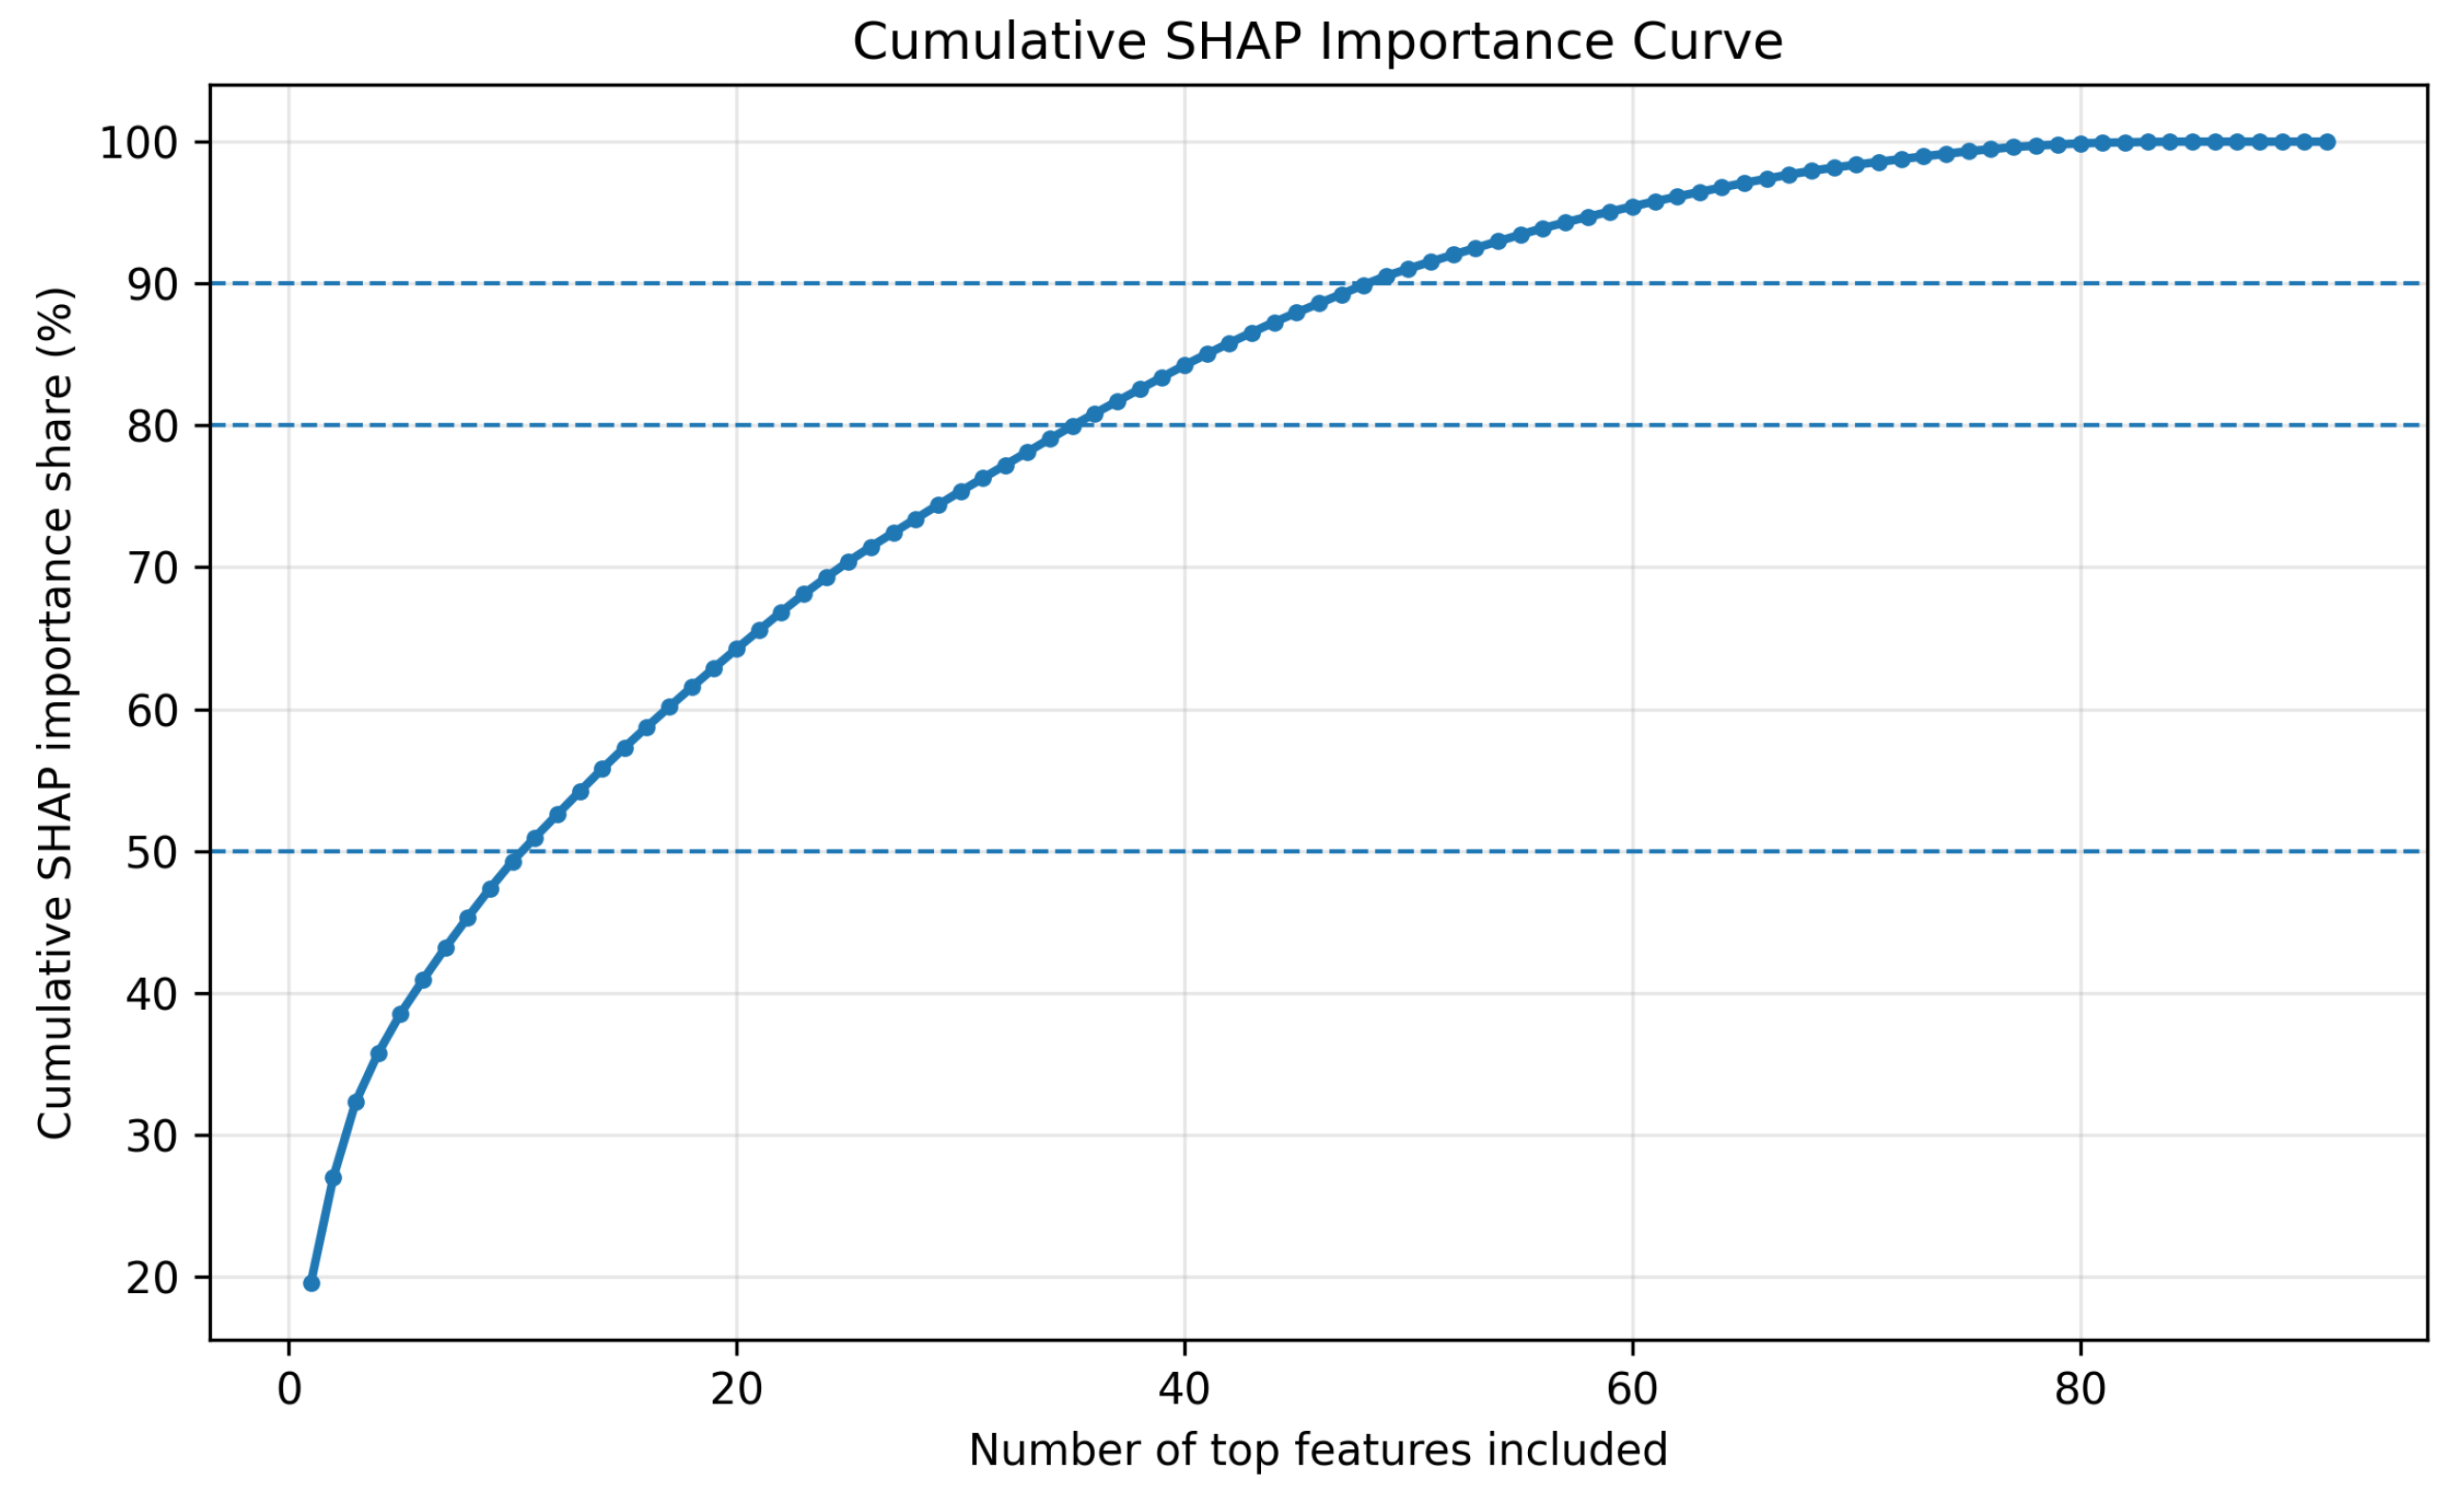
Figure 4.
Feature group contribution based on mean absolute SHAP values. Financial intensity was the dominant feature group, while beneficiary case mix, temporal utilization, and claim volume and repetition also contributed to the model explanation. The dominance of financial intensity reinforces the need to interpret model output as audit prioritization evidence rather than as direct fraud evidence.
Figure 4.
Feature group contribution based on mean absolute SHAP values. Financial intensity was the dominant feature group, while beneficiary case mix, temporal utilization, and claim volume and repetition also contributed to the model explanation. The dominance of financial intensity reinforces the need to interpret model output as audit prioritization evidence rather than as direct fraud evidence.
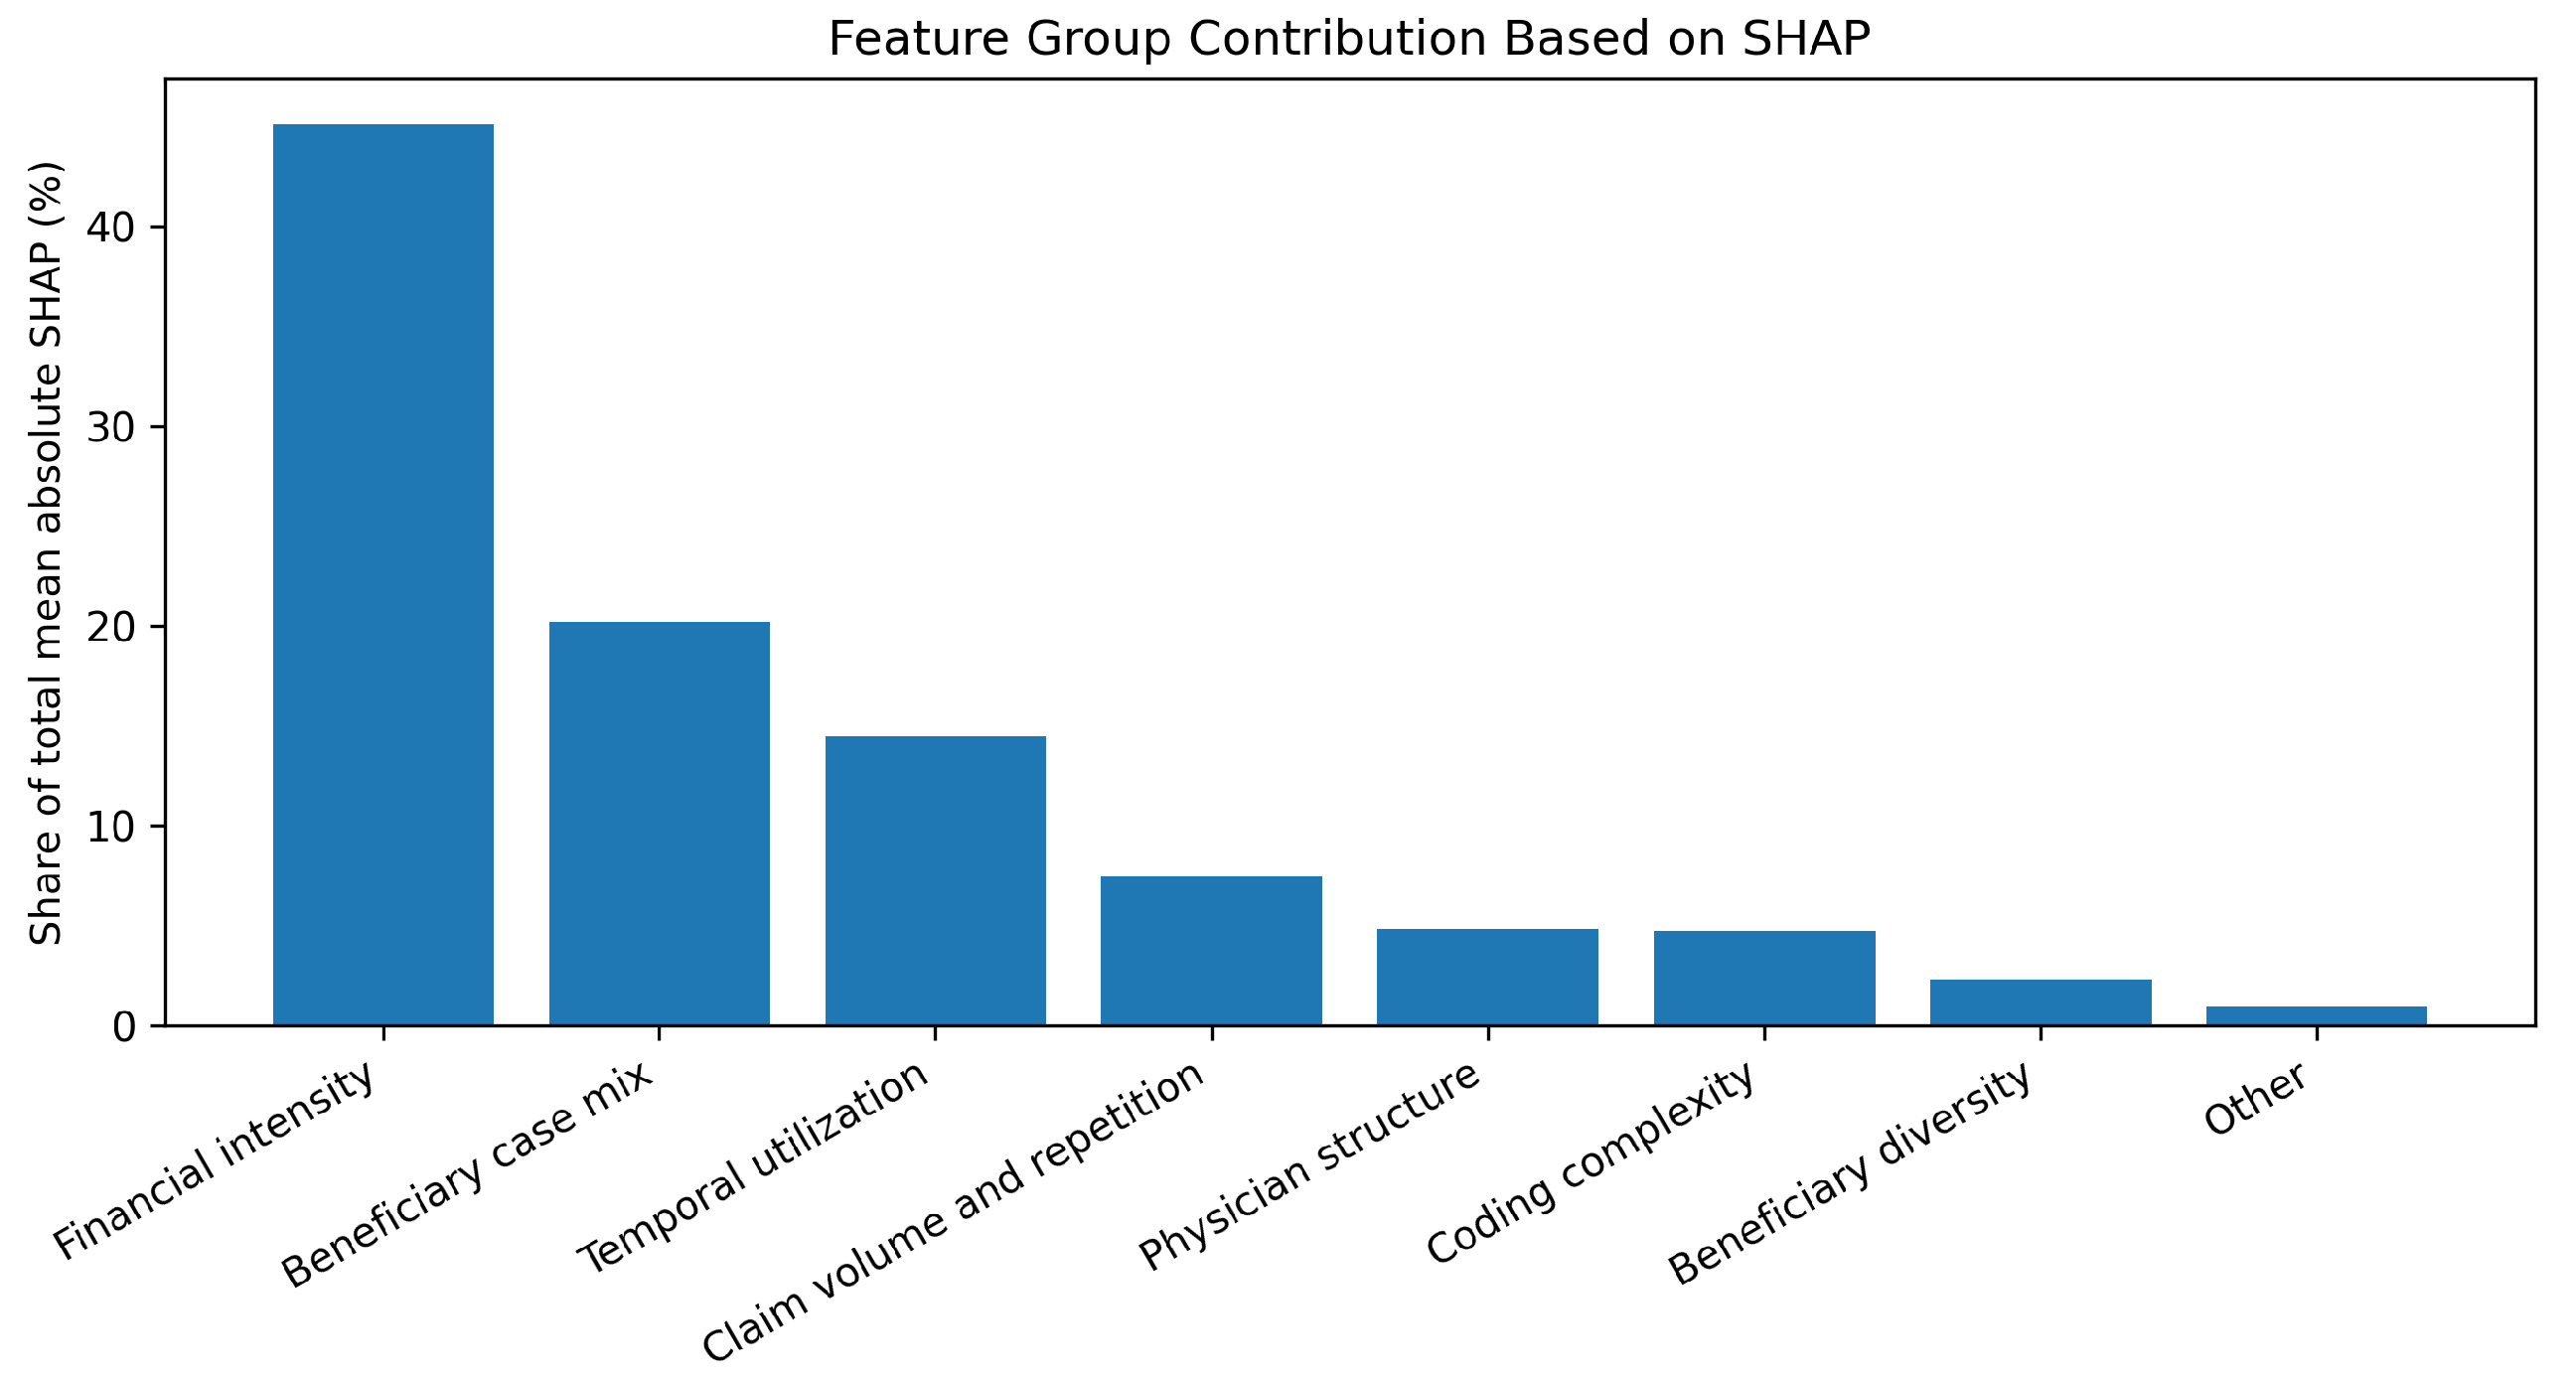
Figure 5.
Cluster by feature group SHAP share heatmap for high risk providers. Each value represents the average percentage share of absolute SHAP contribution assigned to a feature group within a cluster. The heatmap describes exploratory explanation profiles and should not be interpreted as validating distinct fraud types.
Figure 5.
Cluster by feature group SHAP share heatmap for high risk providers. Each value represents the average percentage share of absolute SHAP contribution assigned to a feature group within a cluster. The heatmap describes exploratory explanation profiles and should not be interpreted as validating distinct fraud types.
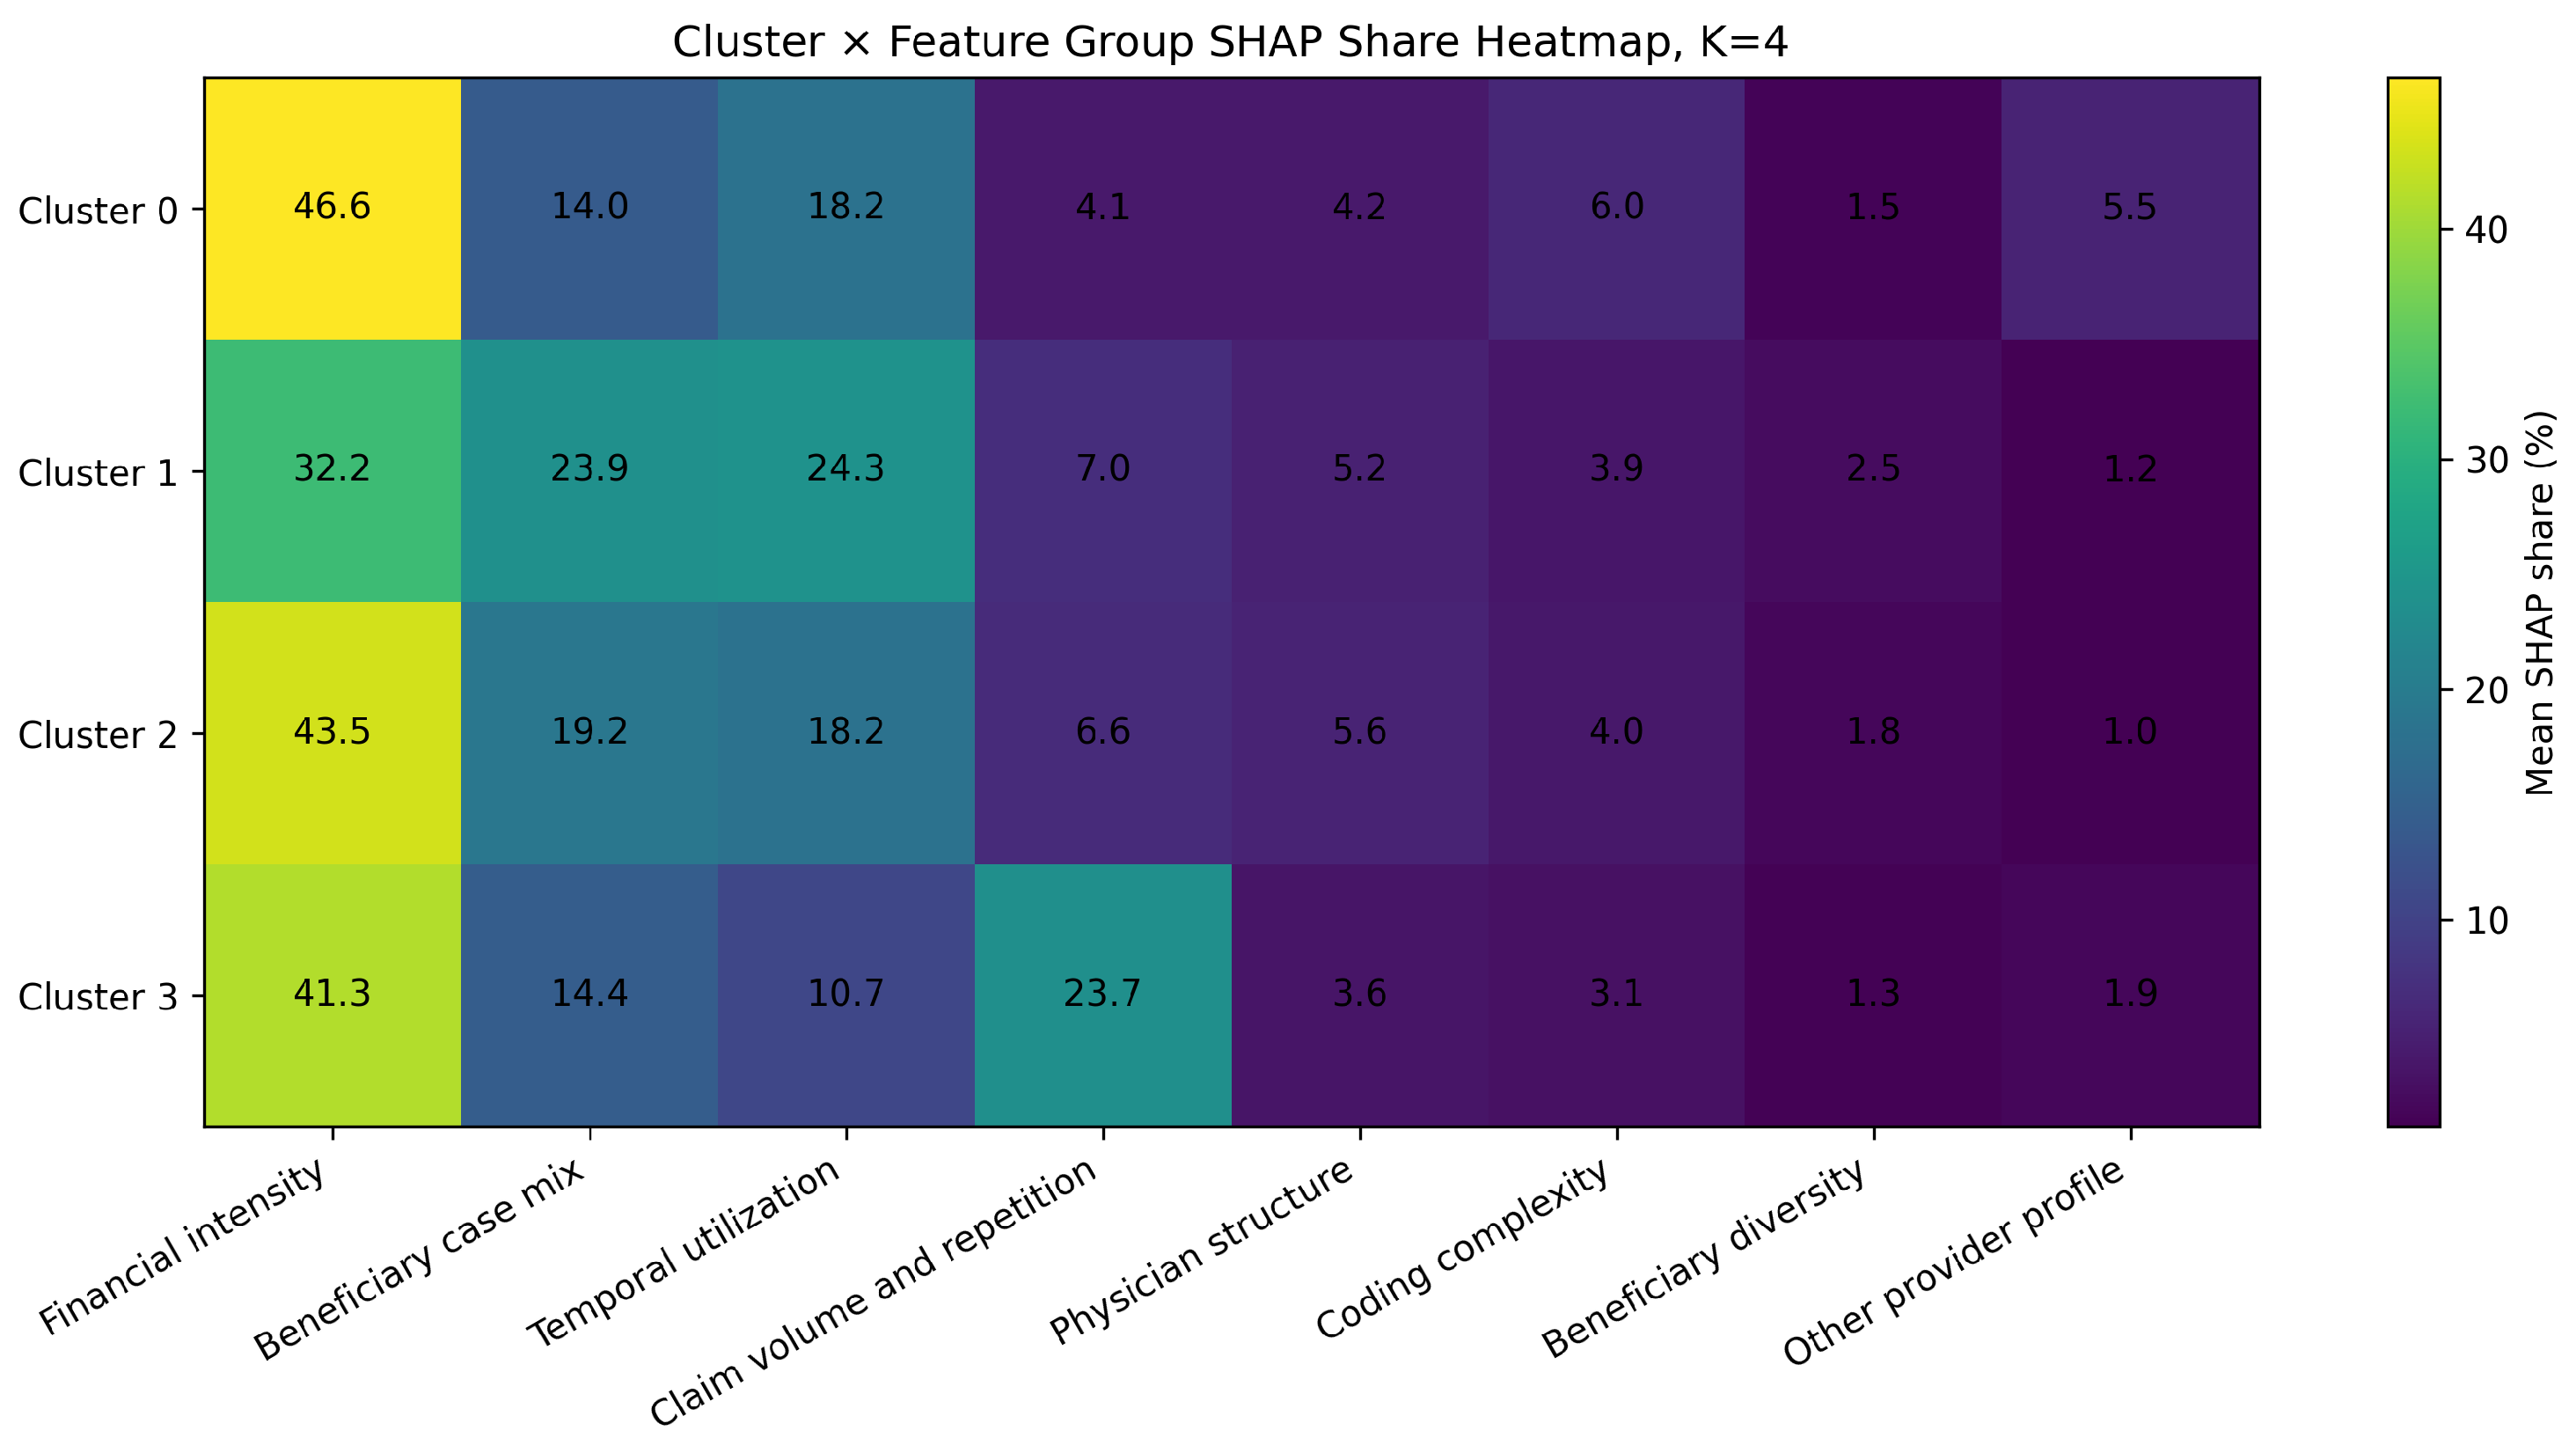
Figure 6.
Dataset positive label rate and mean predicted risk score across group level SHAP clusters. Positive label rate refers to PotentialFraud in the benchmark dataset and should not be interpreted as a legal fraud rate.
Figure 6.
Dataset positive label rate and mean predicted risk score across group level SHAP clusters. Positive label rate refers to PotentialFraud in the benchmark dataset and should not be interpreted as a legal fraud rate.
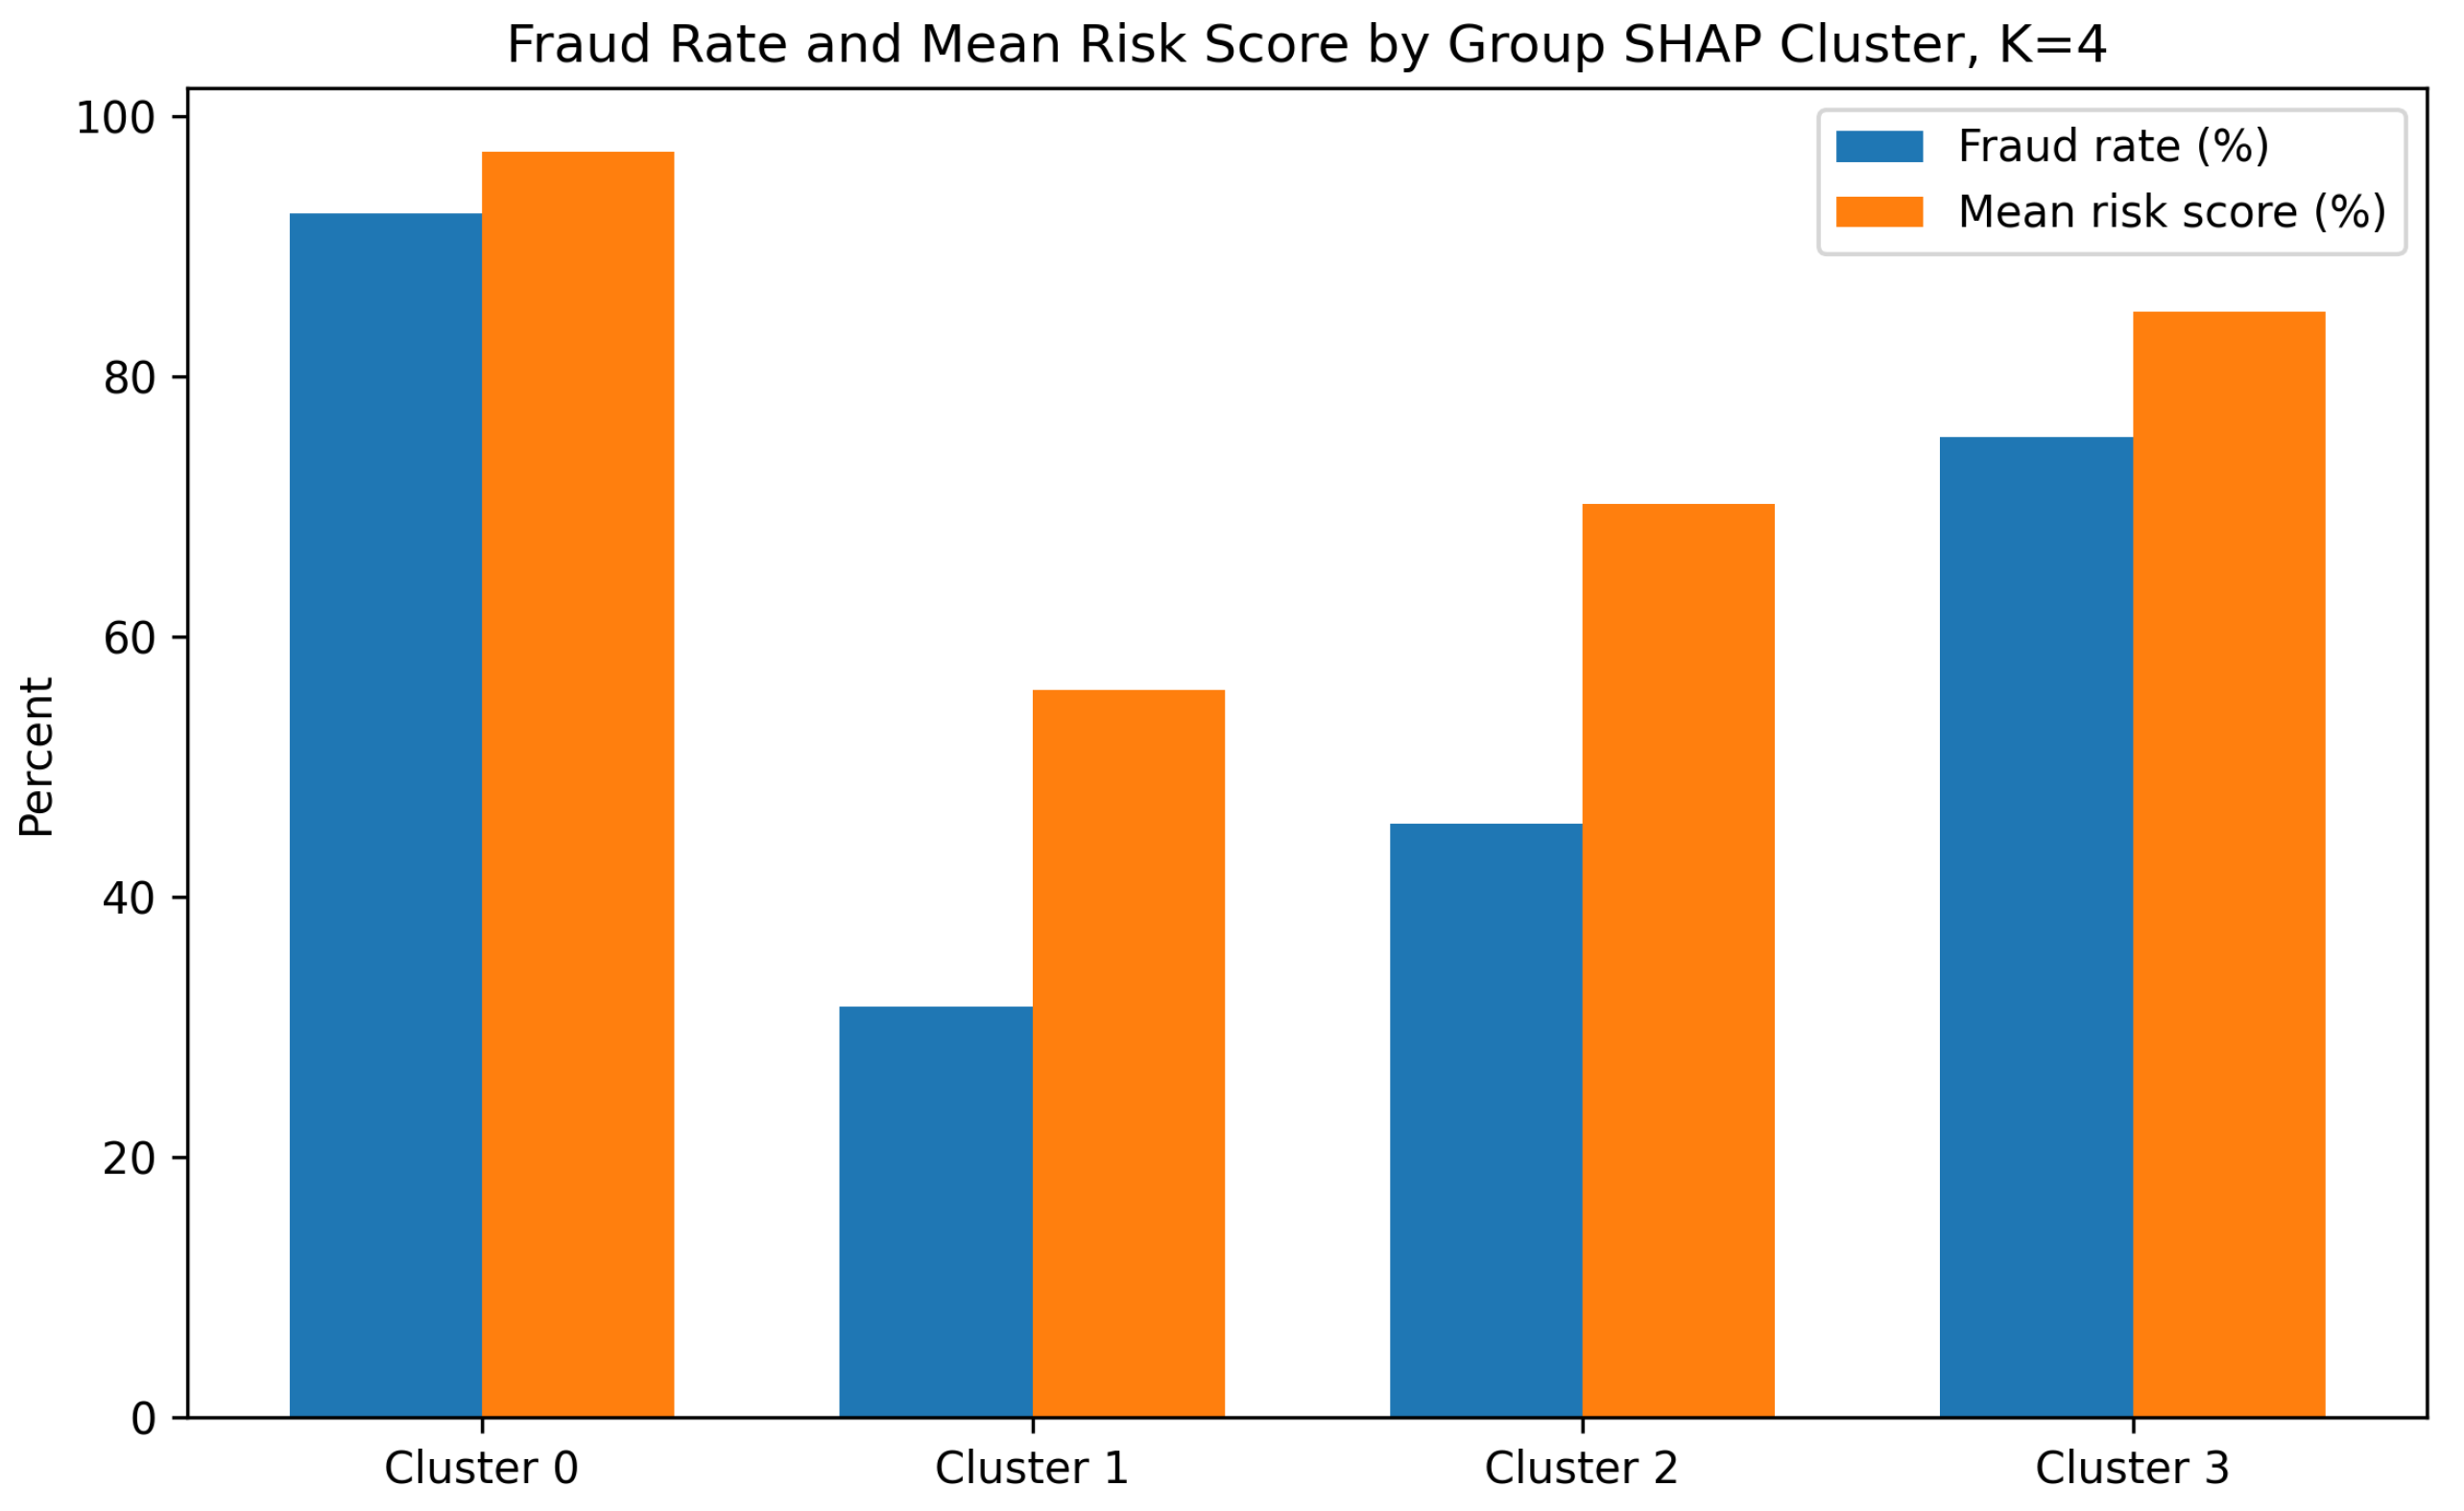
Figure 7.
Cluster by policy concept heatmap for the RAG assisted explanation layer. Rows represent exploratory SHAP based provider archetypes, and columns represent retrieved audit concepts. The heatmap describes how retrieved concepts vary across explanation profiles; it does not establish expert validated policy relevance.
Figure 7.
Cluster by policy concept heatmap for the RAG assisted explanation layer. Rows represent exploratory SHAP based provider archetypes, and columns represent retrieved audit concepts. The heatmap describes how retrieved concepts vary across explanation profiles; it does not establish expert validated policy relevance.
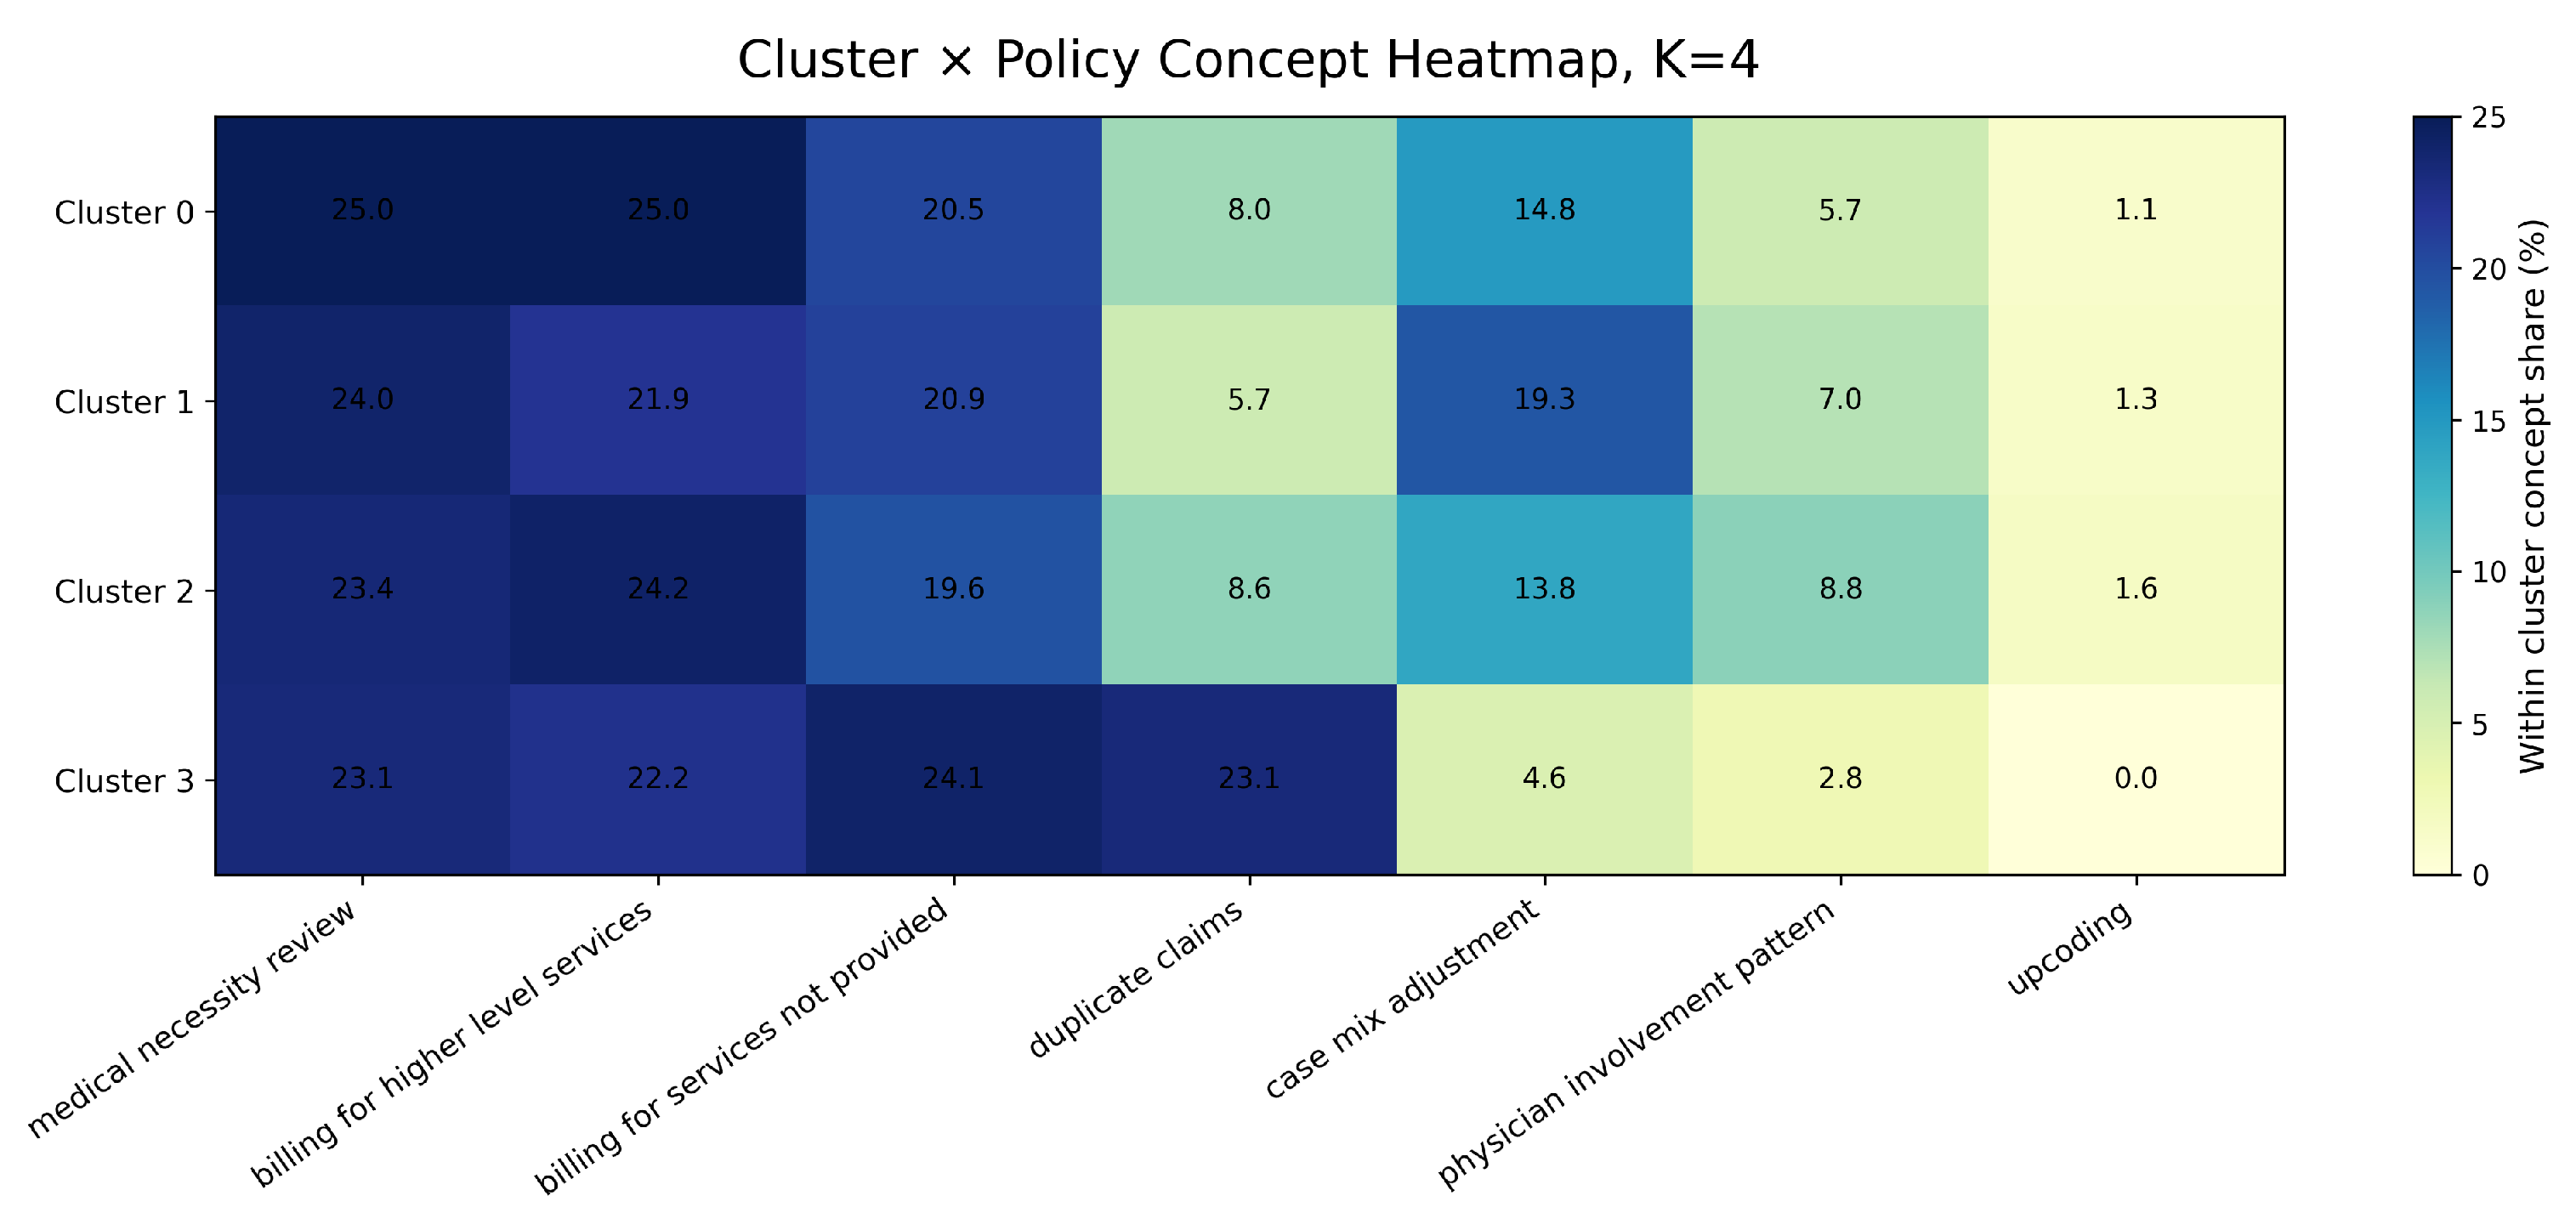
Figure 8.
Cluster by policy concept lift heatmap. Lift values compare the within cluster retrieval frequency of each policy concept with its global retrieval frequency. Values above 1 indicate overrepresentation within a cluster. The lift analysis is used as a descriptive retrieval diagnostic rather than as expert validation of audit relevance.
Figure 8.
Cluster by policy concept lift heatmap. Lift values compare the within cluster retrieval frequency of each policy concept with its global retrieval frequency. Values above 1 indicate overrepresentation within a cluster. The lift analysis is used as a descriptive retrieval diagnostic rather than as expert validation of audit relevance.
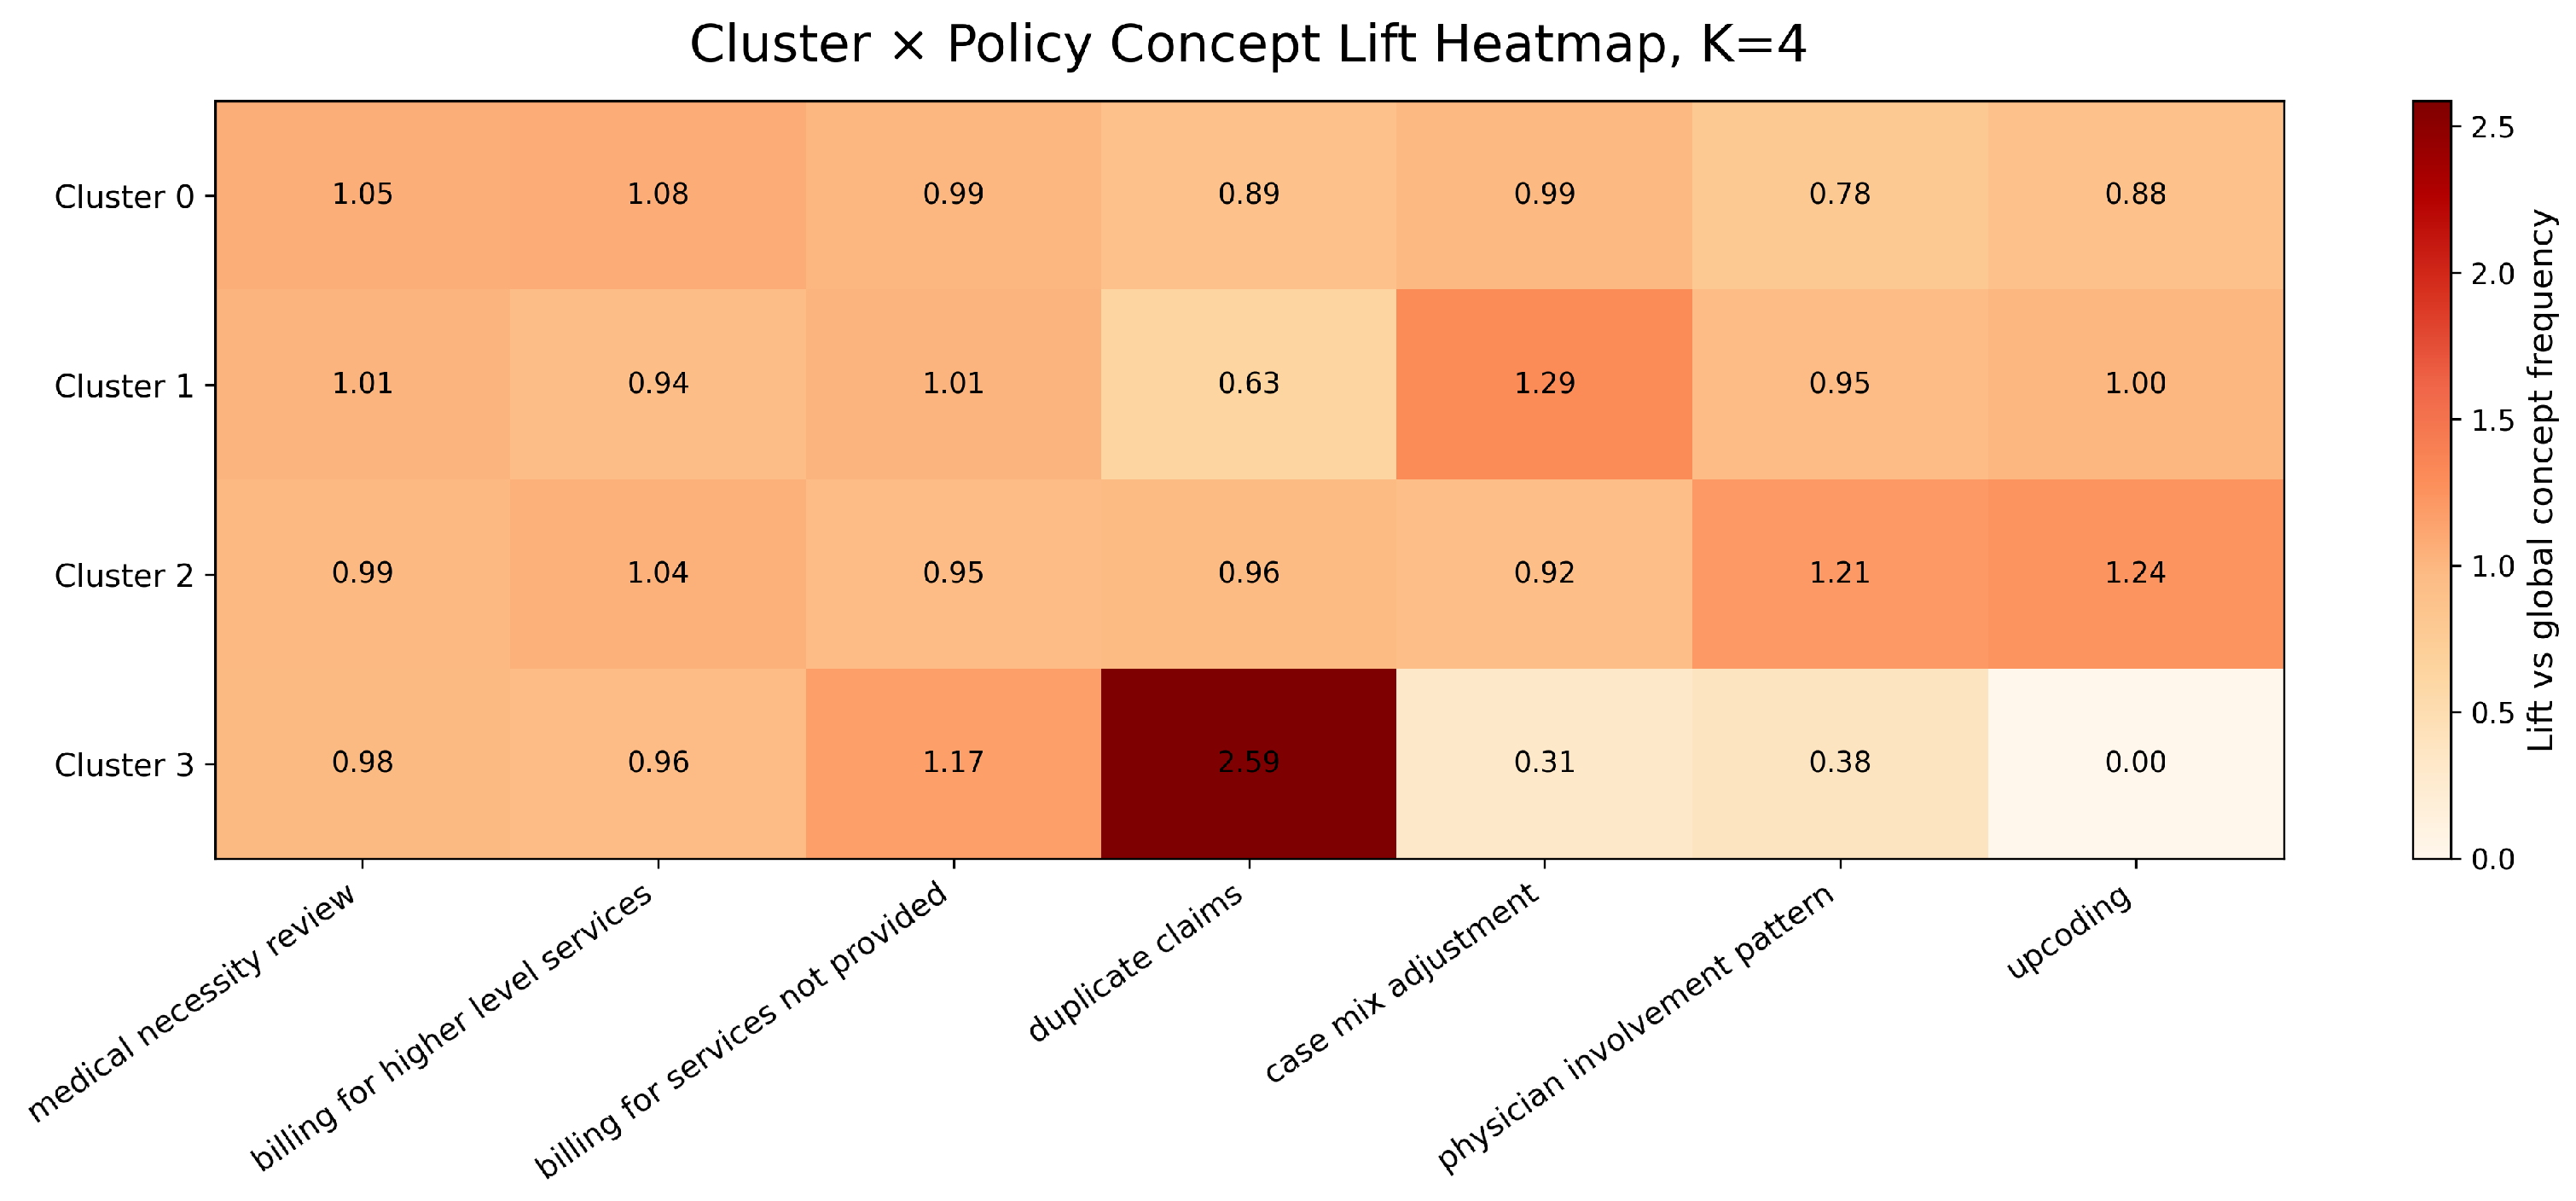
Figure 9.
Top retrieved audit concepts by retrieval method. Pure embedding retrieval concentrated on broadly similar concepts, while SHAP guided hybrid retrieval retrieved a wider range of audit concepts, including claim volume, temporal utilization, and additional case mix related concepts. The comparison describes retrieval behavior and does not replace expert relevance evaluation.
Figure 9.
Top retrieved audit concepts by retrieval method. Pure embedding retrieval concentrated on broadly similar concepts, while SHAP guided hybrid retrieval retrieved a wider range of audit concepts, including claim volume, temporal utilization, and additional case mix related concepts. The comparison describes retrieval behavior and does not replace expert relevance evaluation.
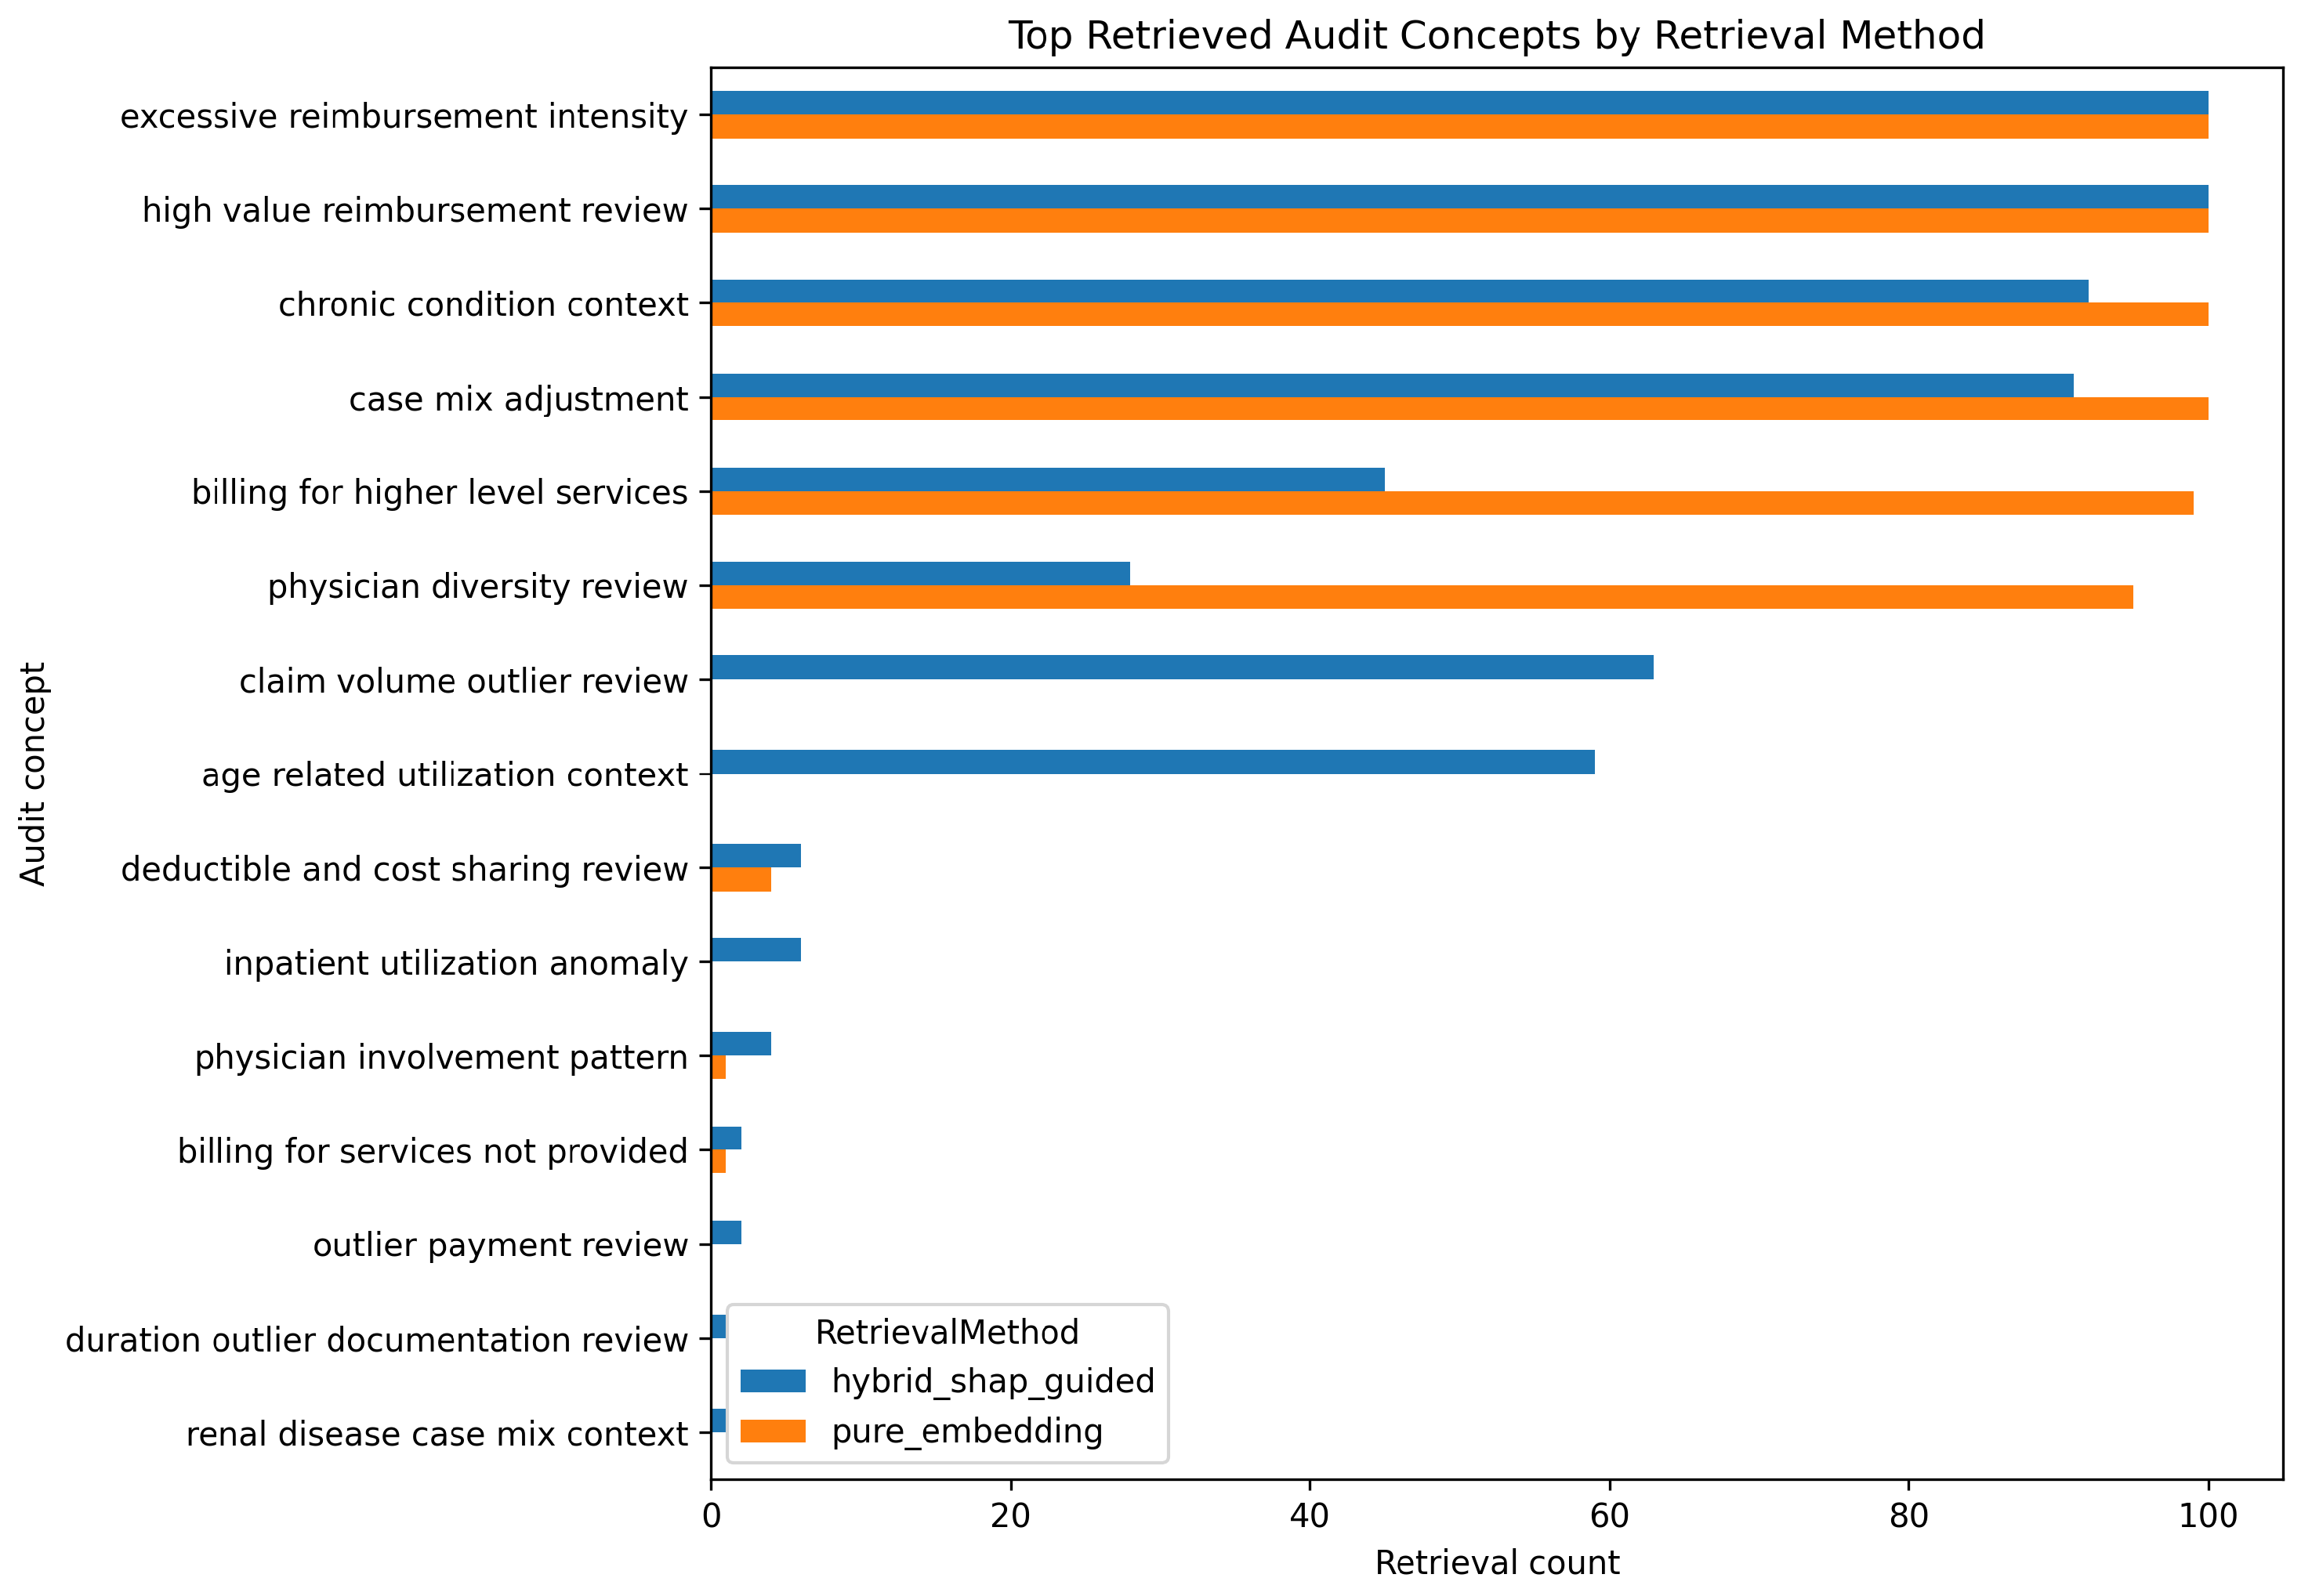
Figure 10.
Retrieved risk indicator distribution by retrieval method. Compared with pure embedding retrieval, SHAP guided hybrid retrieval increased retrievals associated with claim volume and repetition and introduced temporal utilization concepts. This pattern reflects the effect of explanation guided retrieval control and should not be interpreted as independent validation of audit usefulness.
Figure 10.
Retrieved risk indicator distribution by retrieval method. Compared with pure embedding retrieval, SHAP guided hybrid retrieval increased retrievals associated with claim volume and repetition and introduced temporal utilization concepts. This pattern reflects the effect of explanation guided retrieval control and should not be interpreted as independent validation of audit usefulness.
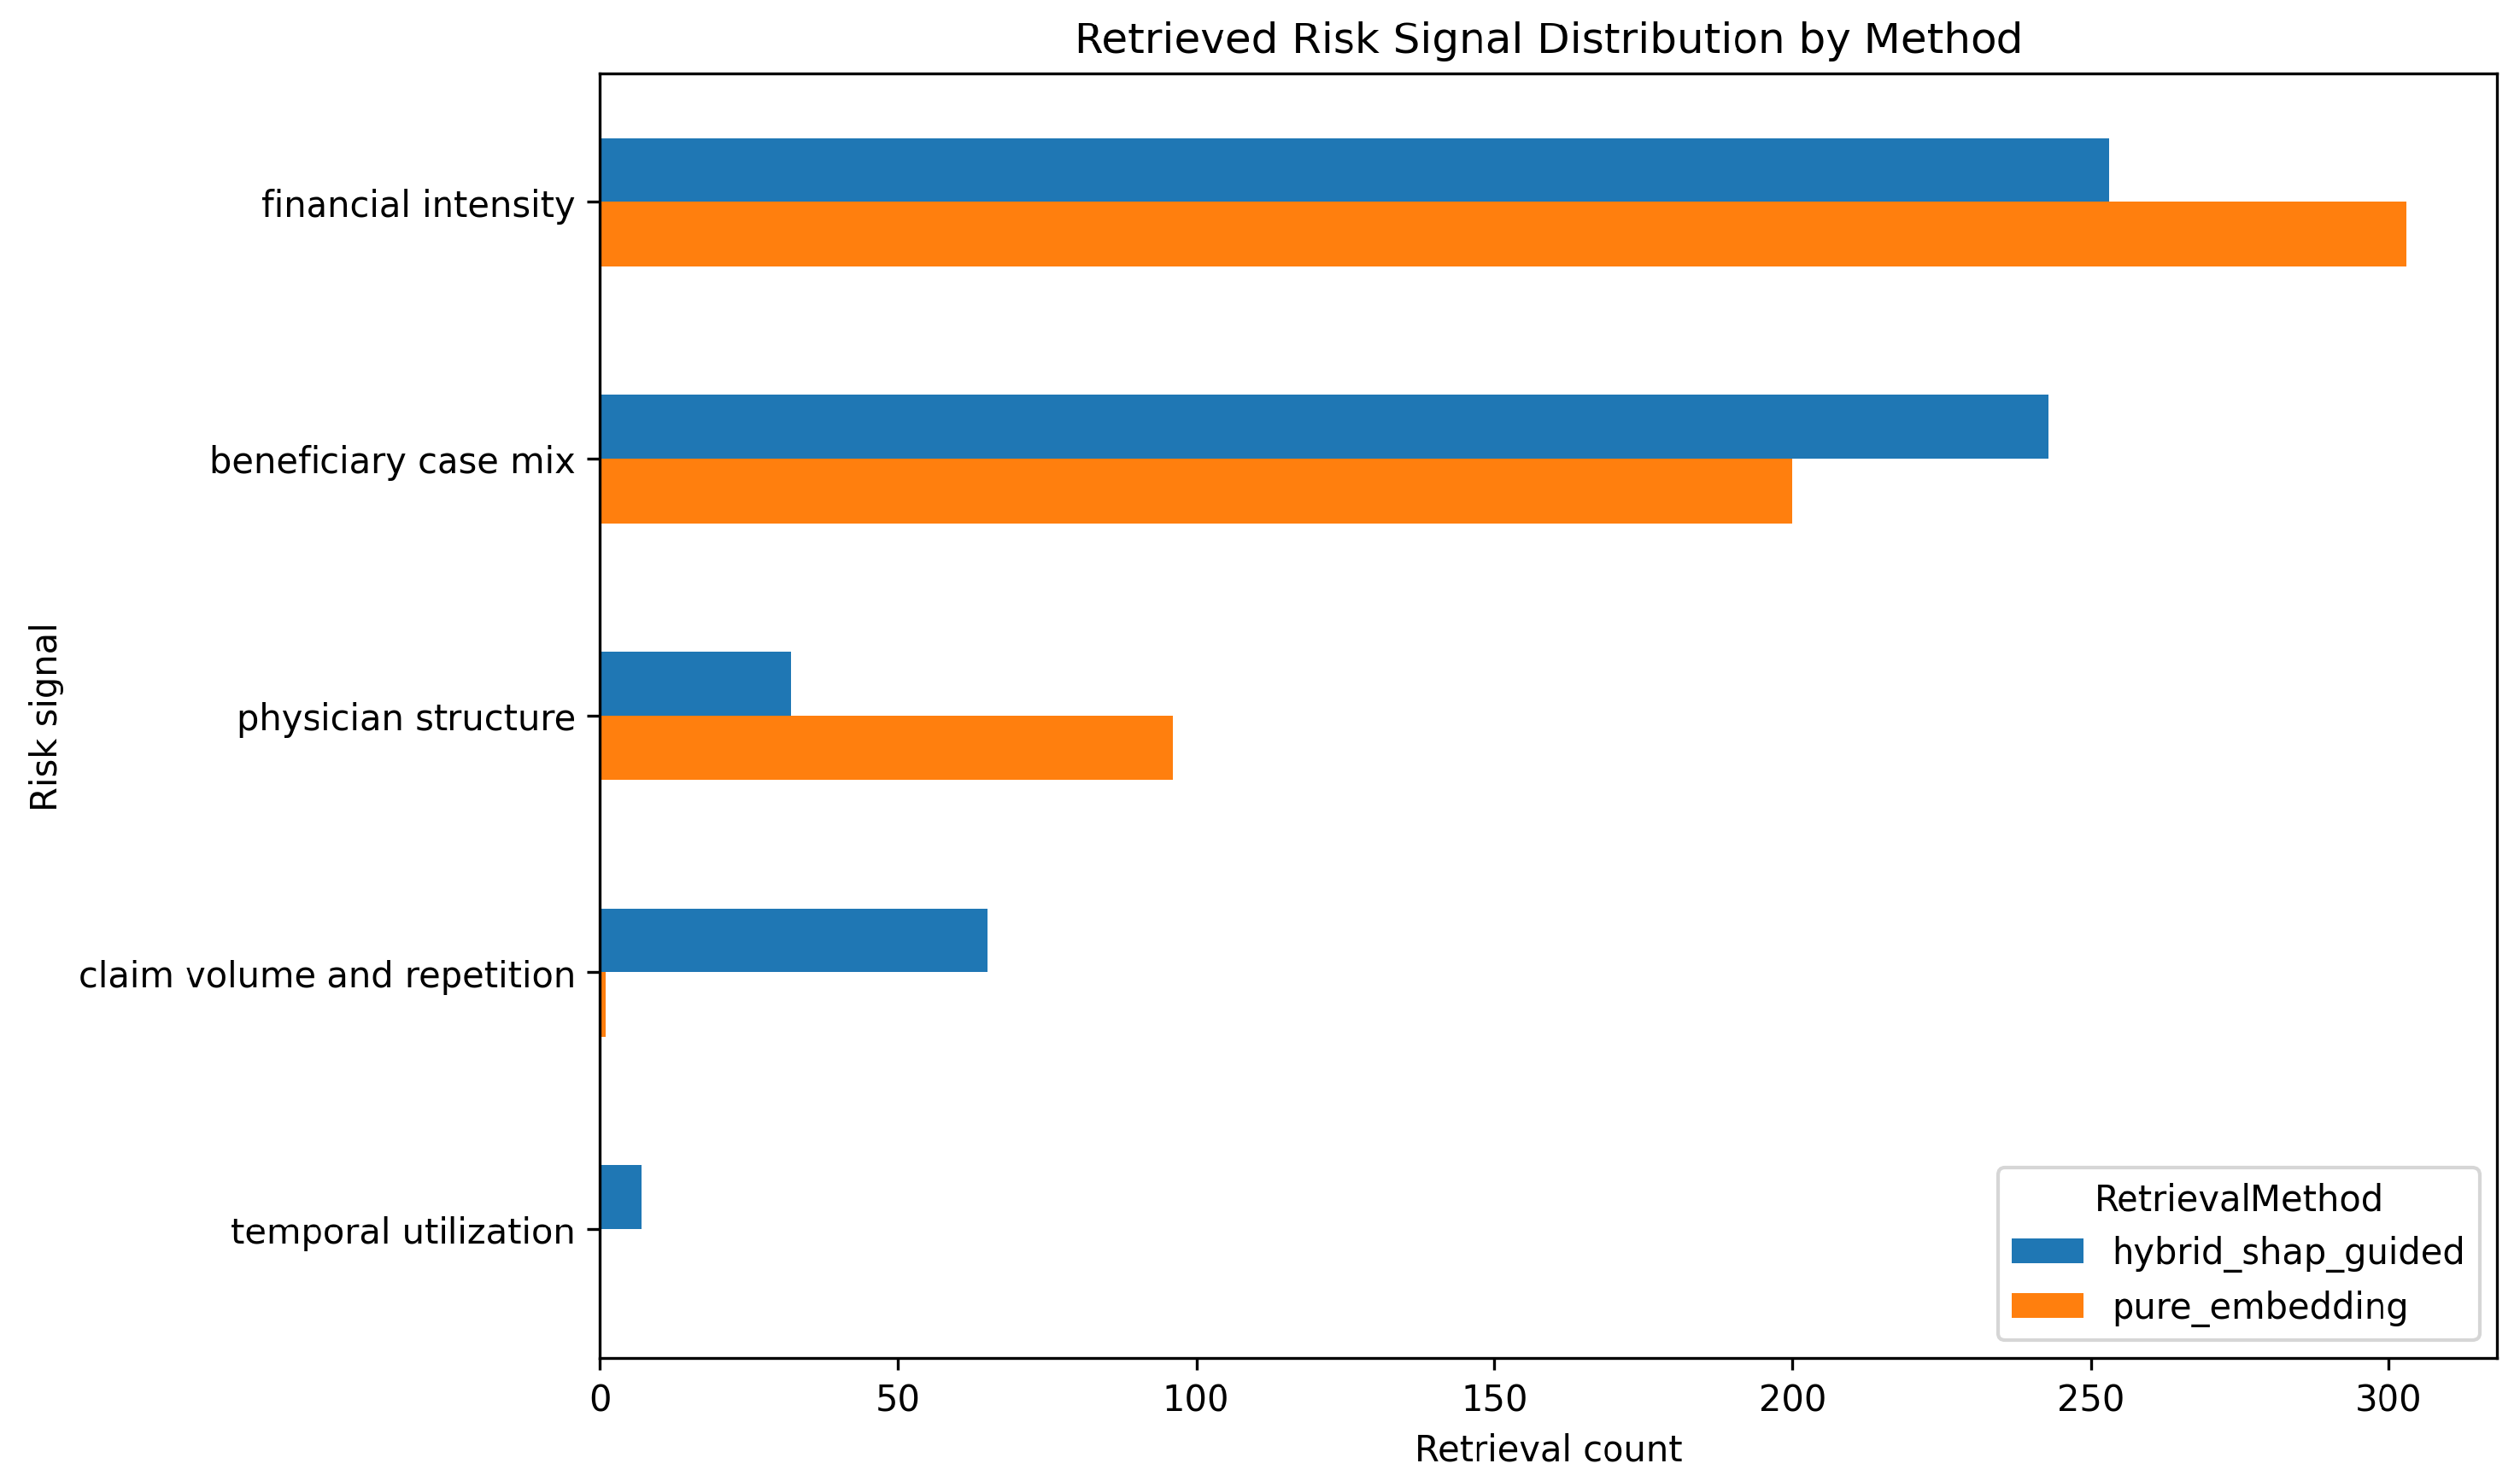
Table 5.
Five fold cross validation performance using the full feature set. Values are mean ± standard deviation.
Table 5.
Five fold cross validation performance using the full feature set. Values are mean ± standard deviation.
| Model | ROC AUC | PR AUC | F1 | Brier score |
|---|---|---|---|---|
| Logistic regression | ||||
| Decision tree | ||||
| Random forest | ||||
| XGBoost |
Table 6.
XGBoost threshold sensitivity on the held out test set.
| Threshold | Precision | Recall | F1 |
|---|---|---|---|
| 0.30 | 0.476 | 0.850 | 0.610 |
| 0.40 | 0.507 | 0.819 | 0.627 |
| 0.50 | 0.553 | 0.819 | 0.660 |
| 0.60 | 0.605 | 0.772 | 0.678 |
| 0.70 | 0.652 | 0.724 | 0.687 |
Disclaimer/Publisher’s Note: The statements, opinions and data contained in all publications are solely those of the individual author(s) and contributor(s) and not of MDPI and/or the editor(s). MDPI and/or the editor(s) disclaim responsibility for any injury to people or property resulting from any ideas, methods, instructions or products referred to in the content. |
© 2026 by the authors. Licensee MDPI, Basel, Switzerland. This article is an open access article distributed under the terms and conditions of the Creative Commons Attribution (CC BY) license (http://creativecommons.org/licenses/by/4.0/).
Copyright: This open access article is published under a Creative Commons CC BY 4.0 license, which permit the free download, distribution, and reuse, provided that the author and preprint are cited in any reuse.