

Submitted:
14 August 2026
Posted:
17 August 2026
You are already at the latest version
Abstract
Medium-density fiberboard (MDF) is widely used for embossed door panels. The fiber refining process is crucial for determining both surface quality and mechanical performance of these panels. This study investigated how different refining conditions affect fiber granulometry, surface quality, and mechanical properties of embossed MDF door panels. Three key refining parameters were investigated: digester steam pressure (0.8 and 0.9 MPa), refiner specific energy (70 and 80 kWh/t), and refiner differential pressure (24, 35, and 50 kPa). Panel properties were evaluated in terms of vertical density profile, surface roughness, bending properties, and cleavage strength. Statistical analysis revealed that refining parameters significantly affected fiber granulometry, as well as the average and surface density of the panels. Surface roughness, however, showed minimal variation under the refining conditions considered. In contrast, the bending properties – modulus of rupture (MOR) and modulus of elasticity (MOE) – were significantly improved. Most treatments achieved MOR and MOE values that were similar to or higher than those of the control panels. Cleavage strength also varied with refining conditions but remained comparable to the control across all treatments. Overall, the results indicate that optimized refining conditions can enhance MDF door panel performance, particularly bending properties, without compromising surface quality or cleavage strength.
Keywords:
medium-density fiberboard
; digester steam pressure
; refiner specific energy
; refiner differential pressure
; vertical density profile
; surface roughness
; bending properties
; cleavage strength
1. Introduction
Wood-based composite panels, including plywood, oriented strand board, particleboard, and fiberboard, especially medium-density fiberboard (MDF), are widely used as sustainable, cost-effective alternatives to solid wood in various sectors such as construction, furniture, and interior design [1,2]. Globally, one of the most sustainable areas of the wood processing industry is fiberboard production, primarily because it utilizes low-value wood species, wood residues, and an increased proportion of recycled wood and other lignocellulosic materials [3,4]. The latest data from the Food and Agriculture Organization of the United Nations [5] mentions that in 2024, global MDF and HDF (high-density fiberboard) production reached approximately 96.5 million m³, reflecting consistent demand from the furniture and construction sectors. The global MDF market was valued at approximately 48.5 billion USD in 2024, underscoring the industry’s economic importance and the need to enhance product quality, especially surface quality, in high-value applications such as embossed door skins [3,5,6]. Worldwide, the wood-based panel sector saw a 6% increase in export value [5], highlighting the market’s stability and potential for further innovation and investment [7]. While MDF/HDF production peaked at 111.4 million m³ in 2020, 2024 data show a stabilized market at 108.2 million m³ [5].
MDF is an engineered wood composite manufactured through a dry process. In North America and Europe, these panels are typically produced from sawmill softwood and hardwood residues, which are defibrated into fibers through thermomechanical refining, mixed with synthetic resin binders, waxes or other additives, and then hot-pressed into panels [8,9]. They are widely used in residential furniture, millwork components, interior wall paneling, and doors, due to their ease of machining, good surface properties, and high finishing quality [10]. The surface finish is crucial for meeting the demand for high-quality products, as many customers choose furniture based largely on its visual appeal [11]. The quality and appearance of the surface finish are important factors influencing the overall functionality and usability of wood products [11,12].
The refining of fibers is crucial in MDF production, and its effectiveness depends largely on the type of raw material (e.g., wood chips, sawdust, shavings, or other lignocellulosic materials), the wood species used (hardwood, softwood, or blends), and the operating conditions of both the pre-heater and refiner [13,14]. The thermomechanical refining process involves two main stages: pre-heating in a digester and mechanical fiber separation using a disk refiner. In the digester, lignin is softened under elevated temperature and pressure, preparing the raw material – typically sawmill residues – for the next step. The material is then processed in the refiner, where the grinding disks mill it into individual fibers [14]. During refining, the grinding disk interacts with the material, promoting fiber separation through longitudinal fibrillation and transverse breakage, which shortens the fibers [15]. Softwoods, which typically have a higher lignin content than hardwoods, require more severe refining conditions, including higher temperatures, longer retention times in the digester, and greater specific energy during refining [16].
Fiber quality is defined by characteristics such as size, morphology, surface properties, and chemical composition [14]. These attributes directly influence the physical and mechanical properties of the resulting MDF panels. Given the importance of surface quality, several studies have identified key factors affecting the final quality of MDF panels. These include the physical and chemical properties of the substrate [11] as well as the morphology of the wood fibers [17,18]. In addition to raw material characteristics, fiber quality is further affected by processing variables such as the degree of wood breakdown [14], the geometry of refiner disks, the gap between refiner disks, raw material volume, and rotor speed [13,19]. Several studies have shown that thermomechanical refining parameters, such as digester steam pressure, steam temperature, refiner specific energy, and refiner differential pressure, can affect fiber quality during MDF production [20,21,22,23,24]. Ibrahim et al. [20] demonstrated that mild refining conditions—typically characterized by pre-heating temperatures ranging from 140 to 160 °C and refining pressures of 4 to 6 bars (0.4-0.6 MPa)—produce longer, more intact fibers from oil palm trunk [19]. These conditions facilitated lignin softening, contributing to greater dimensional stability and improved mechanical properties in MDF panels. In contrast, more severe refining conditions, such as temperatures above 170 °C and steam pressures exceeding 8 bar (0.8 MPa), tend to yield shorter, damaged, or broken fibers from alternative materials, such as oil palm trunk, negatively affecting the physical performance of the panels [24]. Furthermore, these severe conditions lead to higher energy requirements and increased production costs, a challenge that is also critical in the highly energy-intensive refining of traditional wood chips [25]. These results highlight the importance of refining parameter settings to control fiber quality and MDF performance. However, their effects depend strongly on the intrinsic characteristics of the raw material. Thus, optimal refining conditions must be adapted to each raw material type.
Surface quality also plays a critical role in determining the final appearance and performance of MDF products. Even minor surface irregularities can become visible through overlays, compromising product grade, visual appeal, finishing, and bonding performance [26,27]. For direct painting or surface finishing treatments to be effective, the MDF surface must be smooth, stable, and not overly absorbent [27]. Surface roughness is therefore one of the most important parameters influencing the quality of final wood-based products, particularly in processes such as gluing and finishing [28,29]. Usually, a lower surface roughness improves adhesive distribution and bonding efficiency by promoting more uniform adhesive spread and better contact between the adhesive and the fiber surface [11,30]. Furthermore, recent studies have reported a strong relationship between panel density and surface roughness parameters in MDF [11]. Increased surface density leads to enhanced fiber compaction and reduced panel surface porosity, resulting in a more uniform and compact structure. This improved surface compaction reduces surface irregularities, thereby lowering roughness and enhancing product finishing.
Despite growing interest in the surface optimization of MDF panels, few studies have examined the direct relationship between fiber-refining parameters and surface performance in industrial conditions, particularly for embossed MDF door panels used on both sides of interior doors (skin–frame–skin structure). MDF door panels are typically manufactured at high density (~900-1000 kg/m3) and thin thicknesses (~3 mm). Moreover, the decorative embossed pattern prevents surface sanding – an important step for improving MDF surface quality, making the initial surface quality of embossed MDF door panels even more critical for downstream operations such as priming, painting, or lamination [20,21,31]. The refining process directly affects fiber morphology and size distribution, which, in turn, can affect not only the surface characteristics, such as density and roughness, but also the mechanical properties and adhesion strength of the panels [15,32,33]. Understanding these relationships is therefore essential for improving finish quality and minimizing production defects.
In this context, this study investigates how key refining parameters—specifically digester steam pressure, refiner specific energy, and refiner differential pressure—affect fiber size distribution, surface quality, and mechanical properties of embossed MDF door panels, including panel density, surface density, surface roughness, bending properties, and cleavage strength.
2. Materials and Methods
2.1. Materials
The fibers and embossed MDF door panels used in this study were produced under industrial conditions by an industrial partner. The material consisted of refined softwood fibers composed of approximately 70% spruce (Picea spp.) and 30% balsam fir (Abies balsamea (L.) Mill.) from sawmill residues. The fibers were obtained from small wood chips ranging from 4.75 mm to approximately 12.50 mm in size and were subsequently used in the industrial production of embossed MDF door panels.
2.2. Fiber Refining and Material Sampling
The fibers were refined using a Valmet M-series defibrator system (Valmet Fibertech AB, Sundsvall, Sweden) from the industrial production line. This system primarily comprises three parts: a chip bin that equalizes the moisture and temperature of wood chips before pre-heating, a pre-heater (digester) that softens the lignin through heat and steam pressure, and a disk refiner, composed of a stationary disk and a rotating disk, that grinds the raw material, completing the separation of the fibers (Figure 1) [34]. Three key parameters of this refining process were evaluated. The first parameter was the digester steam pressure, evaluated at two levels: 0.80 and 0.90 MPa. The second parameter was the refiner specific energy, related to the inter-disk spacing and/or motor load for a given capacity, at two levels: 70 and 80 kWh/t. The third parameter was the refiner differential pressure, set at three levels: 24, 35, and 50 kPa. These operating ranges were selected to be close to those used in the mill’s typical production conditions. This experimental design resulted in 12 treatment combinations. Additionally, a control treatment was conducted under standard panel manufacturing conditions, with a digester steam pressure of 0.85 MPa, a refiner specific energy of 70 kWh/t, and a refiner differential pressure of 35 kPa (Table 1).
The fibers were sampled directly from the production line at the exit of the mat formation station, prior to pre-pressing. To ensure process stabilization and purging of previous material, a 15 min interval was allowed after adjusting the refining parameters for each treatment. The mat moisture content was 11.2% (based on fiber dry weight) for all treatments. Three bags of fibers, each weighing approximately 200 g, were collected for each treatment. The material was then kept for further granulometric analysis. After this, there was a 30-minute wait before collecting the panels at the end of the production line. For each treatment, three uncoated panels (without primer) were collected for subsequent laboratory analysis. All panels were produced under identical hot-pressing conditions for all refining treatments and the control, using a multi-opening Valmet batch press MO-235 (Valmet Fibertech AB, Sundsvall, Sweden). The panels had nominal dimensions of 2135 mm × 820 mm × 2.7 mm (length × width × thickness) and a target density of 960 kg/m³. In total, 39 panels were included in the study.
The panel-cutting layout for samples for vertical density profile (VDP), surface roughness, bending properties, and cleavage strength tests is shown in Figure 2. Before testing, all samples were conditioned in a climate chamber at 20 °C and 65% relative humidity for approximately four weeks until they reached a stable weight corresponding to a target equilibrium moisture content of about 10%.
2.3. Fiber Characterization
A granulometric analysis of the fibers was performed according to the method described by Xing et al. [35]. Before sieving, the fibers were dried in an oven at 103 °C for 24 h. Then, 30 g of dried fibers were sieved using a Ro-Tap® sieve shaker equipped (W.S. Tyler, Mentor, OH, USA), with a series of sieves with mesh openings of 1.40 mm, 0.85 mm, 0.50 mm, 0.30 mm, 0.15 mm, and a collecting pan for fibers smaller than 0.15 mm. It allowed the fibers to be classified into six size classes. The vibration duration was set to 15 min. The analysis was repeated three times for each treatment and for the control.
2.4. Vertical Density Profile Measurements
For each treatment, 12 samples measuring 50 mm x 50 mm per panel were analyzed to determine the VDP using an X-ray densitometer (Quintek Measurement System Inc., model QDP-01X, Knoxville, TN, USA). Measurements were taken at a spatial resolution of 0.02 mm across the panel thickness. From the VDP data, both the average and the maximum surface densities were determined for each sample. The maximum surface density corresponds to the peak density observed below the surface layers. Thirty-six samples per treatment were measured.
2.5. Surface Roughness Analysis
Surface roughness measurements were performed on 50 mm x 50 mm samples using a non-contact optical profiler (Contour GT-K, Bruker Nano, Arizona, USA) via white light interferometry. The test was performed according to the PN-EN ISO 25178 [36] procedure. For the test, the profilometer was calibrated every 50 measurements using a standard reference sample with an Rα value of 1.75 µm. For the 3D surface profiles, a 1000 µm x 1000 µm area was evaluated on each sample surface. This area was generated by stitching together four optical fields of view (in a 2x2 grid) per sample to provide a representative average of the surface roughness parameters. Subsequently, a macroscopic tilt of the sample was corrected through a plane-fitting procedure, and no additional filters were applied. Following this, five areal surface roughness parameters were obtained: arithmetic mean height (Sa), maximum peak height (Sp), root mean square height (Sq), total height (maximum peak height + maximum pit height) (Sz), and maximum pit height (Sv) [11,37]. A total of six samples per panel were used for this analysis, yielding 18 measurements per treatment.
2.6. Measurement of Bending Properties
The bending properties of the panels, including the bending modulus of rupture (MOR) and modulus of elasticity (MOE), were tested using an MTS QTest/5 universal testing machine (MTS Systems Corporation, Eden Prairie, MN, USA) with a 5 kN load capacity. The bending MOR and MOE tests were performed in accordance with ASTM D1037-12 (2020) [38]. Eight samples measuring 115.8 mm long (51 mm plus 24 times the nominal thickness) and 51 mm wide (for panels with a thickness of 6 mm or less) were tested per panel, resulting in a total of 24 samples per treatment (Figure 2). A span of 64.8 mm (24 times the nominal panel thickness) and a constant loading rate of 1.5 mm/min were used. The bending MOR and MOE were calculated using the following equations:
where: Pmax is the maximum load (N), L is the span length (mm), b and d are the sample width and thickness (mm), and ΔP/Δy is the slope of the load-deflection curve (N/mm). Equations 1 and 2 define MOR and MOE in MPa.
2.7. Cleavage Strength Tests
Although cleavage strength is typically not assessed in standard MDF, it is currently used for quality control in the embossed MDF door panel industry. This test evaluates the resistance of a bonded joint to a wedge-type opening force by applying a stress concentration at one edge of the sample, resulting in progressive cracking of the joint. The cleavage test was performed in accordance with ASTM D1037-12 (2020) [38] for tension applied perpendicular to the surface, with adjustments to align with current practices in the MDF door panel industry. The tests were conducted using an MTS QTest/5 universal testing machine with a load capacity of 5 kN, equipped with a custom-made device tailored to the geometry of the cleavage test assembly (Figure 3a, b). The loading rate was kept constant at 2.5 mm/min. The cleavage strength was calculated as follows:
where: A is the bonded area (mm2), equal to 2286 mm2. Cleavage strength is expressed in N/mm2 (or MPa).
For testing, MDF door panel samples measuring 76.2 mm x 76.2 mm were bonded to an MDF substrate measuring 76.2 mm x 30.0 mm x 30.0 mm (length x width x thickness) at one end of the MDF door panel sample, as shown in Figure 3c. The cleavage test assembly was bonded with a polyvinyl acetate (PVAc) adhesive (DURA PRO G-2360, Recochem Inc., Montreal, QC, Canada) with a solid content of 45 ± 1%, which was applied in accordance with the door panel manufacturer’s industrial protocol. A precisely measured quantity of 0.67 ± 0.05 g of liquid adhesive was applied with a brush to the edge surface (panel thickness) of the MDF substrate. The sample assembly was completed within 10 min, ensuring the two parts were joined within 1 min to prevent premature drying. The assembly was then placed in a CARVER® Auto Series Plus laboratory press (CARVER Inc., Wabash, IN, USA) and subjected to a pressure of 689.5 kPa per sample for 30 min (Figure 3d). Samples were pressed in groups of eight, corresponding to a total applied pressure of 5516 kPa. After pressing, the samples were stored for at least 24 h before testing. A total of six samples per panel were used, yielding 18 measurements per refining treatment.
2.8. Statistical Analysis
All statistical analyses were conducted using the R software (version 4.4.1) [39]. The experiment followed a 2 x 2 x 3 factorial design, with digester steam pressure (0.80 and 0.90 MPa), refiner specific energy (70 and 80 kWh/t), and refiner differential pressure (24, 25, and 50 kPa) as fixed factors. For the granulometry analysis, compositional data analysis was used to evaluate the effects of refining parameters on the fiber size-class distribution. Because fiber size class proportions represent parts of a whole and sum to a constant (Σ = 100%), appropriate log-ratio transformations were applied to preserve the relative structure of the data. The multivariate significance of refining parameters on the compositional granulometry response was assessed using the Pillai-Bartlett trace (or Pillai trace), a robust multivariate analysis of variance (MANOVA) test statistic [40].
For the remaining response variables – average density, maximum surface density, surface roughness parameters, and mechanical properties – a one-way analysis of variance (ANOVA) was performed to compare all treatments and the control condition, followed by post hoc comparisons when significant effects were detected. The assumptions of normality and homogeneity of variances were verified using the Shapiro–Wilk and the Levene tests, respectively. Among the evaluated variables, only MOE did not meet the homoscedasticity assumption. Therefore, a square root transformation was applied to the MOE data to satisfy the assumptions of normality and homogeneity of variances. To identify pairwise differences among the 12 treatments and the control, Tukey’s honestly significant difference post hoc tests were applied at a 0.05 significance level.
3. Results
3.1. Fiber Granulometry
In the granulometry analysis, the response variable was defined as the fiber size distribution treated as compositional data. Specifically, the response consisted of a multivariate vector of relative mass proportions (%) for fibers retained in each granulometric class, with all classes analyzed jointly and their proportions summing to 100%. This multivariate compositional response describes the overall granulometric composition of the fibers. A large Pillai trace (>0.30) indicates that the factor explains a substantial portion of the multivariate variance. The statistical analysis showed that all main factors and their interactions significantly influenced the composition of fiber size classes (Table 2). Among the factors studied, refiner specific energy had the strongest effect on fiber size distribution (Pillai trace = 0.944), followed by digester steam pressure (Pillai trace = 0.886) and refiner differential pressure (Pillai trace = 0.689) (Table 2). Additionally, significant interaction effects were observed, particularly between digester steam pressure and refiner specific energy (Pillai trace = 0.766). Moderate interaction effects were also found for digester steam pressure × refiner differential pressure (Pillai trace = 0.489) and refiner specific energy x refiner differential pressure (Pillai trace = 0.458). These results indicate that the effect of one parameter depends on the level of another. In particular, the strong interaction between steam pressure and specific energy indicates that they must be optimized together rather than independently.
Figure 4 shows the fiber size distribution obtained for each treatment. The fibers are categorized as follows: large-to-medium fibers (>1.40 mm to 0.50 mm), represented by shades from dark to light green; small fibers (>0.30 mm to 0.15 mm), depicted in light to dark yellow; and fines, smaller than 0.15 mm, indicated in brown. Treatments with lower digester steam pressure (0.80 MPa) and lower refiner specific energy (70 kWh/t), specifically for differential pressures of 24 kPa and 50 kPa, as well as the SP0.80-SE80-DP24 treatment, resulted in a greater proportion of large- to medium-sized fibers (ranging from 0.50 mm to >1.4 mm) compared to other refining treatments. The remaining refining treatments investigated had lower proportions of medium-to-large fibers than the control. In contrast, the proportion of fines (< 0.15 mm) across all refining treatments was higher than that of the control (SP0.85-SE70-DP35). The fine proportion remained relatively consistent across refining treatments, ranging from 9.2% to 12.6%. The highest fine proportions were observed under the conditions SP0.80-SE80-DP50 (12.3%), SP0.90–SE80–DP35 (12.6%), and SP0.90-SE80-DP50 (12%). These results are consistent with the statistical analysis, which identified specific energy (Pillai trace = 0.944) and steam pressure (Pillai trace = 0.886) as the most influential factors. Higher levels of these parameters promote greater fiber defibration, leading to a decreased proportion of large-to-medium fibers and an increased proportion of fines. By comparison, the control contained only 8% fines.
3.2. Panel Surface Density
Figure 5 shows the VDPs of the panels across all treatments and the control. The profiles are presented across the panel thickness, from the top surface (left) to the bottom surface (right). The top surface is critical for coating, and the bottom surface is critical to the door assembly's structural integrity, serving as the adhesion interface with the core frame. All treatments exhibited a similar overall VDP shape, characterized by higher densities near the panel surfaces and lower densities toward the core. For all samples, the maximum density was observed just below the surface layers. The VDPs were not perfectly symmetrical, reflecting differences in compaction and heat transfer conditions between the two panel surfaces during hot pressing. Because the overall VDP patterns did not differ substantially across treatments, one representative specimen per treatment was selected to illustrate the profiles (Figure 5).
Table 3 summarizes the results of a one-way ANOVA comparing all refining treatments and the control across all response variables. Significant differences were found in average and maximum surface densities among the treatments and the control. Figure 6a and Figure 6b compare mean densities across all refining treatments and the control. The control (SP0.85–SE70–DP35) is situated in the mid-range for both average and maximum surface densities and is not significantly different from many refining treatments. The treatment SP0.90-SE80-DP50, which combines the most severe conditions of steam pressure, specific energy, and differential pressure, exhibited the highest mean density, yet was similar to the control. By contrast, the lowest mean densities were observed under low digester steam pressure (0.80 MPa) and high refiner specific energy (80 kWh/t), specifically in the condition SP0.80-SE80-DP35, which was statistically different from the control.
3.3. Surface Roughness
Figure 7 shows a typical surface roughness map of an MDF panel measured by the differential induction method. The 2D topographic map (Figure 7a) illustrates height variations across the surface, while the 3D reconstruction (Figure 7b) highlights fiber orientation, grooves, and valleys. Together, these images reveal the heterogeneous surface morphology of the panels and the irregularities distributed along their surfaces.
Table 4 compares the means of the surface roughness parameters across treatments and the control. The Sv value was significantly lower in the treatment SP0.80-SE70-DP24 compared with the control (SP0.85-SE70-DP35) and the other refining treatments, and significantly higher in SP0.90-SE80-DF24 (Table 3 and Table 4). No significant differences were found between the control and the remaining treatments.
3.4. Mechanical Properties
3.4.1. Bending Properties
The one-way ANOVA showed a significant difference in bending MOR among refining treatments and the control (Table 3). As shown in Figure 8a, MOR values for most treatments were similar to or higher than those of the control panels. The majority of treatments fell into the highest statistical group, while only a few (SP0.80-SE70-DP24, SP0.80-SE70-DP50, SP0.90-SE70-DP35, and SP0.90-SE70-DP50) showed MOR values similar to the control. Overall, panels produced from fibers refined at a specific energy of 80 kWh/t, regardless of digester steam pressure or differential pressure, had higher MOR (typically exceeding 46 MPa) than the control.
For bending MOE, significant differences were observed among treatments and the control, resulting in various statistically distinct groups (Figure 8b). As with MOR, most refining treatments produced panels with MOE values similar to or higher than those of the control. The only exception was the treatment SP0.90–SE70–DP50, which exhibited the lowest MOE, lower than that of the control. These results indicate potential to improve the bending properties of MDF door panels.
3.4.2. Cleavage Strength
All panels from the refining treatments exhibited cleavage strengths statistically equivalent to those of the control panels (Figure 9). However, among the refining treatments, some performed better than others. For example, panels from the SP0.80-SE70-DP35 treatment had higher cleavage strength than those from the SP0.80-SE80-DP24, SP0.90-SE70-DP50, and SP0.90-SE80-DP24 treatments.
4. Discussion
4.1. Granulometry
In the granulometry analysis, all refining parameters (digester steam pressure, refiner specific energy, and refiner differential pressure), as well as their interactions, significantly affected the fiber size distribution (Table 2). As shown in Figure 4, treatments with a higher digester steam pressure (0.90 MPa) generally resulted in a lower proportion of large-to-medium-sized fibers (ranging from >1.40 mm to 0.50 mm), and a corresponding increase in the fraction of small fibers (ranging from 0.15 to >0.30 mm) and fines (<0.15 mm), compared to treatments at lower steam pressure (0.80 MPa) and the control. This shift toward smaller-sized fibers is consistent with previous findings, showing that elevated steam pressure can increase fiber fragmentation and reduce average fiber length [32,41,42]. For example, Nayeri et al. [21] found that increasing the digester steam pressure during thermomechanical refining of kenaf stem significantly shortened the fiber length. The study indicated that both very low and very high refining pressures should be avoided in the production of kenaf-based fiberboard. Such conditions lead to fiber shortening, increased fine content, and ultimately compromise mechanical properties. Benthien and Bähnisch [41] also observed a consistent reduction in wood fiber size with increasing digester steaming time and temperature.
Higher specific energy also shifted the fiber size distribution toward smaller size classes, with digester steam pressure amplifying this effect (see treatments SP0.90-SE80-DP35-50, Figure 4). Przybysz et al. [43] demonstrated that increasing refining intensity enhances internal fibrillation while simultaneously shortening pine fibers, and that higher energy inputs further accentuate this effect by markedly reducing fiber length and increasing the proportion of fines. These findings corroborate our findings, which show that refiner specific energy has the most significant individual effect on fiber size, followed by digester steam pressure and refiner differential pressure (Table 2). The observed interactions, such as digester steam pressure × refiner specific energy and digester steam pressure × refiner differential pressure, highlight how parameter combinations can amplify the impacts on fiber granulometry. High steam pressure combined with high specific energy may lead to increased fibrillation and fiber breakage, producing smaller fibers (Figure 4).
Although refiner differential pressure produced a significant effect on fiber size distribution (Table 2), its interactions with steam pressure and specific energy did not show a consistent trend (Figure 4). This pattern indicates that its influence may be confined to a narrow operational range, while the overall effects on fiber granulometry result from the complex interaction between digester steam pressure and refiner specific energy. Similar interaction of pressure-related parameters has been reported in previous studies, where internal and feed pressure affected fiber morphology, but their combined effects with other variables like refiner differential pressure remained difficult to predict [14].
4.2. Surface Density
The VDP of the panels exhibits a typical U-shaped profile, characterized by high-density surface layers and a lower-density core layer (Figure 5). This profile results from the combined effects of steam plasticization and mechanical compaction, which promote fiber rearrangement and densification at the panel surfaces during hot pressing [44,45].
The treatment comparison shown in Figure 6b indicates that similar maximum surface densities can be achieved using various refining parameters. This suggests that surface densification depends primarily on an appropriate balance between thermal softening and mechanical refining intensity, rather than on any single parameter. This behavior is consistent with previous findings showing that digester steam pressure promotes fiber softening and improves mat consolidation during hot pressing, while controlled refiner specific energy enhances fibrillation and effective surface area without generating excessive fines [35,43]. The lowest surface densities were observed in treatments SP0.80–SE80–DP24 and SP0.80-SE80-DP35, which combine low steam pressure and high specific energy with balanced refiner differential pressure. It can be attributed to the fact that under these conditions, limited fiber softening and insufficient fibrillation restrict effective surface-layer formation. Other studies have reported that excessive refiner specific energy disrupts fiber alignment and surface-layer integrity, potentially reducing surface densification [41,42]. However, the SP0.90-SE80-DP50 treatment exhibited the highest net surface density, although it was not statistically different from several optimized thermomechanical combinations. This indicates that equivalent surface densification can be achieved across the various refining conditions studied when the overall thermomechanical balance is maintained.
Our results did not show negative impacts on the mechanical properties of the panels. This suggests that the refining intensities used in this study did not reach a level that would result in structural damage detrimental to the panels' mechanical behavior. Nonetheless, although mechanical strength was preserved, the microstructural effects reported in the literature may still influence other panel characteristics, such as surface finishing and coating quality [14,24,46]. Therefore, further comprehensive studies exploring the direct correlation between these microstructural effects and surface performance are necessary.
4.3. Surface Roughness
Statistical analysis revealed that refining conditions had a limited influence on the MDF surface roughness. Among the roughness parameters, only Sv was significantly affected in two treatments: SP0.80-SE70-D24 with the lowest value, and SP0.90-SE80-DP24 with the highest value (Table 3 and Table 4), indicating that valley depth is particularly sensitive to combined thermomechanical and shear-related refining effects. A more negative Sv value corresponds to deeper surface valleys, indicating greater surface irregularities. Therefore, the SP0.90-SE80-DP24 treatment is not ideal, as these irregularities compromise the smoothness required for optimal coating and finishing applications. MDF panels require smooth and homogeneous surfaces for optimal finishing. Considering this approach, the large Sv values of -75 μm in the SP0.90-ES80-DP24 treatment indicate poor surface quality, whereas the SP0.80-SE70-DP24 treatment, with Sv = -50.6 μm, yields a more uniform and suitable surface for MDF panels (Table 4). Previous studies report that MDF roughness is more strongly affected by post-pressing operations, such as machining operations, sanding, and coating application, than by variations in fiber refining parameters when pressing conditions remain constant [27,47]. Moreover, significant changes in surface roughness are typically driven by pronounced differences in density profiles or fiber morphology [23,26]. In our study, the absence of extreme refining-severity conditions likely contributed to the overall stability of roughness values across treatments.
The effect of refining treatments on Sv may be related to changes in fiber compressibility and elastic recovery during hot pressing. Increased thermal softening can promote surface densification, but it may also cause localized fiber collapse or bundle deformation, resulting in deeper surface valleys after springback. This helps explain the deeper surface valleys observed in the SP0.90-ES80-DP24 treatment. According to Hiziroglu [26,27] and Gurua and Irle [26,27], micro-deformations induced by hot pressing in areas with coarse fibers affect the maximun valley depth (Rv) without significantly altering other roughness parameters, such as Ra or Rq. Although their observations were based on 2D profiles, our 3D areal study confirms this observation, showing that Sv is more sensitive to thermomechanical softening than other surface roughness parameters. This makes Sv a useful indicator for assessing the balance between compaction and surface quality in MDF manufacturing.
4.4. Mechanical Properties
4.4.1. Bending Properties
Among the properties evaluated for the panels, bending properties showed the greatest potential for improvement across the various refining conditions studied. The bending MOR of the panels ranged from approximately 42 to 48 MPa across all treatments (Figure 8a). The control panels exhibited one of the lowest MOR values at 42.7 MPa, whereas most panels from the refining treatments showed equal or higher MOR values. This indicates that there is room to optimize the refining process to produce panels with improved mechanical performance. Generally, the highest MOR values were observed in treatments using SE 80 kWh/t, regardless of other refining parameters, ranging from 45.8 to 48.0 MPa. These values were statistically superior to the control.
The bending MOE of MDF panels ranged from 3.8 to 4.6 GPa (Figure 8b). As observed for bending strength, panels from refining treatments showed MOE values equal to or higher than those of the control. The control panels had one of the lowest average MOE values, at 4.1 GPa. The best MOE performance was observed with the SP0.90-SE70-DP24 treatment, whereas the worst was observed with the SP0.90-SE70-DP50 treatment.
These results reflect the interrelation necessary between thermal and mechanical refining conditions, indicating that thermal softening enhances fiber flexibility and consolidation, thereby exerting a more significant influence on material stiffness [22,35]. These findings align with previous studies on the refining of kenaf fibers, which indicate that moderate to high steaming enhances panel stiffness, likely due to the short fibers. This, in turn, makes the mat more easily compressed, leading to better compaction [48]. Although some studies have linked a higher MOE to a denser surface layer, our VDP analysis did not reveal a significant correlation between these variables. This indicates that MOE may also be influenced by the combined effects of fiber morphology and inter-fiber bonding, rather than density alone.
4.4.2. Cleavage Strength
The cleavage strength of the MDF panels ranged from approximately 0.075 to 0.100 MPa across all treatments (Figure 9). The control panels had a cleavage strength of approximately 0.085 MPa, placing them in an intermediate statistical group that overlapped with most refining treatments. The highest cleavage strength (around 0.10 MPa) was obtained for the treatment 0.80-SE70-DP35, although this value was not consistently statistically different from those of several other treatments. In contrast, the lowest values (~0.075-0.078 MPa) were observed for panels produced under conditions at SP 0.90 MPa (SE70-DP50 and SE80-DP24), although these values were not statistically different from the control group. Overall, the limited variation and significant overlap among treatments indicate that the range of refining conditions studied had only a minor effect on bonding performance. Nevertheless, the slightly higher values observed under specific conditions (e.g., SP0.80-SE70-DP35) suggest that modest improvements in cleavage strength can be achieved through process optimization.
4.5. Comparison between Refining Treatments and Control
Figure 10 shows how the refining conditions compare to the control group. The matrix was developed to enable a comprehensive comparison of the effects of refining conditions across all evaluated properties. The colour coding indicates whether deviations from the control are positive, neutral, or negative.
The refining conditions studied mostly had neutral or positive effects compared to the control, with only a few exceptions. Both average and maximum surface densities were influenced by refining conditions. Specifically, at a lower steam pressure (0.80 MPa), combined with higher specific energy (80 kWh/t) and a low-to-intermediate differential pressure (24–35 kPa), both the average and maximum surface densities decreased. A lower average density can help produce lighter panels, making them easier to handle and reducing transportation costs [49]. However, reductions in surface density can have mixed effects on panel performance. Notably, these reductions did not negatively affect bonding or bending performance, as demonstrated in SP0.80–SE80–DP24 and –DP35 (Figure 10). Conversely, a reduction in surface density may adversely affect finishing quality [11]. Future studies are needed to investigate the influence of reduced surface density on MDF panel coatings. In contrast, surface roughness parameters (Sa, Sp, Sq, Sz) remained largely unaffected by the refining conditions, indicating that surface topography is not very sensitive to variations in thermomechanical refining within the studied range. Only Sv showed some responsiveness, suggesting localized changes in surface valleys rather than global alterations in surface roughness (Figure 10).
A more significant impact of refining conditions was observed on bending properties (Figure 10), although the response did not follow a single consistent trend across all parameter combinations. Bending MOR was generally improved at high specific energy (80 kWh/t), regardless of steam pressure and differential pressure levels, with all refining conditions demonstrating improvements over the control. Positive effects on MOR were also observed for other refining conditions that combine SP0.80-SE70-DP35 or SP0.90-SE70-DP24. Bending MOE also showed predominantly positive responses across various refining treatments, especially at the higher digester steam pressure (0.90 MPa). The only exception was the treatment at SP0.90-SE70-DP50, which decreased compared to the control (negative effect). At a lower steam pressure (0.80 MPa), the MOE responses were more selective: positive effects were limited to SP0.80-SE70-DP35 and SP0.80-SE80-DP24, while other combinations showed neutral effects. Additionally, cleavage strength remained largely unchanged across all treatments, with all combinations showing neutral effects compared to the control. These findings indicate that cleavage strength is relatively insensitive to the refining conditions studied, and none of the conditions significantly compromised internal bonding.
From a broader perspective, the treatments that provided the most favorable trade-offs between panel density and bending performance for both MOE and MOR, without negatively affecting surface roughness across the range of refining conditions studied, are SP0.80–SE70–DP35, SP0.80–SE80–DP24, SP0.90–SE70–DP24, SP0.90-SE80-DP35, and SP0.90–SE80–DP50.
5. Conclusions
This study investigated how refining parameters – digester steam pressure, refiner specific energy, and refiner differential pressure – affect fiber granulometry as well as the average density, surface density, surface roughness, bending properties, and cleavage strength of embossed MDF door panels. The main conclusions are as follows:
- Fiber granulometry was significantly influenced by all refining parameters and their interactions. Steam pressure and specific energy had the greatest effect on fiber size distribution, followed by differential pressure. The strongest interaction was observed between steam pressure and specific energy. Lower steam pressure (0.80 MPa) and specific energy (70 kWh/t) helped to preserve large to medium-sized fibers, whereas higher levels of these parameters increased fiber defibration and fines content. Although all treatments produced more fines than the control, their proportion remained relatively consistent, confirming that steam pressure and specific energy are the main factors affecting fiber morphology.
- Surface roughness was minimally affected by the refining conditions. Only the maximum pit depth (Sv) showed sensitivity to treatment, indicating localized changes in surface valleys rather than overall variations in surface roughness.
- Bending MOR was improved at higher specific energy (80 kWh/t), regardless of steam pressure or differential pressure, with all treatments outperforming the control. MOR improvements were also observed at lower specific energy under specific parameter combinations (SP0.80-SE70-DP35 and SP0.90-SE70-DP24).
- Bending MOE was generally improved at higher digester steam pressure (0.90 MPa), likely due to increased fiber flexibility and improved mat consolidation. However, one condition (SP0.90-SE70-DP50) resulted in reduced stiffness.
- Cleavage strength remained similar across all treatments compared to the control, indicating that internal bonding was not significantly affected by the range of refining conditions examined.
- Optimal performance – balancing density, bending properties (MOR/MOE), and surface quality – was achieved with the following parameter combinations: SP0.80–SE70–DP35, SP0.80–SE80–DP24, SP0.90–SE70–DP24, SP0.90-SE80-DP35, and SP0.90–SE80–DP50.
Overall, the results demonstrated that refining conditions significantly influence fiber size distribution and panel performance. Higher steam pressure and specific energy enhance fiber defibration, thereby improving bending properties. Careful optimization of these parameters enhances mechanical performance without compromising the surface quality of embossed MDF door panels.
Author Contributions
For preparation of the present manuscript the authors collaborated in the following manner: “Conceptualization, RG, AC and JGA; methodology, RG, AC and JGA; validation, RG, VL, and AC; formal analysis, JGA; investigation, JGA, RG, VL, and AC; data curation, JGA; writing—original draft preparation, JGA; writing—review and editing, RG, AC, and VL; supervision, RG and AC; project administration, AC; funding acquisition, AC, VL. All authors have read and agreed to the published version of the manuscript.”
Funding
This paper was prepared as part of the research activities of the Wood-Based Composite Panel Research Consortium (Corepan-Bois) at Université Laval. This research was funded by the Natural Sciences and Engineering Research Council of Canada (NSERC) [grant number ALLRP 571660-21], the Ministère des Ressources naturelles et des Forêts (MRNF), the Conseil de l’industrie forestière du Québec (CIFQ) [grant number PIP-2019-12], and Corepan-Bois’s partners: FPInnovations, Arbec Forest Products, SACOPAN, Tafisa Canada, and Uniboard Canada.
Data Availability Statement
The original contributions presented in this study are included in the article. Further inquiries can be directed to the corresponding author.
Acknowledgments
The authors thank SACOPAN for its support during the factory work and its invaluable assistance in obtaining the necessary materials. Special thanks to Guillaume Lavoie, Khalid Khallouqui, and Yann-Jason Simard. We also extend our appreciation to the technicians at the CRMR at Université Laval for their collaboration in preparing the test samples, and to Rolando Montenegro Muro for his help with the statistical analysis.
Conflicts of Interest
The authors declare no conflicts of interest. The funders had no role in the design of the study, in the collection, analysis, or interpretation of data, or in the writing of the manuscript. The partners reviewed the manuscript and approved it for publication.
Abbreviations
The following abbreviations are used in this manuscript:
| ANOVA | Analysis of variance |
| DP | Refiner differential pressure |
| HDF | High-density fiberboard |
| MANOVA | Multivariate analysis of variance |
| MDF | Medium-density fiberboard |
| MOE | Modulus of elasticity |
| MOR | Modulus of rupture |
| PVAc | Polyvinyl acetate |
| Sa | Arithmetic mean height |
| SE | Refiner specific energy |
| SP | Digester steam pressure |
| Sp | Maximum peak height |
| Sq | Root mean square height |
| Sv | Maximum pit height |
| Sz | Total height |
| VDP | Vertical density profile |
References
- Bartoszuk, K.; Kowaluk, G. The influence of the content of recycled natural leather residue particles on the properties of high-density fiberboards. Materials 2023, 16, 5340. [Google Scholar] [CrossRef]
- Çamlıbel, O.; Aydin, M. Influence of density on medium-density fiberboard properties at industrial scale experimental. Pro Ligno 2023, 19, 11–20. [Google Scholar]
- Panchev, C.; Savov, V. Recycling of medium density fibreboards—A review. Innov. Woodwork. 2022, 1, 39–46. [Google Scholar]
- Savov, V.; Antov, P.; Dudeva, V.; Panchev, C. Properties of medium-density fiberboards with different contents of recycled fibers and urea–formaldehyde resin. Fibers 2025, 13, 40. [Google Scholar] [CrossRef]
- FAO. Forestry Production and Trade; Food and Agriculture Organization of the United Nations: Rome, Italy, 2025. [Google Scholar]
- Industry Research. Global Medium-Density Fiberboard (MDF) Market Size, Share & Trends Analysis Report, 2024–2032; Industry Research, 2024. [Google Scholar]
- IMARC Group. Particle Board Market Report by Application (Residential, Commercial), Sector (New Construction, Replacement), and Region 2024-2032; IMARC Group.
- Lee, S.H.; Lum, W.C.; Boon, J.G.; Kristak, L.; Antov, P.; Pędzik, M.; Rogoziński, T.; Taghiyari, H.R.; Lubis, M.A.R.; Fatriasari, W.; et al. Particleboard from agricultural biomass and recycled wood waste: A review. J. Mater. Res. Technol. 2022, 20, 4630–4658. [Google Scholar] [CrossRef]
- Garcia, R.; Calvez, I.; Koubaa, A.; Landry, V.; Cloutier, A. Sustainability, circularity, and innovation in wood-based panel manufacturing in the 2020s: Opportunities and challenges. Curr. For. Rep. 2024, 10, 420–441. [Google Scholar] [CrossRef]
- Rebolledo, P.; Cloutier, A.; Yemele, M.-C. Effect of density and fiber size on porosity and thermal conductivity of fiberboard mats. Fibers 2018, 6, 81. [Google Scholar] [CrossRef]
- Henke, M.; Lis, B.; Krystofiak, T. Evaluation of surface roughness parameters of HDF for finishing under industrial conditions. Materials 2022, 15, 6359. [Google Scholar] [CrossRef]
- Qing, L.; Li, Z.F.; Xing, D. Study on evaluation method of surface roughness of wood processing. In Proceedings of the International Workshop on Materials, Chemistry and Engineering, Xiamen, China, June 2018; SCITEPRESS—Science and Technology Publications, 2018; pp. 83–92. [Google Scholar]
- Gao, Y.; Hua, J.; Chen, G.; Cai, L.; Jia, N.; Zhu, L. Prediction of fiber quality using refining parameters in medium-density fiberboard production via the support vector machine algorithm. BioResources 2018, 13, 8184–8197. [Google Scholar] [CrossRef]
- Benthien, J.T.; Heldner, S.; Ohlmeyer, M. Investigation of the interrelations between defibration conditions, fiber size and medium-density fiberboard (MDF) properties. Eur. J. Wood Wood Prod. 2017, 75, 215–232. [Google Scholar] [CrossRef]
- Vititnev, A.; Chistova, N.; Alashkevich, Y.; Matygulina, V.; Marchenko, R. Optimization of wood fibre refining process in fibreboard production with new refiner disc working surface geometry. BioResources 2021, 16, 7751–7766. [Google Scholar] [CrossRef]
- Valmet Fibertech AB. Système de Défibrage Defibrator™ Série M: Consigne d'utilisation; Valmet: Espoo, Finland, 2000. [Google Scholar]
- Klimczewski, M.; Nicewicz, D. Properties of selected HDF pulp with recovered fibers added. Drewno 2013, 56, 89–100. [Google Scholar] [CrossRef]
- Sala, C.M.; Kowaluk, G. The influence of defibration pressure and fibres drying parameters on the properties of HDF made with recovered fibres. Ann. WULS For. Wood Technol. 2020, 111, 143–159. [Google Scholar] [CrossRef]
- Li, B.; Li, H.; Zha, Q.; Bandekar, R.; Alsaggaf, A.; Ni, Y. Effects of wood quality and refining process on TMP pulp and paper quality. BioResources 2011, 6, 3569–3584. [Google Scholar] [CrossRef]
- Ibrahim, Z.; Aziz, A.A.; Ramli, R.; Mokhtar, A.; Lee, S. Effect of refining parameters on medium density fibreboard (MDF) properties from oil palm trunk. Open J. Compos. Mater. 2013, 3, 127–131. [Google Scholar] [CrossRef]
- Nayeri, M.D.; Tahir, P.M.; Jawaid, M.; Ashaari, Z.; Abdullah, L.C.; Bakar, E.S.; Namvar, F. Medium density fibreboard made from kenaf (Hibiscus cannabinus L.) stem: Effect of thermo-mechanical refining and resin content. BioResources 2014, 9, 2372–2381. [Google Scholar] [CrossRef]
- Tasooji, M. Effects of thermomechanical refining on Douglas fir wood. Ph.D. Thesis, Virginia Polytechnic Institute and State University, Blacksburg, VA, USA, 2018. [Google Scholar]
- Cai, Z.; Muehl, J.H.; Winandy, J.E. Effects of panel density and mat moisture content on processing medium density fiberboard. For. Prod. J. 2006, 56, 20–25. [Google Scholar]
- Ibrahim, Z.; Alias, A.H.; Ramli, R.; Wahab, N.A.; Ahmad, M.; Osman, S.; Sheng, E.L. Effects of refining parameters on the properties of oil palm frond (OPF) fiber for medium density fibreboard (MDF). J. Adv. Res. Fluid Mech. Therm. Sci. 2021, 87, 64–77. [Google Scholar] [CrossRef]
- Boffadossi, R.; Leonesio, M.; Fagiano, L.; Bianchi, G. Prediction of power consumption from real process data of an industrial wood chip refining plant. IFAC-PapersOnLine 2023, 56, 8574–8579. [Google Scholar] [CrossRef]
- Hiziroglu, S. Surface roughness analysis of wood composites: A stylus method. For. Prod. J. 1996, 46. [Google Scholar]
- Gurau, L.; Irle, M. Surface roughness evaluation methods for wood products: A review. Curr. For. Rep. 2017, 3, 119–131. [Google Scholar] [CrossRef]
- Kamperidou, V.; Aidinidis, E.; Barboutis, I. Impact of structural defects on the surface quality of hardwood species sliced veneers. Appl. Sci. 2020, 10, 6265. [Google Scholar] [CrossRef]
- Coelho, C.L.; Carvalho, L.M.H.; Martins, J.M.; Costa, C.A.V.; Masson, D.; Méausoone, P.-J. Method for evaluating the influence of wood machining conditions on the objective characterization and subjective perception of a finished surface. Wood Sci. Technol. 2008, 42, 181–195. [Google Scholar] [CrossRef]
- Dundar, T.; Akbulut, T.; Korkut, S. The effects of some manufacturing factors on surface roughness of sliced makoré (Tieghemella heckelii Pierre ex A.Chev.) and rotary-cut beech (Fagus orientalis L.) veneers. Build. Environ. 2008, 43, 469–474. [Google Scholar] [CrossRef]
- Badin, N.; Campean, M.; Lengyel, K.; Ispas, M.; Bedelean, B. Property improvement of thin high-density fiberboard panels used as door-skins. BioResources 2017, 13, 1042–1054. [Google Scholar] [CrossRef]
- Savov, V.; Antov, P.; Panchev, C.; Lubis, M.A.R.; Taghiyari, H.R.; Lee, S.H.; Krišťák, Ľ.; Todorova, M. The impact of hydrolysis regime on the physical and mechanical characteristics of medium-density fiberboards manufactured from recycled wood fibers. Fibers 2023, 11, 103. [Google Scholar] [CrossRef]
- Gul, W.; Ahmad, N.; Mohammad, S.; Salah, B.; Sajid Ullah, S.; Khurram, M.; Khan, R. Impact of moisture content, closing speed, and pressurizing speed on the performance of medium density fiberboard (MDF). Front. Mater. 2023, 10. [Google Scholar] [CrossRef]
- Valmet Fibertech, A.B. Système de Défibrage Defibrator™ – Série M; Valmet Fibertech AB, 2000. [Google Scholar]
- Xing, C.; Wang, S.; Pharr, G.M. Nanoindentation of juvenile and mature loblolly pine (Pinus taeda L.) wood fibers as affected by thermomechanical refining pressure. Wood Sci. Technol. 2009, 43, 615–625. [Google Scholar] [CrossRef]
- ISO. Geometrical Product Specifications (GPS)—Surface Texture: Areal-Part 2: Terms, Definitions and Surface Texture Parameters; International Organization for Standardization: Geneva, Switzerland, 2021. [Google Scholar]
- Du, Y.; Tian, B.; Zhang, J.; Li, L.; Liu, H.; Luo, B. Sanding performance and failure progress of precision-shaped abrasive belt during sanding MDF. Eur. J. Wood Wood Prod. 2024, 82, 461–472. [Google Scholar] [CrossRef]
- ASTM International. Standard Test Methods for Evaluating Properties of Wood-Base Fiber and Particle Panel Materials D1037-12; ASTM International: West Conshohocken, PA, USA, 2018. [Google Scholar]
- Posit Team. RStudio: Integrated Development Environment for R; Posit Software, PBC: Boston, MA, USA, 2025. [Google Scholar]
- Pillai, K.C.S. Some new test criteria in multivariate analysis. Ann. Math. Stat. 1995, 117–121. [Google Scholar]
- Benthien, J.T.; Bähnisch, C.; Heldner, S.; Ohlmeyer, M. Effect of fiber size distribution on medium-density fiberboard properties caused by varied steaming time and temperature of defibration process. Wood Fiber Sci. 2014, 46, 175–185. [Google Scholar]
- Hagel, S.; Joy, J.; Cicala, G.; Saake, B. Recycling of waste MDF by steam refining: Evaluation of fiber and paper strength properties. Waste Biomass Valor. 2021, 12, 5701–5713. [Google Scholar] [CrossRef]
- Przybysz, P.; Dubowik, M.; Małachowska, E.; Kucner, M.; Gajadhur, M.; Przybysz, K. The effect of the refining intensity on the progress of internal fibrillation and shortening of cellulose fibers. BioResources 2020, 15, 1482–1499. [Google Scholar] [CrossRef]
- Vitrone, F.; Brinker, S.; Ramos, D.; Ferrando, F.; Salvadó, J.; Mai, C. Approaching self-bonded medium density fiberboards made by mixing steam exploded Arundo donax L. and wood fibers: A comparison with pMDI-bonded fiberboards on the primary properties of the boards. Materials 2023, 16, 4343. [Google Scholar] [CrossRef]
- Hunt, J.; Tajvidi, M. Vertical density profile and internal bond strength of wet-formed particleboard bonded with cellulose nanofibrils. Wood Fiber Sci. 2017, 49, 413–423. [Google Scholar]
- Nayeri, M.D.; Tahir, P.M.; Jawaid, M.; Harun, J.; Abdullah, L.C.; Bakar, E.S.; Keshani, S.; Namvar, F. Effect of resin content and pressure on the performance properties of rubberwood-kenaf composite board panel. Fibers Polym. 2014, 15, 1263–1269. [Google Scholar] [CrossRef]
- Aisyah, H.A.; Paridah, M.T.; Sahri, M.H.; Astimar, A.A.; Anwar, U.M.K. Influence of thermo mechanical pulping production parameters on properties of medium density fibreboard made from kenaf bast. J. Appl. Sci. 2012, 12, 575–580. [Google Scholar] [CrossRef]
- Liu, H.; Dong, J.; Jing, H.; Guo, X.; Qiao, L. Characterization of the parameters for the refining intensity in terms of performance. J. Korea Tech. Assoc. Pulp Pap. Ind. 2019, 51, 26–39. [Google Scholar] [CrossRef]
- de Moura, L.F.; Hernández, R.E. Effects of abrasive mineral, grit size and feed speed on the quality of sanded surfaces of sugar maple wood. Wood Sci. Technol. 2006, 40, 517–530. [Google Scholar] [CrossRef]
- Aisyah, H.A.; Paridah, M.T.; Sahri, M.H.; Anwar, U.M.K.; Astimar, A.A. Properties of medium density fibreboard (MDF) from kenaf (Hibiscus cannabinus L.) core as function of refining conditions. Compos. Part B Eng. 2013, 44, 592–596. [Google Scholar] [CrossRef]
- Thoemen, H. Wood-Based Panels—An Introduction for Specialists; Brunel University Press: London, UK, 2010. [Google Scholar]
Figure 1.
Schematic diagram of the fiber refining unit utilized in this study, featuring its three main components: chip bin, pre-heater (or digester), and refiner (adapted from [34]).
Figure 1.
Schematic diagram of the fiber refining unit utilized in this study, featuring its three main components: chip bin, pre-heater (or digester), and refiner (adapted from [34]).
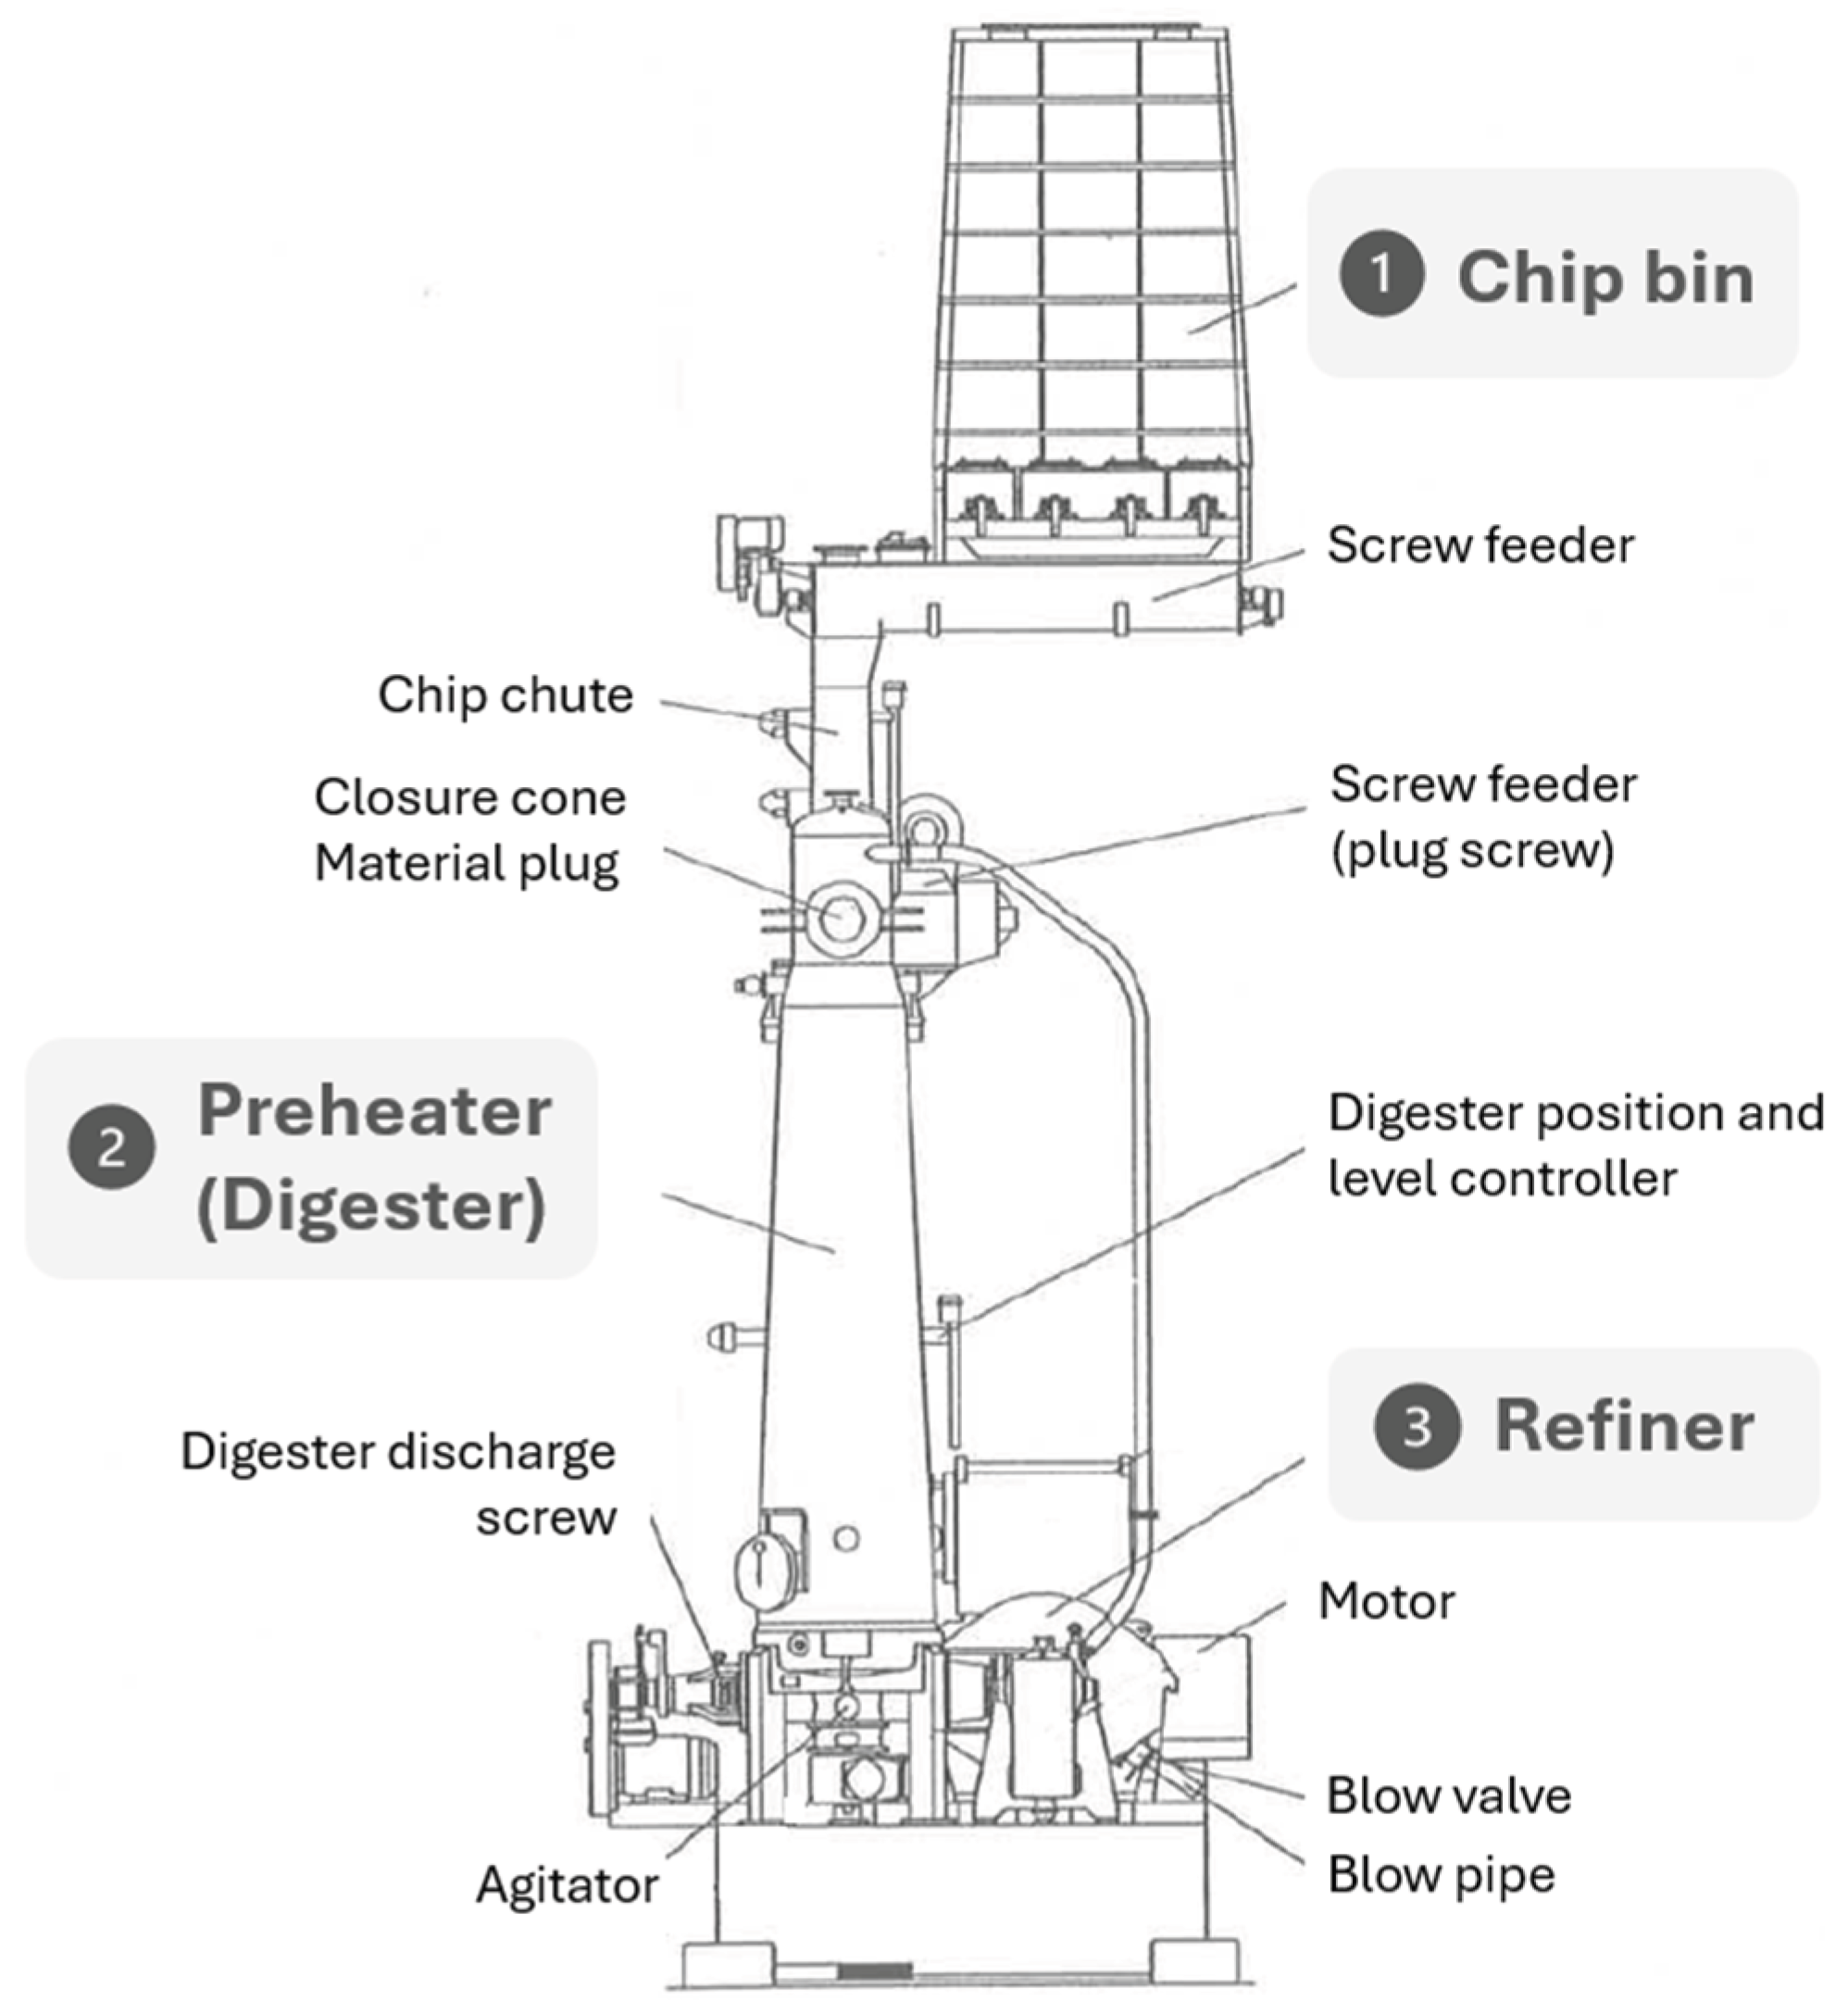
Figure 2.
Panel-cutting layout for sample preparation for vertical density profile measurements, surface roughness, and mechanical property testing of embossed MDF door panels.
Figure 2.
Panel-cutting layout for sample preparation for vertical density profile measurements, surface roughness, and mechanical property testing of embossed MDF door panels.
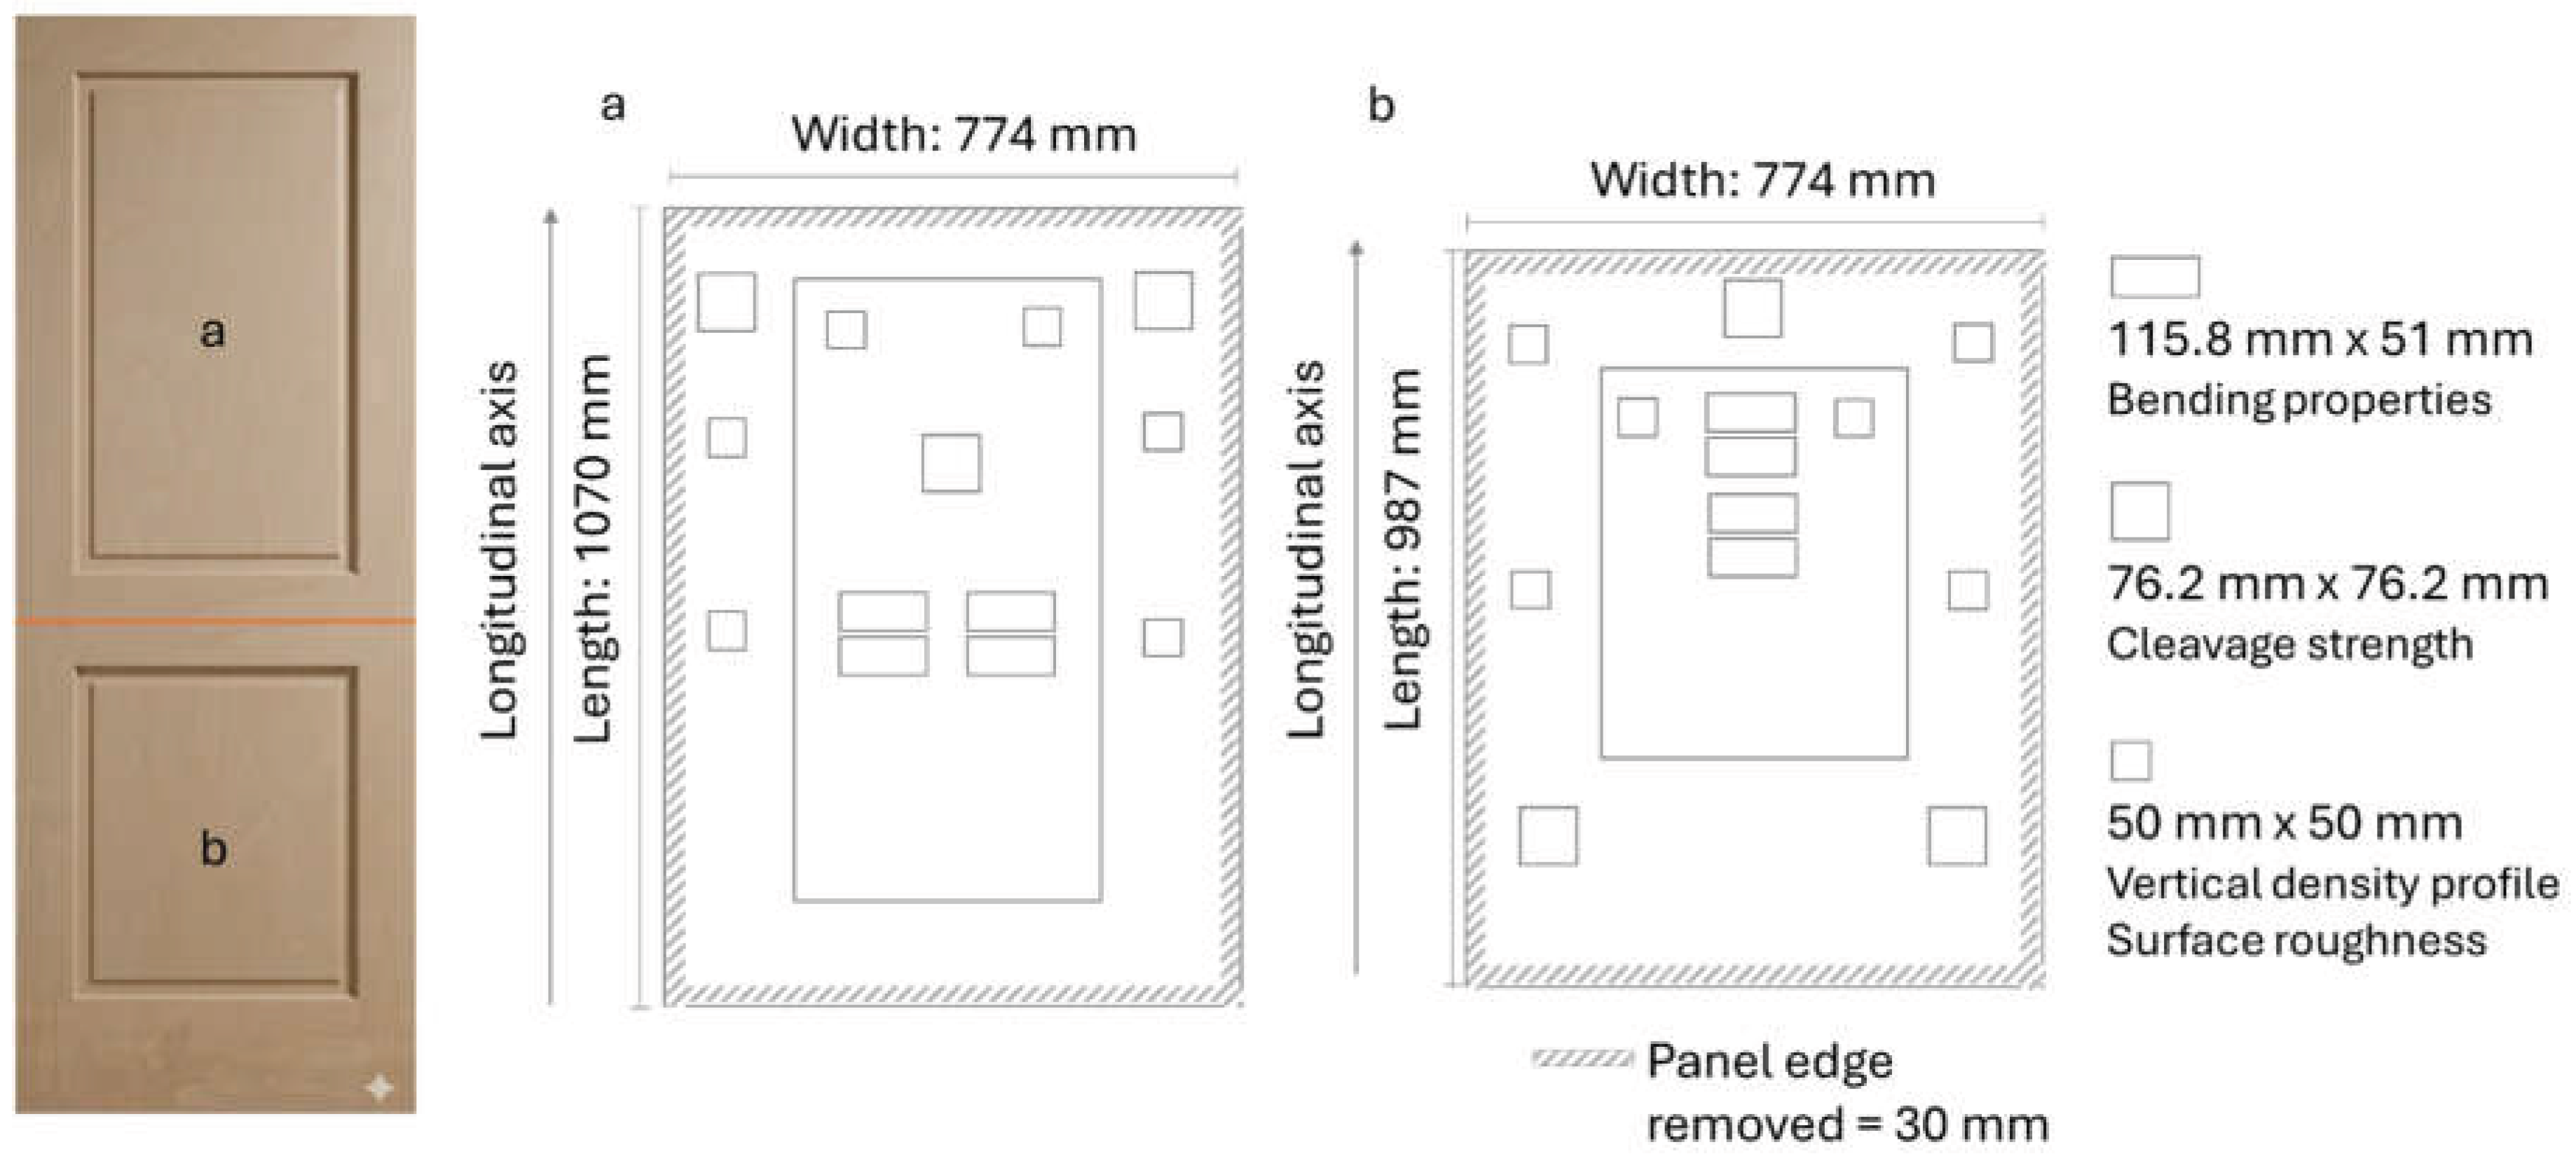
Figure 3.
Cleavage strength test. (a) Test setup using a custom steel fixture mounted on a universal testing machine, designed to apply a tension perpendicular to the bonded interface. (b) Close-up of the specimen positioned in the cleavage device, where the MDF sample was clamped between two steel jaws to maintain axial loading during the test. (c) Assembly of MDF door samples and MDF substrate after adhesive application. (d) Press used to bond the assembled samples.
Figure 3.
Cleavage strength test. (a) Test setup using a custom steel fixture mounted on a universal testing machine, designed to apply a tension perpendicular to the bonded interface. (b) Close-up of the specimen positioned in the cleavage device, where the MDF sample was clamped between two steel jaws to maintain axial loading during the test. (c) Assembly of MDF door samples and MDF substrate after adhesive application. (d) Press used to bond the assembled samples.
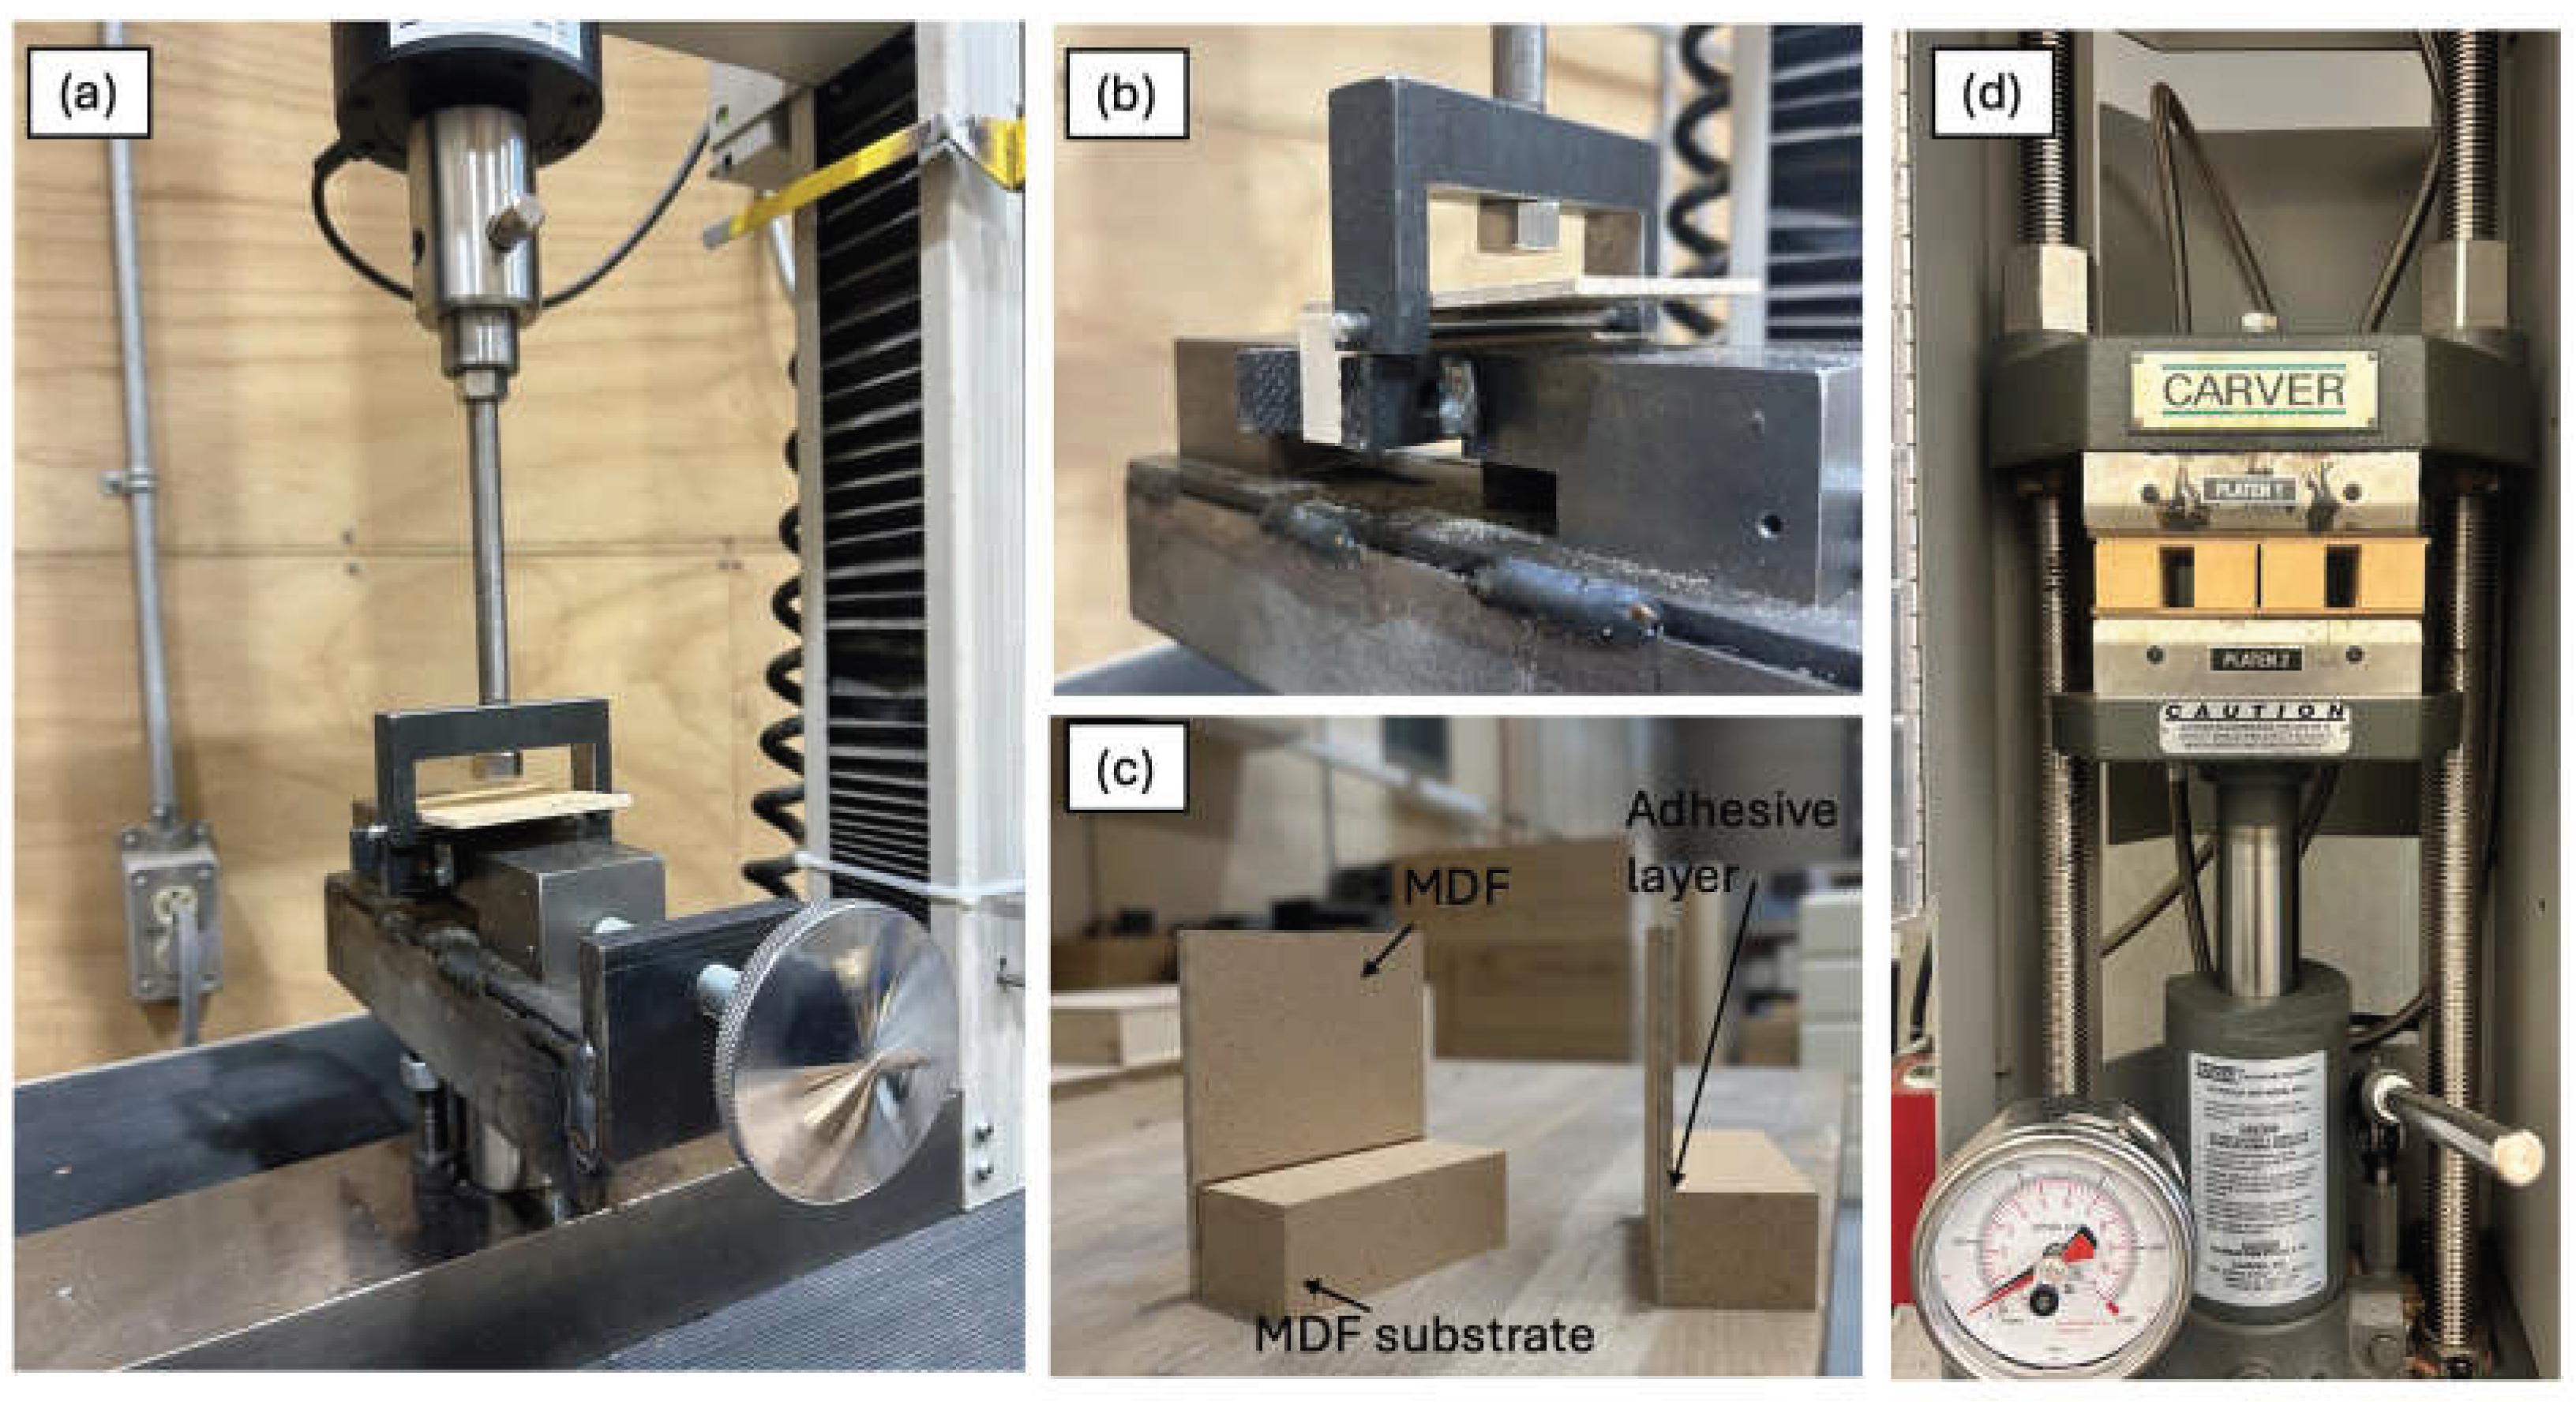
Figure 4.
Granulometry analysis of fibers refined under various conditions of digester steam pressure (SP), refiner specific energy (SE), and refiner differential pressure (DP).
Figure 4.
Granulometry analysis of fibers refined under various conditions of digester steam pressure (SP), refiner specific energy (SE), and refiner differential pressure (DP).
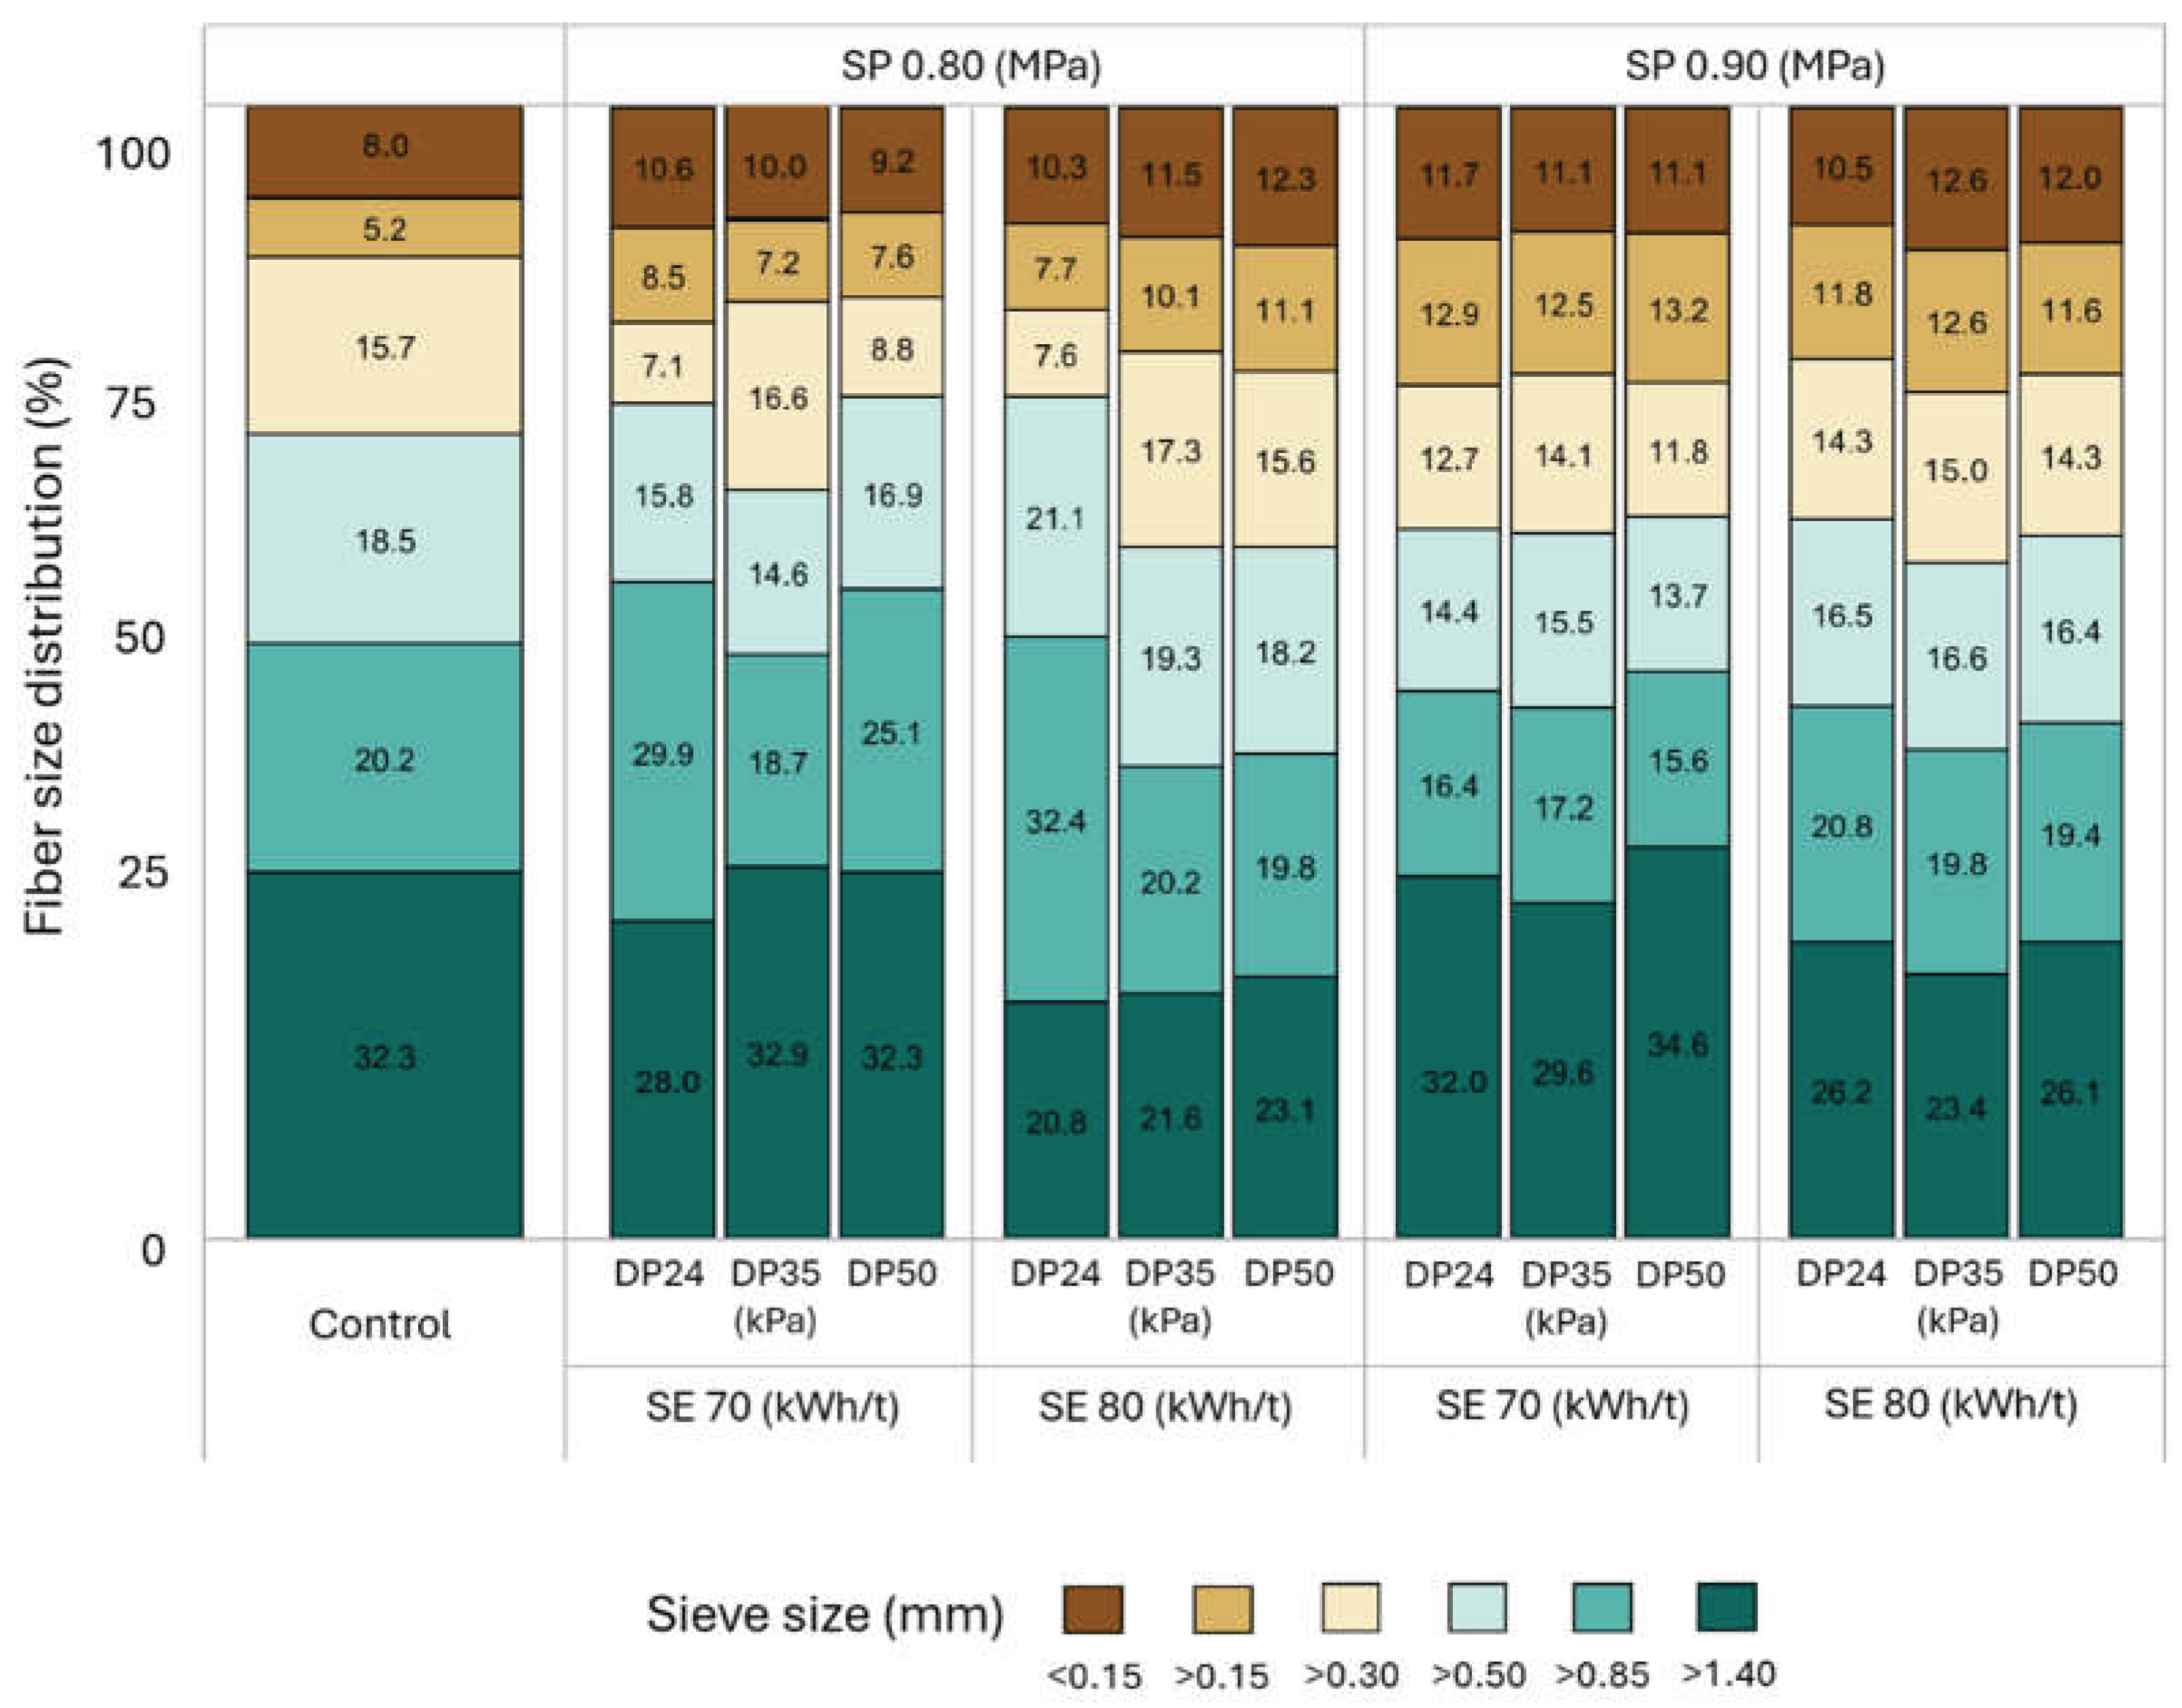
Figure 5.
Representative vertical density profiles of MDF door panels produced under various fiber refining conditions. SP: digester steam pressure; SE: refiner specific energy; DP: refiner differential pressure.
Figure 5.
Representative vertical density profiles of MDF door panels produced under various fiber refining conditions. SP: digester steam pressure; SE: refiner specific energy; DP: refiner differential pressure.
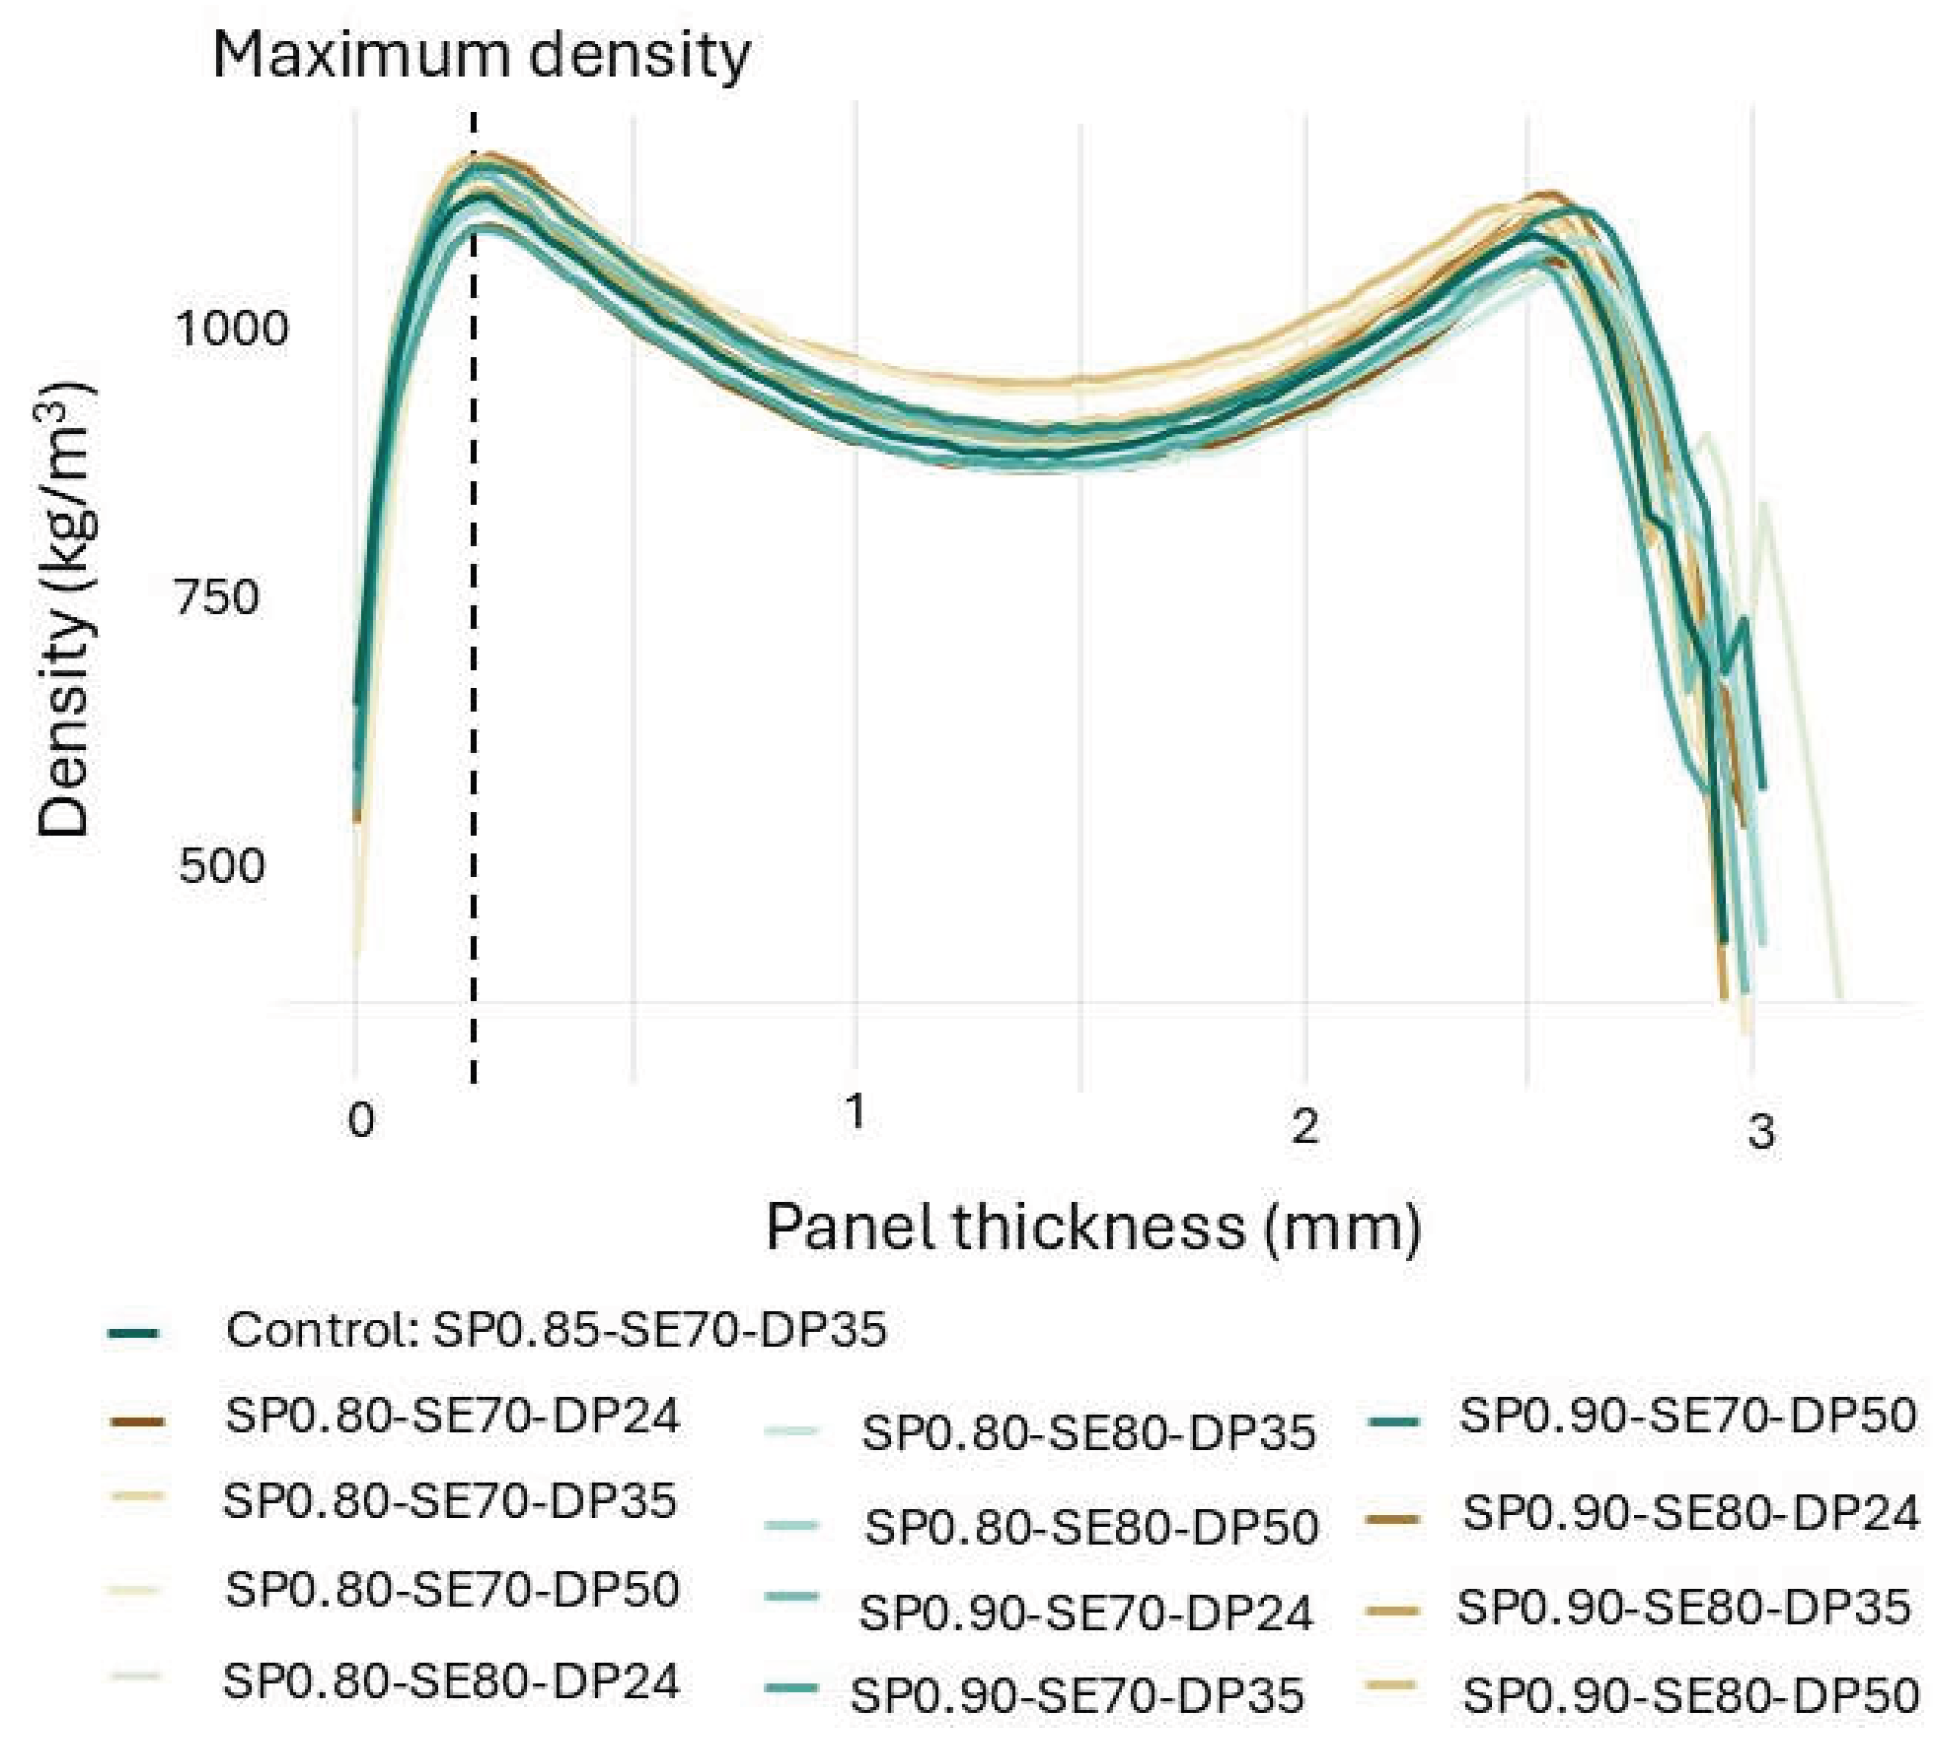
Figure 6.
Mean comparison of average and maximum surface densities for MDF door panels across all refining treatments and the control. Means sharing the same letter are not statistically different according to Tukey’s test. SP: digester steam pressure; SE: refiner specific energy; DP: refiner differential pressure.
Figure 6.
Mean comparison of average and maximum surface densities for MDF door panels across all refining treatments and the control. Means sharing the same letter are not statistically different according to Tukey’s test. SP: digester steam pressure; SE: refiner specific energy; DP: refiner differential pressure.
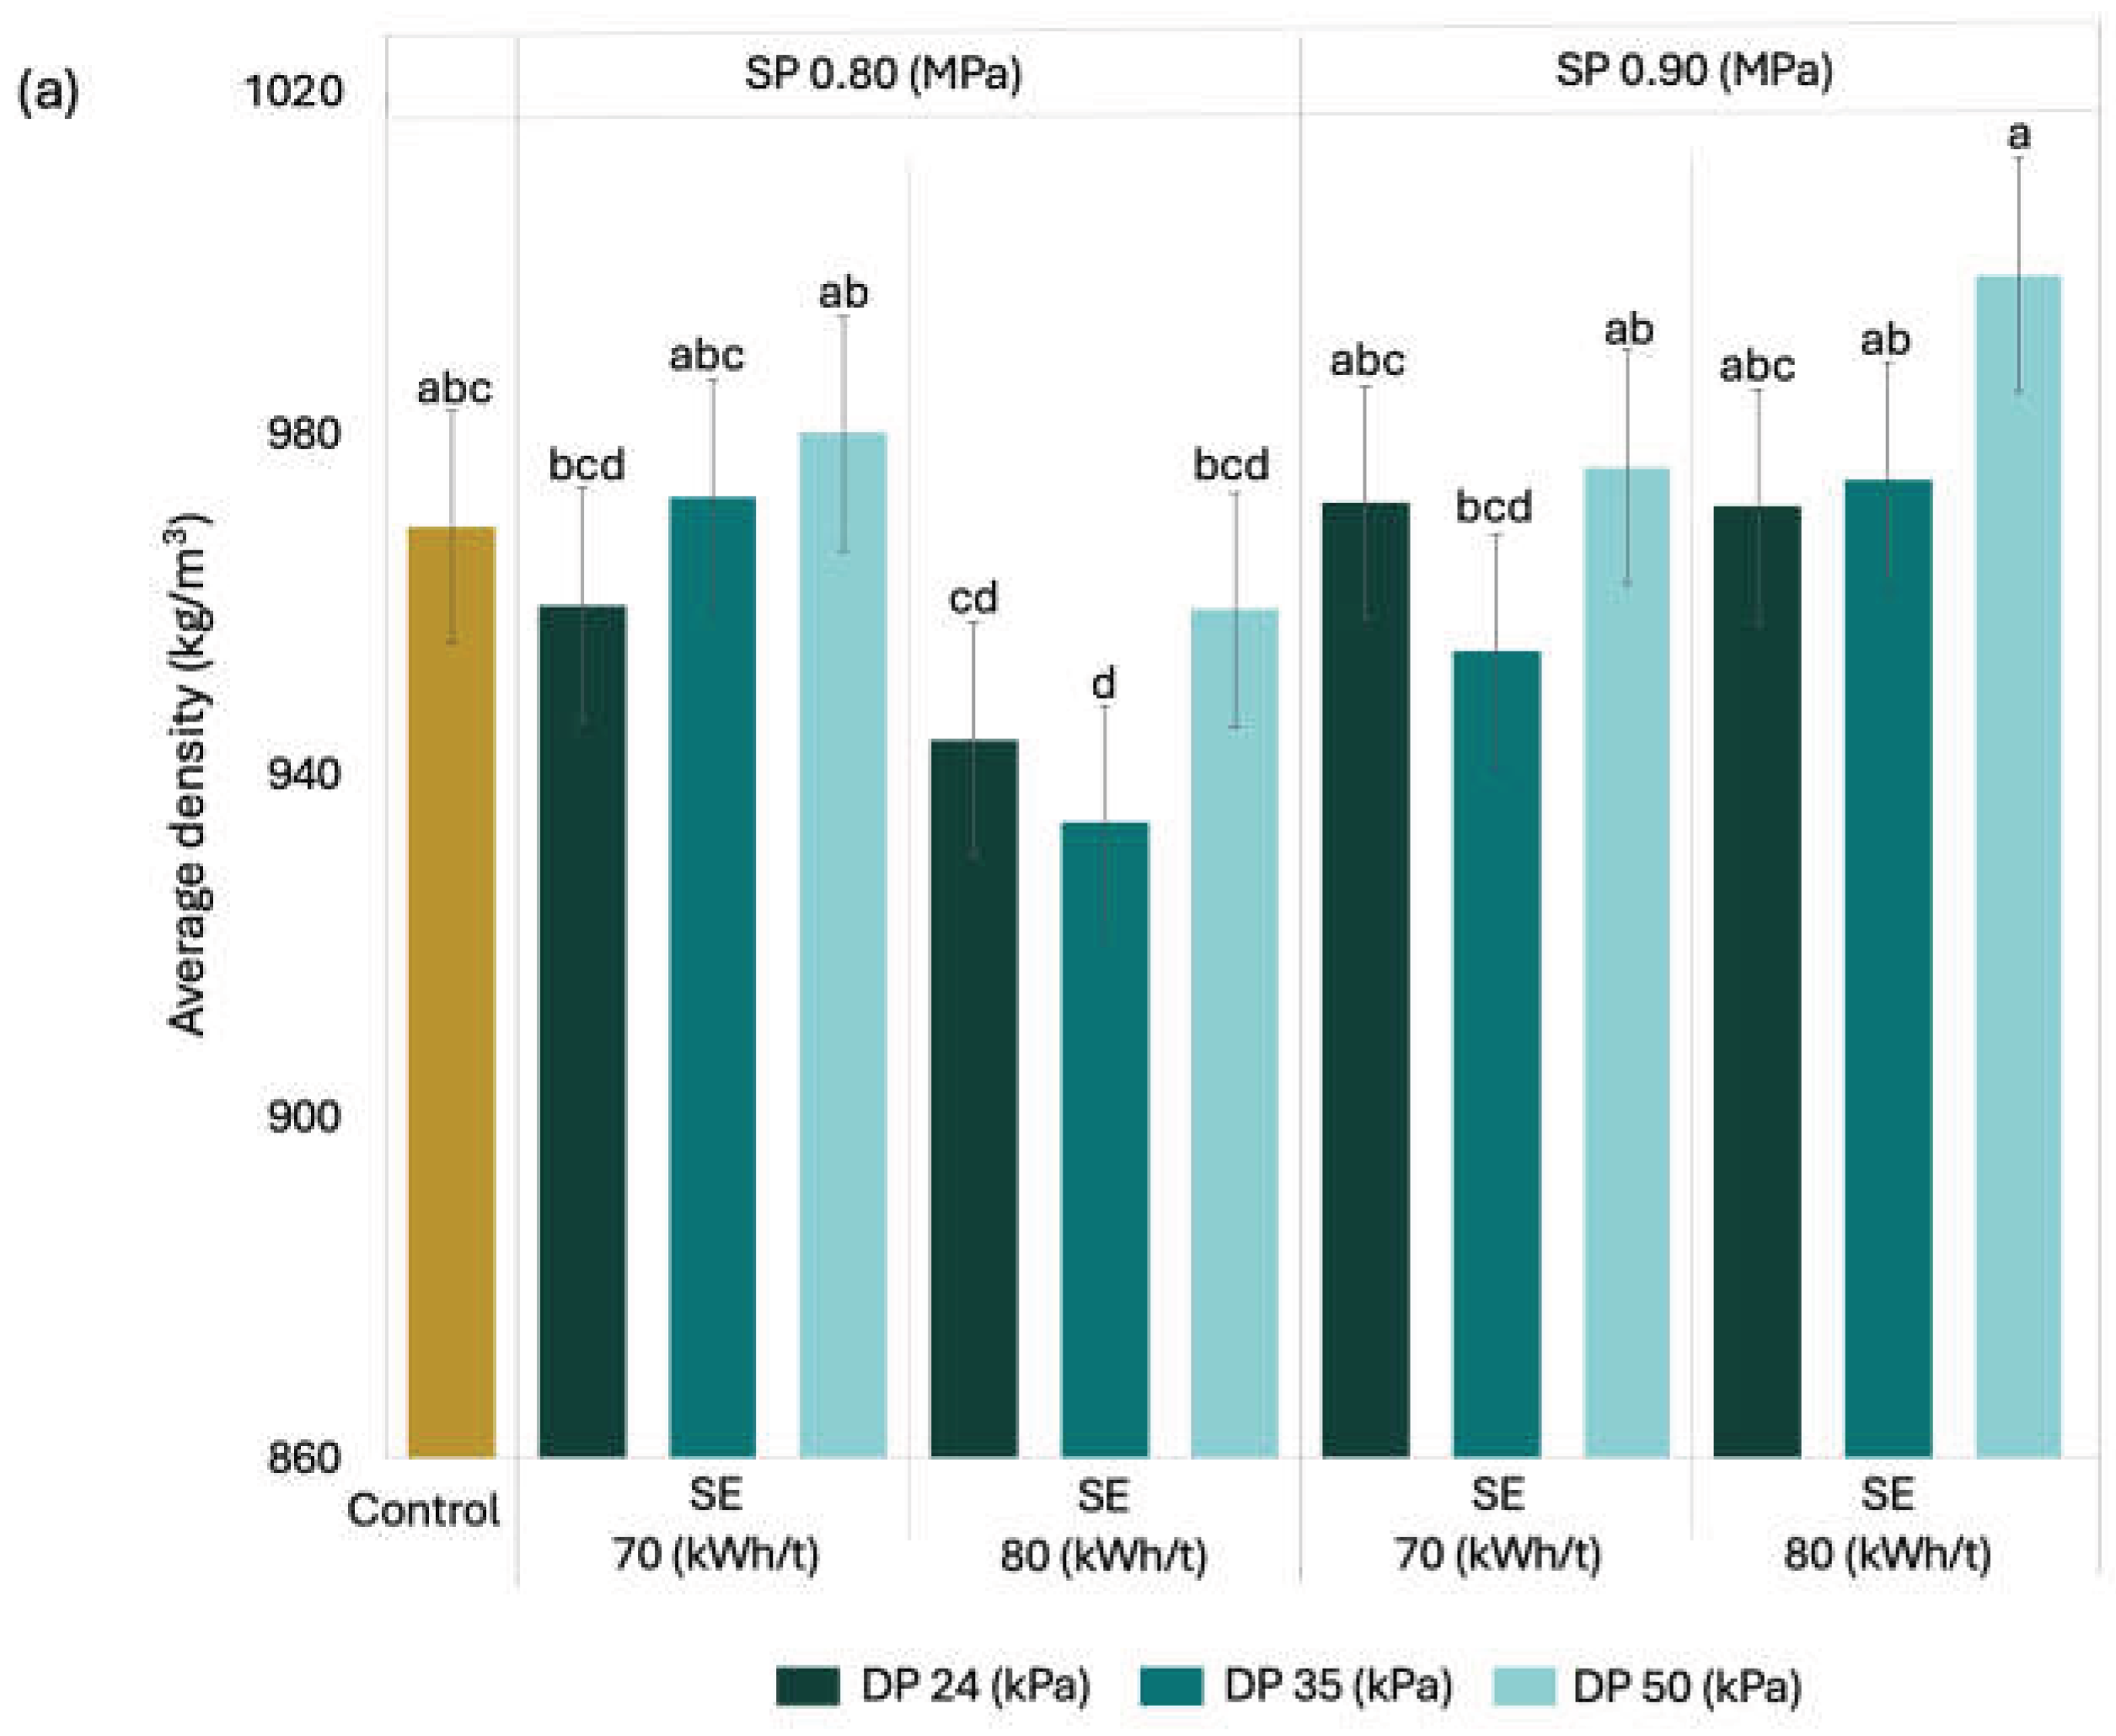
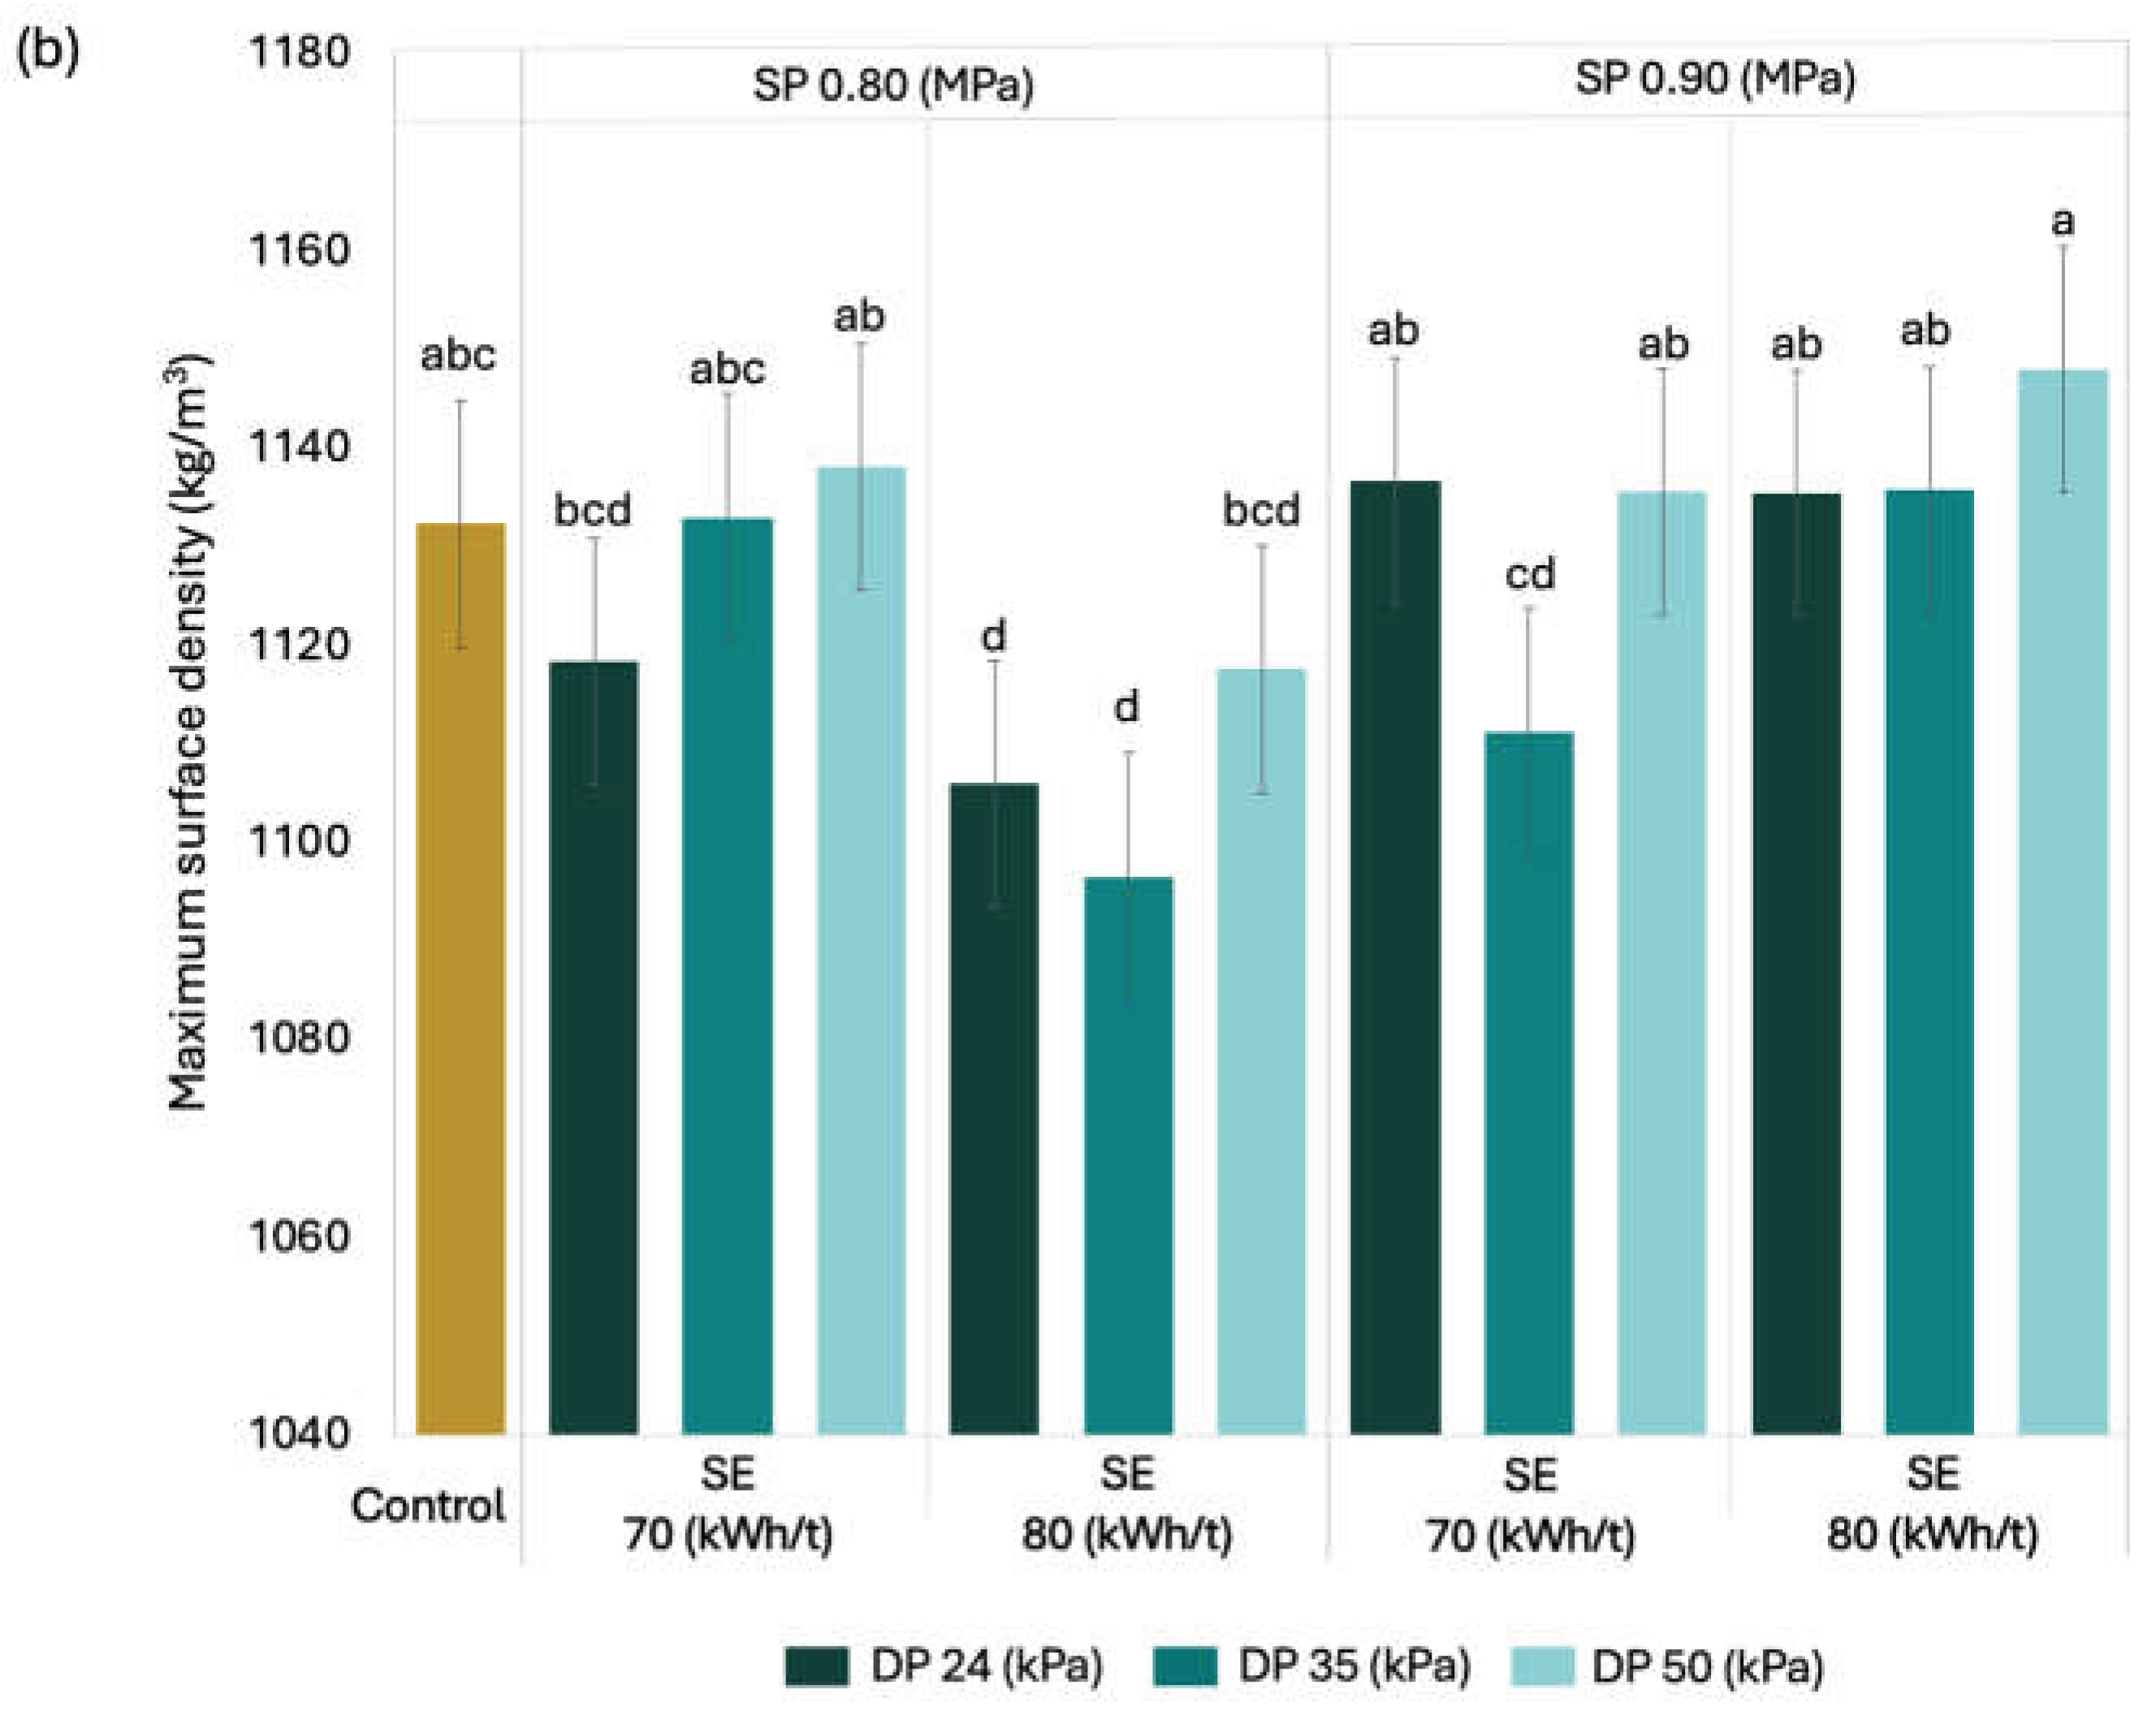
Figure 7.
Typical surface roughness image of MDF door panels. (a) Two-dimensional topographic map of a 1000 μm x 1000 μm area. (b) Three-dimensional reconstruction of the panel’s surface.
Figure 7.
Typical surface roughness image of MDF door panels. (a) Two-dimensional topographic map of a 1000 μm x 1000 μm area. (b) Three-dimensional reconstruction of the panel’s surface.
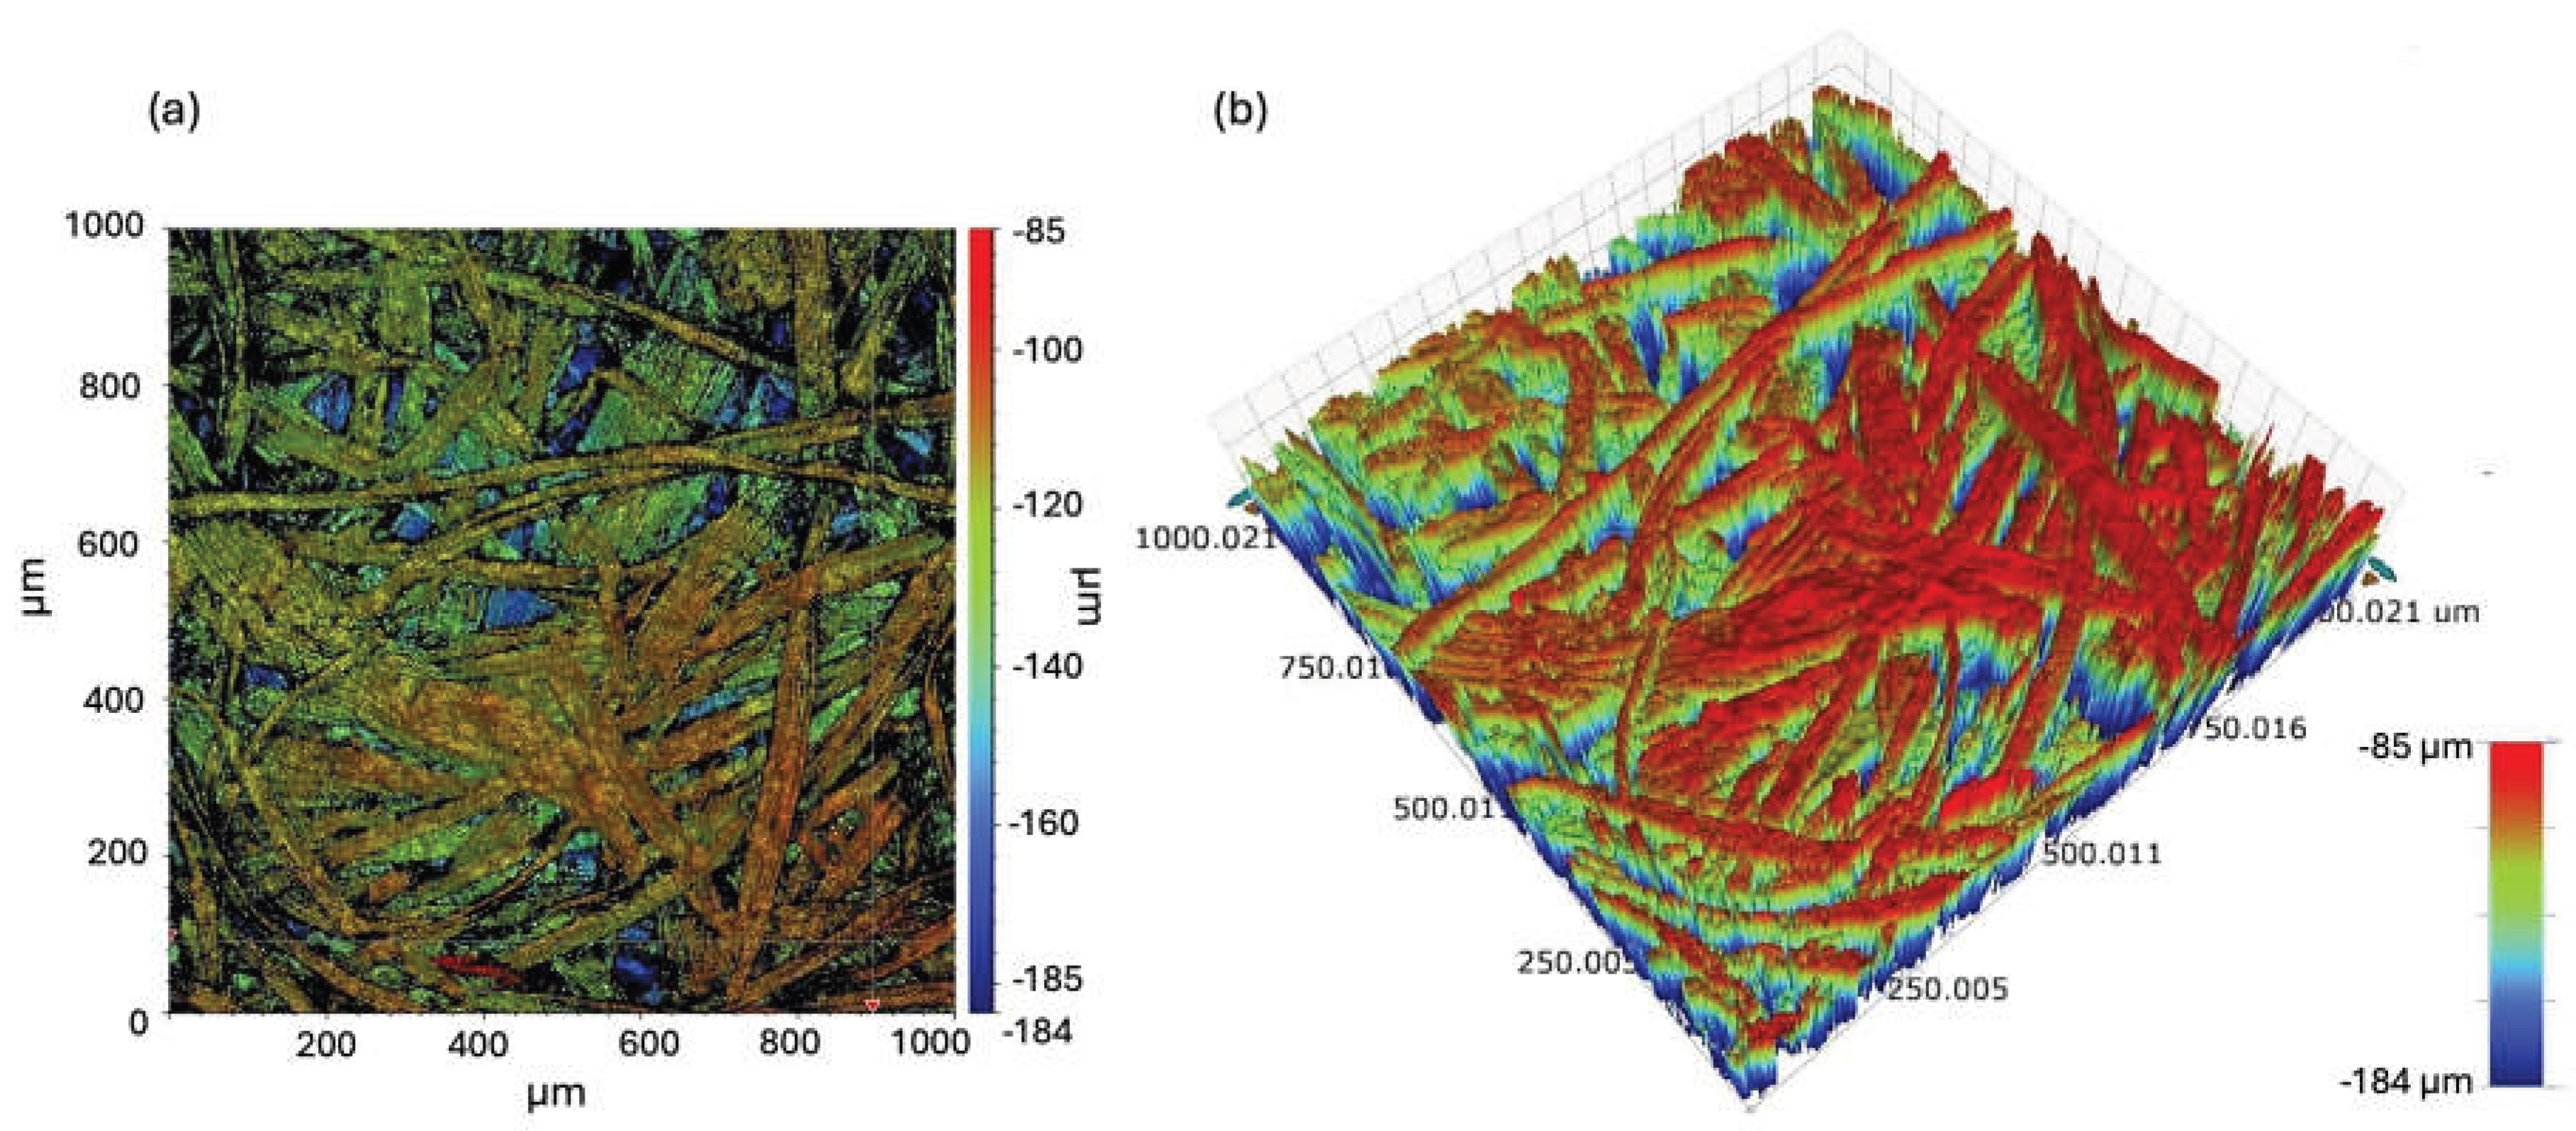
Figure 8.
Mean comparisons of bending MOR and MOE for MDF door panels across refining treatments and the control. Means sharing the same letter are not statistically different according to Tukey’s test. SP: digester steam pressure; SE: refiner specific energy; DP: refiner differential pressure.
Figure 8.
Mean comparisons of bending MOR and MOE for MDF door panels across refining treatments and the control. Means sharing the same letter are not statistically different according to Tukey’s test. SP: digester steam pressure; SE: refiner specific energy; DP: refiner differential pressure.
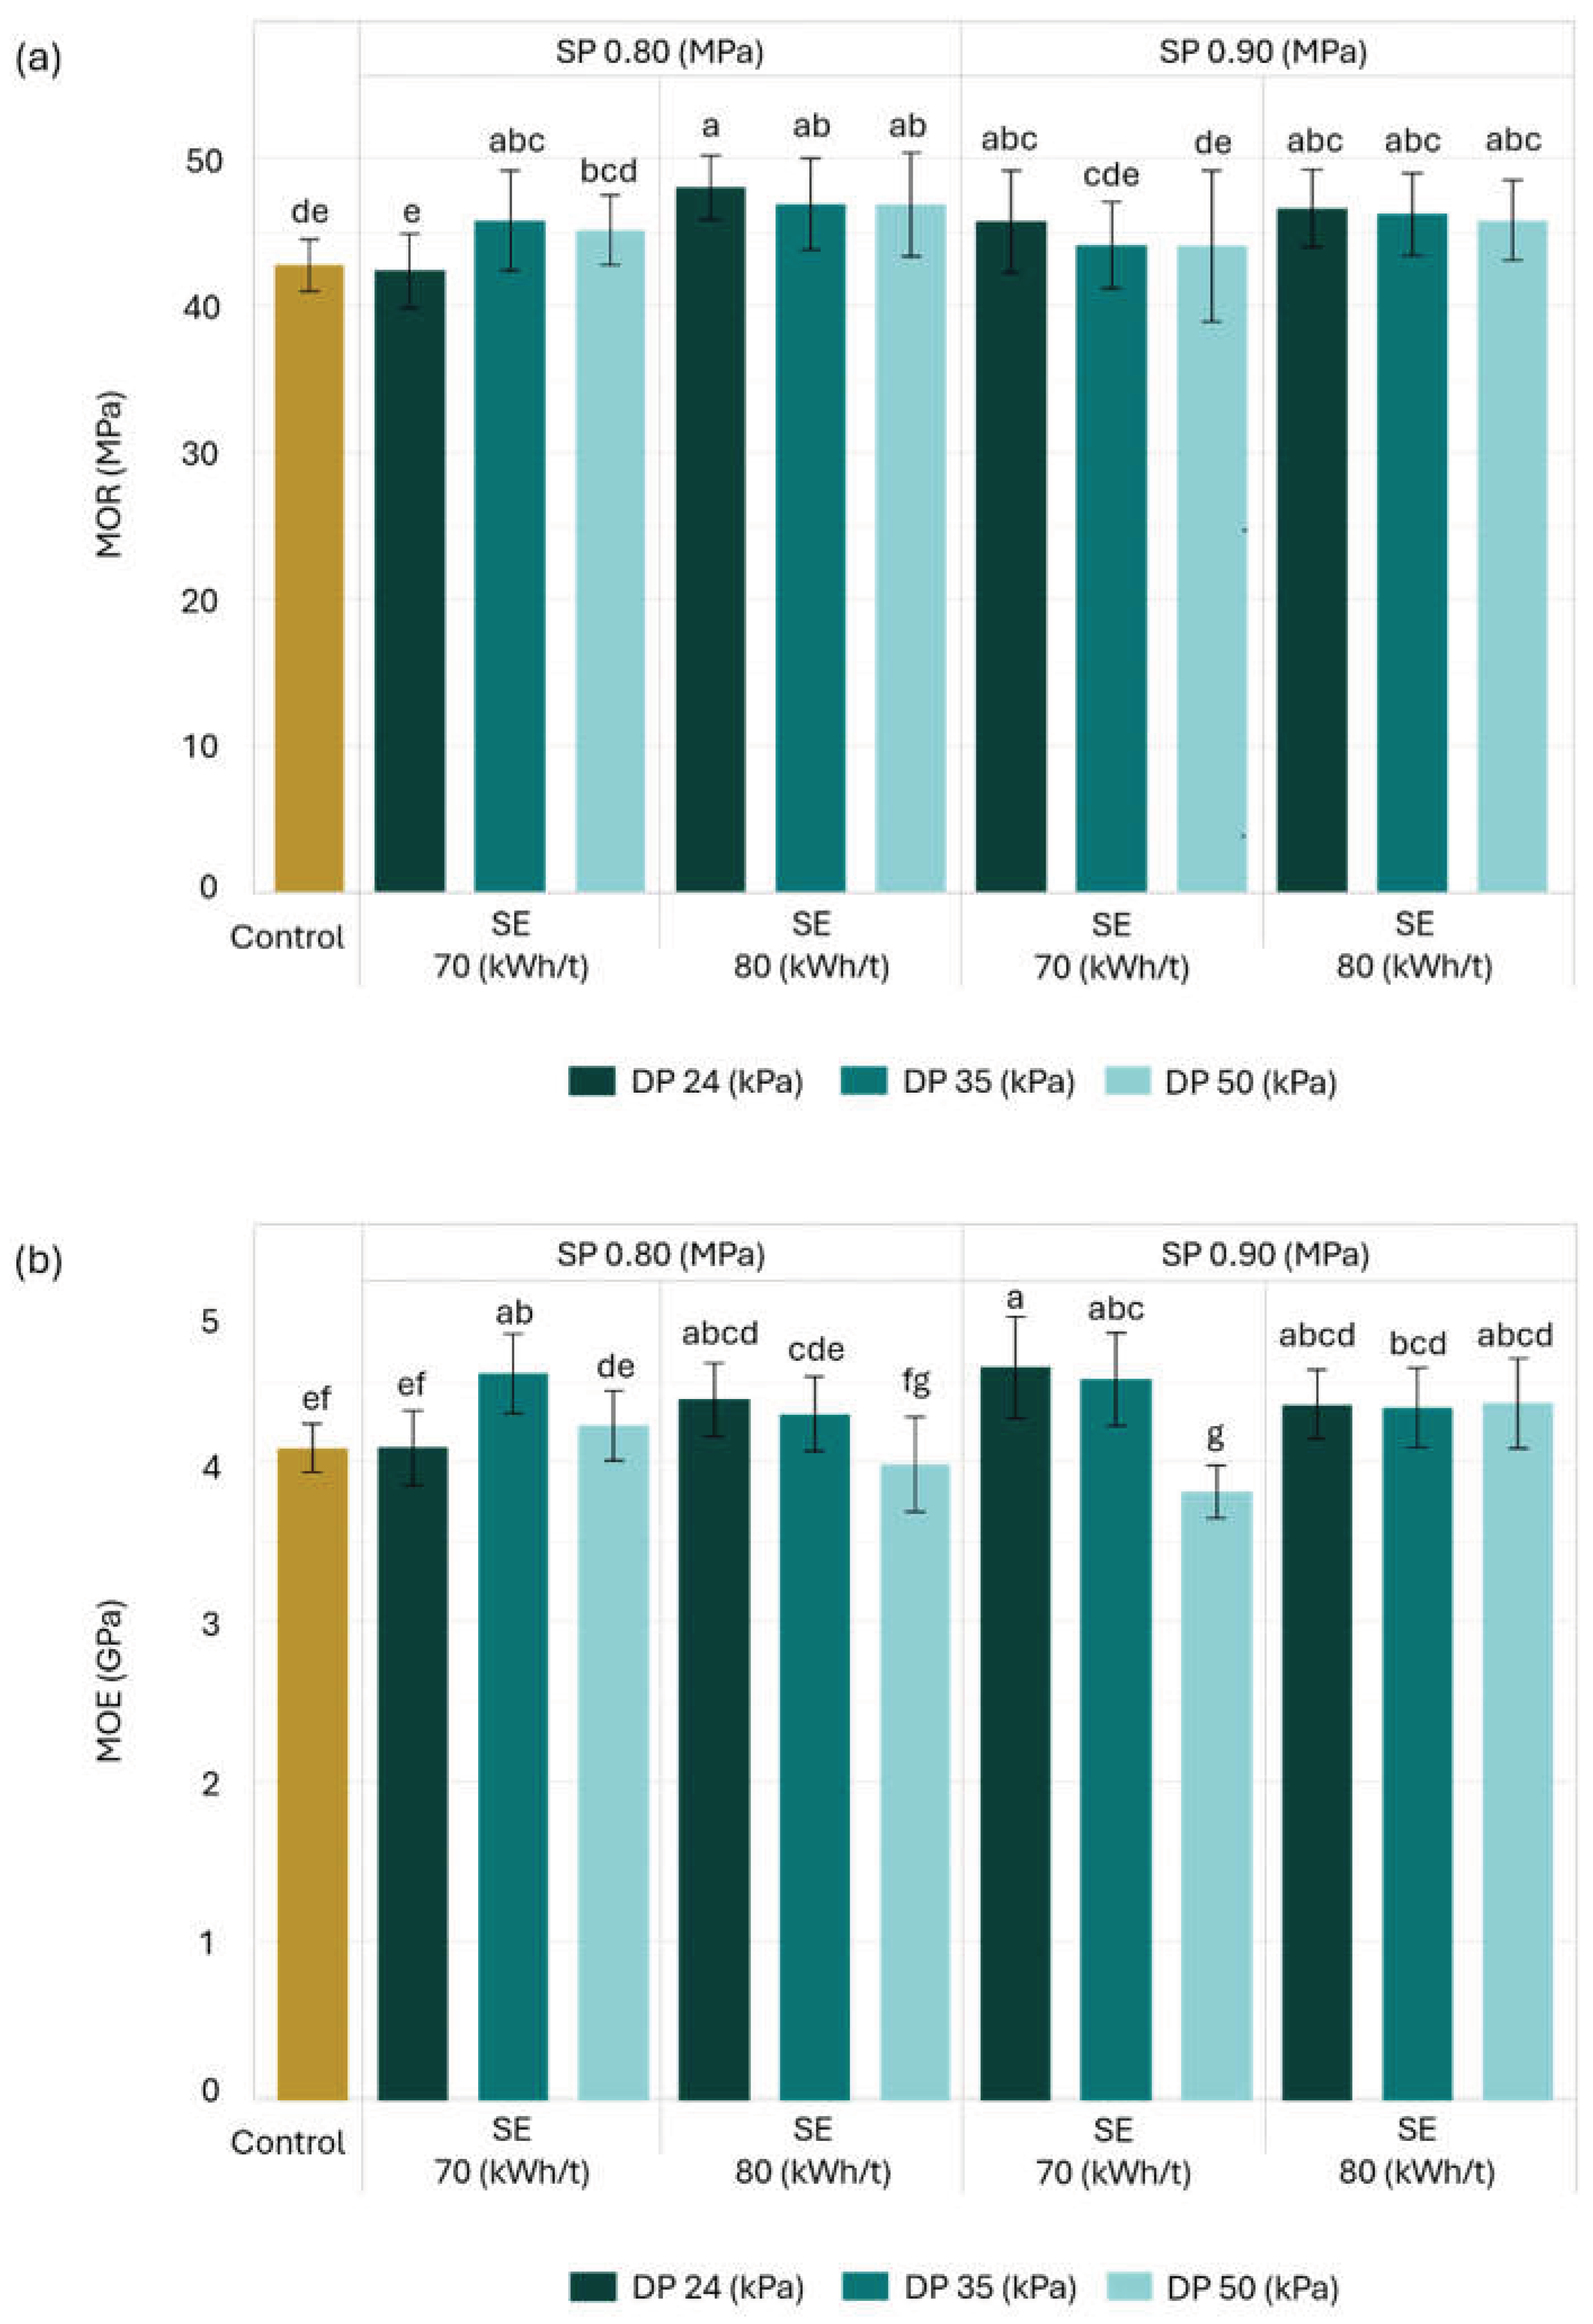
Figure 9.
Mean comparisons of cleavage strength for MDF door panels across all refining treatments and the control. Means sharing the same letter are not statistically different according to Tukey’s test. SP: digester steam pressure; SE: refiner specific energy; DP: refiner differential pressure.
Figure 9.
Mean comparisons of cleavage strength for MDF door panels across all refining treatments and the control. Means sharing the same letter are not statistically different according to Tukey’s test. SP: digester steam pressure; SE: refiner specific energy; DP: refiner differential pressure.
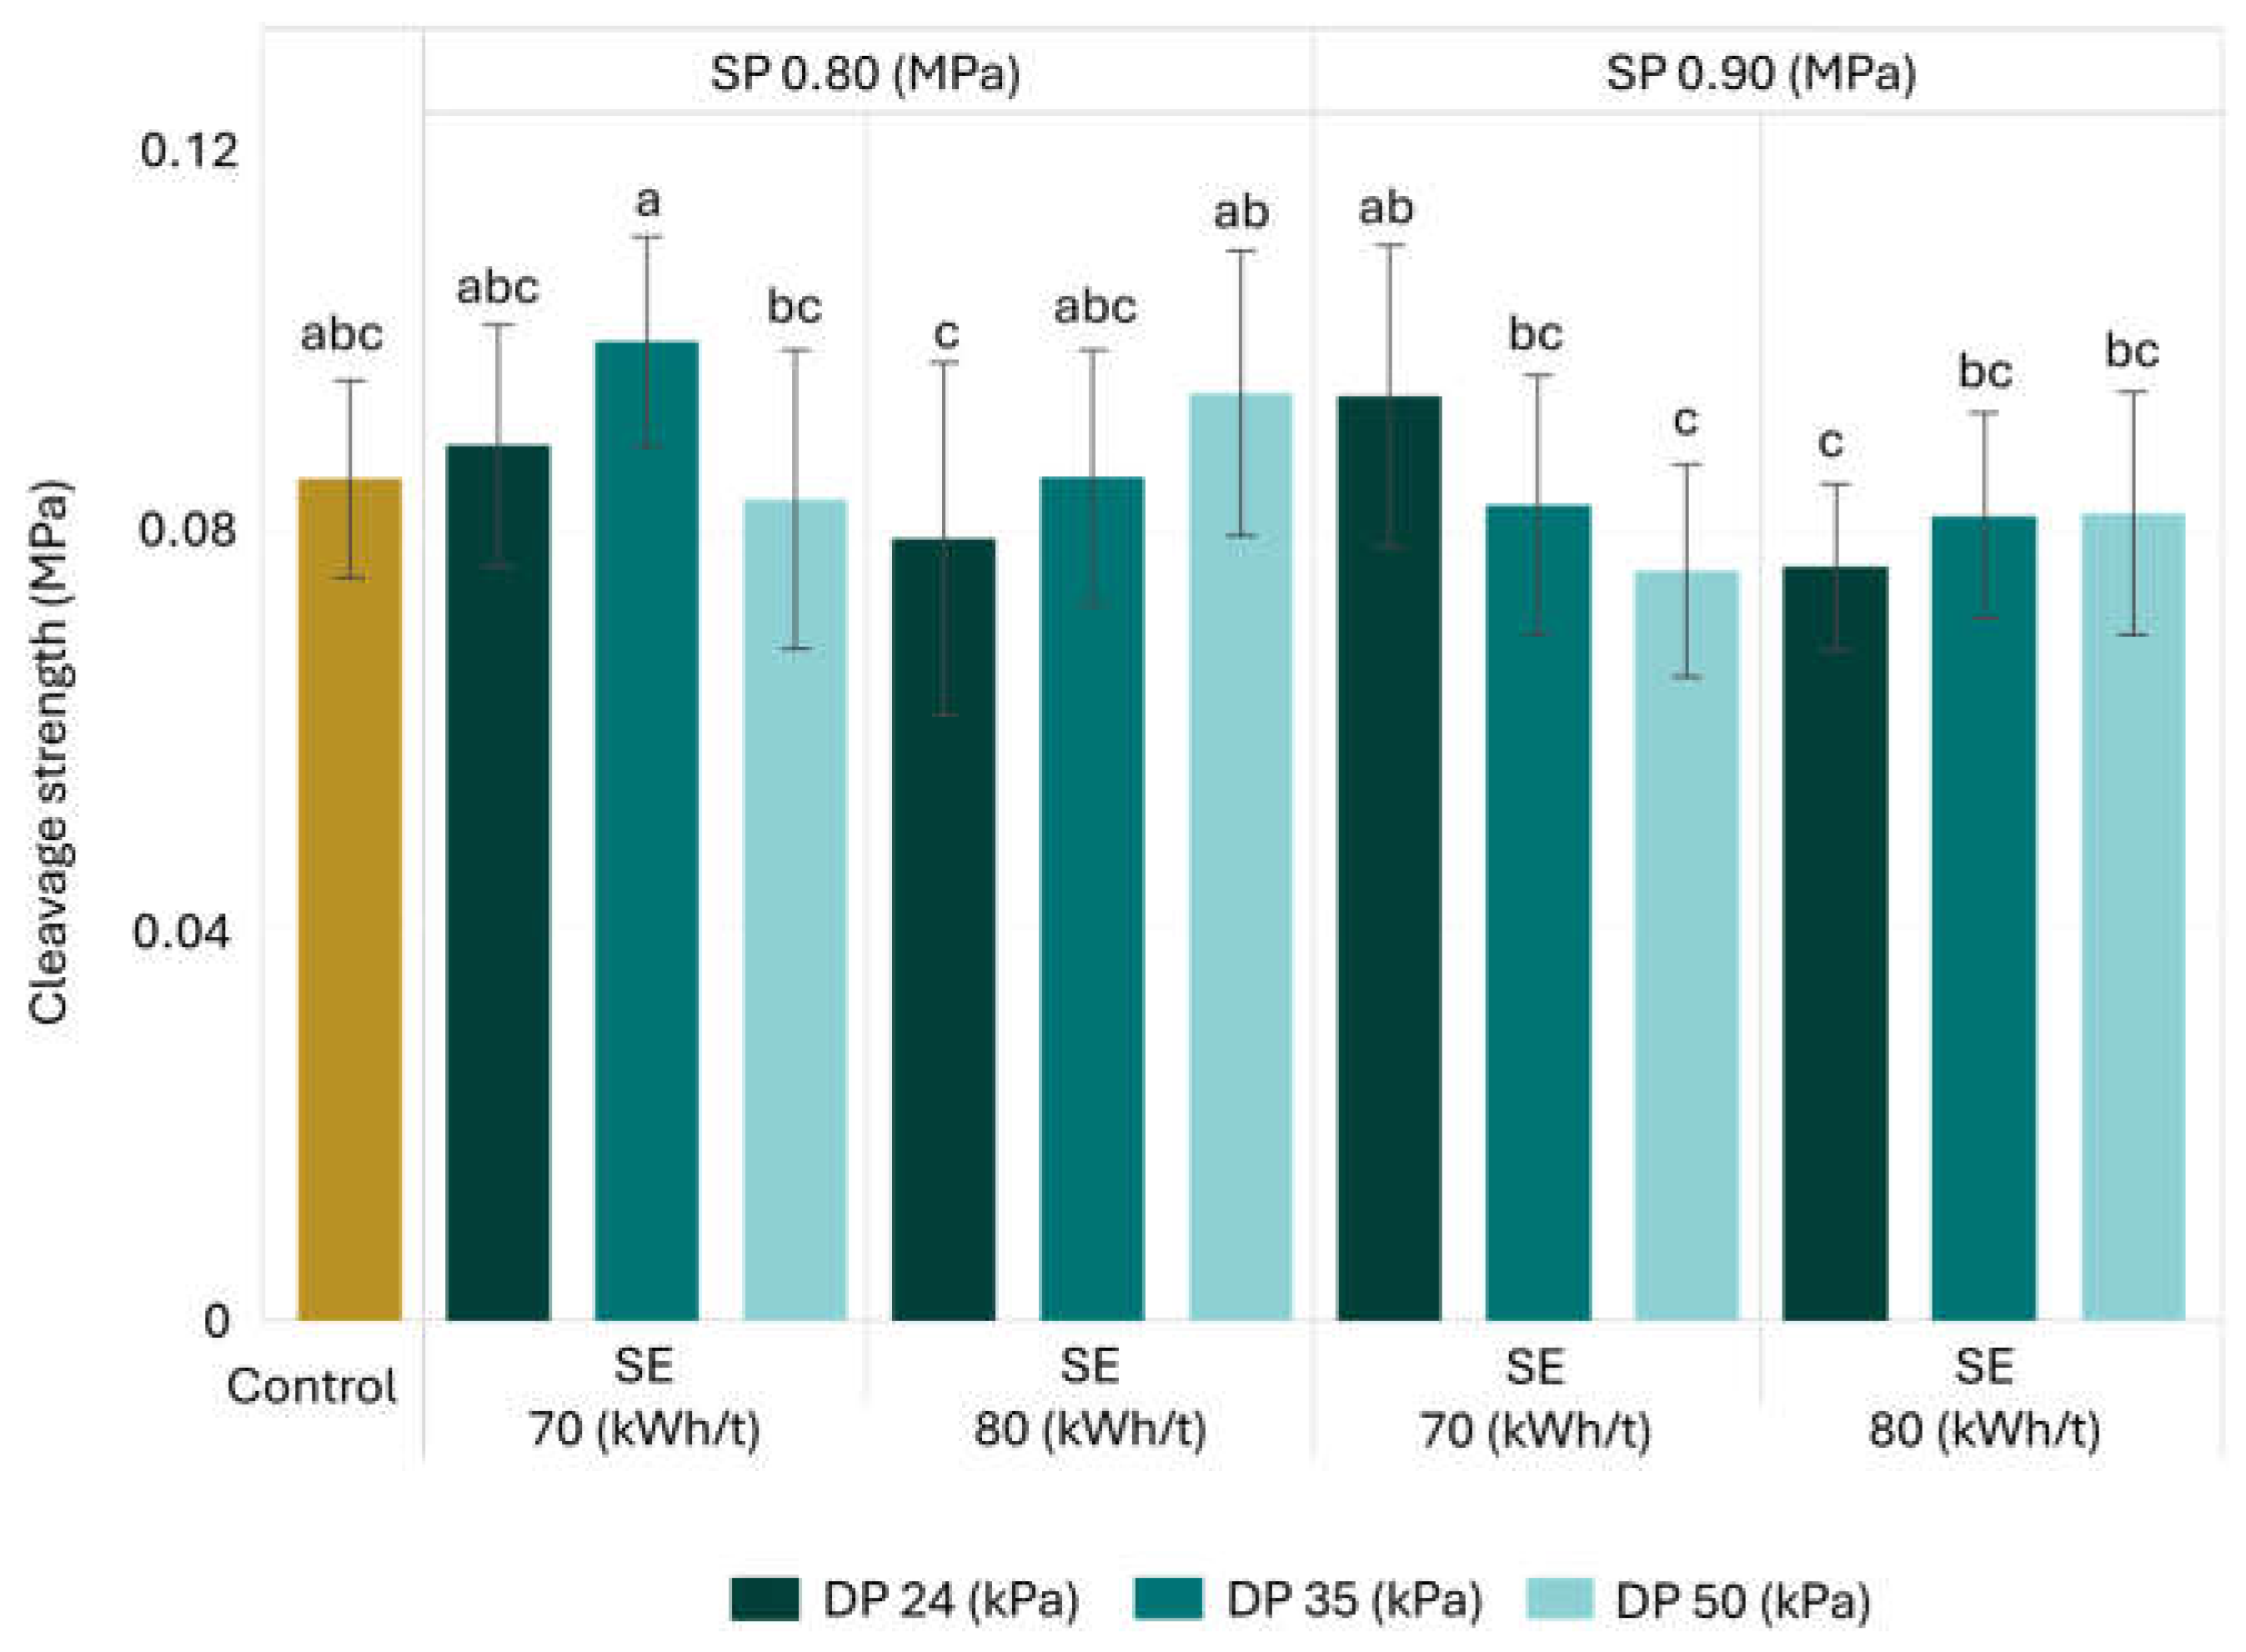
Figure 10.
Comparative matrix showing the effects of refining treatments relative to the control across all response variables. SP: digester steam pressure; SE: refiner specific energy; DP: refiner differential pressure. Sa: arithmetic mean height; Sp: maximum peak height; Sq: root mean square height; Sz: total height; Sv: maximum pit height.
Figure 10.
Comparative matrix showing the effects of refining treatments relative to the control across all response variables. SP: digester steam pressure; SE: refiner specific energy; DP: refiner differential pressure. Sa: arithmetic mean height; Sp: maximum peak height; Sq: root mean square height; Sz: total height; Sv: maximum pit height.
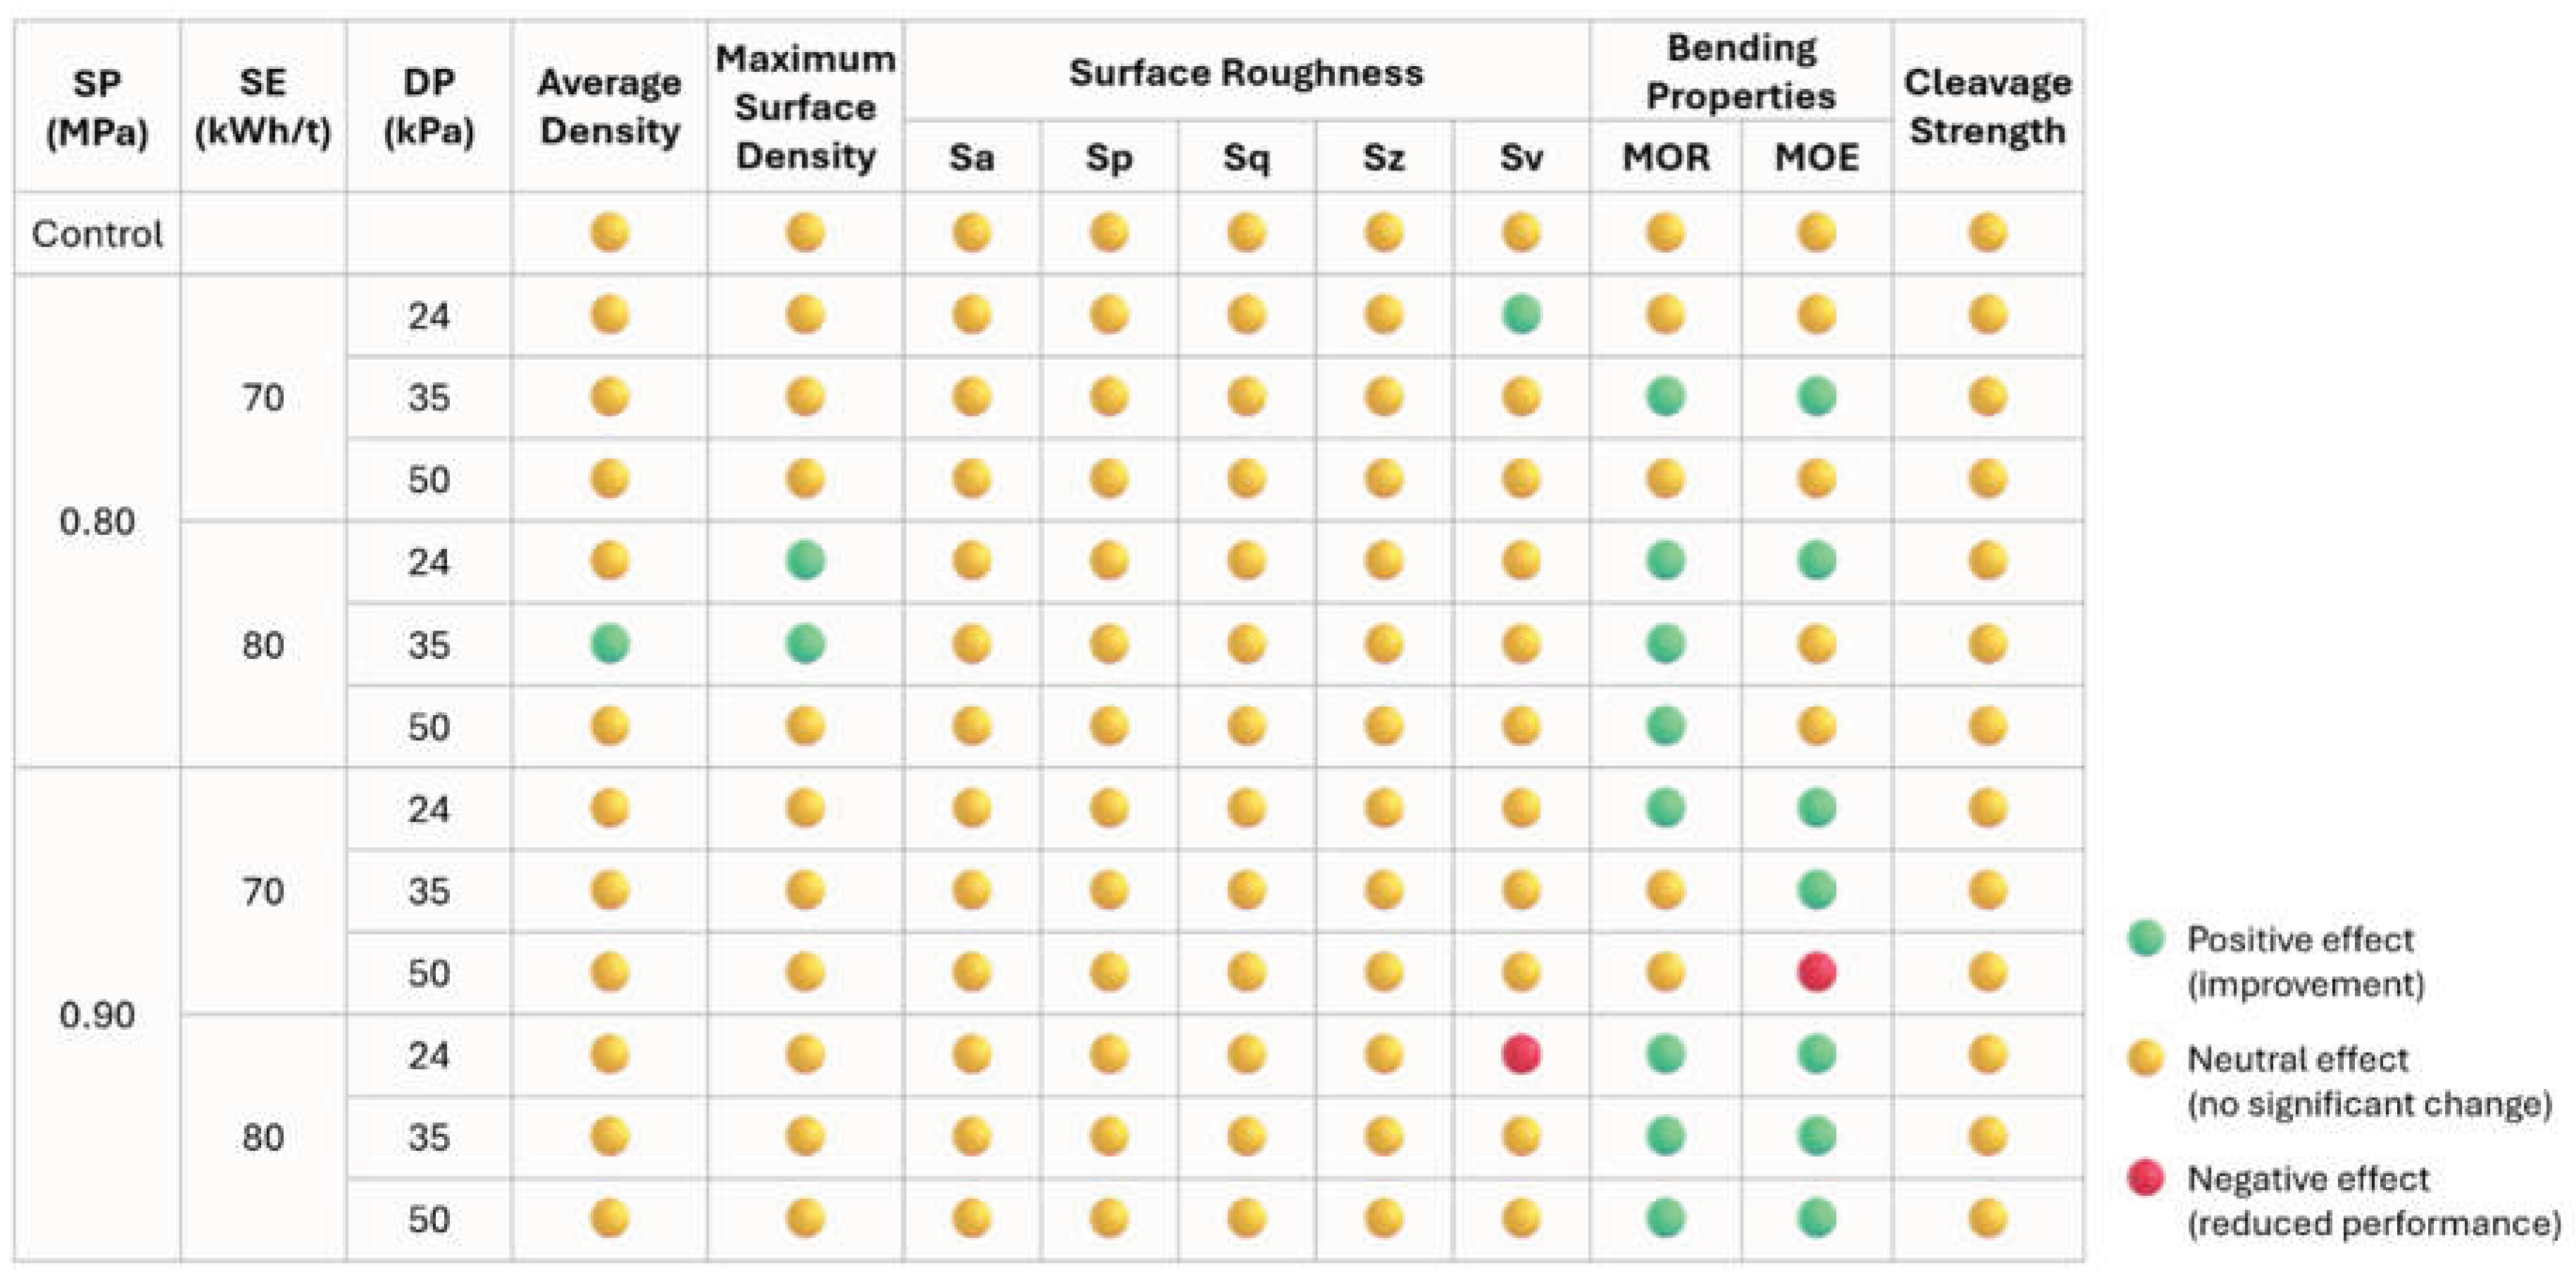

Table 1.
Experimental design for refining parameter levels used in this study.
|
Digester Steam Pressure (SP) (MPa) |
Refiner Specific Energy (SE) (kWh/t) |
Refiner Differential Pressure (DP) (kPa) | Treatment Code |
| 0.85 | 70 | 35 | Control: SP0.85-SE70-DP35 |
| 0.80 | 70 | 24 | SP0.80-SE70-DF24 |
| 35 | SP0.80-SE70-DP35 | ||
| 50 | SP0.80-SE70-DF50 | ||
| 80 | 24 | SP0.80-SE80-DF24 | |
| 35 | SP0.80-SE80-DP35 | ||
| 50 | SP0.80-SE80-DF50 | ||
| 0.90 | 70 | 24 | SP0.90-SE70-DF24 |
| 35 | SP0.90-SE70-DP35 | ||
| 50 | SP0.90-SE70-DF50 | ||
| 80 | 24 | SP0.90-SE80-DF24 | |
| 35 | SP0.90-SE80-DP35 | ||
| 50 | SP0.90-SE80-DF50 |
Table 2.
Pillai traces and F-values from the MANOVA assessing the effects of refining parameters on fiber size distribution.
Table 2.
Pillai traces and F-values from the MANOVA assessing the effects of refining parameters on fiber size distribution.
| Parameter | Pillai trace | F-value | p-value | Effect size |
| Digester steam pressure (SP) | 0.886 | 34.28* | 1.13x10⁻⁹ | Very strong |
| Refiner specific energy (SE) | 0.944 | 74.51* | 4.83x10⁻¹³ | Very strong |
| Refiner differential pressure (DP) | 0.689 | 10.46* | 6.22x10⁻⁹ | Strong |
| SP x SE | 0.766 | 17.02* | 6.47x10⁻⁷ | Strong |
| SP x DP | 0.489 | 5.61* | 1.99x10⁻⁵ | Moderate |
| SE x DP | 0.458 | 4.23* | 3.40x10⁻⁴ | Moderate |
* Significant at the 0.05 probability level.
Table 3.
F-values from the one-way ANOVA comparing all refining treatments and the control for all studied response variables.
Table 3.
F-values from the one-way ANOVA comparing all refining treatments and the control for all studied response variables.
| Variable | F-value | p-value |
| Average density | 7.26* | < 0.001 |
| Maximum surface density | 9.03* | < 0.001 |
| Sa (arithmetic mean height) | 1.12 | 0.346 |
| Sp (maximum peak height) | 1.61 | 0.956 |
| Sq (root mean square height) | 1.12 | 0.346 |
| Sz (total height) | 1.05 | 0.409 |
| Sv (maximum pit depth) | 2.61* | < 0.001 |
| MOR | 10.18* | < 0.001 |
| MOE | 21.91* | < 0.001 |
| Cleavage strength | 5.39* | < 0.001 |
* Significant at the 0.05 probability level.
Table 4.
Surface roughness average values for MDF door panels produced under various fiber refining treatments.
Table 4.
Surface roughness average values for MDF door panels produced under various fiber refining treatments.
|
SP (MPa) |
SE (kWh/t) |
DP (kPa) |
Sa (μm) | Sp (μm) | Sq (μm) | Sz (μm) | Sv (μm) |
| Control | 6.6 (1.1) | 43.8 (28.5) | 9.9 (1.5) | 105.7 (30.6) | -61.9 (9.0) a | ||
| 0.80 | 70 | 24 | 6.5 (1.5) | 27.0 (13.1) | 9.3 (1.9) | 85.4 (26.9) | -50.6 (12.4) b |
| 35 | 7.2 (1.2) | 45.0 (28.3) | 10.4 (1.5) | 106.6 (22.7) | -61.6 (14.0) a | ||
| 50 | 6.1 (1.4) | 40.8 (31.2) | 9.0 (1.9) | 96.7 (34.9) | -55.9 (9.1) a | ||
| 80 | 24 | 5.9 (1.5) | 27.7 (12.0) | 8.6 (2.0) | 81.5 (14.7) | -53.9 (8.9) a | |
| 35 | 6.8 (1.0) | 33.1 (19.5) | 9.8 (1.1) | 92.5 (14.7) | -59.5 (11.8) a | ||
| 50 | 6.3 (1.0) | 38.9 (29.9) | 9.3 (1.5) | 92.4 (33.0) | -53.4 (8.6) a | ||
| 0.90 | 70 | 24 | 7.1 (1.2) | 52.4 (34.5) | 10.2 (1.3) | 111.3 (38.9) | -58.9 (11.8) a |
| 35 | 6.6 (0.9) | 25.8 (10.3) | 9.8 (2.6) | 88.7 (18.9) | -62.9 (14.0) a | ||
| 50 | 6.6 (1.9) | 37.4 (20.6) | 9.8 (2.6) | 97.2 (33.7) | -59.8 (19.9) a | ||
| 80 | 24 | 7.2 (0.7) | 24.3 (8.5) | 10.4 (0.7) | 99.3 (14.6) | -75.0 (11.9) c | |
| 35 | 6.8 (0.9) | 44.7 (21.4) | 9.7 (1.4) | 100.2 (23.1) | -55.5 (15.5) a | ||
| 50 | 6.6 (1.5) | 36.7 (29.5) | 9.3 (2.1) | 95.7 (46.3) | -59.0 (18.2) a | ||
Means sharing the same letter are not statistically different according to Tukey’s test. Standard deviations are given in parentheses. SP: digester steam pressure; SE: refiner specific energy; DP: refiner differential pressure. Sa: arithmetic mean height; Sp: maximum peak height; Sq: root mean square height; Sz: total height; Sv: maximum pit height.
Disclaimer/Publisher’s Note: The statements, opinions and data contained in all publications are solely those of the individual author(s) and contributor(s) and not of MDPI and/or the editor(s). MDPI and/or the editor(s) disclaim responsibility for any injury to people or property resulting from any ideas, methods, instructions or products referred to in the content. |
© 2026 by the authors. Licensee MDPI, Basel, Switzerland. This article is an open access article distributed under the terms and conditions of the Creative Commons Attribution (CC BY) license (http://creativecommons.org/licenses/by/4.0/).
Copyright: This open access article is published under a Creative Commons CC BY 4.0 license, which permit the free download, distribution, and reuse, provided that the author and preprint are cited in any reuse.