

Submitted:
14 August 2026
Posted:
17 August 2026
You are already at the latest version
Abstract
Re-introducing recycled carbon fibre (rCF) into the manufacturing value chain signifi-cantly reduces environmental impacts. The fabrication of nonwoven mats made by card-ing rCF with thermoplastic filaments enable the production of preform suitable for manu-facturing and thermoforming structural parts and fusion bonding technologies. The in-duction welding process takes advantage of the random nature of such materials since the discontinuous fibres contribute to the formation of microcircuits heated by the eddy cur-rents related to the magnetic field enabling a susceptor-less welding process.
In this paper, the optimal welding parameters of induction welding of rCF/maleic anhy-dride-grafted polypropylene (MAPP) laminates are been investigated. The compression molded laminates have been consolidated and experimentally characterized for compari-son with welded joints. The strength and fracture behaviour of the welded joints are gov-erned by several process parameters, including generator power, coil distance, translation speed, and compaction load. The optimal condition yielded an interlaminar shear strength of 11.7 ± 0.6 MPa, at least equal to that of the parent laminate. A Mode I initiation tough-ness of 560 ± 207 J/m² was measured, and all the joints failed cohesively.
The actual welded area inside the joint is function of the welding process. The uniformity of the conductive fibre network was found as the key parameter on the extent of the weld. Although the weld was not uniform across the configurations, the findings support in-duction welding as an effective joining method for rCF nonwoven laminates.
Keywords:
recycled carbon fibre
; nonwoven composite
; polypropylene
; induction welding
; process optimization
; interlaminar shear strength
; fracture toughness
1. Introduction
The adoption of carbon fibre reinforced polymers (CFRP) in the automotive [1] and aerospace [2] sectors continues to grow, driven by their outstanding specific strength and stiffness, and is inevitably accompanied by an expanding waste stream [3]. Global CFRP waste was projected to reach about 20 kt per year by 2025 [3], and is expected to increase substantially over the coming decade as a result of the decommissioning of 6,000 to 8,000 commercial aircraft by 2030 and of the end of life of the first generation of wind-turbine blades [3]. Against this scenario, the current global recycling capacity, of the order of 6 kt per year [3], covers less than one third of the present stream and a correspondingly smaller fraction of the projected one. Cost-effective strategies for reclaiming carbon fibres and, above all, for re-valorising them in structural applications are therefore increasingly urgent.
Mechanical, thermal and chemical routes have been developed to reclaim carbon fibres from composite waste [4,5]. A common limitation of the reclaimed fibres is a partial degradation of their mechanical properties and, more critically, a reduction in fibre length, which prevents their direct reuse in high-performance applications [4]. Blending recycled with virgin fibres is one option [6]; a more direct route is their incorporation into nonwoven mat architectures. Such mats can be produced by dry-laying, wet-laying or carding [7], and can be upgraded into hybrid preforms by commingling the recycled fibres with thermoplastic filaments. Hybrid rCF/thermoplastic nonwovens can then be consolidated into laminates by compression moulding, with competitive mechanical properties: Rechsteiner et al. [8] obtained a tensile strength of 80 MPa and a Young’s modulus of 3 GPa from rCF/PA66-6I nonwovens compression-moulded at 290 °C and 40 bar, while Quan et al. [9] reported 200 MPa and 17.5 GPa for nonwoven composites based on a polyphenylene sulfide (PPS) matrix. In a previous work of the present group, Canneva et al. [10] established the compression-moulding window of rCF/MAPP and rCF/PA6 carded nonwovens, showing that a one-shot consolidation route yields laminates with a porosity in the 4.8-8% range and a reinforcing efficiency of the recycled fibres strongly enhanced, in the MAPP system, by the maleic anhydride grafting.
Deploying these recycled laminates in complex industrial structures requires reliable joining methods. Mechanical fastening introduces stress concentrations and additional weight, and adhesive bonding demands extensive surface preparation; the intrinsic weldability of the thermoplastic matrix offers a more direct alternative, enabling fused joints with a load transfer comparable to that of the parent laminate [11]. Among the welding techniques, induction welding is particularly attractive for its potential for contactless, rapid and localized heating and for its scalability to continuous processes [11,12]. The process relies on the generation of eddy currents within the electrically conductive fibre network; these currents dissipate energy through the Joule effect, raising the temperature of the laminate and melting the surrounding matrix, which coalesces across the interface and re-solidifies upon consolidation and cooling [12].
Fusion bonding is classically described as the sequence of two physically distinct stages: the development of intimate contact between the two surfaces, which is driven by the applied pressure and by the viscous flow of the molten matrix [13], and the subsequent autohesion (or healing) of the interface, driven by the reptation of the polymer chains across it, which is controlled by temperature and time [14]. Both stages must be completed for a sound joint; the process parameters of any welding technique can therefore be read as the means of controlling these two mechanisms.
The parameters governing the quality of an induction-welded joint have been extensively investigated in recent years [15]. The energy delivered to the bond line - set by the generator power, the coil-to-laminate distance and the translation speed - together with the compaction pressure applied during consolidation, constitutes the parameter set that fixes the thermal history at the interface and, ultimately, the degree of coalescence achieved. Two recurring difficulties emerge from the literature. The first is the non-uniformity of the temperature field along and across the weld line, whose origin is largely material-related: Lionetto et al. [16] demonstrated, both experimentally and numerically, that the anisotropic electrical conductivity of unidirectional reinforcements severely limits the formation of in-plane eddy-current loops, so that a conductive susceptor must be introduced at the interface to obtain an acceptable bond. Li et al. [17] addressed the same problem for woven CF/polycarbonate laminates by coupling a validated transient three-dimensional finite-element model with a response-surface methodology, mapping the process parameters onto the equilibrium temperature and the relative effective welded area; the same group subsequently employed a magnetic flux concentrator to focus the induced field and improve the uniformity of the weld [18]. The second difficulty arises from the through-thickness thermal gradient: because heat is generated volumetrically within the reinforcement, the laminate surface facing the coil and the bond line follow different thermal histories, and forced surface cooling is required to keep the outer plies below the degradation threshold while the bond line is driven towards the recommended welding temperature, of the order of 50 °C above the melting point of the matrix [19].
The eddy-current mechanism is well established for woven composites, where the continuous fibre paths form efficient closed electrical circuits [12]. Nonwoven composites made from short recycled fibres represent a distinct, intermediate case. Their dense random fibre network does provide electrical conductivity, as demonstrated by its exploitation for resistive Joule heating [20], but the discontinuous and fragmented nature of the conductive pathways makes the formation of efficient eddy-current loops far from obvious. Consequently, while induction welding is well studied for woven laminates, and alternative joining methods such as ultrasonic welding have been explored for short fibre [21], the process window for susceptor-less induction welding of recycled carbon fibre nonwoven thermoplastic composites has never, to the best of the authors’ knowledge, been established.
The purpose of this work is to establish an optimal process window for induction welding of rCF/MAPP composites. The rCF/MAPP compression moulded laminate is first thermally, viscoelastically and mechanically characterized, to bound the admissible processing temperatures and to provide the reference baseline.
Key process parameters such as generator power, coil-to-laminate distance, translation speed and compaction load are then investigated for achieving the optimal interlaminar shear strength. Therefore, coupons made according to the optimal set were prepared for investigating the fracture mechanics (mode I and mode II) and the lap shear strength of joints. Each joint is assessed both mechanically and by optical microscopy. The fracture surfaces are measured to define the actual welded area. An efficiency parameter () defined by comparing the actual welded surface compared to the nominal was defined and compared across the process, coupons configuration. The welded area varies across the configurations and is shown to depend on the local conductivity of the fibre network rather than on the welding parameters. Results show that the rCF/MAPP laminates should be welded without any susceptor, and that the joint strength is comparable to those of the bulk material.
2. Materials and Methods
2.1. Materials
Carded nonwoven mats of Carbiso TM-MAPP/60 (ELG Carbon Fibre Ltd., Coseley, UK, kindly supplied by AEROSOFT, Capua, CE, Italy) were used throughout. The mats consist of 40 wt% recycled carbon fibres, commingled with 60 wt% maleic anhydride-grafted polypropylene (MAPP) filaments, and have a nominal areal density of 500 g/m². The densities of the constituents, = 1.9 g/cm³ for the recycled carbon fibres and = 0.9 g/cm³ for the MAPP matrix, give a theoretical (void-free) density of 1.1 g/cm³, calculated according to Equation (4).
2.2. Consolidation of MAPP/60 Plates
Multilayer plates were produced by one-shot compression moulding, i.e., by stacking all the mats and pressing them simultaneously in a single step, a route that maximizes process efficiency and reduces cycle time with respect to stepwise lamination [10]. Six layers were stacked between the platens of a Persico compression moulding press (Persico S.p.A., Nembro, Italy). With the platens closed, the stack was preheated from room temperature to 170 °C, i.e., just above the melting range of the matrix; once the set-point was stabilized, a pressure of 100 bar was applied for a dwell time of 20 min. The simultaneous action of heat and pressure ensures the melting of the MAPP filaments and the impregnation of the recycled fibre network. The plates were then cooled to room temperature under load, to preserve dimensional stability and to limit void formation. The route yielded plates of nominal thickness 3.0 ± 0.1 mm (Figure 1).
2.3. Experimental Methods
All tests were performed at 23 ± 2 °C. Unless otherwise stated, results are given as mean ± one standard deviation. The test matrix used in experiments is reported in Table 1.
Thermogravimetric analysis (TGA) was carried out on a TA Instruments TGA Q500 (New Castle, DE, USA) following ASTM E1131 [27], heating approximately 18 mg of material from 22 °C to 900 °C at 10 °C/min under nitrogen. The residual mass at 600 °C was used to determine the fibre weight fraction.
Differential scanning calorimetry (DSC) was performed on a TA Instruments DSC Discovery following ASTM D3418 [26], on 5.8 mg samples sealed in aluminium pin-holed pans under nitrogen. The thermal cycle consisted of a first heating scan from 0 °C to 220 °C, a cooling scan to 0 °C and a second heating scan to 220 °C, all at 10 °C/min. The first heating scan characterizes the crystalline structure produced by the consolidation cycle, the cooling scan the crystallization behaviour of the matrix, and the second heating scan the intrinsic behaviour of the matrix after erasure of its thermal history.
Dynamic mechanical analysis (DMA) was carried out on a TA Instruments DMA850 in three-point bending, following ASTM D5023 [25]. Rectangular samples of 50 × 10 × 3 mm were subjected to a 0.05 N preload, 30 µm oscillation amplitude and 1 Hz frequency, and scanned from −70 °C to 120 °C at 3 °C/min. Specimens were extracted along the longitudinal (L) and transverse (T) directions of the mat.
Density and porosity were determined geometrically on 3 coupons, from the ratio of mass to measured volume (Equation (3)) and compared with the theoretical density (Equation (4)) to obtain the void content or porosity (Equation (5)).
Tensile properties were measured according to ASTM D3039 [22] on an Instron 68TM-50 Mechanical tester equipped with a 50 kN load cell. Specimens of 250 × 25 × 3 mm, with a 140 mm gauge length, were tested at 1 mm/min.
Flexural properties were evaluated in three-point bending according to ASTM D790 [23] on specimens of 100 × 12.5 × 3 mm over an 80 mm span (span-to-thickness ratio ≈ 27:1) at 1 mm/min.
Interlaminar shear strength (ILSS) of the parent laminate was determined by the short-beam test on specimens of 40 × 12 × 3 mm over a 15 mm span, at 1 mm/min.
2.4. Induction Welding
The welding set-up is shown in Figure 2. The adherends were positioned in the required joint configuration on a supporting plate made of a thermally insulating, electromagnetically transparent ceramic-based material. Heat was supplied by a Sinergo Sintesi 900 (MK2) solid-state induction generator (Sinergo S.r.l., Valdobbiadene, Italy) with a nominal apparent power of 2.2 kVA, operating at frequencies up to 1000 kHz. The generator was connected to an 80 × 80 mm induction head carrying a double-D (twin-D) coil, wound from 1.5 mm outer-diameter copper tubing, with an overall footprint of 31.5 × 25 mm. In this geometry, the two adjacent central branches of the coil carry co-directional currents, whose magnetic fields superimpose along the centre line and concentrate the induced heating into a narrow band aligned with the weld path. The coil was translated along the joint at a controlled speed by the gantry axis of a Sinergo-Cetma SICE 1 WIDE welding cell, while a steel consolidation roller of width 28.5 mm and 30 mm diameter, applied a compaction load directly above the heated region to promote intimate contact and matrix flow across the bond line. Both the generator and the coil were water-cooled by a dedicated closed-circuit chiller (Sinergo SI-CHILL), independent of the surface cooling described below. Immediately behind the roller, a nozzle delivering compressed air at ambient temperature and 180 L/min provided forced convective cooling of the upper surface, thereby controlling the cooling rate.
The external surface temperature of the upper adherend was monitored continuously by an infrared pyrometer (Optris CTlaser LT-CF2, close-focus optics).
2.4.1. Process Parameters
Five quantities were available for control. Their physical role and the range explored in this work are summarized in Table 2.
Two remarks are in order. First, the compaction load is reported in newtons throughout: the values of 98, 196 and 392 N correspond to the dead loads of 10, 20 and 40 kg applied to the roller. Second, the surface temperature set-point was held constant at 160 °C for the entire campaign, and no preheating stage was applied.
2.4.2. Optimization Strategy and Test Plan
The experimental plan was organized as a sequential, adaptive campaign: a limited number of conditions were explored, each condition being defined based on the response measured on the preceding one, and each step modifying either the thermal input or the compaction load, so that the two mechanisms could be discriminated. Five conditions, labelled A to E, were examined; they are reported in Table 3 together with the rationale of the corresponding step.
The optimization was carried out entirely on short-beam shear coupons of 150 × 50 mm, the interlaminar shear strength of the joint being adopted as the objective function. Four reasons motivate the choice. The short-beam configuration loads the bond line directly in shear, so that the measured response is a property of the weld and not of the adherends. A single welded coupon yields up to twelve specimens, so that each welding condition is characterised by a statistically meaningful population at the cost of one weld only. The same property is available for the parent laminate, so that every welding condition can be benchmarked against the material it joins. The single set of parameters emerging from this phase is then transferred to the remaining joint configurations.
Every welded coupon is identified by a code of the form X_Y, in which the first field X identifies the joint configuration and the second field Y the combination of process parameters with which the coupon was welded. The joint configurations are S for short-beam shear, L for single-lap shear, E for end-notched flexure and D for double cantilever beam (Table 4). The parameter combinations explored in the present phase are the five conditions A to E of Table 3. Each specimen is identified by the code of its parent coupon followed by a progressive number n, in the form X_Y_n, assigned along the weld path starting from the onset of the welding trajectory. Thus S_A denotes the short-beam coupon welded with combination A, and S_A_01 the first specimen cut from it, the one closest to the beginning of the weld.
The campaign (Table 5) started from combination A, deliberately conservative, with the lowest generator setting, the shortest coil working distance and the lowest compaction load. In B the power was raised and the coil simultaneously withdrawn to 4 mm, to enlarge the heated volume while limiting the through-thickness temperature gradient at the surface; the compaction load was left unchanged, so that this step isolates the effect of the thermal input. In C the power was reduced and the compaction load doubled, to establish whether consolidation pressure could compensate for a lower thermal input. Combination D repeats the power, the coil distance and the load of C, but delivers the weld in two steps at twice the translation speed. In E both the power and the compaction load were raised to the upper end of the explored window.
The number of specimens tested is in every case lower than the number extracted, because part of the specimens debonded during the sectioning operation.
The welded short-beam specimens, of nominal dimensions 50 × 12 × 6 mm, were tested over a 24 mm span, i.e., at the span-to-thickness ratio of 4:1 prescribed by ASTM D2344 [24] for the 6 mm welded stack, at 1 mm/min on the same Instron 68TM-50 testing machine used for the parent laminate.
2.5. Mechanical Characterization of the Welded Joint
The parameter combination identified as optimal, combination E, was transferred to the double cantilever beam, single-lap and end-notched flexure configurations, to characterize the joint under the relevant loading modes: interlaminar fracture in Mode I, shear on a single-lap overlap, and interlaminar fracture in Mode II. Coupons and specimens follow the identification convention established in Section 2.4.2, the first field of the code being D, L and E respectively. All tests were performed at 23 ± 2 °C on the same Instron 68TM-50 testing machine used for the parent laminate.
Combination E was transferred without modifying the generator power, the coil-to-laminate distance, the compaction load or the translation speed. Three variants of the optimal condition were also produced, each identified by a lower-case suffix appended to the letter of the optimum (Table 6): E_w (weak): generator power lowered from 35% to 30% of the nominal value; E_d (double step): a second step added; E_l (light): the double step of E_d delivered at half the compaction load, 196 N instead of 392 N.
The rationale for the introduction of each variant is discussed in Section 3.3. The coupons produced and the corresponding specimen populations are reported in Table 7.
Double cantilever beam specimens were obtained from welded coupons of 150 × 150 mm. Each coupon was sectioned into five specimens of final dimensions 120 × 25 mm, the length being taken along the direction of the weld path and the width across it, so that the five specimens are distributed side by side over the welded surface and are numbered progressively. A PEEK film (VICTREX® APTIV® 2000, 100 µm, Victrex plc, Thornton Cleveleys, UK) was inserted between the adherends before welding, over a 63 mm length and across the whole width of the coupon, to act as a crack starter.
The load was introduced through aluminium loading blocks bonded to the arms at the insert end of the specimen. The bonding areas of both the laminate and the blocks were abraded with P400 aluminium oxide abrasive paper (Norton, Saint-Gobain Abrasives, Worcester, MA, USA) and degreased with isopropyl alcohol (Würth GmbH & Co. KG, Künzelsau, Germany); the blocks were then bonded with a cyanoacrylate adhesive (Loctite 401, Henkel AG & Co. KGaA, Düsseldorf, Germany). The tests were performed following the specimen geometry and the loading configuration of ASTM D5528 [28], at a crosshead rate of 5 mm/min. Crack propagation was recorded by a digital camera at 60 fps, synchronized with the load-displacement acquisition.
Single-lap joints were produced by overlapping two 120 × 150 mm adherends over a 25 mm length and were sectioned into five specimens of 25 mm width, giving a nominal welded area of 25 × 25 mm, in accordance with the geometry of ASTM D5868 [29]. Tests were performed in tension at a crosshead rate of 1 mm/min. No end tabs were applied.
End-notched flexure specimens were obtained from welded coupons of 150 × 180 mm. Each coupon was sectioned into five specimens of final dimensions 160 × 25 mm, the length being taken along the 180 mm side of the coupon and the width along the 150 mm side, so that the five specimens are distributed side by side across the welded surface and are numbered progressively. A PEEK film (VICTREX® APTIV® 2000, 100 µm, Victrex plc, Thornton Cleveleys, UK) was inserted between the adherends before welding, over a 45 mm length and across the whole width of the coupon, to act as a crack starter. The tests were performed following the specimen geometry and the loading configuration of ASTM D7905 [30], over a total span of 100 mm.
2.6. Fractographic Analysis and Effective Welded Area
The fracture surfaces of all the tested joints were photographed with a Samsung Galaxy S24 Ultra smartphone camera (Samsung Electronics Co., Ltd., Suwon, South Korea), with the optical axis normal to the fracture plane and a reference ruler placed alongside the specimen, coplanar with the fracture surface. Selected surfaces were also observed under a Nikon SMZ-U stereomicroscope (Nikon Corporation, Tokyo, Japan) equipped with an AmScope MD500 digital camera (AmScope, Irvine, CA, USA), to document the fracture morphology.
The welded region was identified on these images by the morphology of the coalesced and re-solidified matrix and measured with Paint.NET v5.1.9 (dotPDN LLC, Kirkland, WA, USA). The scale of each image was determined individually from the number of pixels spanning a known interval on the ruler. The boundary of the welded region was then traced manually, without automatic thresholding, since the welded and unwelded regions differ in surface texture rather than in grey level. For the single-lap joints, the enclosed area was converted into the effective welded area , and the effective welded fraction was obtained as the ratio of to the nominal overlap area = 625 mm², according to Equation (13). For the end-notched flexure and double cantilever beam specimens the energy release rate depends on the specimen width rather than on a welded area. The lateral extent of the coalesced band was therefore measured on the fracture surface at successive positions along the propagation path, so as to document its variation, and the value taken at the crack front was converted into the effective welded width , which replaces the nominal specimen width = 25 mm in Equations (12) and (16). The correction applies only where the coalesced band was narrower than the specimen: where it spanned the full width, the effective and the nominal widths coincide and the nominal value is reported.
3. Results and Discussion
3.1. Characterization of Bulk MAPP/60 Composites
3.1.1. Thermal Stability
The TGA thermogram of the consolidated laminate is shown in Figure 3a. The main degradation occurs between 350 °C and 500 °C, with a maximum rate of mass loss at 425.4 ± 0.5 °C (Table 8). The residue at 600 °C is 39.5 ± 0.5 wt%. This residue is not the fibre content, because the neat matrix also leaves a char under nitrogen [31]. Thermogravimetric analysis on neat MAPP, gave a residue = 7.7 wt% at 600 °C [31]. The actual fibre weight fraction was therefore obtained by subtracting this contribution according to Equation (1) [32]:
where is the residue of the composite after the heating program and the residue of the neat polymer, both expressed as fractions of the initial specimen weight. All residues were evaluated at 600 °C. The resulting fibre weight fraction is = 34.5 ± 0.5 wt%. The complementary matrix weight fraction, = 65.5 ± 0.5 wt%, is the basis on which all calorimetric enthalpies reported in the following are normalised.
3.1.2. Melting Behaviour and Crystallinity
The DSC traces are reported in Figure 3b. In the low-temperature region a change of slope of the heat flow is observed between 40 and 60 °C, associated with chain mobility within the crystalline lamellae [33]; its characteristic temperature, 46.5 ± 0.6 °C, is reported in Table 8.
The melting endotherm extends from about 160 °C to 170 °C, with a peak at Tm = 164.4 ± 0.7 °C, characteristic of isotactic polypropylene. In the first heating scan the endotherm is double: the lower-temperature peak is attributed to the melting of the β crystalline form and the higher-temperature one to the α form [34]. In the second heating scan a single melting peak is observed at 163 °C, indicating that upon cooling from the melt, in the absence of a nucleating agent, the matrix recrystallizes essentially in a single crystalline modification. The glass transition temperature (Tg) is 46.5 °C
The crystallization temperature measured on the cooling scan is Tc = 120 °C.
The degree of crystallinity of the matrix () was estimated from the DSC melting enthalpies [35] in Equation (2) as:
where is the melting enthalpy normalized on the real matrix weight fraction, is the enthalpy associated with cold crystallisation, and is the melting enthalpy of a fully crystalline polymer, taken as 209 J/g for polypropylene [36,37].
The obtained value is reported in Table 8.
3.1.3. Density and Porosity
The measured density is 0.986 g/cm³ evaluated by Equation (3), against a theoretical value of 1.10 g/cm³ calculated by Equation (4), giving a void content of 10.3% determined by Equation (5) and reported in Table 9.
where is the sample weight (g) and is the measured volume (cm3), is the real fibre weight fraction (Table 8), is theorical fibre density (1.9 g/cm3), is the theorical matrix density (0.9 g/cm3), is the real matrix weight fraction.
The void content of the present plates is higher than the 4.8-8.0% reported by Canneva et al. [10] for the same material consolidated by the same one-shot route. The difference is consistent with the greater number of stacked layers, six here against one to three in [10], which increases the volume of air entrapped between the mats and the distance over which it must be expelled during the dwell. This residual porosity is not a marginal detail: it is the origin of the large scatter of the interlaminar shear strength of the parent laminate and, the reservoir of the volatiles whose confinement governs the welding process.
3.1.4. Viscoelastic Response
The DMA curves are reported in Figure 3c and the values extracted at 50 °C in Table 10. The storage modulus E′ shows the trend typical of a semicrystalline thermoplastic composite, decreasing progressively with temperature while the loss factor tan δ increases; the drop is most pronounced across the α-relaxation, consistent with the DSC result.
The reference temperature of 50 °C was selected because it lies immediately above Tg = 46.5 °C, so that both directions are probed under the same chain-mobility conditions. At this temperature the laminate exhibits a storage modulus of 15.7 ± 1.59 GPa along the longitudinal direction and 13.5 ± 1.24 GPa along the transverse one, with tan δ of 0.032 ± 0.0032 and 0.037 ± 0.0043 respectively. The lower stiffness and the higher damping recorded in the transverse direction reflect the preferential fibre alignment induced by the carding and needle-punching processes [38,39].
3.1.5. Mechanical Properties
Specimens were extracted along both the longitudinal (0°) and the transverse (90°) directions, the anisotropy of the mat being expected from the carding and needle-punching route [38,39].
The tensile strength () and elastic modulus () were obtained in accord with Equation (6) and Equation (7):
where is the applied load, is the Cross-Sectional area given by the product of the measured width and thickness, is the difference in stress calculated between point y1 and point y2, and the difference in strain calculated between point x1 and point x2. The modulus being evaluated as the chord modulus over the strain interval prescribed by ASTM D3039 [22].
In tension the laminate exhibited a modulus of 15.9 ± 0.54 GPa and a strength of 160 ± 5.2 MPa in the longitudinal direction, decreasing to 12.7 ± 0.39 GPa and 120 ± 3.3 MPa transversally. In flexure the anisotropy is confirmed, with 16.4 ± 0.25 GPa and 130 ± 15 MPa longitudinally against 13.5 ± 0.33 GPa and 120 ± 12 MPa transversally.
All the tensile specimens failed within the gauge length (Figure 5). All the specimens failed in a lateral mode, on a plane essentially normal to the loading direction, without extensive longitudinal splitting or edge delamination, as expected for a discontinuous randomly oriented reinforcement in which no continuous fibre bundle can sustain a longitudinal crack.
The flexural strength and modulus were calculated using Equation (8) and Equation (9):
where is the applied load, width, thickness, span length, slope of the linear portion of the load deflection curve.
The value obtained in quasi-static bending (16.4 GPa) is in excellent agreement with the flexural storage modulus measured by DMA on the same geometry (15.7 GPa at 50 °C, Table 10), and both are consistent with the stiffness expected for a planar-random discontinuous reinforcement. The two bending measurements, obtained with independent instruments and loading modes, therefore corroborate with each other.
The interlaminar shear strength of the parent laminate was evaluated according to Equation (10):
where is the maximum value of the applied force, width and thickness.
The value is 7.76 ± 2.24 MPa. The coefficient of variation of 29% is remarkably large and is a direct consequence of the residual porosity of the one-shot route, which produces a heterogeneous void distribution: individual short-beam specimens’ sample different local void contents, and the strength scatters accordingly.
Figure 6 shows a short-beam specimen after testing together with the corresponding force-displacement curve. The specimens retain a permanent curvature after unloading.
Three damage events follow: the interlaminar crack at mid-thickness, the compressive damage beneath the loading nose, and tensile damage on the lower face. The failure is therefore of a mixed type, and the values reported here are apparent short-beam strengths, used in this work as a comparative measure across welding conditions.
3.2. Optimization of the Induction Welding
Thermal analysis of the parent laminate establishes the critical process window. Coalescence hinges on the bond line exceeding the matrix’s melting range. As the DSC endotherm starts at roughly 160 °C and maxes out at 164.4 °C, the interface temperature must hit a minimum of 170 °C to guarantee total melting of the crystalline phase. The literature on induction welding of thermoplastic composites recommends a bond-line temperature of the order of 50 °C above Tm, i.e., approximately 215 °C, to lower the melt viscosity enough for intimate contact and healing to develop within the available dwell time [19].
TGA establishes the maximum thermal stability limit, as the onset of the main degradation step occurs above 350 °C.
The bond line is not accessible to measurement during the process. The external surface temperature of the upper adherend was therefore adopted as the control variable, and held at a set-point of 160 °C. A surface set-point below Tm is not in contradiction with the requirement stated above, because in induction welding the heat is generated volumetrically within the conductive fibre network and is not applied at the surface, while the upper surface is the only one exposed to the forced convective cooling of the air nozzle. The resulting through-thickness gradient, well documented in the literature [19], leaves the bond line hotter than the monitored surface: holding the surface at 160 °C therefore drives the interface above Tm while keeping the outer plies far from the degradation threshold.
The interlaminar shear strength measured for the five welding conditions of Table 3 is reported in Table 12. Each coupon yielded twelve specimens, of which those surviving the sectioning operation were tested; the number of specimens per condition is reported in Table 5. The unwelded samples were concentrated on the coupons welded at the lowest compaction load and is itself an indication of the cohesion of those joints.
The two coupons welded at 98 N, S_A and S_B, return equivalent strengths, 9.24 ± 0.79 and 8.58 ± 1.23 MPa, although the generator power was raised from 0.44 to 0.66 kVA and the coil withdrawn from 2 to 4 mm between the two. Doubling the compaction load to 196 N in S_C raises the strength to 10.26 ± 0.98 MPa. Coupon S_D, welded at the same power, coil distance and load as S_C but in two steps at twice the translation speed, returns 9.02 ± 1.01 MPa: at nominally equal energy per unit length of weld, delivering the weld in two faster steps produces a lower strength, and the corresponding maximum load is the lowest of the campaign. The highest strength, 11.73 ± 0.56 MPa, is obtained in S_E, at 0.77 kVA and 392 N, which is also the condition returning both the highest maximum load and the smallest scatter of the set.
The cross-sections taken before testing (Figure 7) show that the weld line is barely distinguishable within the welded stack, denoting an effective coalescence of the MAPP matrix between the two adherends.
The distribution of the interlaminar shear strength along the weld path for the optimal condition is reported in Figure 8. Eleven of the twelve specimens were tested; the last one being discarded because it did not survive the sectioning operation. The ILSS ranged between 10.7 and 12.5 MPa over the whole welded length. The three specimens closest to the onset of the welding path return the lowest values, between 10.7 and 11.1 MPa, which is ascribable to the thermal transient required by the inductor to reach steady conditions; beyond the fourth specimen, the strength stabilizes around 12 MPa.
Figure 9 shows the force-displacement curve of a welded specimen together with the cross-section after testing, on which the corresponding damage events are identified. The load rises linearly up to a maximum of about 940 N, at which a delamination develops at the welded interface; the load then drops to a plateau of approximately 850 N, sustained by the residual bending capacity of the two separated halves. Compressive damage beneath the loading nose and tensile damage on the lower face appear subsequently along the plateau. The interlaminar failure occurs at the welded interface, while the strength attained exceeds that of the parent laminate.
The condition of coupon S_E 0.77 kVA (35% of the nominal generator power), 4 mm coil distance, 392 N compaction load, single step at 1 mm/s, was therefore identified as optimal and adopted as the reference for all the subsequent joint configurations. The strength attained, 11.73 ± 0.56 MPa, exceeds the 7.76 ± 2.24 MPa of the parent laminate (Table 11), and the scatter of the welded joint is markedly lower, with a coefficient of variation of 4.8% against 29%. The welding stage therefore increases the interlaminar shear strength with respect to the parent material, consistently with a local re-consolidation of the interlaminar region under the combined action of the localized heating and of the roller pressure, which reduces the residual void content of the one-shot laminate and, with it, the variability that the voids induce.
The magnitude of the pressure applied by the consolidation roller can be estimated from Hertzian line-contact theory. For a roller of radius r and length pressed onto the flat laminate by a force , the contact band has a width , the mean contact pressure follows as [40]:
Distributed over the contact patch of the roller, of length = 28.5 mm, and for a 30 mm roller diameter giving a Hertzian contact width of about 1.6 mm, the 392 N load corresponds to a mean contact pressure of about 8.8 MPa, i.e., 88 bar.
3.3. Characterization of Induction Welded Joints
The parameter set identified as optimal on the short-beam configuration was transferred to the double cantilever beam, single-lap and end-notched flexure configurations, as described in Section 2.5, to characterize the joint in Mode I, in shear and in Mode II respectively. The coupons produced and the corresponding specimen populations are reported in Table 7.
The number of specimens tested is in some cases lower than the number extracted, part of the specimens having debonded during the sectioning operation.
3.3.1. Mode I Fracture Toughness
The Mode I interlaminar fracture toughness was evaluated on coupon D_E, welded with the optimal condition transferred unchanged. The critical energy release rate () was computed by Equation (12):
where is the maximum load, displacement at maximum load, width and crack length.
All five specimens extracted from the coupon survived the sectioning operation and were tested.
The fractographic analysis (Figure 11) shows that the weld extended over the whole 25 mm width of the specimen at the crack front: the effectively welded width therefore coincides with the nominal one, and no correction was applied to (). This is the only configuration of the campaign in which the welded region covered the entire available width, and it establishes that the process, in the conditions adopted, can produce a continuous bond across the full specimen.
The delamination resistance curves are reported in Figure 10b. The toughness increases with crack extension in all specimens, from 560 ± 207 J/m² at initiation, determined from the visual onset of crack growth, up to 1301 ± 146 J/m² at the arrest of the crack. The rising behaviour is consistent with the fibre bridging promoted by the nonwoven architecture, in which the randomly oriented discontinuous fibres cross the fracture plane and continue to transfer load behind the crack tip [41]. The initiation values were consistent along the weld path, in agreement with the full welded width observed on the fracture surfaces: where the weld covers the whole interface, the systematic decay towards the extremities of the coupon observed in the other configurations does not appear.
The extent of the R-curve that could be measured was limited by the adherends rather than by the joint. In all specimens the crack arrested after a crack extension of 16.2 ± 12.3 mm, and the arms bent plastically, showing after testing a permanent kink localized at the crack tip, while the load-displacement records show the corresponding plateau. The value of 1301 ± 146 J/m² recorded at arrest is therefore a lower bound of the Mode I toughness of the welded joint, whose plateau value is not resolvable with adherends of this thickness.
3.3.2. Lap Shear
Two coupons were welded in the single-lap configuration: L_E_w, with the generator power lowered to 30% of the nominal value, and L_E_d, with the power restored to 35% and the weld delivered in two steps.
The two coupons differ first in their behaviour during sectioning. Of the five specimens cut from L_E_w, only two survived the cutting operation, the remaining three debonding under the action of the blade alone; all five specimens of L_E_d survived. This purely operational observation is the first indication of the quality of the two joints, and it is consistent with the difference in the energy delivered to the bond line: the single-lap coupons present extended non-overlapped regions, which act as heat sinks and dissipate a substantial fraction of the energy supplied by the inductor, so that the thermal input available at the interface is lower than in the compact short-beam geometry. Lowering the generator power aggravates this deficit, whereas the second step compensates for it.
Inspection of the fracture surfaces (Figure 12) revealed that the welded region did not extend over the whole nominal overlap in either coupon. The strength was therefore computed twice (Table 13), on the nominal and on the effective welded area, the effective welded fraction being obtained from Equation (13) and the lap shear strength from Equation (14):
where is the maximum load and the welded area, nominal or effective.
The two coupons differ substantially in the extent of the joint and only marginally in its strength. The effective welded fraction rises from 0.184 in L_E_w to 0.718 in L_E_d, and the nominal strength rises accordingly from 0.94 to 4.10 MPa; the effective strength, however, is essentially the same in the two cases, 5.41 ± 0.56 against 5.55 ± 0.47 MPa. Where the weld was formed, the bond developed the same strength irrespective of the welding condition: what the second step modified is the extent of the welded region, not the quality of the bond within it. In every specimen the failure was cohesive, propagating within the matrix rather than at the interface, which is the signature of a fully healed weld [14].
The origin of the five specimens and the appearance of their fracture surfaces are shown in Figure 13. The specimens were cut side by side across the overlap and are numbered progressively along the weld path, so that each measurement retains its position within the joint. On each disassembled specimen the welded region is recognizable by the morphology of the coalesced and re-solidified matrix, which differs in surface texture from the unaffected base material; its boundary was traced on the fracture surface as described in Section 2.6 and referred to the nominal overlap of 625 mm² to obtain .
The resulting distribution along the weld path is reported in Figure 13. The joint is complete, = 1, on the three central specimens, and drops to 0.20 on the first and to 0.45 on the last, in agreement with the fracture surfaces of Figure 13, on which the extent of the coalesced region visibly decreases towards the two extremities of the coupon. The transients at the onset and at the end of the inductor travel, already observed on the short-beam coupons, account for this behaviour at the two ends.
3.3.3. Mode II Fracture Toughness
Two coupons were welded in the end-notched flexure configuration, both with the double step: E_E_d at the full compaction load of 392 N and E_E_l at half that value. The reduction of the load was introduced to eliminate the feed marks left by the consolidation roller on the surface of the joint, which at 392 N were pronounced, and its effect on the Mode II response was verified.
Since the Mode II energy release rate depends on the specimen width B and not on a welded area, the effectively welded width (), measured on the fracture surface at the crack front, was used in place of the nominal width; The effective welded fraction is here defined as a ratio of widths, and not of areas as in the single-lap case, according to Equation (15):
where = 25 mm is the nominal specimen width.
is therefore reported both as a nominal value ( = ) and as an effective value ( = ), and was calculated with Equation (16):
where is the maximum load, the displacement at maximum load, width measured at initial crack length, initial crack length and the half-span length, i.e., half the distance between the two outer supports.
Halving the compaction load produced no measurable change in the Mode II response. The effectively welded fraction is the same within the scatter in the two coupons, 0.380 ± 0.166 against 0.340 ± 0.146, and so are the nominal and the effective energy release rates. The feed marks were suppressed at 196 N, and the joint retained the toughness obtained at the full load: in this configuration the compaction load can therefore be reduced to improve the surface quality of the weld without penalising its fracture performance.
The fracture surfaces (Figure 14, Figure 15) show that in both coupons the weld covered only a limited portion of the width and of the length of the specimen. The nominal values, 539 ± 317 and 640 ± 431 J/m² reported in Table 13, are consequently far below the effective ones, 1720 ± 1015 and 2245 ± 2174 J/m²: the discrepancy measures the extent of the welded region and not an intrinsic difference in the toughness of the bond. Where the joint was formed, the welded region was of high quality, the failure being cohesive in every specimen.
The way in which the effective width was measured, and its variation along the propagation path, are shown in Figure 16. On the fractured interface the coalesced region is recognizable by the morphology of the re-solidified matrix, and its lateral extent was measured at successive positions along the specimen (red lines). The resulting profiles show that is not constant along the crack path: it is lowest in the initial portion, where the weld is narrowest, and increases towards the central region, where in some specimens the coalesced band approaches the full nominal width.
The Mode II energy release rate reported in Table 13 is therefore obtained from Equation (16) at the initial crack front, where the welded width is smaller than in the central region of the specimen. The welded width measured at that position varies from specimen to specimen, and this variability accounts for the scatter of effective values.
The effective value reported for E_E_l has a standard deviation comparable to the mean. The energy release rate scales inversely with the welded width, so that both the mean and its uncertainty grow as B_eff decreases; the value is dominated by the specimens with the narrowest welded band and should be read as an order of magnitude rather than as a measurement.
3.3.4. Origin of the Weld Non-Uniformity
When considered as a whole, the three configurations narrow the range of plausible explanations for the incomplete welded area. The energy at the bond line is not the governing factor: E_E_d and E_E_l received the same thermal input and differed in compaction load, yet returned the same welded area, while in the single-lap configuration the increase of obtained with two-steps process did not showed increase of the effective strength. Nor is the limitation attributable to the coil geometry or to the set-up, since the same inductor, the same working distance and the same compaction load produced a joint extending over the entire specimen width in the double cantilever beam coupon.
Therefore, the controlling parameter is the actual conductive network within the material itself. The heat is generated where the induced currents circulate, and in a composite reinforced by discontinuous fibres the current paths are not defined by the fibres alone but by the contacts established between them. Buser et al. [42] have shown that the formation of eddy-current loops depends on the incidence of these contacts, which makes the phenomenon stochastic in nature and produces heating patterns that are not reproducible from one specimen to another; Grouve et al. [43] have quantified numerically the sensitivity of the heating behaviour to the experimental variability of the electrical conductivities, finding it to be significant. The consequence of an uneven distribution of the fibre-to-fibre contacts has been documented directly for Joule heating by Wellekötter and Bonten [44], who observed that in architectures with few intersections between fibres only a small fraction of the reinforcement carries the current and overheats, while the surrounding material remains close to room temperature, whereas structures offering a large number of intersections heat far more uniformly. The same sensitivity has been reported for textiles based on discontinuous recycled carbon fibres, whose resistivity varies during processing and governs the distribution of the current flow [45].
A carded nonwoven represents the limiting case of this condition. The conductive paths are fragmented by the discontinuity of the fibres, and the closed loops available to the induced currents are established through many contacts whose density and quality vary from point to point. The architecture of the mat contributes to the same effect, since the carding web has an areal weight of a few tens of grams per square meter and must be layered and stacked to reach the nominal value [38], so that local fluctuations of the areal density are intrinsic to the way in which the mat is formed. The volumetric heat generation rate is therefore not uniform over the surface swept by the coil: the weld is established where the local fibre network sustains sufficient eddy-current heating and fails to establish where it does not.
This interpretation accounts for the whole set of observations reported above. It explains the fragmentary morphology of the welded regions and the dispersion of among specimens cut from the same coupon and therefore welded under identical conditions.
It also explains why the same welding conditions produced full coverage in the double cantilever beam coupon and only partial coverage elsewhere, without any difference in the parameters applied.
Finally, it identifies the direction in which the process should be developed: the limitation lies in the electrical uniformity of the preform, and a mapping of the local conductivity of the laminate, correlated with the extent of the resulting weld, would provide the direct evidence that the present work can only infer.
4. Conclusions
This work establishes a viable process window for the susceptor-less induction welding of recycled carbon fibre/MAPP nonwoven laminates. The intrinsic conductive network of the carded architecture is shown to be sufficient to generate eddy-current heating, thereby eliminating the need for an external susceptor at the bond line. By adopting the external surface temperature as the control variable, a conservative yet effective welding regime is achieved, accounting for the volumetric nature of heat generation within the reinforcement.
The paper investigated the interlaminar shear strength, Lap shear strength and fracture mechanics (mode I and mode II) of welded joints. Results showed that the actual welded area depends on the process parameters but a strong dependency on the random microstructure has been detected. An efficiency parameter has been defined () for comparing the actual welded area compared to the nominal.
Results encourage the adoption of these materials as sustainable laminates, since joints reproduced strength similar to the bulk material (i.e., interlaminar shear strength is comparable) but additional work should be addressed to uniform the composition of the carded material.
Author Contributions
Conceptualization A.M; Methodology G.P., B.P., A.P., A.M.; Validation B.P., F.C.; Investigation G.P.; Data Curation G.P., F.C., A.P.; Writing – original draft preparation G.P., A.M.; Writing – review and editing G.P., M.G., A.M.; Supervision M.G., G.D.T., Funding acquisition G.D.T., A.M.
Funding
This research was funded by the Ministry of Enterprises and Made in Italy, grant number F/310328/01-05/X, Project MARIS - Materiali compositi Avanzati ottenuti dal Riciclo di materiali di Sfrido o Scarto)
Data Availability Statement
The raw data supporting the conclusions of this article will be made available by the authors on request.
Acknowledgments
The author would like to thank Mr. Nicola Carranante and Mr. Gaetano Barbato for their support in preparing compression moulded panels.
Conflicts of Interest
The authors declare no conflicts of interest.
References
- Yan, L.; Xu, H. Lightweight Composite Materials in Automotive Engineering: State-of-the-Art and Future Trends. Alexandria Engineering Journal 2025, 118, 1–10. [CrossRef]
- Mamat, R.; Rashid, M.I.M.; Syahir, A.Z.; Erdiwansyah; Yusop, A.F.; Tamimi, A. Carbon Fibre for Applications in Aerospace: A Review. Journal of Alloys and Metallurgical Systems 2025, 12. [CrossRef]
- Sántha, P.; Tamás-Bényei, P. A Comprehensive Overview of the Potential of Recycled Carbon Fiber from Composite Waste: Reclamation, Remanufacturing, and Performance. Waste Management 2026, 213, 115352. [CrossRef]
- Verma, S.; Balasubramaniam, B.; Gupta, R.K. Recycling, Reclamation and Re-Manufacturing of Carbon Fibres. Curr. Opin. Green Sustain. Chem. 2018, 13, 86–90. [CrossRef]
- Wang, Y.; Li, A.Y.; Zhang, S.H.; Guo, B.B.; Niu, D.T. A Review on New Methods of Recycling Waste Carbon Fiber and Its Application in Construction and Industry. Constr. Build. Mater. 2023, 367. [CrossRef]
- Dissanayake, D.G.K.; Weerasinghe, D.U. Fabric Waste Recycling: A Systematic Review of Methods, Applications, and Challenges. Materials Circular Economy 2021, 3. [CrossRef]
- Wölling, J.; Schmieg, M.; Manis, F.; Drechsler, K. Nonwovens from Recycled Carbon Fibres – Comparison of Processing Technologies. Procedia CIRP 2017, 66, 271–276. [CrossRef]
- Rechsteiner, F.; Raimondi, L.; Tegas, N.; Donati, L.; Manis, F. Mechanical Performance of Sustainable Composite Material: Wet-Laid and Dry-Laid Nonwoven Textiles Made out of Recycled Carbon Fibers with Thermoset and Thermoplastic Matrices. J. Clean. Prod. 2025, 519, 146044. [CrossRef]
- Quan, D.; Liu, J.; Yao, L.; Dransfeld, C.; Alderliesten, R.; Zhao, G. Interlaminar and Intralaminar Fracture Resistance of Recycled Carbon Fibre/PPS Composites with Tailored Fibre/Matrix Adhesion. Compos. Sci. Technol. 2023, 239, 110051. [CrossRef]
- Canneva, A.; Palmieri, B.; Cilento, F.; Giordano, M.; Martone, A. Thermoforming Process Effect on Performances of Thermoplastic/Recycled Carbon Fiber Composites. Applied Sciences 2025, Vol. 15, Page 4403 2025, 15, 4403. [CrossRef]
- Reis, J.P.; de Moura, M.; Samborski, S. Thermoplastic Composites and Their Promising Applications in Joining and Repair Composites Structures: A Review. Materials 2020, Vol. 13, Page 5832 2020, 13, 5832. [CrossRef]
- Ahmed, T.J.; Stavrov, D.; Bersee, H.E.N.; Beukers, A. Induction Welding of Thermoplastic Composites—an Overview. Compos. Part A Appl. Sci. Manuf. 2006, 37, 1638–1651. [CrossRef]
- Lee, W. Il; Springer, G.S. A Model of the Manufacturing Process of Thermoplastic Matrix Composites. J. Compos. Mater. 1987, 21, 1017–1055. [CrossRef]
- Wool, R.P.; O’Connor, K.M. A Theory Crack Healing in Polymers. J. Appl. Phys. 1981, 52, 5953–5963. [CrossRef]
- Liu, J.; Quan, D.; Scarselli, G.; Alderliesten, R.; Wang, H.; Zhao, G. Developments and Future Prospects of Welding Technology for Carbon Fiber Thermoplastic Composites. Compos. B Eng. 2025, 297, 112314. [CrossRef]
- Lionetto, F.; Zecca, G.; Buccoliero, G.; Bagheri, S.; Mele, C. Experimental and Numerical Investigation of Susceptor-Aided Continuous Induction Welding of Low-Melt PAEK Composites. Polym. Compos. 2025, 46, 12126–12141. [CrossRef]
- Li, M.; Wen, L.; Wang, S.; Liang, J.; Hou, X. Multifactor Optimization for Induction Welding of Carbon Fiber Reinforced Thermoplastic Composites Based on Response Surface Methodology. Polym. Compos. 2024, 45, 4307–4318. [CrossRef]
- Li, M.; Wen, L.; Zhou, Y.; Wang, S.; Hou, X. Analysis and Optimization for Carbon Fiber Reinforced Thermoplastic Induction Welding With Magnetic Flux Concentrator. Polym. Compos. 2025, 46, 16048–16062. [CrossRef]
- Becker, S.; Mitschang, P. Process Improvement of Continuous Induction Welding of Carbon Fiber-Reinforced Polymer Composites. Journal of Materials Engineering and Performance 2022 31:9 2022, 31, 7049–7060. [CrossRef]
- Tugirumubano, A.; Jeong, H.; Kim, J.D.; Kwac, L.K.; Kim, H.G. Reliability Evaluation of the Performance of Non-Woven Carbon Fiber Fabric for Heating Element Applications. Journal of Materials Research and Technology 2021, 14, 2140–2149. [CrossRef]
- Wang, K.; Shriver, D.; Li, Y.; Banu, M.; Hu, S.J.; Xiao, G.; Arinez, J.; Fan, H.T. Characterization of Weld Attributes in Ultrasonic Welding of Short Carbon Fiber Reinforced Thermoplastic Composites. J. Manuf. Process. 2017, 29, 124–132. [CrossRef]
- ASTM D3039/D3039M-08; Standard Test Method for Tensile Properties of Polymer Matrix Composite Materials; ASTM International: West Conshohocken, PA, 2008;
- ASTM D790-17; Standard Test Methods for Flexural Properties of Unreinforced and Reinforced Plastics and Electrical Insulating Materials; ASTM International: West Conshohocken, PA, 2017;
- ASTM D2344/D2344M-22; Standard Test Method for Short-Beam Strength of Polymer Matrix Composite Materials and Their Laminates; ASTM International: West Conshohocken, PA, 2022;
- ASTM D5023-15; Standard Test Method for Plastics: Dynamic Mechanical Properties: In Flexure (Three-Point Bending). 2015. [CrossRef]
- ASTM D3418-21; Standard Test Method for Transition Temperatures and Enthalpies of Fusion and Crystallization of Polymers by Differential Scanning Calorimetry; ASTM International: West Conshohocken, PA, 2021;
- ASTM E1131-20; Standard Test Method for Compositional Analysis by Thermogravimetry; ASTM International: West Conshohocken, PA, 2020;
- ASTM D5528/D5528M-21; Standard Test Method for Mode I Interlaminar Fracture Toughness of Unidirectional Fiber-Reinforced Polymer Matrix Composites; ASTM International: West Conshohocken, PA, 2021;
- ASTM D5868-01(2014); Standard Test Method for Lap Shear Adhesion for Fiber Reinforced Plastic (FRP) Bonding; ASTM International: West Conshohocken, PA, 2014;
- ASTM D7905/D7905M-19e1; Standard Test Method for Determination of the Mode II Interlaminar Fracture Toughness of Unidirectional Fiber-Reinforced Polymer Matrix Composites; ASTM International: West Conshohocken, PA, 2019;
- Kim, H.S.; Lee, B.H.; Choi, S.W.; Kim, S.; Kim, H.J. The Effect of Types of Maleic Anhydride-Grafted Polypropylene (MAPP) on the Interfacial Adhesion Properties of Bio-Flour-Filled Polypropylene Composites. Compos. Part A Appl. Sci. Manuf. 2007, 38, 1473–1482. [CrossRef]
- Yee, R.Y.; Stephens, T.S. A TGA Technique for Determining Graphite Fiber Content in Epoxy Composites. Thermochim. Acta 1996, 272, 191–199. [CrossRef]
- Harper, D.P.; Laborie, M.P.G.; Wolcott, M.P. The Impact of Polypropylene-Graft-Maleic Anhydride on the Crystallization and Dynamic Mechanical Properties of Isotactic Polypropylene. J. Appl. Polym. Sci. 2009, 111, 753–758. [CrossRef]
- Song, B.; Wang, Y.; Bai, H.; Liu, L.; Li, Y.; Zhang, J.; Zhou, Z. Crystallization and Melting Behaviors of Maleic Anhydride Grafted Poly(Propylene) Nucleated by an Aryl Amide Derivative. J. Therm. Anal. Calorim. 2010, 99, 563–570. [CrossRef]
- Lee, T.H.; Boey, F.Y.C.; Khor, K.A. On the Determination of Polymer Crystallinity for a Thermoplastic PPS Composite by Thermal Analysis. Compos. Sci. Technol. 1995, 53, 259–274. [CrossRef]
- Canopoli, L.; Coulon, F.; Wagland, S.T. Degradation of Excavated Polyethylene and Polypropylene Waste from Landfill. Science of The Total Environment 2020, 698, 134125. [CrossRef]
- Zheng, Y.; Gu, F.; Wang, B.; Wang, Z.; Gao, C.; Zhou, Y.; Hall, P. Thermal and Mechanical Behaviour of Recycled Short Milled Carbon Fibre Reinforced Polypropylene and Recycled Polypropylene Composites: A Comparative Study. Journal of Materials Research and Technology 2024, 32, 4221–4233. [CrossRef]
- Manis, F.; Stegschuster, G.; Wölling, J.; Schlichter, S. Influences on Textile and Mechanical Properties of Recycled Carbon Fiber Nonwovens Produced by Carding. Journal of Composites Science 2021, Vol. 5, Page 209 2021, 5, 209. [CrossRef]
- Ivars, J.; Labanieh, A.R.; Soulat, D. Effect of the Fibre Orientation Distribution on the Mechanical and Preforming Behaviour of Nonwoven Preform Made of Recycled Carbon Fibres. Fibers 2021, Vol. 9, Page 82 2021, 9, 82. [CrossRef]
- Carvill, J. Mechanical Engineer’s Data Handbook. Mechanical Engineer’s Data Handbook 2012, 1–342. [CrossRef]
- Quan, D.; Farooq, U.; Zhao, G.; Dransfeld, C.; Alderliesten, R. Recycled Carbon Fibre Mats for Interlayer Toughening of Carbon Fibre/Epoxy Composites. Mater. Des. 2022, 218, 110671. [CrossRef]
- Buser, Y.M.; Krämer, E.T.M.; Akkerman, R.; Grouve, W.J.B. Induction Heating of Unidirectional C/PAEK – A Thermographic Study on Eddy Current Formation. Compos. B Eng. 2024, 287, 111789. [CrossRef]
- Grouve, W.J.B.; Sacchetti, F.; Vruggink, E.J.; Akkerman, R. Simulating the Induction Heating of Cross-Ply C/PEKK Laminates–Sensitivity and Effect of Material Variability. Advanced composite materials 2021, 30, 409–430. [CrossRef]
- Wellekötter, J.; Bonten, C. Direct Joule Heating as a Means to Efficiently and Homogeneously Heat Thermoplastic Prepregs. Polymers 2020, Vol. 12, Page 2959 2020, 12, 2959. [CrossRef]
- Reese, J.; Hoffmann, G.; Fieres, J.; Cherif, C. Characterization of the Electrical Behavior of a Discontinuous Hybrid Yarn Textile Made of Recycled Carbon and PA6 Fibers during Joule Heating. Journal of Thermoplastic Composite Materials 2020, 33, 1317–1335. [CrossRef]
Figure 1.
rCF/MAPP nonwoven material: (a) as-received carded mat; (b) consolidated plate.
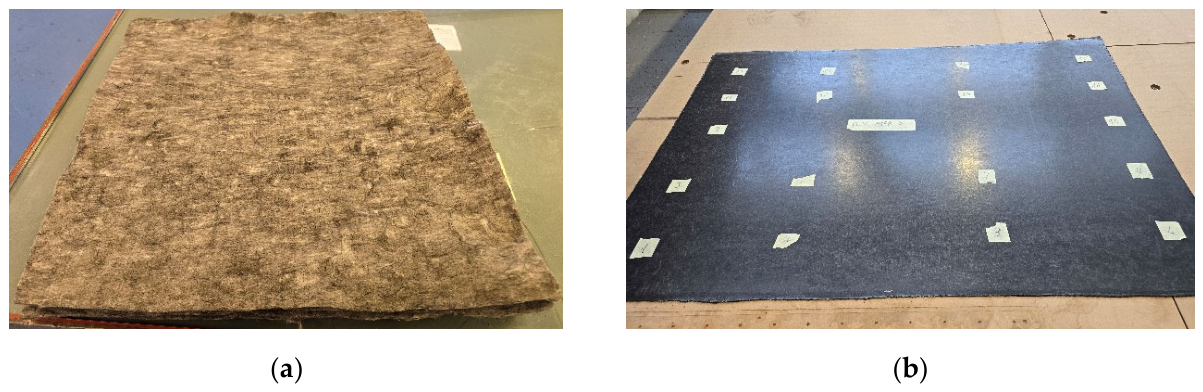
Figure 2.
Induction welding set-up: induction coil, consolidation roller, air nozzle, pyrometer and adherends.
Figure 2.
Induction welding set-up: induction coil, consolidation roller, air nozzle, pyrometer and adherends.
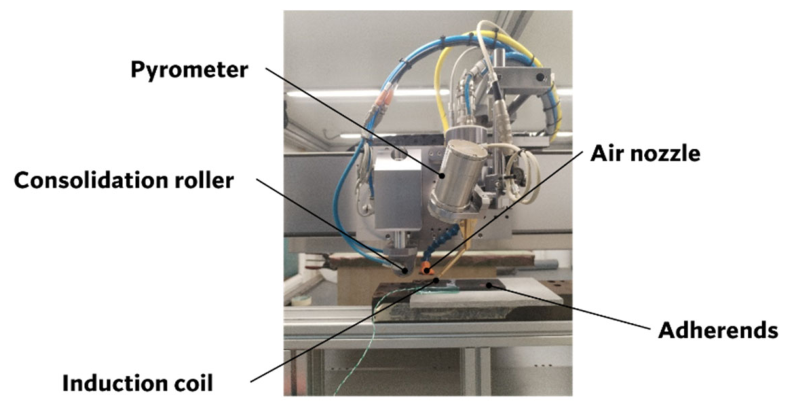
Figure 3.
MAPP/60: (a) TGA thermogram, dotted line represents weight (%) and solid line represents the derivative of weight (%/°C); (b) DSC curves of the sample (exo-up), cooling, first and second heating scans; (c) DMA curves of the MAPP/60 plates.
Figure 3.
MAPP/60: (a) TGA thermogram, dotted line represents weight (%) and solid line represents the derivative of weight (%/°C); (b) DSC curves of the sample (exo-up), cooling, first and second heating scans; (c) DMA curves of the MAPP/60 plates.
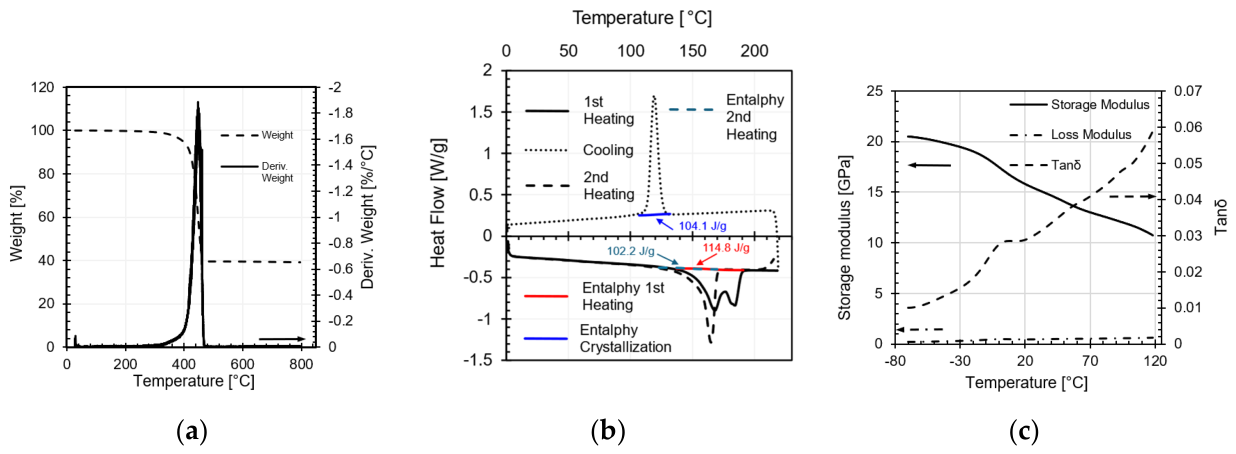
Figure 4.
Characterization of the parent laminate: (a) tensile test; (b) flexure test; (c) ILSS test.
Figure 4.
Characterization of the parent laminate: (a) tensile test; (b) flexure test; (c) ILSS test.
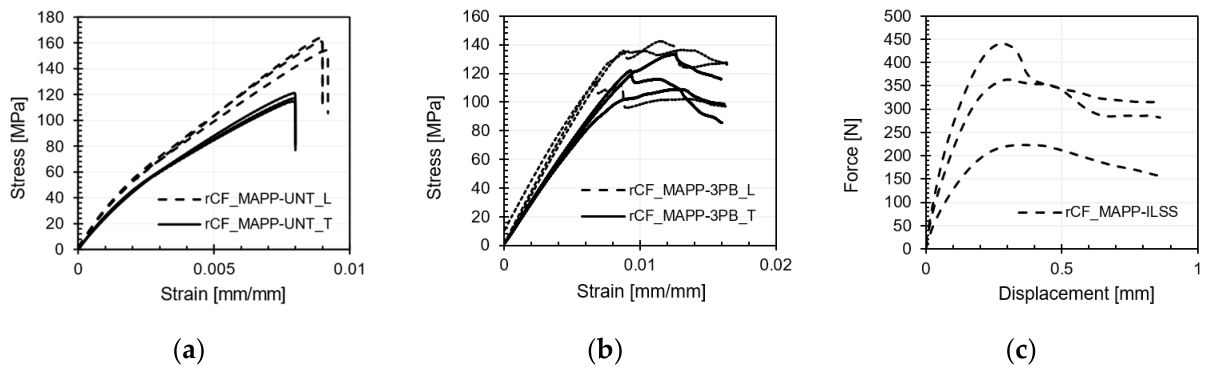
Figure 5.
Tensile specimens after testing.
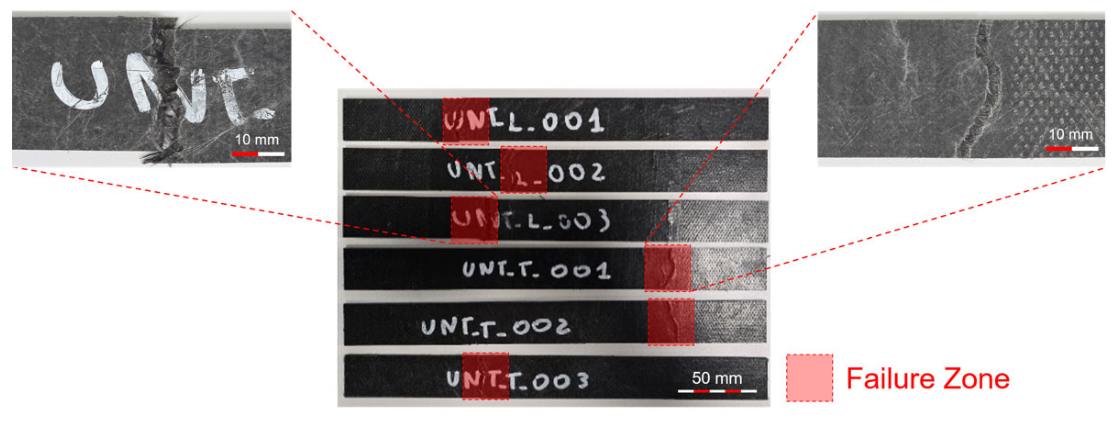
Figure 6.
Short-beam specimen sample 02: force-displacement curve with the corresponding damage events identified on the cross-section after testing.
Figure 6.
Short-beam specimen sample 02: force-displacement curve with the corresponding damage events identified on the cross-section after testing.
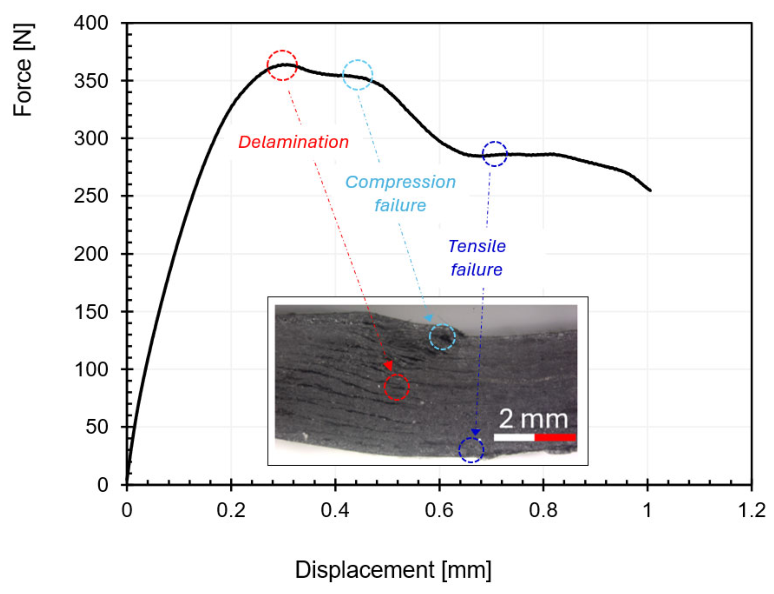
Figure 7.
Welded short-beam specimen S_E_03: cross-section before testing.

Figure 8.
Interlaminar shear strength along the weld path, coupon S_E. Top: the welded coupon with the position of the twelve specimens; specimen 12, marked in red, did not survive the sectioning operation. Bottom: the corresponding ILSS values.
Figure 8.
Interlaminar shear strength along the weld path, coupon S_E. Top: the welded coupon with the position of the twelve specimens; specimen 12, marked in red, did not survive the sectioning operation. Bottom: the corresponding ILSS values.
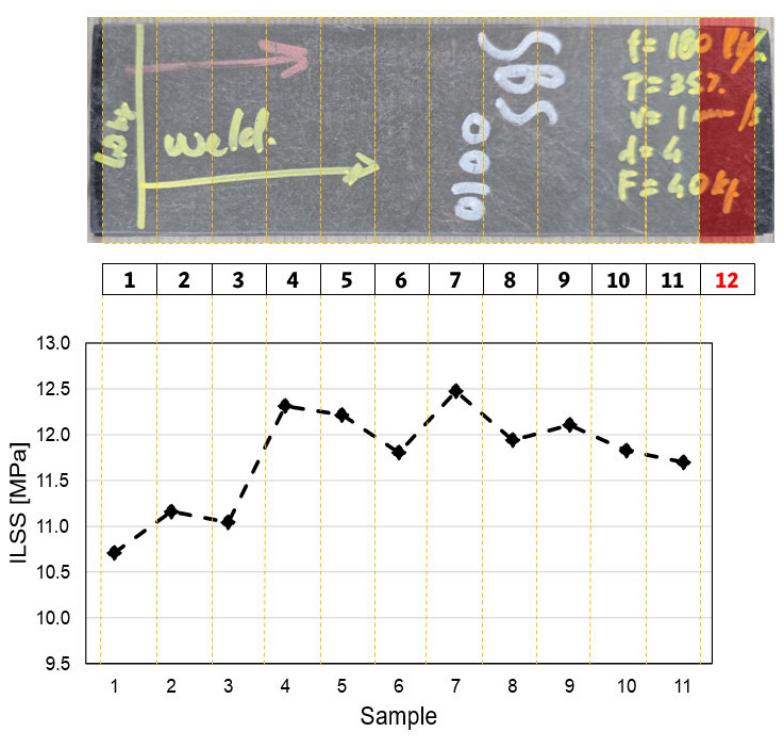
Figure 9.
Welded short-beam specimen S_A_03: force-displacement curve with the corresponding damage events identified on the cross-section after testing. The orange dotted line marks the position of the welding line.
Figure 9.
Welded short-beam specimen S_A_03: force-displacement curve with the corresponding damage events identified on the cross-section after testing. The orange dotted line marks the position of the welding line.
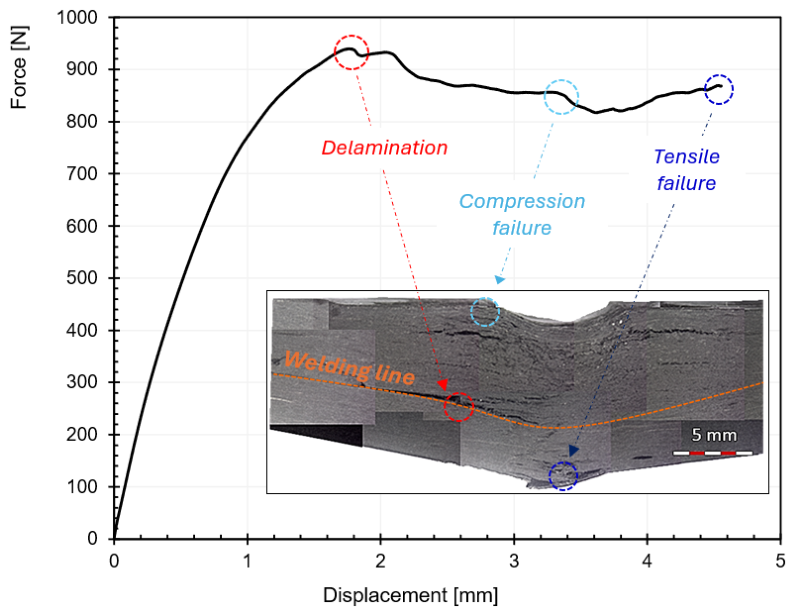
Figure 10.
Mode I fracture behaviour of the welded double cantilever beam coupon D_E: (a) Delamination-resistance curves (R-curves), red symbols mark the initiation value; (b) force-displacement curves.
Figure 10.
Mode I fracture behaviour of the welded double cantilever beam coupon D_E: (a) Delamination-resistance curves (R-curves), red symbols mark the initiation value; (b) force-displacement curves.
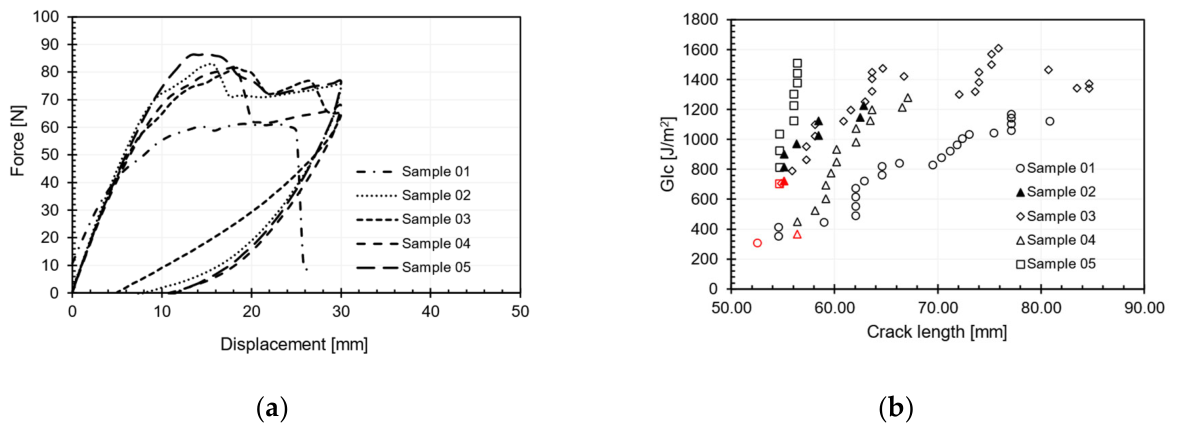
Figure 11.
Welded double cantilever beam specimen: (a) welded interface; (b) specimens D_E_03 during test final crack length 84.6 mm.
Figure 11.
Welded double cantilever beam specimen: (a) welded interface; (b) specimens D_E_03 during test final crack length 84.6 mm.
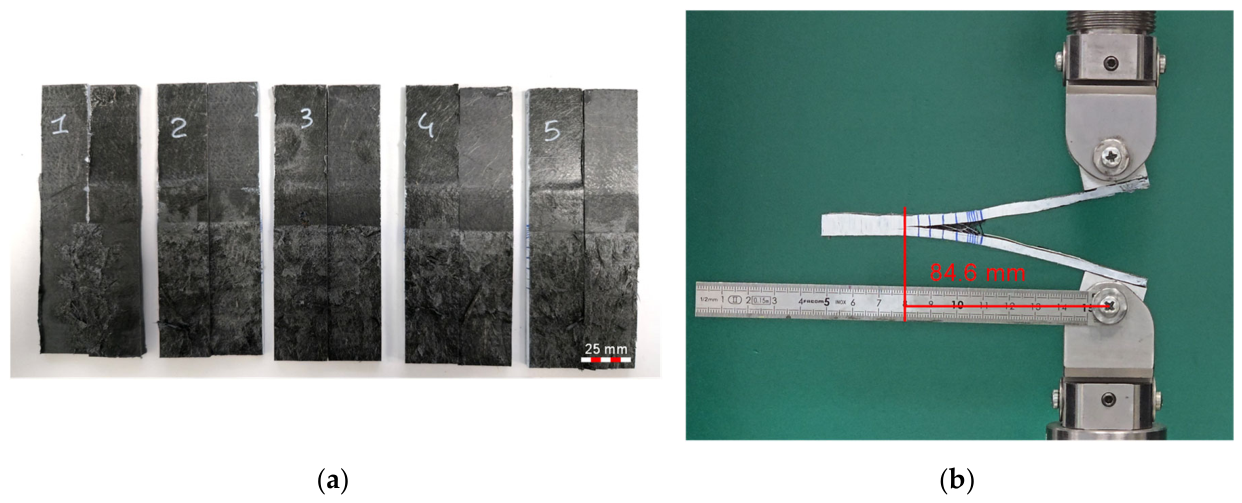
Figure 12.
Fracture surface of a single-lap specimen (L_E_d_02): (a) disassembled joint; (b) region affected by the welding process; (c) unaffected base material.
Figure 12.
Fracture surface of a single-lap specimen (L_E_d_02): (a) disassembled joint; (b) region affected by the welding process; (c) unaffected base material.
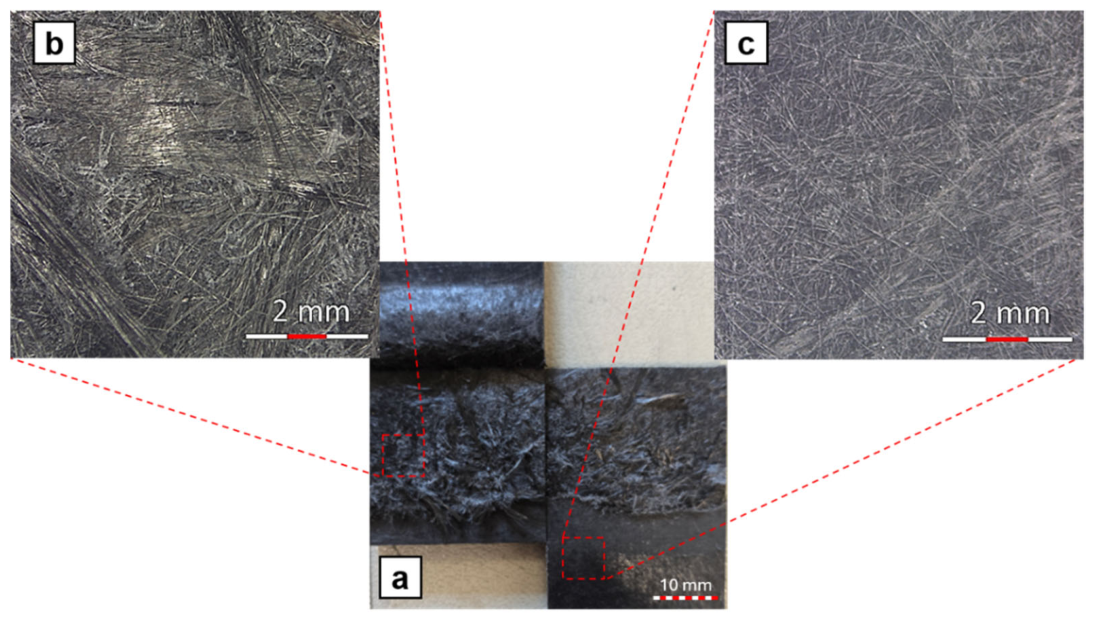
Figure 13.
Welded LSS specimen: Post-test single-lap shear specimens L_E_d showing the fractured overlap regions. The nominal welded area ( = 625 mm²) corresponds to the designed overlap. The effectively welded area () was measured on the fracture surface of each joint and used for shear strength calculation.
Figure 13.
Welded LSS specimen: Post-test single-lap shear specimens L_E_d showing the fractured overlap regions. The nominal welded area ( = 625 mm²) corresponds to the designed overlap. The effectively welded area () was measured on the fracture surface of each joint and used for shear strength calculation.
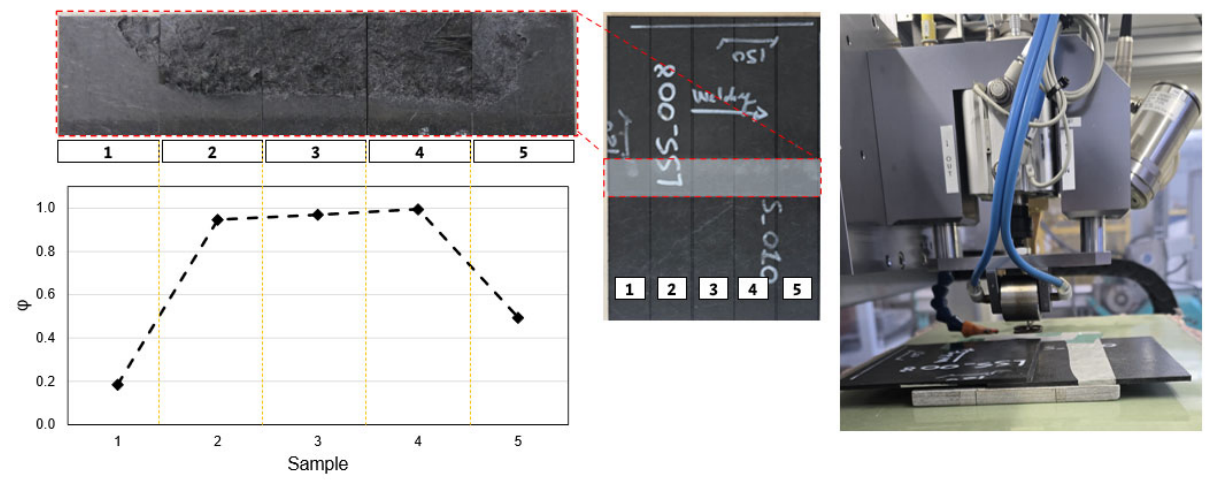
Figure 14.
Fracture surface, E_E_l_2: (a) welded zone; (b) unaffected base material.
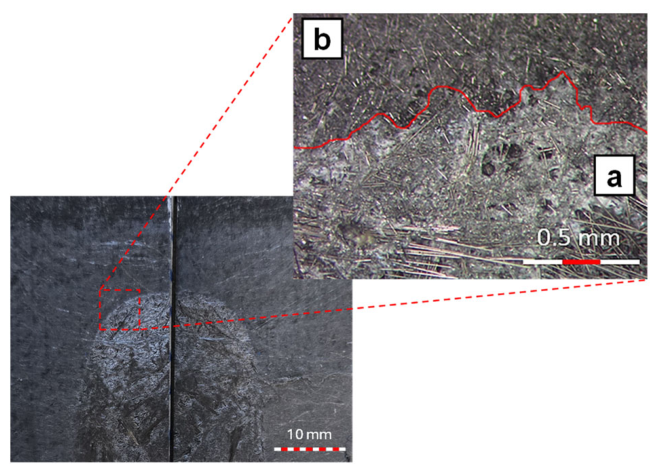
Figure 15.
Fracture surface, E_E_d_2: (a) welded zone; (b) unaffected base material.
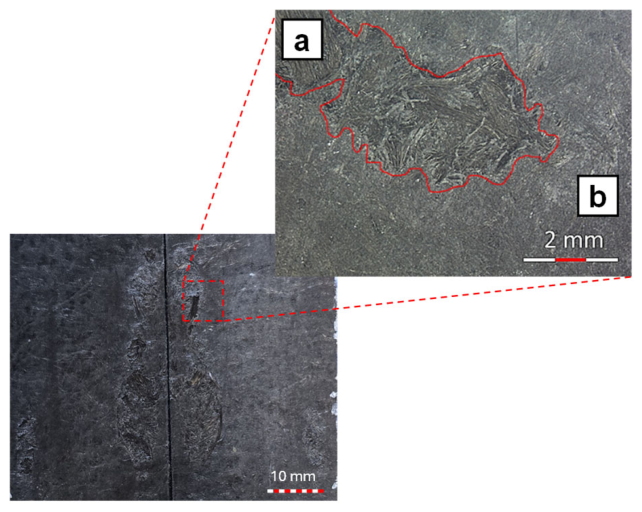
Figure 16.
Fracture surfaces of the ENF (Mode II) coupon E_E_d showing the effectively welded width. The nominal specimen width ( = 25 mm) is compared with the effective welded width () measured on each fractured interface. Red lines referes to sample E_E_d_01.
Figure 16.
Fracture surfaces of the ENF (Mode II) coupon E_E_d showing the effectively welded width. The nominal specimen width ( = 25 mm) is compared with the effective welded width () measured on each fractured interface. Red lines referes to sample E_E_d_01.
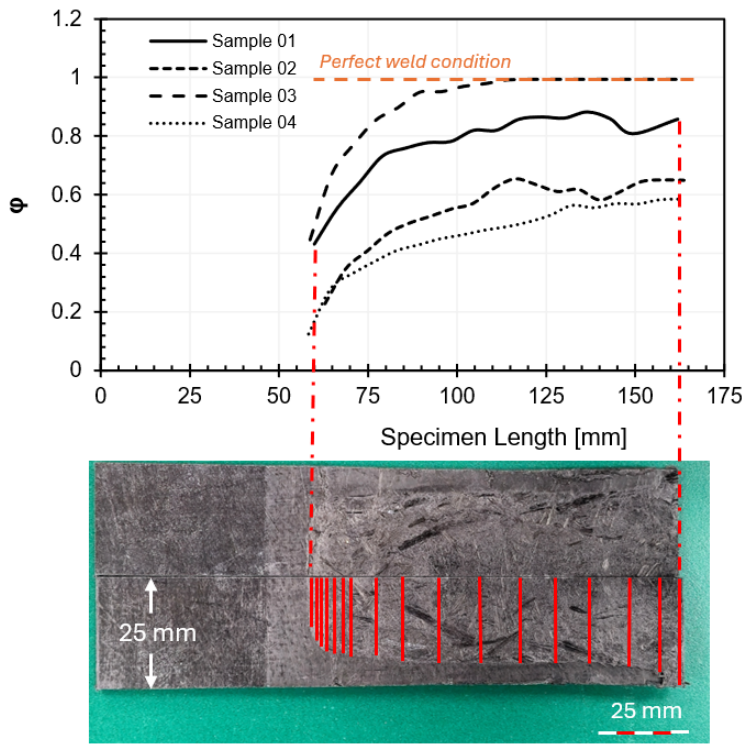

Table 1.
Test matrix of the base laminate: standards and specimen geometry.
| Test | Standard | Nominal specimen dimension | Span [mm] | Rate | Dir. |
|---|---|---|---|---|---|
| Tensile | ASTM D3039 [22] | 250 × 25 × 3 mm | gauge 140 | 1 mm/min | L, T |
| Flexural (3PB) | ASTM D790 [23] | 100 × 12.5 × 3 mm | 80 | 1 mm/min | L, T |
| Short-beam | ASTM D2344 [24] | 40 × 12 × 3 mm | 15 | 1 mm/min | – |
| DMA (3PB) | ASTM D5023 [25] | 50 × 10 × 3 mm | – | 3 °C/min | L, T |
| DSC | ASTM D3418 [26] | 5.8 mg | – | 10 °C/min | – |
| TGA | ASTM E1131 [27] | 18 mg | – | 10 °C/min | – |
Table 2.
Process parameters of the induction welding campaign: physical role, explored range and value adopted in the optimal condition.
Table 2.
Process parameters of the induction welding campaign: physical role, explored range and value adopted in the optimal condition.
| Parameter | Physically controls | Range | Optimum |
|---|---|---|---|
| Generator power level | Magnitude of the induced field, hence the volumetric heat generation rate | 0.44-0.77 kVA | 0.77 kVA |
| Coil-to-laminate distance | Coupling efficiency and lateral spread of the field | 2-4 mm | 4 mm |
| Translation speed | Dwell time under the coil, hence energy per unit weld length | 1-2 mm/s | 1 mm/s |
| Compaction load | Intimate contact; confinement of the molten matrix and volatiles | 98-392 N | 392 N |
| Number of steps | Cumulative energy input; heat accumulation | 1-2 | 1 |
Table 3.
Welding conditions explored in the optimization campaign. Power is expressed both as the fraction of the 2.2 kVA nominal generator power set on the converter and as the corresponding apparent power.
Table 3.
Welding conditions explored in the optimization campaign. Power is expressed both as the fraction of the 2.2 kVA nominal generator power set on the converter and as the corresponding apparent power.
| Process Identifier |
Power [%] | Distance [mm] | Load [N] | Steps | Speed [mm/s] | Power [kVA] |
|---|---|---|---|---|---|---|
| A | 20 | 2 | 98 | 1 | 1 | 0.44 |
| B | 30 | 4 | 98 | 1 | 1 | 0.66 |
| C | 25 | 4 | 196 | 1 | 1 | 0.55 |
| D | 25 | 4 | 196 | 2 | 2 | 0.55 |
| E | 35 | 4 | 392 | 1 | 1 | 0.77 |
Table 4.
Legend of the first field of the coupon code: joint configuration and corresponding test.
| Coupon Configurations |
Test Type |
|---|---|
| S | Short beam test |
| L | Lap shear test |
| E | End notch |
| D | Double cantilever beam |
Table 5.
Short-beam coupons produced in the optimization campaign and corresponding specimen population.
Table 5.
Short-beam coupons produced in the optimization campaign and corresponding specimen population.
| Coupon | Configurations | Parameters | Specimens Obtained | Specimens Tested |
|---|---|---|---|---|
| S_A | S | A | 12 | 10 |
| S_B | S | B | 12 | 9 |
| S_C | S | C | 12 | 9 |
| S_D | S | D | 12 | 4 |
| S_E | S | E | 12 | 11 |
Table 6.
Welding conditions adopted for the fracture and single-lap configurations, all derived from the optimum of Section 2.4.2.
Table 6.
Welding conditions adopted for the fracture and single-lap configurations, all derived from the optimum of Section 2.4.2.
| Parameters Combination | Power [%] | Distance [mm] | Load [N] | Steps | Speed [mm/s] | Power [kVA] |
|---|---|---|---|---|---|---|
| E | 35 | 4 | 392 | 1 | 1 | 0.77 |
| E_w | 30 | 4 | 392 | 1 | 1 | 0.66 |
| E_d | 35 | 4 | 392 | 2 | 1 | 0.77 |
| E_l | 35 | 4 | 196 | 2 | 1 | 0.77 |
Table 7.
Coupons produced for the fracture and single-lap configurations.
| Coupon | Configurations | Parameters | Specimens Obtained | Specimens Tested |
|---|---|---|---|---|
| D_E | D | E | 5 | 5 |
| L_E_w | L | E_w | 5 | 2 |
| L_E_d | L | E_d | 5 | 5 |
| E_E_d | E | E_d | 5 | 4 |
| E_E_l | E | E_l | 5 | 3 |
Table 8.
Results of TGA and DSC analyses. Melting and crystallization enthalpies are normalized on the matrix weight fraction ( 65.5 wt%).
Table 8.
Results of TGA and DSC analyses. Melting and crystallization enthalpies are normalized on the matrix weight fraction ( 65.5 wt%).
| Property | Value | Property | Value |
| Residue @600 °C [wt %] | 39.5 ± 0.5 | 1st Melting Enthalpy [J/g] |
114.8 ± 1.3 |
| Wf,real [wt%] | 34.5 ± 0.5 | 2nd Melting Enthalpy [J/g] |
102.2 ± 1.7 |
| T@ Maximum Decomposition [°C] |
425.4 ± 0.5 | 1st DoC [%] | 54.9 ± 0.6 |
| Tg, DSC [°C] | 46.5 ± 0.6 | 2nd DoC [%] | 48.9 ± 0.8 |
| Tm, DSC [°C] | 164.4 ± 0.7 | Crystallization Enthalpy [J/g] | 104.1 ± 1.4 |
Table 9.
Results of density and porosity analyses.
| Description | Density [g/cm3] |
Porosity [%] |
|---|---|---|
| MAPP/60 | 0.986 ± 0.05 | 10.3 ± 0.05 |
Table 10.
Results of DMA analysis at 50 °C.
| Description | E’ @ 50 °C [GPa] |
E’’ @ 50 °C [GPa] |
Tanδ @ 50 °C [-] |
|---|---|---|---|
| MAPP/60 L | 15.7 ± 1.59 | 0.51 ± 0.02 | 0.032 ± 0.0032 |
| MAPP/60 T | 13.5 ± 1.24 | 0.50 ± 0.07 | 0.037 ± 0.0043 |
Table 11.
Mechanical properties of consolidated laminate.
| Description | Et [GPa] |
σt [MPa] |
Ef [GPa] |
σf [MPa] |
ILSS [MPa] |
|---|---|---|---|---|---|
| MAPP/60 L | 15.9 ± 0.54 | 160 ± 5.2 | 16.4 ± 0.25 | 130 ± 15 | 7.76 ± 2.24 |
| MAPP/60 T | 12.7 ± 0.39 | 118 ± 3.3 | 13.5 ± 0.33 | 120 ± 12 |
Table 12.
Results of ILSS test on welded sample.
| Coupon | ILSS [MPa] |
Maximum Load [N] |
|---|---|---|
| S_A | 9.24 ± 0.79 | 956 ± 74 |
| S_B | 8.58 ± 1.23 | 919 ± 103 |
| S_C | 10.26 ± 0.98 | 929 ± 88.4 |
| S_D | 9.02 ± 1.01 | 758 ± 126 |
| S_E | 11.73 ± 0.56 | 1195 ± 106 |
Table 13.
Mechanical response of the welded joints. is the effectively welded fraction, defined as an area ratio for the single-lap joints and as a width ratio for the fracture specimens; nominal and effective values are computed on the nominal and on the effective geometry respectively. For the double cantilever beam coupon the weld covered the entire specimen width, so that no correction applies.
Table 13.
Mechanical response of the welded joints. is the effectively welded fraction, defined as an area ratio for the single-lap joints and as a width ratio for the fracture specimens; nominal and effective values are computed on the nominal and on the effective geometry respectively. For the double cantilever beam coupon the weld covered the entire specimen width, so that no correction applies.
| Coupon | Property | φ [–] | Nominal | Effective |
|---|---|---|---|---|
| D_E | GIc [J/m2] | 1 | 560 ± 207 | 560 ± 207 |
| L_E_w | LSS [MPa] | 0.184 ± 0.129 | 0.94 ± 0.54 | 5.41 ± 0.56 |
| L_E_d | LSS [MPa] | 0.718 ± 0.363 | 4.10 ± 2.25 | 5.55 ± 0.47 |
| E_E_d | GIIc [J/m2] | 0.380 ± 0.166 | 539 ± 317 | 1720 ± 1015 |
| E_E_l | GIIc [J/m2] | 0.340 ± 0.146 | 640 ± 431 | 2245 ± 2174 |
Disclaimer/Publisher’s Note: The statements, opinions and data contained in all publications are solely those of the individual author(s) and contributor(s) and not of MDPI and/or the editor(s). MDPI and/or the editor(s) disclaim responsibility for any injury to people or property resulting from any ideas, methods, instructions or products referred to in the content. |
© 2026 by the authors. Licensee MDPI, Basel, Switzerland. This article is an open access article distributed under the terms and conditions of the Creative Commons Attribution (CC BY) license (http://creativecommons.org/licenses/by/4.0/).
Copyright: This open access article is published under a Creative Commons CC BY 4.0 license, which permit the free download, distribution, and reuse, provided that the author and preprint are cited in any reuse.