

Submitted:
15 August 2026
Posted:
17 August 2026
You are already at the latest version
Abstract
Background/Objectives: Female soccer players differ from males in body composition, muscular strength, and hormonal fluctuations, which may influence performance, fatigue, recovery, and injury risk. This study aimed to characterize metabolic changes following a winter training season (WTS) and estimate an appropriate recovery period using urinary metabolomics. Methods: Urinary metabolites in female soccer players were analyzed before, and after 1 and 7 days of WTS using nuclear magnetic resonance (NMR) spectroscopy combined with multivariate analysis. Results: A total of 84 metabolites were identified in urine samples, and distinct group separation was observed by partial least squares discriminant analysis (PLS-DA) in targeted profiling. Among these, 13 metabolites, including adenine, alanine, citrate, creatine, creatine phosphate (PCr), formate, glutamine, glycine, malonate, mannitol, taurine, trimethylamine N-oxide (TMAO), and urea, showed significant changes relative to pre-WTS. Conclusions: Of the identified metabolites, seven metabolites showed significant alterations at 1 day post-WTS and tended to recover toward baseline levels by day 7. Alanine, PCr, formate, glutamine, glycine, and malonate showed decreased levels, whereas taurine exhibited the opposite trend. Although these metabolites tended to recover toward baseline by day 7, complete metabolic recovery was not observed, suggesting that recovery following WTS may require longer than 7 days.
Keywords:
female soccer
; winter training season (WTS)
; metabolomics
; recovery
1. Introduction
Female soccer is experiencing rapid growth worldwide, steadily strengthening its status as an international sport. According to Fédération Internationale de Football Association (FIFA), the number of registered female players and viewership of international competitions are steadily increasing, indicating that female soccer is moving beyond being a mere supplementary sport to becoming an independent competitive sport [1]. In particular, the World Cup and the Olympics are fueling growing social interest and academic research on female soccer.
Female and male soccer players share the same fundamental principles; however, female soccer player requires more precise management of training load and recovery [2]. Female players differ from males in body composition, muscular strength, and hormonal fluctuations, which can influence performance, fatigue, recovery, and injury risk [3]. In addition, female players exhibit distinct physical, physiological, and match characteristics [4]. Male players generally cover greater total distances and perform more high-speed actions, whereas female players tend to experience greater second-half fatigue, along with lower pass success rates and increased ball losses [5]. Match profiles also differ, with mele’s games typically characterized by higher overall intensity, while female games show differences in build-up play and passing speed [6]. These differences are also reflected in injury patterns. Male players more frequently experience posterior thigh injuries, whereas female players are more prone to ankle and knee injuries, including a higher risk of anterior cruciate ligament (ACL) injury [7]. To manage these demands, training load in female player is commonly monitored using indicators such as GPS, heart rate, and rating of perceived exertion, although the evidence base remains relatively limited compared to male soccer player [8]. Given the high physical demands of matches—including frequent high-intensity runs, accelerations, decelerations, and directional changes—post-match recovery is particularly important. Managing fatigue, muscle soreness, and sleep are therefore critical [8]. Accordingly, training in female player should be individualized, with greater emphasis on players’ responses to load rather than simply increasing training volume.
Winter training season (WTS) is essential to counteract off-season detraining and restore and improve aerobic capacity, strength, and power. It allows players to adapt physiologically to the high running demands and repeated high-intensity efforts required during the competitive season [9]. This period is also crucial for injury prevention, especially for lower-limb and ACL injuries, by developing neuromuscular control, strength, and change-of-direction ability [10]. Adequate pre-season conditioning creates a physical base that makes in-season load more manageable and helps maintain performance with lower injury risk [11]. Therefore, structured winter training is necessary not only for physical preparation, but also for optimizing tactical understanding, decision-making, and overall team readiness. For this reason, WTS is considered an essential training component in female soccer player. However, there is limited research on the recovery period following WTS. Although Kim et al. [12] suggested a recovery period for youth soccer players, differences in sex and age make direct comparisons difficult. Therefore, further research is needed to determine the recovery period following WTS in female soccer player.
In this context, metabolomics has emerged as a powerful tool for comprehensively characterizing metabolic responses to exercise and competition [13]. By simultaneously analyzing a wide range of low-molecular-weight metabolites, metabolomic approaches provide insights into energy metabolism, amino acid turnover, oxidative stress, and inflammatory responses associated with physical exertion [14]. In soccer research, metabolomics has been increasingly applied to evaluate exercise-induced metabolic perturbations, training adaptations, and recovery processes, offering a more integrated understanding of physiological demands beyond conventional performance or biochemical markers [15]. Recent studies have begun to apply metabolomic techniques to female athletes, including female soccer players, to investigate match-related metabolic changes and sex-specific metabolic responses to high-intensity intermittent exercise [3,14]. These studies suggest that female soccer matches induce significant alterations in metabolites related to glycolysis, lipid metabolism, and amino acid pathways, reflecting the unique energetic and physiological demands placed on female players. Moreover, metabolomic profiling has shown potential for identifying biomarkers associated with fatigue, muscle damage, and recovery status, which may be particularly relevant for optimizing training load and preventing injury in female soccer player.
Therefore, the present study aims to investigate metabolic responses in female soccer players during the WTS using a metabolomics-based approach, with the goal of providing scientific evidence to support optimized training prescription, recovery management, and the sustainable development of female soccer player.
2. Materials and Methods
2.1. Subjects
Sixteen female semi-professional soccer players were included in the final analysis after one participant was excluded from the 17 initially recruited participants (Table 1). All participants were registered with the Korea Women’s Football Federation (KWFF) and competed in the WK League. Weight, height, muscle mass, body fat and body mass index (BMI) were measured using the body composition analyzer (Inbody 770, Biospace, Seoul, Korea). All participants had more than one year of soccer experience. Also, they had been participating in the club for more than 2 h a day and 5 times a week or more. This study was approved by the Ethics Committee of Dankook University in accordance with the ethical standards of the Declaration of Helsinki (DKU 2020-07-004-001).
2.2. Winter Training Season (WTS) and Urine Collection
In the WTS program, the participants performed morning training for 150 min and afternoon training for 80 min, 5 days per week for 20 days (Table 2). The morning session consisted of a 10-min warm-up, 90 min of soccer training, 40 min of tactical training, and a 10-min cool-down. The afternoon session consisted of a 10-min warm-up, 60 min of circuit training, and a 10-min cool-down. Circuit training consisted of three sets of 20 repetitions at 40% of the one-repetition maximum (1RM). The exercise protocol was based on the methods described by Gamble et al. [16] and Sternlicht et al. [17]. Urine samples were collected before WTS (Bef), after 1 day of WTS (After_1D), and after 7 days of WTS (After_7D). At each time point, urine samples were collected before 10:00 a.m. in a fasting state and immediately stored at −70 °C until analysis.
2.3. 1H NMR Spectroscopic Analysis
Urine samples were processed for 1H NMR-based metabolomic analysis according to a previously established protocol with minor modifications [12]. After thawing at 4 °C, samples were centrifuged at 900 × g for 5 min to remove insoluble materials. A total of 70 μL of D2O containing 5 mM DSS and 100 mM imidazole was then mixed with 600 μL of the urine supernatant. To inhibit microbial contamination during sample acquisition, 30 μL of 0.42% sodium azide solution was additionally introduced. Prior to spectral acquisition, all samples were adjusted to pH 6.8. NMR spectra were acquired within 48 h using a Varian Unity Inova 600 MHz spectrometer at Pusan National University. Spectral acquisition was performed using a spectral width of 24,038.5 Hz, an acquisition time of 12.53 min, 128 scans, a relaxation delay of 3 s, and a saturation power setting of 4. Raw spectra were processed using VnmrJ 4.2 software (Agilent Technologies, Santa Clara, CA, USA), including phase adjustment, baseline correction, and chemical shift calibration relative to DSS at 0 ppm. The water resonance region (δ 4.5–5.0) was excluded prior to analysis to reduce interference from residual water signals. Metabolite assignment and quantification were conducted using Chenomx NMR Suite version 4.6 (Chenomx Inc., Edmonton, AB, Canada) in conjunction with the Chenomx reference library. Relative metabolite levels were normalized to creatinine to account for variation in urine concentration among samples.
2.4. Multivariate Analysis
After quantifying each spectrum into μM, all data converted into Microsoft Excel format (Microsoft, Seattle, WA, USA) were imported into SIMCA-P (version 12.0; Umetrics Inc., Kinnelon, NJ, USA) for multivariate statistical analysis. To examine intrinsic variations, the data scaled using pareto scaling were visualized into principal component analysis (PCA) and (orthogonal) partial least squares-discriminant analysis ((O)PLS-DA). In addition, variable importance in projection (VIP) values, which are commonly used in partial least squares (PLS) and orthogonal partial least squares-discriminant Analysis (OPLS-DA) models to evaluate the contribution of each variable to group discrimination, were calculated using the OPLS-DA model. Metabolites with VIP values greater than 0.8 were selected as significant contributors to the observed separation between groups.
2.5. Statistical Analysis
Statistical analyses were performed using Excel 2013 (Microsoft, Windows version) and GraphPad Prism version 5.04 (GraphPad Software, San Diego, CA, USA). Differences in metabolite levels were analyzed using GraphPad Prism, and a p-value < 0.05 was considered statistically significant. Temporal changes in urinary metabolites following WTS were evaluated using one-way repeated measures ANOVA, followed by Tukey’s multiple comparison test when a significant effect of time was observed, to identify time points that differed significantly from baseline values.
3. Results
For the urine samples obtained from female soccer players, 84 metabolites were assigned using the Chenomx NMR Suite program (Table 3). The samples collected before WTS (Bef), and at 1 day (After_1D) and 7 days (After_7D) after WTS were clearly separated in the PCA and PLS-DA score plots based on target profiling analysis (Figure 1).
In the PCA plot, the separation between Bef and After_1D was primarily observed along PC1, whereas the After_7D samples showed greater dispersion and were differentiated from the Bef and After_1D groups mainly along PC3, suggesting partial metabolic recovery with inter-individual variability after 7 days of WTS. To identify the metabolic differences underlying the observed separations, VIP values were calculated using OPLS-DA for each pairwise comparison (Bef vs. After_1D, Bef vs. After_7D, and After_1D vs. After_7D) (Figure 2A-C, respectively). In addition, S-plots derived from the OPLS-DA models (Figure 2D–F) were used to visualize metabolites contributing to group separation.
Metabolites located at the extremities of the S-plots exhibited high covariance and high correlation and were considered key discriminatory variables. Based on VIP values (> 0.8), 15 metabolites were selected and were highlighted as red dots in the S-plots. Of the 15 selected metabolites, 13 were identified as significantly different among the groups by ANOVA (p < 0.05), including adenine, alanine, citrate, creatine, creatine phosphate (PCr), formate, glutamine, glycine, malonate, mannitol, taurine, trimethylamine N-oxide (TMAO), and urea (Figure 3). Most metabolites exhibited a recovery trend toward baseline levels in the After_7D group, whereas adenine and creatine remained markedly altered. Among them, alanine, PCr, formate, glutamine, glycine, malonate, and taurine showed significant recovery, suggesting partial restoration of exercise-induced metabolic perturbations within 7 days following WTS.
4. Discussion
Targeted profiling of 84 urinary metabolites in female soccer players revealed clear discrimination among the three groups: before the WTS (Bef), 1 day after WTS (After_1D), and 7 days after WTS (After_7D). The greatest separation was observed between the Bef and After_1D groups by PC1 or PLS1 (Figure 1). These metabolic alterations were identified after completion of a 20-day WTS intervention involving 3-hour training sessions performed 5 days per week. Urinary urea, TMAO, mannitol and PCr were mainly affected by WTS (Figure 2A and D), and exercise-induced increases in these metabolites have previously been reported in athletes, reflecting coordinated metabolic adaptations to physiological stress.
The elevated urea levels suggest enhanced amino acid catabolism and nitrogen disposal via the urea cycle (Figure 4), likely due to increased reliance on protein metabolism when energy demand exceeds carbohydrate availability. In this study, some amino acids such as alanine, glutamine and glycine were most highly increased in After_1D (Figure 3), suggesting increased protein breakdown and subsequent amino acid utilization for energy production and nitrogen disposal, as well as metabolic adaptation during recovery following intensive training. Of these metabolites, alanine is a key component of the glucose–alanine cycle (Figure 4), in which amino groups generated during exercise are transported from skeletal muscle to the liver [18,19]. In the liver, alanine serves as a substrate for gluconeogenesis, while its amino group is removed through the urea cycle. Therefore, the increase in alanine may reflect enhanced amino acid catabolism and gluconeogenic activity following exercise. Another amino acid, glutamine, serves as a key nitrogen carrier [20]. Through its conversion to glutamate and subsequently to α-ketoglutarate, glutamine can contribute to the replenishment of TCA cycle intermediates and energy production. Therefore, the increased glutamine level may reflect enhanced amino acid turnover and metabolic adaptation in response to exercise-induced energy demands. The last selected amino acid, glycine, contributes to activation of the arginine–glycine–creatine pathway (Figure 4) [21]. In the first step of this pathway, glycine combines with arginine to form guanidinoacetate, which is subsequently converted to creatine. As creatine and PCr play critical roles in rapid ATP regeneration during high-intensity exercise, the increased glycine level may reflect enhanced creatine turnover and metabolic adaptation to exercise-induced energy demands. In addition, during this process, the conversion of arginine and glycine to guanidinoacetate generates ornithine, a key intermediate of the urea cycle. Therefore, increased glycine metabolism may be associated with enhanced nitrogen disposal and ammonia detoxification following exercise. Collectively, these findings indicate that amino acid metabolism was markedly altered following WTS, reflecting coordinated adaptations in energy production, nitrogen transport, creatine turnover, and recovery processes.
As mentioned above, exercise promotes amino acid catabolism, during which ammonia is produced as a major metabolic byproduct. Because ammonia is highly toxic, it must be detoxified and eliminated from the body via the urea cycle [22]. In this process, ammonia is first incorporated into carbamoyl phosphate and subsequently combines with ornithine to form citrulline, ultimately leading to the production of urea from arginine by arginase (ARG1), which is excreted by the kidneys. In parallel, arginine is also utilized in creatine biosynthesis, where it combines with glycine to form guanidinoacetate and ornithine via arginine:glycine amidinotransferase (AGAT). Exercise can promote this process by inducing transient muscle damage and inflammatory responses, followed by activation of anti-inflammatory and tissue repair pathways. During muscle tissue damage and inflammation, ARG1 is upregulated and contributes to collagen formation, wound healing, and cellular repair [23].
Moreover, exercise-induced hypoxia has been reported to downregulate AGAT expression in rats, potentially altering creatine synthesis and PCr/creatine metabolism. In line with these metabolic adaptations, the increase in urinary PCr-related metabolites may reflect activation of the phosphagen energy system, particularly during high-intensity or repeated exercise, resulting in increased turnover of high-energy phosphate compounds [24]. In muscle cells, creatine is phosphorylated to PCr by creatine kinase, serving as a rapidly available energy buffer [25]. Although PCr is rapidly utilized and degraded within muscle cells during exercise, the transient increase in urinary PCr-related metabolites may reflect elevated phosphagen turnover associated with intense muscular activity.
Mannitol is primarily derived from dietary sources and is partially absorbed in the intestine, after which it is excreted largely unchanged in urine due to minimal metabolism and limited renal reabsorption [26]. The decrease of mannitol may be associated with exercise-induced alterations in osmotic balance and hydration status, as well as changes in renal handling and gastrointestinal permeability [27]. Exercise-induced reductions in splanchnic blood flow may lead to intestinal damage and altered intestinal permeability, which can alter the absorption patterns of small molecules such as mannitol. Although the exact mechanism underlying the decrease in urinary mannitol remains unclear, it may be associated with exercise-induced changes in intestinal absorption and renal excretion.
In cells, trimethylamine N-oxide (TMAO), a gut microbiota-derived metabolite, is involved in maintaining cellular osmotic balance under conditions of physiological stress [28], and its decrease may reflect adaptive osmotic regulation and cellular stress responses induced by exercise [29]. Exercise has been shown to modulate gut microbiota composition and metabolite profiles, potentially influencing microbiota-derived metabolites such as TMAO [30]. However, TMAO levels were not significantly altered following acute intermittent exercise, suggesting that its response may depend on exercise intensity, duration, or cumulative physiological stress. Collectively, these metabolite alterations highlight the integration of energy metabolism, nitrogen turnover, osmotic regulation, and gut–liver axis activity in response to exercise in female athletes. These findings provide insight into systemic metabolic responses associated with training load and recovery processes.
In addition, the decrease in urinary taurine after exercise may reflect increased utilization and renal reabsorption of taurine, given its roles in antioxidant defense, osmotic regulation, and muscle function. Cuisinier et al. [31] reported that plasma taurine increased immediately after a marathon and remained elevated 24 hours later, whereas urinary taurine excretion increased immediately post-race but returned toward or below baseline after 24 hours. They also found that taurine clearance was significantly reduced at 24 hours, suggesting altered renal handling of taurine after exhaustive exercise. These findings suggest that the post-marathon elevation in plasma taurine was accompanied by changes in renal taurine handling, with reduced urinary taurine clearance and excretion at 24 hours. In a recent review of human studies [32], taurine supplementation was associated with reduced delayed-onset muscle soreness, lower creatine kinase, and improved oxidative stress markers in several trials, suggesting a potential role in recovery after exercise; however, overall findings were mixed and appear to depend on dose and timing of ingestion.
As mentioned above, amino acid catabolism is increased during exercise and may contribute to enhanced flux through one-carbon metabolism, particularly via serine and glycine pathways, leading to the production of formate [33]. The increases in citrate, malonate, and formate observed after exercise may collectively reflect enhanced mitochondrial metabolism and altered energy-related metabolic flux induced by exercise stress. Citrate is associated with increased TCA cycle activity [34], whereas malonate and formate may reflect transient changes in mitochondrial regulation and amino acid oxidation [35].
Interestingly, the temporal pattern of alanine observed in this study differed from that reported in youth soccer players [12], where alanine levels peaked several days after training. Although training load was comparable between the youth and female soccer players, this discrepancy may be attributed to differences in metabolic response and recovery kinetics, as alanine reflects both acute metabolic responses and post-exercise recovery processes [36]. Differences in training structure, including the frequency of match play in the youth cohort, may have resulted in greater cumulative fatigue, which could contribute to the delayed alanine peak. In addition, differences in muscle mass between groups may also partly contribute to the observed variation in alanine levels. As alanine is primarily synthesized and released from skeletal muscle, with its release increasing in response to exercise intensity and workload [37], lower muscle mass in younger athletes (15.8 ± 1.8 kg) compared with female soccer players (25.3 ± 3.06 kg) may influence the magnitude and timing of alanine release. In addition, age-related physiological differences may further affect these responses, as younger athletes are characterized by higher rates of protein turnover and ongoing growth-related metabolic activity, which can alter recovery kinetics and delay the peak of alanine following exercise [36,37]. However, these differences are more likely driven by variations in metabolic kinetics rather than muscle mass or age alone.
During prolonged and intensive exercise, increased production of reactive oxygen species (ROS) and activation of immune responses can contribute to exercise-induced muscle damage [38]. Consequently, exercise-induced metabolic alterations may serve as indicators of muscle damage and subsequent recovery processes. Jang et al. [39] investigated urinary metabolic changes following exercise-induced muscle damage (EIMD) in both male and female participants and identified adenine, glycine, phosphocreatine (PCr), and citrate as potential biomarkers. Notably, these metabolites were also identified in the present study. Therefore, the observed alterations in these metabolites may reflect muscle damage and associated metabolic adaptations induced by WTS. These data suggested that the observed metabolic alterations may reflect not only increased energy demands but also muscle repair and recovery processes after intensive training.
When urinary metabolites were monitored for up to 7 days after exercise, 7 out of the 15 metabolites (alanine, PCr, formate, glutamine, glycine, malonate, and taurine) showed significant recovery patterns by day 7 (Figure 3). However, adenine and creatine dramatically increased in the After_7D group compared to bef or After_1D group. It might suggest that the associated metabolic pathway remained active during the recovery period, rather than returning immediately to the pre-exercise state [40]. The progressive increase in urinary adenine during the recovery period may reflect sustained purine nucleotide turnover following exercise. As ATP degradation products continue to be recycled through the purine salvage pathway, elevated adenine excretion may indicate ongoing remodeling of nucleotide metabolism required for restoration of intracellular adenine nucleotide pools. In addition, creatine plays a central role in the creatine kinase/PCr system, which buffers cellular ATP availability during and after exercise [41]. The delayed increase in urinary creatine may reflect ongoing restoration of skeletal muscle creatine pools and continued metabolic remodeling associated with recovery. During the recovery period, creatine synthesis, transport, and utilization may become more active, resulting in increased creatine turnover and potentially greater urinary creatine excretion. Although urinary creatine does not directly reflect intramuscular creatine content, the sustained elevation observed in the present study suggests that creatine metabolism remains active during post-exercise recovery. Consistent with the physiological importance of creatine during recovery, previous studies have demonstrated that creatine supplementation increases intramuscular creatine availability, enhances phosphocreatine resynthesis, and may improve post-exercise recovery and repeated high-intensity exercise performance [42].
In this study, most of the selected metabolites, except for a few, tended to return toward pre-exercise levels by day 7 compared to day 1 post-exercise. The selected urinary metabolites were primarily associated with energy metabolism, amino acid catabolism, osmotic regulation, and one-carbon metabolism, and have been consistently reported in previous studies as being responsive to exercise. In this study, the recovery patterns of key metabolites observed at day 7 suggest that metabolic recovery following WTS may require longer than 7 days in female soccer players.
5. Conclusions
Urinary metabolite profiling in female soccer players before and after 1 and 7 days of winter training season (WTS) was performed using NMR spectroscopy combined with multivariate analysis to estimate an appropriate recovery period. A total of 84 metabolites were identified, and distinct group separation was observed in PLS-DA. Key discriminatory metabolites included adenine, alanine, citrate, creatine, creatine phosphate (PCr), formate, glutamine, glycine, malonate, mannitol, taurine, trimethylamine N-oxide (TMAO), and urea, which are associated with energy metabolism, amino acid catabolism, osmotic regulation, and one-carbon metabolism. Among these, seven metabolites, alanine, PCr, formate, glutamine, glycine, malonate, and taurine, showed significant alterations at 1 day post-WTS and tended to recover toward baseline levels by day 7. Collectively, these findings suggest that metabolic recovery following WTS in female soccer players may require at least 7 days.
Author Contributions
Conceptualization, K.-B.K. and H.-S.L.; methodology, H.Y.K.; software, H.Y.K.; validation, H.Y.K. and J.D.L.; formal analysis, J.D.L. and S.K.; investigation, J.-S. C.; resources, J.-S. C. and G.-W. H..; data curation, H.Y.K. and S.K.; writing—original draft preparation, H.Y.K. and K.-B.K.; writing—review and editing, K.-B.K. and H.-S.L.; visualization, H.Y.K.; supervision, K.-B.K.; project administration, G.-W. H. and H.-S.L.; funding acquisition, H.Y.K., J.D.L. and K.-B.K. All authors have read and agreed to the published version of the manuscript.
Funding
This research was funded by a National Research Foundation of Korea (NRF) grants, grant number NRF-2017R1A2B4004758, NRF-2020R1I1A1A01073740, and NRF-2020R1I1A1A01072862.
Institutional Review Board Statement
The study was conducted in accordance with the Declaration of Helsinki, and approved by the Ethics Committee of Dankook University (DKU 2020-07-004-001).”
Informed Consent Statement
Informed consent was obtained from all subjects involved in the study.
Data Availability Statement
The original contributions presented in the study are included in the article; further inquiries can be directed to the corresponding authors.
Acknowledgments
This work was supported by a National Research Foundation of Korea (NRF) grants (NRF-2017R1A2B4004758, NRF-2020R1I1A1A01073740, and NRF-2020R1I1A1A01072862) funded by the Korea government (MEST).
Conflicts of Interest
The authors declare no conflicts of interest.
Abbreviations
| ATP ANOVA ARG1 AGAT |
Adenosine triphosphate Analysis of variance Arginase-1 Arginine:glycine amidinotransferase |
| DSS EIMD |
Sodium trimethylsilylpropanesulfonate Exercise-induced muscle damage |
| NMR (O)PLS-DA PCA PCr ROS TCA TMAO VIP |
Nuclear magnetic resonance (Orthogonal) Partial least squares-discriminant analysis Principal component analysis Creatine phosphate Reactive oxygen species Tricarboxylic acid Trimethylamine N-oxide Variable importance in projection |
| WTS | Winter training season |
References
- FIFA. FIFA Women's Benchmarking Report 2023. Available online: https://www.scribd.com/document/674563151/FIFA-Women-s-Benchmarking-Report-2023.
- Randell, R.K.; Clifford, T.; Drust, B.; Moss, S.L.; Unnithan, V.B.; De Ste Croix, M.B.A.; Datson, N.; Martin, D.; Mayho, H.; Carter, J.M.; Rollo, I. Physiological Characteristics of Female Soccer Players and Health and Performance Considerations. A Narrat. Rev. Sports Med. Epub. 2021, 51(7), 1377–1399. [Google Scholar] [CrossRef] [PubMed] [PubMed Central]
- Devries, M.C. Sex-based differences in endurance exercise muscle metabolism: impact on exercise and nutritional strategies to optimize health and performance in women. Exp. Physiol. 2016, 101(2), 243–9. [Google Scholar] [CrossRef] [PubMed]
- Harkness-Armstrong, A.; Till, K.; Datson, N.; Myhill, N.; Emmonds, S. A systematic review of match-play characteristics in women's soccer. PLoS ONE 2022, 17(6), e0268334. [Google Scholar] [CrossRef] [PubMed] [PubMed Central]
- Bradley, P.S.; Dellal, A.; Mohr, M.; Castellano, J.; Wilkie, A. Gender differences in match performance characteristics of soccer players competing in the UEFA Champions League. Hum. Mov. Sci. 2014, 33, 159–71. [Google Scholar] [CrossRef] [PubMed]
- Garnica-Caparrós, M.; Memmert, D. Understanding gender differences in professional European football through machine learning interpretability and match actions data. Sci. Rep. 2021, 11(1), 10805. [Google Scholar] [CrossRef] [PubMed] [PubMed Central]
- Zech, A.; Hollander, K.; Junge, A.; Steib, S.; Groll, A.; Heiner, J.; Nowak, F.; Pfeiffer, D.; Rahlf, A.L. Sex differences in injury rates in team-sport athletes: A systematic review and meta-regression analysis. J. Sport Health Sci. Epub. 2022, 11(1), 104–114. [Google Scholar] [CrossRef] [PubMed] [PubMed Central]
- Costa, J.A.; Rago, V.; Brito, P.; Figueiredo, P.; Sousa, A.; Abade, E.; Brito, J. Training in women soccer players: A systematic review on training load monitoring. Front Psychol. 2022, 13, 943857. [Google Scholar] [CrossRef] [PubMed] [PubMed Central]
- Belamjahad, A.; Tourny, C.; Jebabli, N.; Clark, C.C.T.; Laher, I.; Hackney, A. C.; Granacher, U.; Zouhal, H. Effects of a Preseason Neuromuscular Training Program vs. an Endurance-Dominated Program on Physical Fitness and Injury Prevention in Female Soccer Players. Sports Med. Open 2024, 10(1), 76. [Google Scholar] [CrossRef] [PubMed] [PubMed Central]
- Belamjahad, A.; Tourny, C.; Hackney, A.C.; Jebabli, N.; Chariba, N.; Laziri, F.; Saeidi, A.; Laher, I.; Granacher, U.; Zouhal, H. Preseason neuromuscular versus endurance training leads to greater improvements in isokinetic strength, muscle damage, and inflammation parameters in highly trained female soccer players. BMC Sports Sci. Med. Rehabil. 2025, 17(1), 107. [Google Scholar] [CrossRef] [PubMed] [PubMed Central]
- Stanković, M.; Čaprić, I.; Katanić, B.; Špirtović, O.; Maljanović, D.; Nailović, H.; Muković, I.; Jelaska, I.; Trajković, N. Proprioceptive training methods (PTM) in female soccer players - a systematic review. BMC Sports Sci. Med. Rehabil. 2024, 6(1), 101. [Google Scholar] [CrossRef] [PubMed] [PubMed Central]
- Kim, H.Y.; Lee, J.D.; Lee, Y.H.; Seo, S.W.; Lee, H.S.; Kim, S.; Kim, K.B. Urinary Metabolomics in Young Soccer Players after Winter Training Season. Metabolites 2022, 12(12), 1283. [Google Scholar] [CrossRef] [PubMed] [PubMed Central]
- Yu, Z.X.; Chang, J.S.; Kim, A.R.; Lee, H.S. Targeted and Untargeted Urinary Metabolomics in Exercise Science: A Systematic Review. Exerc. Sci. 2005, 34, 95–107. [Google Scholar]
- Khoramipour, K.; Sandbakk, Ø.; Keshteli, A.H.; Gaeini, A.A.; Wishart, D.S.; Chamari, K. Metabolomics in Exercise and Sports: A Systematic Review. Sports Med. 2022, 52(3), 547–583. [Google Scholar] [CrossRef] [PubMed]
- da Cruz, J.P.; Dos Santos, F.N.; Rasteiro, F.M.; Marostegan, A.B.; Manchado-Gobatto, F.B.; Gobatto, C.A. A Metabolomic Approach and Traditional Physical Assessments to Compare U22 Soccer Players According to Their Competitive Level. Biology 2022, 11(8), 1103. [Google Scholar] [CrossRef] [PubMed] [PubMed Central]
- Gamble, P. Physical preparation for elite-level rugby union football. Strength Cond. J. 2004, 26, 10–23. [Google Scholar] [CrossRef]
- Sternlicht, E.; Rugg, S.G.; Bernstein, M.D.; Armstrong, S.D. Electromyographical analysis and comparison of selected abdominal training devices with a traditional crunch. J. Strength Cond. Res. 2005, 19(1), 157–62. [Google Scholar] [CrossRef] [PubMed]
- Henriksson, J. Effect of exercise on amino acid concentrations in skeletal muscle and plasma. J. Exp. Biol. 1991, 160, 149–165. [Google Scholar] [CrossRef]
- Blomstrand, E.; Saltin, B. Effect of muscle glycogen on glucose, lactate and amino acid metabolism during exercise and recovery in human subjects. J. Physiol. 1999, 514 Pt 1, 293–302. [Google Scholar] [CrossRef]
- Mirveis, Z.; Howe, O.; Cahill, P.; Patil, N.; Byrne, H.J. Monitoring and modelling the glutamine metabolic pathway: a review and future perspectives. Metabolomics 2023, 19(8), 67. [Google Scholar] [CrossRef] [PubMed] [PubMed Central]
- Kalhan, S.C.; Gruca, L.; Marczewski, S.; Bennett, C.; Kummitha, C. Whole body creatine and protein kinetics in healthy men and women: effects of creatine and amino acid supplementation. Amino Acids 2016, 48(3), 677–687. [Google Scholar] [CrossRef] [PubMed] [PubMed Central]
- Brosnan, J.T.; Brosnan, M.E. Creatine metabolism and the urea cycle. Mol. Genet Metab. 2010, 100 Suppl 1, S49–52. [Google Scholar] [CrossRef] [PubMed]
- Murayama, H.; Ikemoto, M.; Fukuda, Y.; Tsunekawa, S.; Nagata, A. Advantage of serum type-I arginase and ornithine carbamoyltransferase in the evaluation of acute and chronic liver damage induced by thioacetamide in rats. Clin. Chim. Acta Epub. 2007, 375(1-2), 63–8. [Google Scholar] [CrossRef] [PubMed]
- Carraro, F.; Kimbrough, T.D.; Wolfe, R.R. Urea kinetics in humans at two levels of exercise intensity. J. Appl. Physiol. (1985) 1993, 75(3), 1180–5. [Google Scholar] [CrossRef] [PubMed]
- Lygate, C.A.; Aksentijevic, D.; Dawson, D.; ten Hove, M.; Phillips, D.; de Bono, J.P.; Medway, D.J.; Sebag-Montefiore, L.; Hunyor, I.; Channon, K.M.; Clarke, K.; Zervou, S.; Watkins, H.; Balaban, R.S.; Neubauer, S. Living without creatine: unchanged exercise capacity and response to chronic myocardial infarction in creatine-deficient mice. Circ. Res. 2013, 112(6), 945–55. [Google Scholar] [CrossRef] [PubMed] [PubMed Central]
- Elia, M.; Behrens, R.; Northrop, C.; Wraight, P.; Neale, G. Evaluation of mannitol, lactulose and 51Cr-labelled ethylenediaminetetra-acetate as markers of intestinal permeability in man. Clin. Sci. (Lond) 1987, 73(2), 197–204. [Google Scholar] [CrossRef] [PubMed]
- Poortmans, J.R. Exercise and renal function. Sports Med. 1984, 1(2), 125–53. [Google Scholar] [CrossRef] [PubMed]
- Ong, M.L.Y.; Green, C.G.; Rowland, S.N.; Rider, K.; Sutcliffe, H.; Funnell, M.P.; Salzano, A.; Heaney, L.M. Effect of an acute session of intermittent exercise on trimethylamine N-oxide (TMAO) production following choline ingestion. Metabolomics 2024, 20(5), 110. [Google Scholar] [CrossRef] [PubMed] [PubMed Central]
- Petrov, E.; Rohde, P.R.; Cornell, B.; Martinac, B. The protective effect of osmoprotectant TMAO on bacterial mechanosensitive channels of small conductance MscS/MscK under high hydrostatic pressure. Channels 2012, 6(4), 262–71. [Google Scholar] [CrossRef] [PubMed] [PubMed Central]
- Tang, W.H.; Wang, Z.; Kennedy, D.J.; Wu, Y.; Buffa, J.A.; Agatisa-Boyle, B.; Li, X.S.; Levison, B.S.; Hazen, S.L. Gut microbiota-dependent trimethylamine N-oxide (TMAO) pathway contributes to both development of renal insufficiency and mortality risk in chronic kidney disease. Circ. Res. 2015, 116(3), 448–55. [Google Scholar] [CrossRef] [PubMed] [PubMed Central]
- Cuisinier, C.; Ward, R.J.; Francaux, M.; Sturbois, X.; de Witte, P. Changes in plasma and urinary taurine and amino acids in runners immediately and 24h after a marathon. Amino Acids 2001, 20(1), 13–23. [Google Scholar] [CrossRef] [PubMed]
- Kurtz, J.A.; VanDusseldorp, T. A.; Doyle, J.A.; Otis, J.S. Taurine in sports and exercise. J. Int. Soc. Sports Nutr. 2021, 18(1), 39. [Google Scholar] [CrossRef] [PubMed] [PubMed Central]
- Phelps, C.M.; Willis, N.B.; Duan, T.; Lee, A.H.; Zhang, Y.; Rodriguez, J.D.M.; Pandey, S.P.; Laughlin, C.R.; Rosen, A.B.I.; McPherson, A.C.; Shapira, J.H.; Randhawa, S.K.; Hedden, L.; Richie, T.G.; Wiechman, H.M.; Bender, M.J.; Nemet, I.; Zöhrer, P.A.; Gottschalk, R.A.; Schmitz, K.H.; Mullett, S.J.; Gelhaus, S.L.; Davar, D.; Zarour, H.M.; Hinterleitner, R.; Mossington, T.; Badger, J.H.; Rodrigues, R.R.; McCulloch, J.A.; Lee, S.T.M.; Wagner, K.H.; Winter, M.G.; Winter, S.E.; Das, J.; Pierre, J.F.; Trinchieri, G.; Meisel, M. Exercise-induced microbiota metabolite enhances CD8 T cell antitumor immunity promoting immunotherapy efficacy. Cell 2025, 188(20), 5680–5700.e28. [Google Scholar] [CrossRef] [PubMed] [PubMed Central]
- Howarth, K.R.; LeBlanc, P.J.; Heigenhauser, G.J.; Gibala, M.J. Effect of endurance training on muscle TCA cycle metabolism during exercise in humans. J. Appl. Physiol. (1985) 2004, 97(2), 579–84. [Google Scholar] [CrossRef] [PubMed]
- Pietzke, M.; Meiser, J.; Vazquez, A. Formate metabolism in health and disease. Mol. Metab. 2020, 33, 23–37. [Google Scholar] [CrossRef] [PubMed] [PubMed Central]
- Mazzulla, M.; Volterman, K.A.; Packer, J.E.; Wooding, D.J.; Brooks, J.C.; Kato, H.; Moore, D.R. Whole-body net protein balance plateaus in response to increasing protein intakes during post-exercise recovery in adults and adolescents. Nutr. Metab. (Lond) 2018, 15, 62. [Google Scholar] [CrossRef] [PubMed] [PubMed Central]
- Hood, D.A.; Terjung, R.L. Endurance training alters alanine and glutamine release from muscle during contractions. FEBS Lett. 1994, 340(3), 287–90. [Google Scholar] [CrossRef] [PubMed]
- Wu, J.; Ding, J.; Zhao, Z.; Wang, B.; Cheng, Y.; Li, Y.; Wang, L.; Bo, S.; Luo, A.; Zhang, C.; et al. Urinary Metabolites Variation After High-Intensity Rowing Training and Potential Biomarker Screening for Exercise-Induced Muscle Damage. Int. J. Mol. Sci. 2025, 26(16), 7897. [Google Scholar] [CrossRef]
- Jang, H.J.; Lee, J.D.; Jeon, H.S.; Kim, A.R.; Kim, S.; Lee, H.S.; Kim, K.B. Metabolic Profiling of Eccentric Exercise-Induced Muscle Damage in Human Urine. Toxicol. Res. 2018, 34(3), 199–210. [Google Scholar] [CrossRef] [PubMed] [PubMed Central]
- Zhao, S.; Snow, R.J.; Stathis, C.G.; Febbraio, M.A.; Carey, M.F. Muscle adenine nucleotide metabolism during and in recovery from maximal exercise in humans. J. Appl. Physiol. (1985) . 2000, 88(5), 1513–9. [Google Scholar] [CrossRef] [PubMed]
- Wallimann, T.; Tokarska-Schlattner, M.; Schlattner, U. The creatine kinase system and pleiotropic effects of creatine. Amino Acids 2011, 40(5), 1271–96. [Google Scholar] [CrossRef] [PubMed] [PubMed Central]
- Greenhaff, P.L.; Bodin, K.; Soderlund, K.; Hultman, E. Effect of oral creatine supplementation on skeletal muscle phosphocreatine resynthesis. Am. J. Physiol. 1994, 266 5 Pt 1, E725-30. [Google Scholar] [CrossRef] [PubMed]
Figure 1.
(A) PCA and (B) PLS-DA score plots based on identified urinary metabolites. Before: before WTS; After_1D: 1 day after WTS; After_7D: 7 days after WTS.
Figure 1.
(A) PCA and (B) PLS-DA score plots based on identified urinary metabolites. Before: before WTS; After_1D: 1 day after WTS; After_7D: 7 days after WTS.
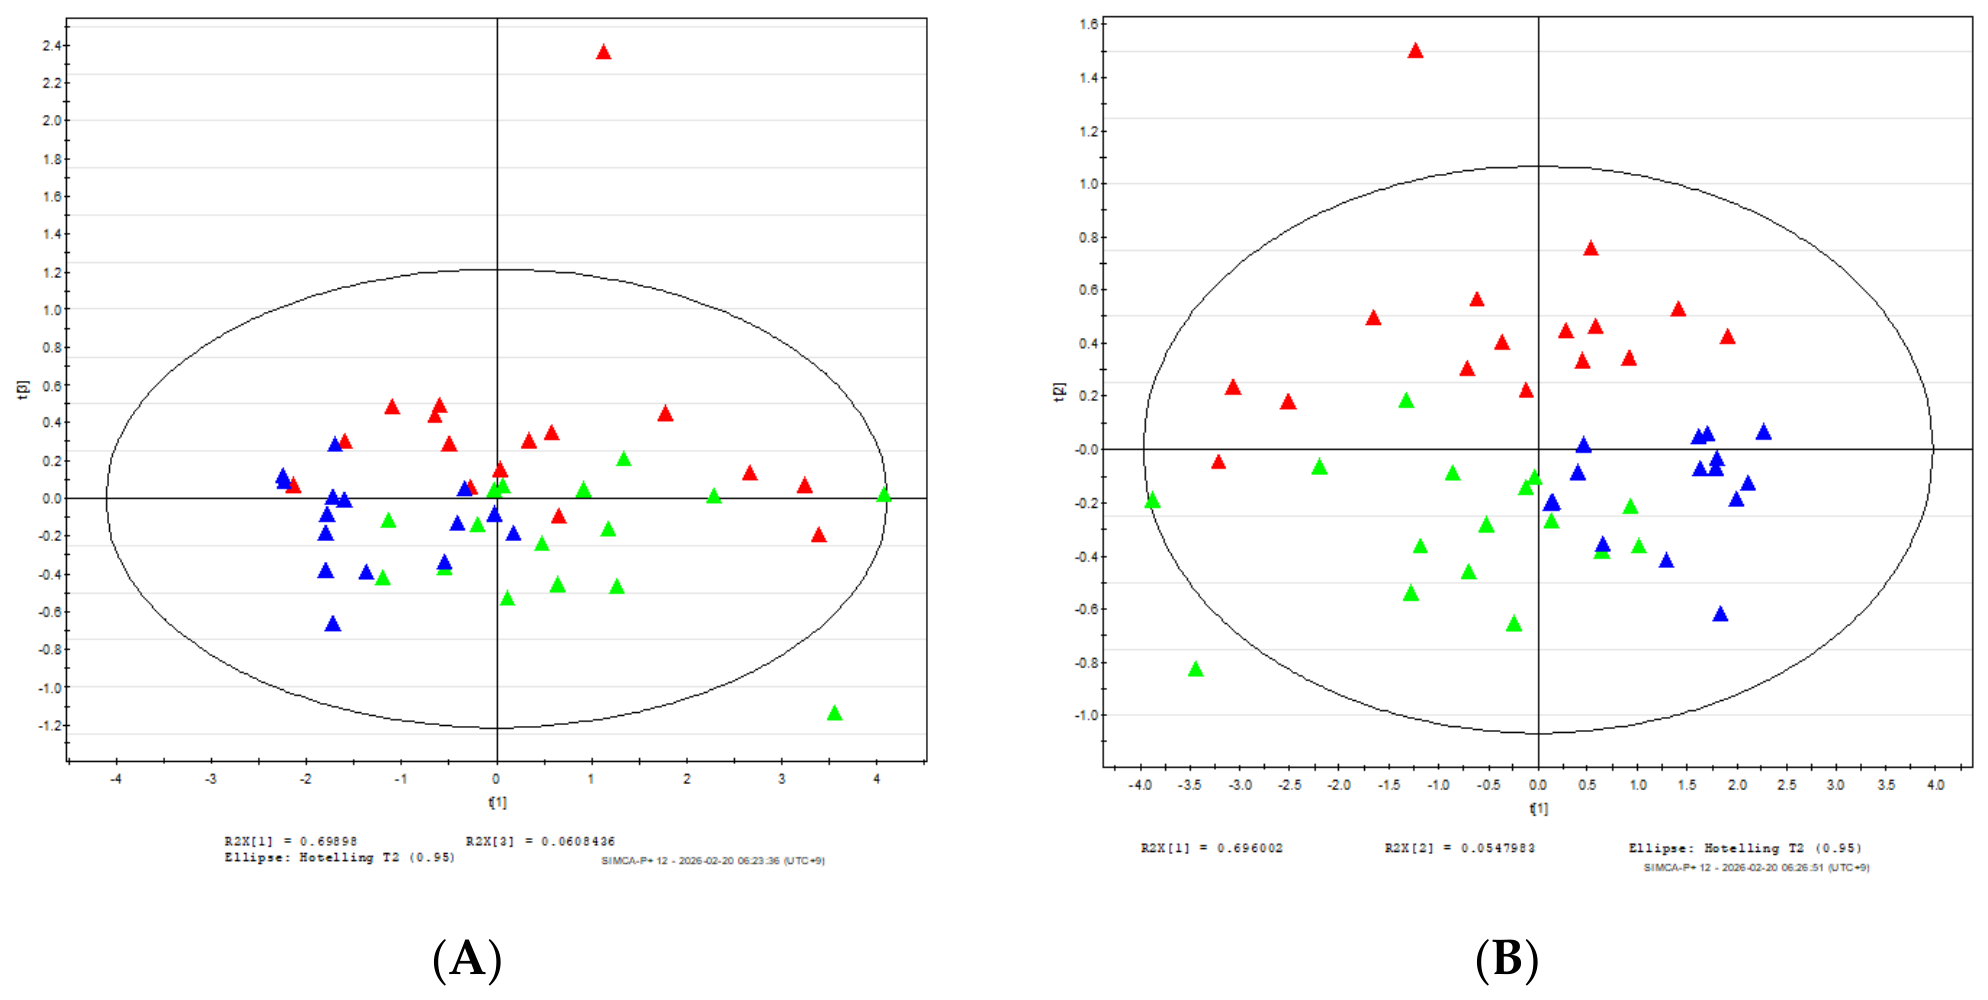
Figure 2.
OPLS-DA (A-C) and S-plot (D-F) based on identified urinary metabolites. Before: before WTS; After_1D: 1 day after WTS; After_7D: 7 days after WTS.
Figure 2.
OPLS-DA (A-C) and S-plot (D-F) based on identified urinary metabolites. Before: before WTS; After_1D: 1 day after WTS; After_7D: 7 days after WTS.
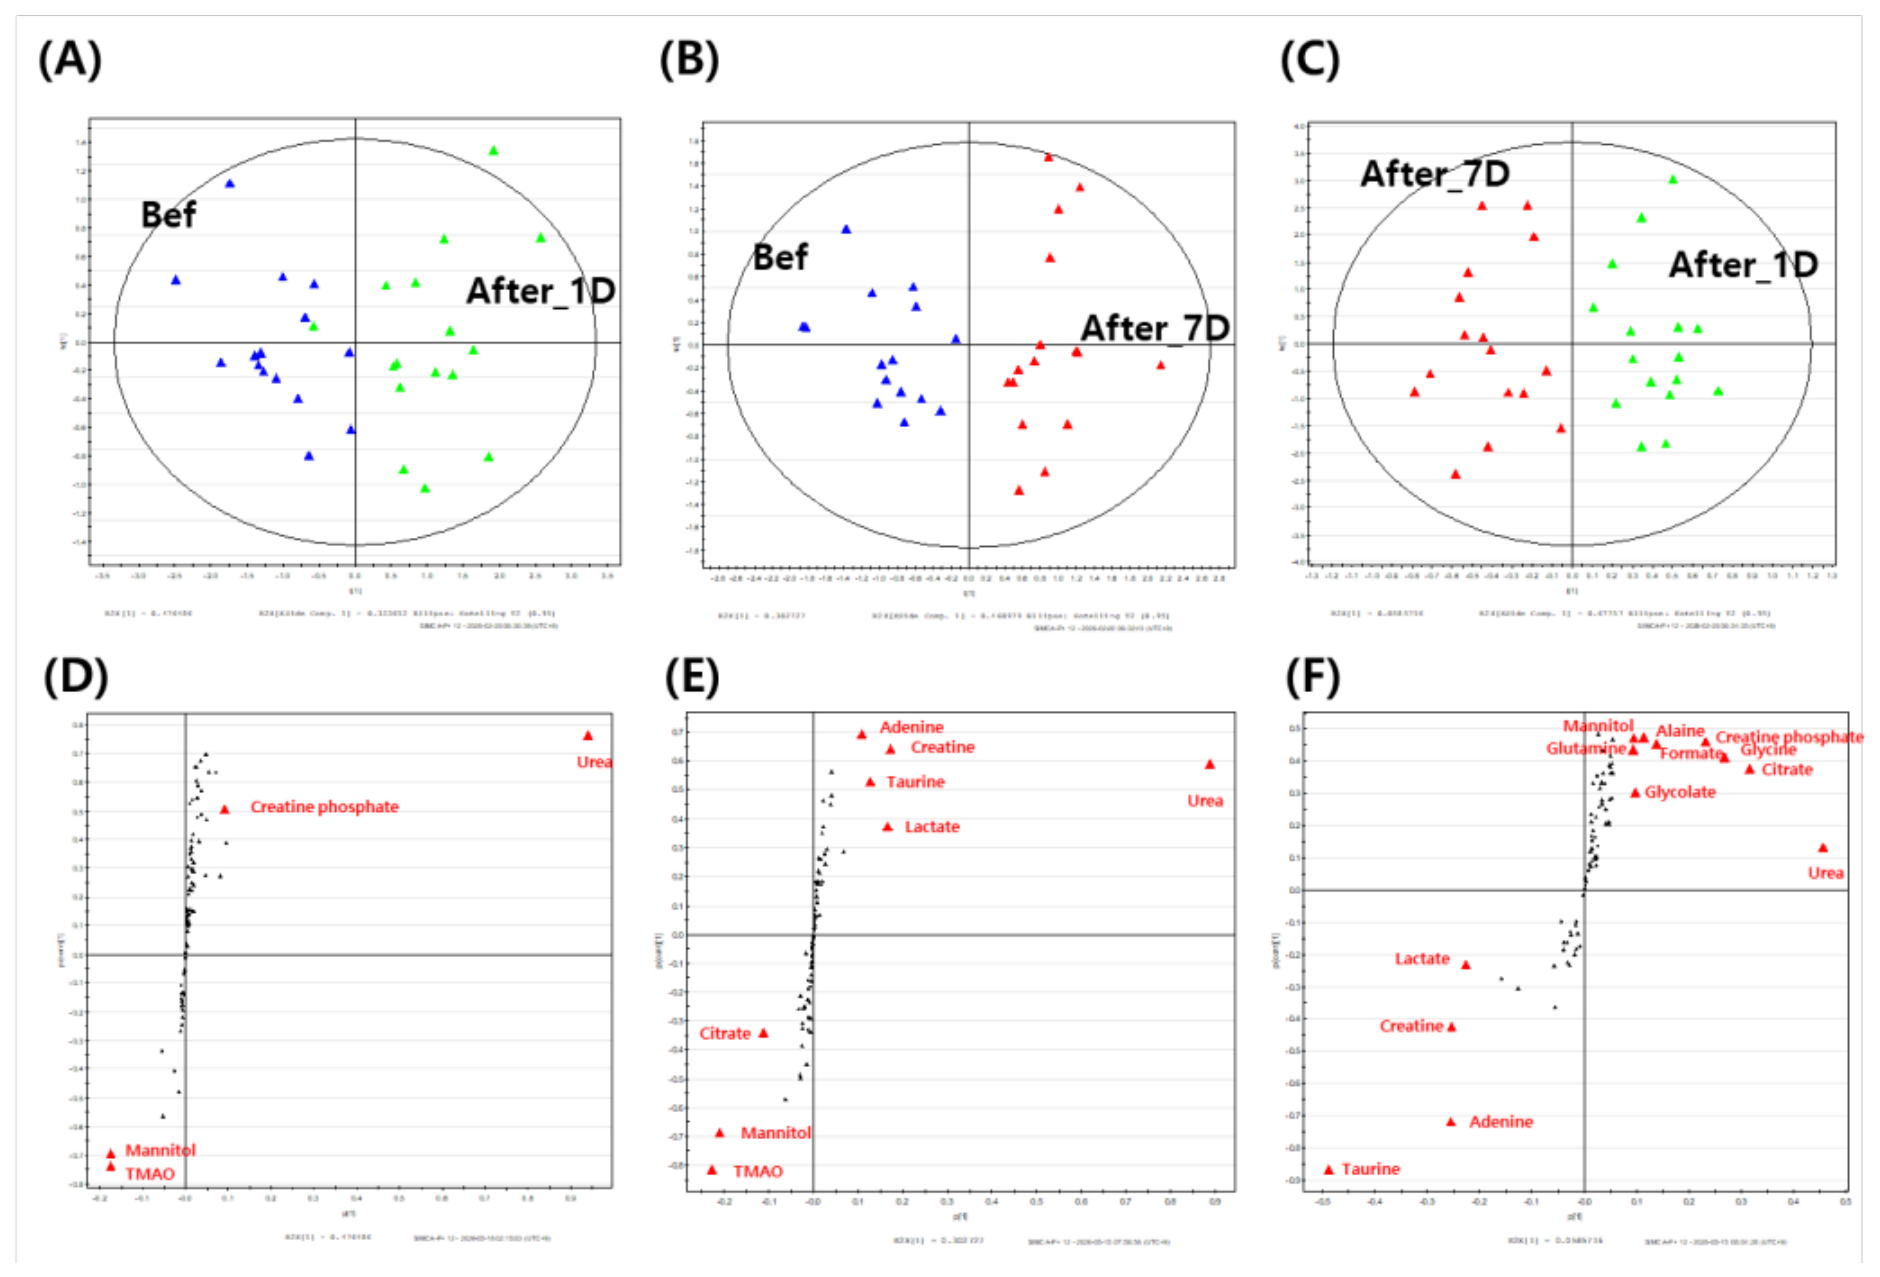
Figure 3.
(A) Dot plots of selected metabolites from OPLS-DA and (B) related metabolism. Bef: before WTS; Afte_1D: 1 day after WTS; After_7D: 7 days after WTS. *: compare to Bef, #: compare to After_1D.
Figure 3.
(A) Dot plots of selected metabolites from OPLS-DA and (B) related metabolism. Bef: before WTS; Afte_1D: 1 day after WTS; After_7D: 7 days after WTS. *: compare to Bef, #: compare to After_1D.
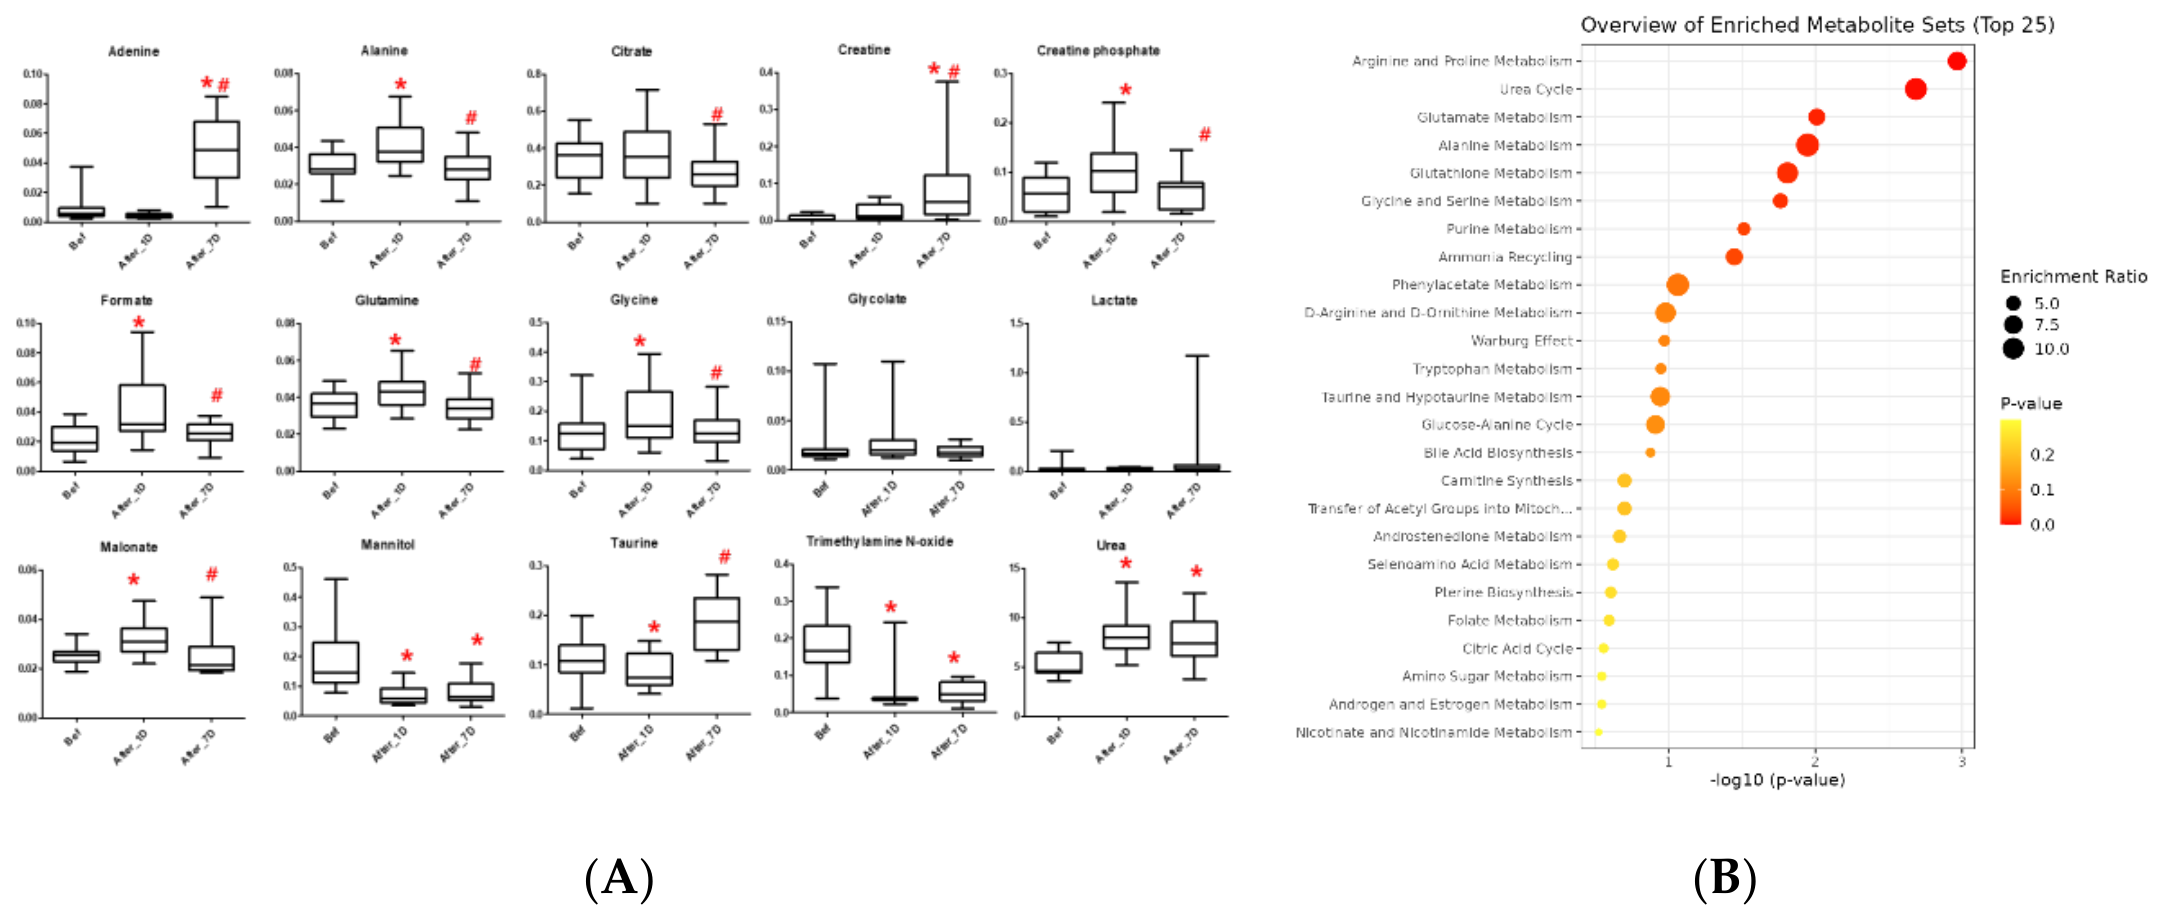
Figure 4.
Metabolic pathway of major selected metabolites. Bef: before WTS; After_1D: 1 day after WTS.
Figure 4.
Metabolic pathway of major selected metabolites. Bef: before WTS; After_1D: 1 day after WTS.
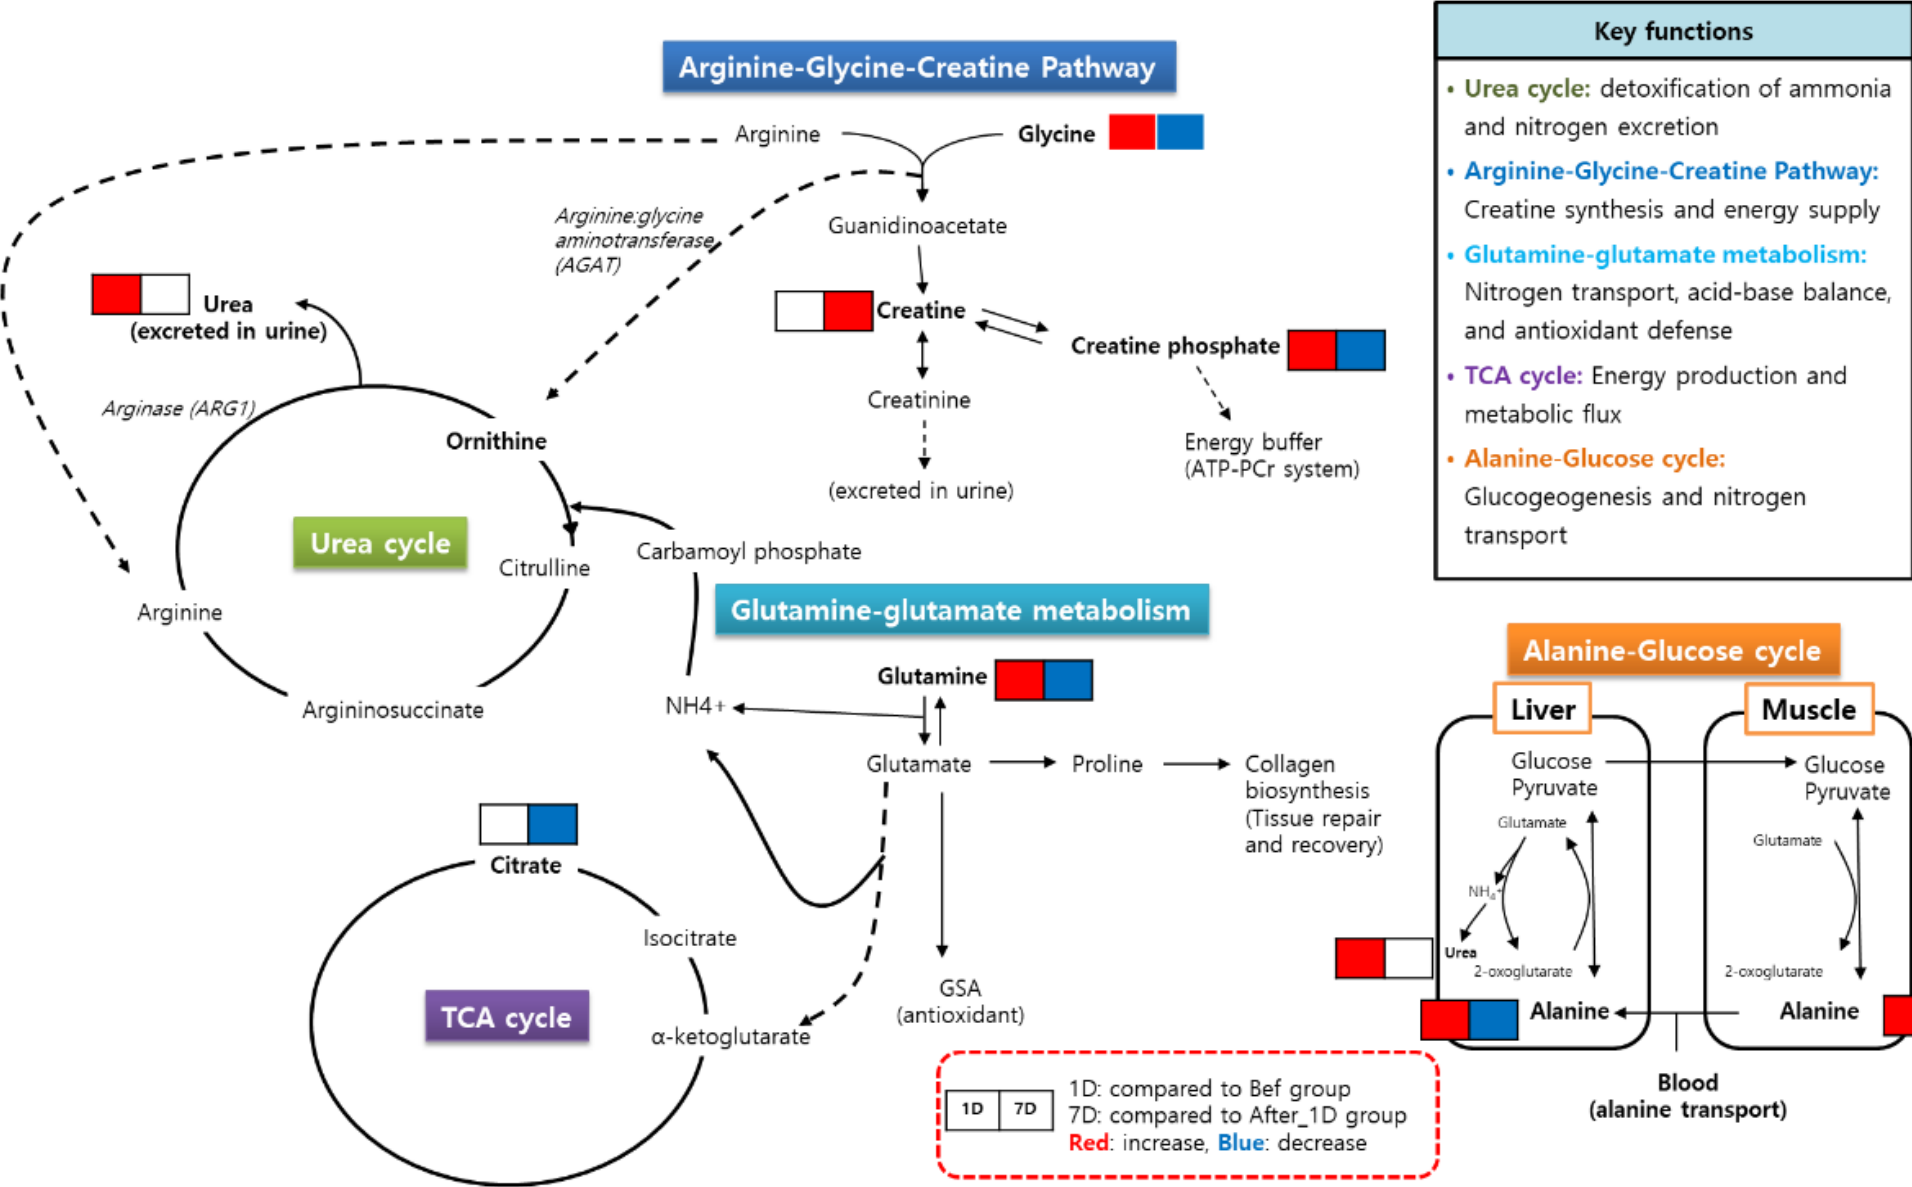

Table 1.
Physical characteristics of the subjects.
| N | Age (yrs) |
Height (cm) |
Weight (kg) |
Muscle mass (kg) |
body fat (%) |
BMI (kg/m2) |
|---|---|---|---|---|---|---|
| 17 | 27.2 ± 4.32 | 165.5 ± 7.32 | 59.6 ± 8.06 | 25.3 ± 3.06 | 14.0 ± 3.88 | 21.7 |
| means ± SD | ||||||
Table 1.
Winter training program
| Order | Type | Time | Intensity | Frequency | |
|---|---|---|---|---|---|
| Morning session |
Warm-up | Stretching, Running | 10 min | ||
| Soccer training |
Coordination | 15 min | rest between training : 5 min | 5 times / week | |
| 5:2 passing | 15 min | ||||
| Passing training | 30 min | ||||
| Passing game | 30 min | ||||
| Tactical training |
Strategies Set piece |
40 min | |||
| Cool-down | Stretching | 10 min | |||
| Afternoon session |
Warm-up | Stretching | 10 min | ||
| Circuit training |
Leg extension Leg curl Hip adduction Hip abduction Smith squat Push down Sited row Shoulder press Chest press Chin up Chest fly Arm curl Push up Sit up |
60 min | 40% 1 RM 20 reps / 3 sets rest between sets: 5 min |
||
| Cool-down | Stretching | 10 min |
Table 3.
Fold changes of urinary metabolites identified by NMR-based targeted profiling following WTS
Table 3.
Fold changes of urinary metabolites identified by NMR-based targeted profiling following WTS
| No. | Metabolites | After_1D/Bef | After_7D/Bef | After_7D/After_1D |
|---|---|---|---|---|
| 1 | 1,3-Dihydroxyacetone | 1.28 | 1.06 | 0.82 |
| 2 | 1,3-Dimethylurate | 0.82 | 0.89 | 1.09 |
| 3 | 1-Methylnicotinamide | 1.53 | 1.45 | 0.94 |
| 4 | 2-Aminoadipate | 1.05 | 0.87 | 0.83 |
| 5 | 2-Hydroxy-3-methylvalerate | 1.18 | 1 | 0.84 |
| 6 | 2-Hydroxybutyrate | 0.92 | 0.78 | 0.84 |
| 7 | 2-Hydroxyisobutyrate | 0.99 | 1.03 | 1.03 |
| 8 | 2-Hydroxyphenylacetate | 1.13 | 0.99 | 0.88 |
| 9 | 2-Octenoate | 1.38 | 1.03 | 0.74 |
| 10 | 2-Oxoglutarate | 0.55 | 0.68 | 1.22 |
| 11 | 2-Oxoisocaproate | 1.04 | 0.85 | 0.81 |
| 12 | 2-Phenylpropionate | 1.07 | 0.94 | 0.87 |
| 13 | 3-Hydroxybutyrate | 0.92 | 1 | 1.09 |
| 14 | 3-Hydroxyisovalerate | 1.14 | 1.07 | 0.93 |
| 15 | 3-Indoxylsulfate | 1.01 | 0.84 | 0.82 |
| 16 | 3-Methyl-2-oxovalerate | 1.24 | 1.08 | 0.87 |
| 17 | 3-Phenyllactate | 1.22 | 1.19 | 0.97 |
| 18 | 4-Aminobutyrate | 1.15 | 0.97 | 0.84 |
| 19 | Acetate | 1.3 | 1.37 | 1.05 |
| 20 | Acetoacetate | 0.92 | 0.8 | 0.87 |
| 21 | Acetone | 0.85 | 0.64 | 0.75 |
| 22 | Adenine | 0.56 | 5.59* | 9.9* |
| 23 | Alanine | 1.36* | 0.97 | 0.71* |
| 24 | Anserine | 1.32 | 1.15 | 0.87 |
| 25 | Arginine | 1.05 | 0.82 | 0.77 |
| 26 | Asparagine | 0.99 | 0.86 | 0.87 |
| 27 | Aspartate | 0.92 | 0.7 | 0.76 |
| 28 | Betaine | 1.28 | 1.2 | 0.94 |
| 29 | Caffeine | 1.25 | 0.9 | 0.71 |
| 30 | Carnitine | 1.06 | 0.84 | 0.79 |
| 31 | Choline | 0.97 | 0.88 | 0.9 |
| 32 | Citrate | 1.07 | 0.78 | 0.73* |
| 33 | Creatine | 2.81 | 10.61* | 3.77* |
| 34 | Creatine phosphate | 1.76* | 1.03 | 0.58* |
| 35 | Dimethyl sulfone | 1.64 | 1.46 | 0.89 |
| 36 | Dimethylamine | 0.71 | 0.77 | 1.08 |
| 37 | Ethanolamine | 1.08 | 1.12 | 1.04 |
| 38 | Ethylene glycol | 1 | 0.96 | 0.96 |
| 39 | Formate | 2.05* | 1.18 | 0.57* |
| 40 | Galactarate | 1.09 | 1.05 | 0.95 |
| 41 | Galactose | 0.94 | 1.27 | 1.34 |
| 42 | Glucose | 1.02 | 1.13 | 1.1 |
| 43 | Glutamate | 1.09 | 0.91 | 0.83 |
| 44 | Glutamine | 1.19* | 0.96 | 0.81* |
| 45 | Glutarate | 1.26 | 1.01 | 0.8 |
| 46 | Glutathione | 1.14 | 0.95 | 0.83 |
| 47 | Glycerol | 1.1 | 0.98 | 0.89 |
| 48 | Glycine | 1.35* | 0.94 | 0.69* |
| 49 | Glycolate | 1.38 | 0.85 | 0.61 |
| 50 | Hippurate | 1.28 | 1.52 | 1.18 |
| 51 | Histamine | 1.4 | 0.88 | 0.63 |
| 52 | Histidine | 0.92 | 0.85 | 0.92 |
| 53 | Isobutyrate | 1.39 | 1.36 | 0.97 |
| 54 | Lactate | 0.72 | 3.13 | 4.31 |
| 55 | Lactose | 1.58 | 1.78 | 1.12 |
| 56 | Leucine | 0.99 | 0.96 | 0.96 |
| 57 | Malonate | 1.29* | 0.98 | 0.76* |
| 58 | Maltose | 1.42 | 1.12 | 0.78 |
| 59 | Mannitol | 0.36* | 0.43* | 1.18 |
| 60 | Methionine | 1.22 | 0.93 | 0.76 |
| 61 | Methylamine | 1.08 | 0.83 | 0.77 |
| 62 | Methylguanidine | 0.81 | 1.04 | 1.28 |
| 63 | Methylmalonate | 0.89 | 0.74 | 0.83 |
| 64 | N,N-Dimethylglycine | 1.58 | 1.07 | 0.67 |
| 65 | N-Acetylglucosamine | 0.8 | 1.07 | 1.34 |
| 66 | N-Acetyltyrosine | 1.07 | 0.79 | 0.73 |
| 67 | N-Methylhydantoin | 1.81 | 1.34 | 0.73 |
| 68 | N-Nitrosodimethylamine | 1.31 | 1.05 | 0.8 |
| 69 | N-Phenylacetylglycine | 1.06 | 0.95 | 0.89 |
| 70 | O-Acetylcholine | 0.88 | 1.01 | 1.13 |
| 71 | Propylene glycol | 2.1 | 0.86 | 0.4 |
| 72 | Pyruvate | 1 | 0.94 | 0.93 |
| 73 | Succinate | 1.81 | 1.72 | 0.95 |
| 74 | Succinylacetone | 1.02 | 0.91 | 0.89 |
| 75 | Taurine | 0.76 | 1.63* | 2.12* |
| 76 | Thymol | 1.12 | 0.87 | 0.78 |
| 77 | Trigonelline | 2.05 | 1.06 | 0.51 |
| 78 | Trimethylamine | 1.5 | 1.03 | 0.68 |
| 79 | Trimethylamine N-oxide | 0.31* | 0.31* | 1 |
| 80 | Urea | 1.59* | 1.48* | 0.93 |
| 81 | Uridine | 1.56 | 0.9 | 0.57 |
| 82 | Valine | 1.13 | 1.02 | 0.9 |
| 83 | cis-Aconitate | 1.18 | 1.19 | 1 |
| 84 | trans-Aconitate | 0.78 | 0.85 | 1.09 |
* Metabolites showing significant differences according to Tukey's multiple comparison test (p < 0.05).
Disclaimer/Publisher’s Note: The statements, opinions and data contained in all publications are solely those of the individual author(s) and contributor(s) and not of MDPI and/or the editor(s). MDPI and/or the editor(s) disclaim responsibility for any injury to people or property resulting from any ideas, methods, instructions or products referred to in the content. |
© 2026 by the authors. Licensee MDPI, Basel, Switzerland. This article is an open access article distributed under the terms and conditions of the Creative Commons Attribution (CC BY) license (http://creativecommons.org/licenses/by/4.0/).
Copyright: This open access article is published under a Creative Commons CC BY 4.0 license, which permit the free download, distribution, and reuse, provided that the author and preprint are cited in any reuse.