

Submitted:
14 August 2026
Posted:
14 August 2026
You are already at the latest version
Abstract
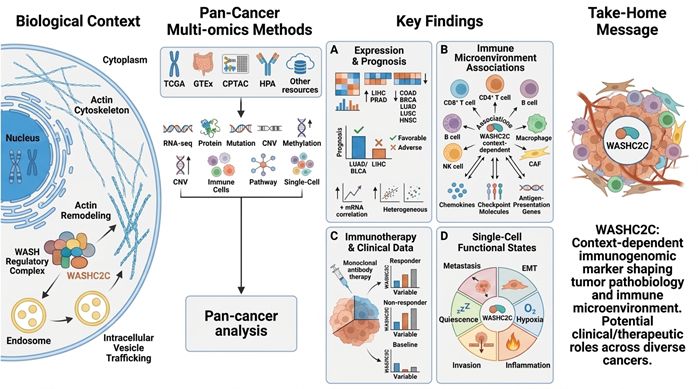
Background: Multi-omics approaches provide a comprehensive framework for resolving the molecular heterogeneity of cancer by integrating transcriptomic, proteomic, genomic, epigenetic, immunological, and cellular information. WASHC2C, a scaffold component of the WASH regulatory complex, participates in actin remodeling, endosomal trafficking, and receptor recycling; however, its molecular and clinical relevance across human cancers remains insufficiently characterized. Methods: We conducted an integrated pan-cancer multi-omics analysis of WASHC2C using TCGA, GTEx, CPTAC, the Human Protein Atlas, and complementary public resources. Transcriptomic and proteomic expression, clinicopathological characteristics, survival outcomes, somatic mutations, copy-number alterations, DNA methylation, genomic-instability features, pathway activity, immune-cell infiltration, immunoregulatory gene expression, immunotherapy-associated datasets, and single-cell functional states were systematically evaluated. Results: WASHC2C displayed marked cancer-type-specific dysregulation. Its expression was increased in LIHC and PRAD but reduced in several malignancies, including COAD, BRCA, LUAD, LUSC, and HNSC. Clinical associations were similarly context-dependent: higher WASHC2C expression was associated with favorable survival outcomes in LUAD and BLCA but adverse outcomes in LIHC. Copy-number alterations were positively correlated with WASHC2C mRNA abundance across most evaluated cancers, whereas somatic mutation and DNA-methylation patterns were heterogeneous. Immune analyses demonstrated tumor-specific associations with CD8+ and CD4+ T cells, B cells, macrophages, natural killer cells, and cancer-associated fibroblasts. WASHC2C expression was also correlated with chemokines, immune-checkpoint molecules, and antigen-presentation genes, although the direction and magnitude differed among cancer types. Immunotherapy-associated datasets showed differences among responders, non-responders, and baseline samples in selected cohorts, without a consistent pan-cancer response pattern. At single-cell resolution, WASHC2C was associated with metastasis, epithelial–mesenchymal transition, hypoxia, inflammation, invasion, and quiescence. Conclusions: Integrated multi-omics profiling identifies WASHC2C as a context-dependent molecule associated with tumor behavior, genomic regulation, microenvironmental composition, and immunotherapy-related features. These findings provide a multidimensional framework for future mechanistic and prospective validation of WASHC2C across diverse human malignancies.
Keywords:
WASHC2C
; multi-omics
; pan-cancer analysis
; tumor microenvironment
; immune-cell infiltration
; copy-number variation
; DNA methylation
; immunotherapy response
; single-cell analysis
1. Introduction
Cancer remains a major global health challenge, with approximately 20 million new cases and 9.7 million deaths estimated worldwide in 2022 [1,2]. Its clinical burden is compounded by extensive biological heterogeneity arising from tissue of origin, genomic and epigenetic alterations, cellular plasticity, microenvironmental selection, and treatment-driven evolution [3]. These interconnected factors generate substantial variation both among cancer types and between patients with the same malignancy. Consequently, molecular abnormalities identified using a single analytical layer may provide an incomplete representation of tumor biology and may not retain equivalent biological or clinical relevance across different tumor contexts.
Multi-omics analysis has therefore become increasingly important in precision oncology because it integrates complementary molecular dimensions, including genomics, transcriptomics, proteomics, epigenomics, and cellular phenotyping. Unlike single-modality studies, multi-omics approaches can determine whether an observed transcriptional alteration is supported by genomic regulation, protein-level changes, pathway activity, or clinically relevant phenotypes. Such integration can also identify molecular discordance, which may reflect post-transcriptional regulation, altered protein stability, epigenetic control, cellular heterogeneity, or microenvironmental influences. Pan-cancer multi-omics strategies are particularly valuable for distinguishing recurrent molecular mechanisms from tissue-specific alterations and for identifying candidate biomarkers whose relevance depends on tumor lineage or biological context [4,5,6,7,8,9,10,11].
WASHC2C, officially designated WASH complex subunit 2C and previously annotated as FAM21C, is a protein-coding gene located on chromosome 10q11.22. It has also been reported under alternative names, including KIAA0592 and VPEF [14,15]. The encoded protein is broadly expressed and is predominantly associated with intracellular vesicular structures, although cytosolic and nucleolar localization has also been reported [12,13,14,15]. Importantly, earlier studies frequently used the general designation FAM21 without clearly distinguishing among closely related WASHC2 paralogues. Evidence specifically involving WASHC2C must therefore be differentiated from findings concerning other FAM21-family proteins or the WASH regulatory complex as a whole.
Functionally, WASHC2C is a core component of the heteropentameric WASH regulatory complex, an actin-regulatory assembly primarily associated with endosomal membranes [16,17,18,19]. Whereas WASHC1 contains the principal VCA domain responsible for activating the Arp2/3 complex, WASHC2C primarily functions as a large scaffold and trafficking adaptor. Its extended C-terminal region interacts with retromer-associated proteins, phosphoinositide-enriched membranes, and actin-capping machinery, thereby contributing to WASH-complex recruitment, organization, and recycling [19,20,21,22,23,24]. Through these interactions, the WASH machinery coordinates endosomal actin polymerization, membrane tubule fission, cargo sorting, receptor recycling, retrograde transport, lysosomal homeostasis, and vesicular trafficking. Structural studies have further demonstrated how FAM21-family sequences connect the WASH complex with the SNX27–retromer system, providing a molecular basis for the selective recycling of membrane proteins and signaling receptors [24].
These cellular processes are highly relevant to malignant transformation and tumor progression. Actin-cytoskeleton remodeling contributes to changes in cell morphology, adhesion, polarity, migration, invasion, and metastatic dissemination. Similarly, endosomal trafficking and receptor recycling regulate the abundance, localization, and signaling duration of growth-factor receptors, integrins, transporters, and adhesion molecules. Dysregulation of these systems may sustain proliferative and survival signaling, modify nutrient acquisition, facilitate extracellular-matrix interactions, and contribute to resistance to targeted therapies. Disturbed endosome–lysosome dynamics may additionally influence autophagy, proteostasis, antigen processing, and membrane turnover. Nevertheless, functions established for the wider WASH, retromer, or sorting-nexin systems cannot automatically be attributed specifically to WASHC2C [23,25,26].
Direct experimental evidence linking WASHC2C to cancer remains limited but biologically informative. In hepatocellular carcinoma, FAM21C/WASHC2C was reported to promote invasion and metastasis by remodeling the actin cytoskeleton and inhibiting CAPZA1-mediated actin capping [27]. A nuclear pool of FAM21 has also been implicated in NF-κB-dependent transcription and drug sensitivity in pancreatic cancer cells [28]. By contrast, studies associating WASHC1 overexpression with cancer stem-cell properties and poor prognosis in esophageal carcinoma concern another WASH-complex component and provide only indirect support for WASHC2C-related cancer biology [29]. Similarly, findings indicating that FAM21-family proteins participate in dendritic-cell trafficking and receptor-dependent immune functions support biological plausibility but do not establish a specific role for WASHC2C in tumor immunity [30].
A multi-omics framework is particularly appropriate for investigating WASHC2C because no individual molecular layer can adequately define its cancer-related significance. Transcriptomic analysis can identify tumor-type-specific expression abnormalities, whereas proteomic assessment can determine whether altered RNA abundance is translated into corresponding protein-level changes. Integrating these findings with pathological stage, molecular subtype, and survival outcomes may reveal whether WASHC2C dysregulation is associated with tumor progression or clinical prognosis [31]. Concordance across molecular and clinical layers would strengthen the biological plausibility of observed associations, whereas discordance could indicate post-transcriptional regulation, protein turnover, cellular composition, or context-dependent functions.
Genomic and epigenetic alterations provide additional mechanistic dimensions. Somatic variants, copy-number gains or losses, and DNA methylation may influence WASHC2C gene dosage, chromatin accessibility, transcript abundance, or protein function [32,33,34]. Correlating copy-number and methylation states with gene expression may therefore clarify whether transcriptional dysregulation is partly driven by genomic dosage or epigenetic regulation. Broader genomic-instability features, including tumor mutational burden, microsatellite instability, homologous recombination deficiency, intratumor heterogeneity, aneuploidy, ploidy, and whole-genome duplication, may further define the molecular contexts associated with WASHC2C expression [35,36,37,38,39,40,41,42,43]. These features are relevant to tumor evolution, immune escape, treatment resistance, and response to selected therapeutic strategies, although any observed relationships remain associative rather than causal.
The tumor microenvironment adds another important layer of biological complexity. Malignant cells interact dynamically with lymphoid and myeloid populations, fibroblasts, endothelial cells, extracellular-matrix components, and soluble mediators [44,45,46,47]. Because actin remodeling and vesicular trafficking regulate immune-cell migration, receptor recycling, antigen processing, and immune-synapse organization, WASHC2C may be associated with distinct immune and stromal states [30,48]. Associations with immune-cell infiltration, immune-checkpoint molecules, chemokines, chemokine receptors, and antigen-presentation genes may help determine whether WASHC2C-high tumors exhibit inflammatory, immunosuppressive, immune-excluded, or antigen-presentation-rich phenotypes [44,45,46,47,48,49,50]. Exploratory evaluation in immunotherapy-treated cohorts may also provide preliminary evidence regarding treatment response, although differences in cancer type, therapy, sample size, and sampling time preclude definitive predictive claims [51].
Functional interpretation requires pathway-, network-, and cell-level analyses. Protein–protein interaction mapping, Gene Ontology annotation, gene-set enrichment analysis, and gene-set variation analysis can identify biological programs associated with WASHC2C [52,53,54,55]. Potentially relevant processes include actin organization, endocytosis, vesicle-mediated transport, focal adhesion, epithelial–mesenchymal transition, migration, proliferation, apoptosis, DNA-damage responses, inflammatory signaling, and immune regulation. Single-cell analysis can further distinguish WASHC2C expression in malignant, immune, stromal, endothelial, and normal parenchymal populations and assess its relationship with cellular states such as proliferation, invasion, metastasis, stemness, hypoxia, angiogenesis, inflammation, DNA repair, apoptosis, quiescence, and treatment resistance [56,57,58,59]. These analyses are essential because bulk-tissue measurements may be influenced by differences in cellular composition and may obscure cell-type-specific expression patterns.
Despite the biological importance of cytoskeletal regulation and intracellular trafficking in cancer, the pan-cancer role of WASHC2C remains poorly characterized. Therefore, the present study integrated transcriptomic, proteomic, clinicopathological, survival, genomic, epigenetic, genomic-instability, immune, pathway, and single-cell analyses. By combining orthogonal molecular and cellular layers, this comprehensive multi-omics design aimed to identify convergent evidence, clarify tumor-specific and potentially discordant patterns, and define the cancer contexts in which WASHC2C may have biological or biomarker relevance.
2. Materials and Methods
2.1. Study Design and Gene Nomenclature
An integrated pan-cancer analysis was performed to characterize the transcriptional, proteomic, clinical, genomic, epigenetic, immunological, and single-cell associations of WASH complex subunit 2C. The current HGNC-approved symbol WASHC2C was used throughout the manuscript. The former symbol FAM21C was retained only when reporting results from databases or antibodies annotated under the previous nomenclature. WASHC2C corresponds to NCBI Gene ID 253725 and Ensembl gene ID ENSG00000172661.
Publicly available data from The Cancer Genome Atlas (TCGA), Genotype-Tissue Expression (GTEx) project, Clinical Proteomic Tumor Analysis Consortium (CPTAC), cBioPortal, Human Protein Atlas (HPA), Gene Set Cancer Analysis (GSCA), SMART App, TIMER2.0, TISMO, and CancerSEA were analyzed. Only de-identified, publicly accessible datasets were used; therefore, additional institutional ethical approval and informed consent were not required. The study workflow is illustrated in Figure 1.
2.2. Data Acquisition and Gene Expression Analysis
WASHC2C expression across normal human tissues was obtained from the Genotype-Tissue Expression portal (GTEx; https://gtexportal.org/home/; accessed on 20 November 2025). Differential WASHC2C expression between tumor and corresponding adjacent normal tissues was evaluated using Tumor Immune Estimation Resource 2.0 (TIMER2.0; https://timer.cistrome.org/; accessed on 20 November 2025) and The Cancer Genome Atlas (TCGA) data available through the Genomic Data Commons portal (https://portal.gdc.cancer.gov/; accessed on 20 November 2025). In addition, uniformly processed RNA-sequencing data from TCGA and GTEx were downloaded in transcripts-per-million format from the UCSC Xena platform (https://xenabrowser.net/datapages/; accessed on 20 November 2025). These datasets were used to compare WASHC2C mRNA expression between tumor tissues and their corresponding normal-tissue controls. Statistical significance was indicated as follows: *, **, and ***, P < 0.05, P < 0.01, and P < 0.001, respectively.
2.3. Independent Validation of Differential WASHC2C Expression
Differential expression was independently evaluated through the single-gene Expression module of GSCA (https://guolab.wchscu.cn/GSCA/, accessed on 25 March 2026). GSCA integrates RSEM-normalized TCGA expression and clinical data obtained from UCSC Xena. Selected cohorts included BLCA, BRCA, CHOL, COAD, GBM, HNSC, KICH, LIHC, LUAD, LUSC, PRAD, READ, and UCEC, depending on the availability of normal tissue and clinical data.
For each cancer type, log2-transformed RSEM expression was compared between primary tumors and normal tissues using the Wilcoxon rank-sum test. The tumor–normal expression difference was calculated as the difference between the corresponding group-level expression estimates, with positive values indicating increased tumor expression and negative values indicating decreased tumor expression. P values were corrected across the evaluated cancer types using the Benjamini–Hochberg method.
2.4. CPTAC Protein-Expression Analysis
Protein-level expression was evaluated using CPTAC proteomic data accessed through the UALCAN portal (https://ualcan.path.uab.edu/, accessed on 23 Feb 2026). The evaluated cohorts comprised BRCA, COAD, HNSC, LIHC, LUAD, and UCEC. WASHC2C was queried as FAM21C, with the former gene symbol retained in the proteomic dataset.
CPTAC protein abundance values were log2-normalized and expressed as Z-scores, representing the number of standard deviations from the median protein abundance within each cancer cohort. Primary tumor and corresponding normal-tissue groups were compared using the two-sided Wilcoxon rank-sum test. A P value of <0.05 was considered statistically significant. Sample sizes were obtained directly from the UALCAN output and reported for each comparison.
2.5. Human Protein Atlas Immunohistochemical Validation
The HPA Tissue and Pathology Atlases were examined to assess the distribution of WASHC2C protein in normal and malignant tissues (https://www.proteinatlas.org/, accessed on 20 June 2026). Representative immunohistochemical images were retrieved for CHOL, LIHC, HNSC, BRCA, COAD, LUAD, KICH, LUSC, and UCEC where suitable images were available.
Images generated with HPA antibody HPA047844 were preferentially selected to maintain consistency across normal and tumor tissues. Protein staining was evaluated descriptively based on staining intensity, fraction of positively stained cells, and cellular localization as provided by the HPA annotation. The HPA images were used as representative qualitative validation and were not subjected to independent inferential statistical analysis.
2.6. Survival Analysis of WASHC2C Expression
The prognostic relevance of WASHC2C expression was assessed across TCGA cohorts using GSCA clinical and expression data. The evaluated endpoints were overall survival (OS), progression-free survival (PFS), disease-specific survival (DSS), and disease-free interval (DFI). Patients without valid survival time, event status, or expression data were excluded from the corresponding endpoint analysis.
Univariate Cox proportional hazards regression was performed for each cancer type, with WASHC2C expression as the explanatory variable. Hazard ratios and corresponding P values were recorded. For Kaplan–Meier analysis, patients were divided into high- and low-expression groups using the cohort-specific median WASHC2C expression value unless otherwise specified. Survival distributions were compared using the two-sided log-rank test. Kaplan–Meier curves were generated with censoring indicated by vertical marks, and median survival was displayed when reached. The GSCA framework uses Cox regression, Kaplan–Meier estimation, and log-rank testing for survival analyses.
2.7. Association Between WASHC2C Expression and Tumor Stage
Pathological and clinical-stage information was obtained from TCGA through GSCA. Undefined, missing, stage 0, stage X, and nonstandard stage annotations were excluded. The remaining cases were grouped into stages I, II, III, and IV.
Differences in WASHC2C expression across all available stages were evaluated using the Kruskal–Wallis test. When the global comparison indicated potential stage-dependent variation, pairwise comparisons were performed using two-sided Wilcoxon rank-sum tests. Pairwise P values were adjusted using the Benjamini–Hochberg method. Cancer types or individual stage groups with inadequate sample numbers were excluded from inferential comparisons but could be retained for descriptive visualization. Stage-related trends were summarized using heatmaps, bubble plots, trend plots, and stage-stratified boxplots.
2.8. WASHC2C Expression and Oncogenic Pathway Activity
Associations between WASHC2C expression and major oncogenic pathway activities were evaluated using the GSCA Expression and Pathway Activity module. GSCA pathway scores are derived from reverse-phase protein-array data obtained from The Cancer Proteome Atlas and include the apoptosis, cell-cycle, DNA-damage-response, epithelial–mesenchymal-transition, hormone androgen-receptor, hormone estrogen-receptor, PI3K/AKT, RAS/MAPK, receptor tyrosine kinase, and TSC/mTOR pathways.
For each pathway, the activity score was calculated by combining the relative protein levels of positive and negative regulatory components, with positive regulators contributing positively and negative regulators contributing inversely to the score. Within each cancer type, samples were divided into high- and low-WASHC2C expression groups using the cohort-specific median. Pathway scores were compared between the two groups using the Wilcoxon rank-sum test. P values were adjusted across pathway–cancer comparisons using the Benjamini–Hochberg method. A pathway was classified as relatively activated or inhibited according to the direction of the difference between the high- and low-expression groups.
2.9. Construction and GSVA Analysis of the WASHC2C-Associated Gene Signature
A WASHC2C-associated gene signature was constructed using TCGA RNA-sequencing data from the GEPIA2 database. Within each cancer type, Spearman correlation coefficients were calculated between WASHC2C expression and all other protein-coding genes. Positively correlated genes with ρ ≥ 0.30 and Benjamini–Hochberg-adjusted P < 0.05 were retained. To obtain a robust pan-cancer signature, genes that met these criteria in at least 50% of the evaluated cancer types and showed a consistent positive direction in at least 70% of cohorts were identified. The retained genes were ranked according to their median Spearman correlation coefficient across cancer types, and the top 50 genes, excluding WASHC2C itself, were defined as the WASHC2C-associated gene signature. Sample-level signature enrichment scores were subsequently calculated using GSVA. The complete gene list and its selection criteria should be provided in Supplementary Table S1.
Sample-level enrichment scores for this signature were calculated using gene set variation analysis as implemented in the GSVA R package through GSCA. GSVA is a nonparametric, unsupervised approach that converts a gene-by-sample expression matrix into a gene-set-by-sample enrichment matrix. Higher GSVA scores indicate more coordinated gene expression within the signature.
GSVA scores were compared between primary tumor and normal tissues using the Wilcoxon rank-sum test. For survival analyses, patients were divided into high- and low-GSVA groups at the cohort-specific median score. Univariate Cox regression, Kaplan–Meier estimation, and log-rank testing were performed for OS, PFS, DSS, and DFI, using the same eligibility criteria as in the single-gene survival analysis. Benjamini–Hochberg adjustment was applied across cancer types and endpoints.
2.10. Gene Set Enrichment Analysis
Gene set enrichment analysis was conducted to determine whether the predefined WASHC2C-associated signature was coordinately enriched or depleted in tumor relative to normal tissue across the selected cancer types. Genes were ranked by their tumor-versus-normal differential expression statistic, and enrichment was assessed using the GSCA GSEA module.
Normalized enrichment scores were used to indicate the direction and magnitude of enrichment. A positive NES represented relative enrichment in tumor tissues, whereas a negative NES represented relative enrichment in normal tissues or depletion in tumors. Statistical significance was determined from permutation-derived P values followed by Benjamini–Hochberg FDR correction.
2.11. Correlation Between GSVA Scores and Pathway Activity
The signaling context of the WASHC2C-associated signature was evaluated by calculating Spearman’s rank correlations between GSVA scores and the 10 GSCA oncogenic pathway activity scores for each TCGA cancer type.
Samples with missing GSVA or pathway scores were excluded pairwise. Spearman correlation coefficients, nominal P values, and Benjamini–Hochberg-adjusted P values were calculated for each signature–pathway–cancer combination. Correlations with FDR ≤0.05 were considered significant. Representative associations were visualized using scatterplots with fitted trend lines and 95% confidence intervals.
2.12. Somatic Single-Nucleotide-Variant Analysis
The pan-cancer WASHC2C somatic-variant landscape was analyzed through the GSCA Mutation module using processed TCGA somatic-mutation data. The analysis included nonsynonymous variants classified as missense mutations, nonsense mutations, frameshift insertions, frameshift deletions, splice-site variants, and in-frame insertions or deletions.
For each cancer type, the WASHC2C mutation frequency was calculated as the number of patients carrying at least one eligible somatic variant divided by the total number of patients with available mutation data. Variants were summarized according to functional classification, variant type, and single-nucleotide substitution class. The number and classes of variants carried by each mutation-positive sample were additionally recorded.
For survival analysis, patients were categorized as WASHC2C-mutant if at least one eligible nonsynonymous WASHC2C variant was detected, and as wild type if no such variant was detected. Univariate Cox regression and Kaplan–Meier analyses were performed for DFI, DSS, OS, and PFS. Mutant-versus-wild-type survival distributions were compared using the log-rank test. Analyses with inadequate numbers of mutant cases or outcome events were omitted or interpreted descriptively.
2.13. Copy-Number-Alteration Analysis
Processed TCGA copy-number data generated using GISTIC2.0 were analyzed through GSCA. Gene-level copy-number states were classified as homozygous deletion, heterozygous deletion, copy-number neutral, heterozygous amplification, or homozygous amplification according to the categories provided by the platform.
The frequencies of heterozygous and homozygous WASHC2C alterations were calculated separately for each cancer type. For the survival analysis, samples were grouped into amplification, deletion, or wild-type/copy-number-neutral according to the GSCA gene-level CNV classification. Patients lacking CNV or survival information were excluded.
Survival differences among the three CNV groups were evaluated using Kaplan–Meier analysis and the log-rank test for DFI, DSS, OS, and PFS. Because some amplification or deletion groups contained few cases, group sizes were reported, and results from small groups were interpreted cautiously.
2.14. Correlation Between WASHC2C Copy Number and mRNA Expression
To investigate whether gene dosage was associated with WASHC2C transcript abundance, Spearman rank correlations were calculated between gene-level WASHC2C CNV values and log2-transformed RSEM expression within each TCGA cohort.
Only samples with both CNV and mRNA-expression data were included. P values were adjusted across the evaluated cancer types using the Benjamini–Hochberg method. Correlation coefficients greater than zero indicated that increased WASHC2C copy number was associated with higher transcript abundance. The analysis was interpreted as an association and not as evidence of a causal effect.
2.15. DNA Methylation Analysis
The DNA methylation landscape of WASHC2C was assessed using TCGA Illumina HumanMethylation450 BeadChip data accessed through the SMART (Shiny Methylation Analysis Resource Tool) App (http://www.bioinfo-zs.com/smartapp, accessed on 20 May 2026). SMART provides CpG localization, tumor–normal methylation comparisons, gene-level methylation summaries, and integration with TCGA clinical and molecular data.
CpG probes annotated to WASHC2C were mapped relative to the gene structure, CpG islands, shores, and shelves. Probe-level methylation was represented by β values ranging from 0, indicating no detectable methylation, to 1, indicating complete methylation. The N-shore probe cg15344919 was selected for site-specific evaluation.
Methylation β values were compared between tumor and corresponding normal tissues using the two-sided Wilcoxon rank-sum test. Where multiple cancer types or probes were analyzed, P values were corrected using the Benjamini–Hochberg method. Gene-level CpG-aggregated methylation values were obtained from the SMART platform using its predefined WASHC2C probe aggregation. Probe-specific and aggregated results were interpreted separately because methylation direction can vary across CpG sites within the same gene.
2.16. Correlation Between WASHC2C and Immune-Regulatory Genes
The association between WASHC2C expression and selected immune-regulatory genes was evaluated using TCGA expression data. The prespecified panel included chemokines and chemokine receptors—CCL2, CCL5, CXCL9, CXCL10, CXCL12, CCR2, CCR5, and CXCR4; immune-checkpoint genes—CD274, CD276, PDCD1, CTLA4, LAG3, TIGIT, HAVCR2, and PDCD1LG2; and antigen-presentation genes—HLA-A, HLA-B, HLA-C, and B2M.
Within each TCGA cohort, Spearman correlation coefficients were calculated between WASHC2C and each immune-regulatory gene using log2-transformed expression values. Cancer subgroups, including HPV-positive and HPV-negative HNSC and the evaluated BRCA subgroups, were analyzed separately when the required subtype annotations were available.
Cells with nominal P >0.05 were marked as nonsignificant in the heatmap. Benjamini–Hochberg-adjusted P values were also calculated to account for the large number of gene–cancer comparisons and were used to identify correlations that remained significant after multiple-testing correction.
2.17. Immune and Stromal Infiltration Analysis
Relationships between WASHC2C expression and tumor-infiltrating immune or stromal populations were investigated using the TIMER2.0 Gene module (http://timer.cistrome.org/, accessed on 20 June 2026). Infiltration estimates were obtained from TIMER, EPIC, MCP-counter, quanTIseq, CIBERSORT, CIBERSORT-ABS, xCell, and TIDE where available. The evaluated populations included CD8+ T cells, CD4+ T-cell subsets, B cells, macrophage and monocyte subsets, natural killer cells, and cancer-associated fibroblasts.
Purity-adjusted Spearman partial correlations were calculated between WASHC2C expression and each infiltration estimate within TCGA cancer types. TIMER2.0-generated heatmaps were used to summarize the direction and magnitude of the associations, while representative scatterplots were selected to illustrate the strongest or most biologically relevant findings. Cells with P >0.05 were marked as nonsignificant. Because infiltration estimates can vary across computational methods, associations were interpreted with respect to both the cell type and the deconvolution algorithm.
2.18. Immune-Checkpoint Blockade Response Analysis
The association between WASHC2C expression and immune checkpoint blockade response was explored using the Tumor Immune Syngeneic Mouse database (https://tismo.pku-genomics.org/#/homepage; accessed on 20 June 2026). TISMO contains uniformly processed transcriptomic data from syngeneic mouse tumor models treated with anti-PD1, anti-PDL1, anti-CTLA4, combination immune-checkpoint blockade, radiation, targeted therapy, or related experimental interventions. The database provides curated annotations for treatment, time point, baseline, responder, and non-responder.
WASHC2C expression was compared among baseline, responder, and non-responder groups within each model, treatment, and sampling time point. Pairwise contrasts included responder versus baseline, non-responder versus baseline, and responder versus non-responder. Differential gene expression was evaluated using the TISMO implementation of the DESeq2 Wald test. Multiple comparisons were corrected using the Benjamini–Hochberg method, with FDR <0.05 considered significant. Expression values were visualized as log2-transformed normalized abundance values using boxplots.
Because the datasets differed in tumor model, treatment, response definition, and sampling time, no pooled effect estimate was calculated. Associations were interpreted independently within each experimental condition.
2.19. Single-Cell Functional-State Analysis
Single-cell associations between WASHC2C expression and cancer-cell functional states were evaluated using CancerSEA (http://biocc.hrbmu.edu.cn/CancerSEA/, accessed on 20 June 2026). CancerSEA characterizes 14 functional states: angiogenesis, apoptosis, cell cycle, differentiation, DNA damage, DNA repair, epithelial–mesenchymal transition, hypoxia, inflammation, invasion, metastasis, proliferation, quiescence, and stemness.
For each eligible single-cell dataset, CancerSEA calculated Spearman rank correlations between WASHC2C expression and the activity scores of the 14 functional states. P values were corrected using the Benjamini–Hochberg method. In accordance with the CancerSEA criteria, associations were considered significant when the absolute Spearman correlation coefficient exceeded 0.30, and the FDR was <0.05.
3. Results
3.1. WASHC2C is Aberrantly Expressed Across Multiple Human Cancers
To characterize the pan-cancer expression landscape of WASHC2C, we first compared its mRNA expression between tumor and normal tissues across 33 cancer types using TCGA and GTEx datasets. WASHC2C showed a heterogeneous yet cancer-type-specific expression pattern, suggesting that its dysregulation may be context-dependent rather than uniformly oncogenic or tumor-suppressive across all malignancies.
In TCGA tumor types with matched normal controls, WASHC2C expression was significantly upregulated in several malignancies, including cholangiocarcinoma (CHOL), prostate adenocarcinoma (PRAD), head and neck squamous cell carcinoma (HNSC), and liver hepatocellular carcinoma (LIHC). In contrast, significantly reduced expression was observed in bladder urothelial carcinoma (BLCA), kidney chromophobe (KICH), breast invasive carcinoma (BRCA), lung squamous cell carcinoma (LUSC), lung adenocarcinoma (LUAD), colon adenocarcinoma (COAD), uterine corpus endometrial carcinoma (UCEC), glioblastoma multiforme (GBM), and rectum adenocarcinoma (READ) (Figure 2). Integration of TCGA tumor data with GTEx normal tissues to enhance normal tissue representation identified additional significant expression differences across multiple cancer types, further supporting the widespread dysregulation of WASHC2C in human malignancies and demonstrating the robustness of these findings.
To validate the transcriptional dysregulation of WASHC2C, its expression was compared between primary tumors and corresponding normal tissues across selected TCGA cohorts. WASHC2C expression varied substantially among cancer types. Significant downregulation was observed in LUSC (FDR = 1.6 × 10⁻¹³), COAD (FDR = 9.1 × 10⁻⁸), BRCA (FDR = 9.0 × 10⁻⁸), LUAD (FDR = 2.4 × 10⁻⁴), and HNSC (FDR = 2.0 × 10⁻³). The largest negative expression differences were evident in COAD and LUSC (Figure 3A).
Conversely, WASHC2C was significantly upregulated in LIHC (FDR = 7.6 × 10⁻⁷), which showed the strongest positive expression difference, and modestly increased in PRAD (FDR = 4.8 × 10⁻²). Although BLCA exhibited lower tumor expression, the difference was not statistically significant (FDR = 8.2 × 10⁻²). No significant alteration was evident in KICH. These findings indicate that WASHC2C dysregulation is cancer-type-dependent, with predominant downregulation across the evaluated cohorts, but increased expression in LIHC and PRAD (Figure 3B).
Protein-level validation using CPTAC and Human Protein Atlas datasets showed that WASHC2C protein expression was also altered in selected tumor types. In CPTAC cohorts, WASHC2C protein abundance was significantly increased in LIHC and decreased in COAD, LUAD, and UCEC, partially concordant with mRNA-level findings (Figure 4). Representative immunohistochemistry images from the Human Protein Atlas further supported differential WASHC2C protein expression between tumor and normal tissues. Increased staining was observed in CHOL, LIHC, and HNSC, whereas reduced staining was detected in BRCA, COAD, LUAD, KICH, LUSC, and UCEC. These results suggest that WASHC2C dysregulation may be reflected not only at the transcriptomic level but also at the proteomic level in specific malignancies (Figure 5).
3.2. Cancer-Specific Prognostic Value of WASHC2C Expression
To evaluate the prognostic relevance of WASHC2C, associations between its expression and DFI, DSS, OS, and PFS were examined across selected TCGA cohorts. The prognostic association of WASHC2C expression varied by cancer type and survival endpoint. In LUAD (Figure 6A), high WASHC2C expression was consistently associated with more favorable outcomes, including prolonged OS (log-rank P < 0.01), PFS (P = 0.027), DSS (P = 0.018), and DFI (P = 0.029). High expression was also associated with improved OS in BLCA (P = 0.018)(Figure 6B).
In contrast, elevated WASHC2C expression was associated with poorer outcomes in LIHC, including shorter DSS (P = 0.011) and DFI (P = 0.034) (Figure 6B). Most associations in the remaining cohorts were not statistically significant. These findings suggest that the prognostic relevance of WASHC2C is context-dependent, with a favorable association in LUAD and BLCA but an adverse association in LIHC.
3.3. Association of WASHC2C Expression with Tumor Stage Across Cancer Types
To determine whether WASHC2C expression is associated with tumor progression, its expression levels were compared across clinical and pathological stages in selected TCGA cancer types. Stage-stratified analysis showed that WASHC2C expression varied across pathological stages in a cancer-dependent manner. Significant differences were detected in BRCA, CHOL, KICH, and LIHC. In BRCA, stage I differed significantly from stages II and III (P = 0.041 and P = 0.019, respectively). In CHOL, stage IV showed lower expression than stages I and II (P = 0.010 and P = 0.012, respectively). KICH displayed a significant difference between stages I and II (P = 0.020). In LIHC, expression differed between stages I and II (P = 8.7 × 10⁻⁴) and between stages I and III (P = 0.047). No significant pairwise stage-related differences were observed in BLCA, COAD, HNSC, LUAD, or LUSC (Figure 7A–D).
3.4. Association of WASHC2C Expression with Oncogenic Pathway Activity Across Cancer Types
To explore the functional consequences of WASHC2C dysregulation, pathway activity scores were compared between tumors with high and low WASHC2C expression across selected TCGA cohorts. The pathway summary indicated that WASHC2C expression was most frequently associated with CellCycle inhibition (23%), followed by DNADamage, PI3KAKT, RASMAPK, and RTK pathways, which were observed in 8% of the evaluated cancer types. High WASHC2C expression was significantly associated with reduced CellCycle activity in BRCA (FDR = 0.021), COAD (FDR = 0.018), and PRAD (FDR = 1.8 × 10⁻⁵). It was also associated with reduced PI3KAKT activity in BLCA (FDR = 0.048) and LUSC (FDR = 7.0 × 10⁻⁴). Conversely, elevated WASHC2C expression was associated with increased Hormone ER activity in COAD (FDR = 0.018) and READ (FDR = 0.039), as well as increased DNADamage activity in KICH (FDR = 0.016). In PRAD, high WASHC2C expression was associated with increased PI3KAKT (FDR = 0.013), RASMAPK (FDR = 0.021), and RTK (FDR = 0.021) activities, despite an inverse association with CellCycle activity. The association with EMT activity in LUAD was borderline but did not remain significant after FDR correction (FDR = 0.054). These findings indicate that the relationship between WASHC2C expression and oncogenic signaling is pathway- and cancer-dependent (Figure 8A,B).
3.5. Cancer-Specific Enrichment and Prognostic Relevance of the WASHC2C-Associated GSVA Signature
To investigate the functional and clinical relevance of WASHC2C, enrichment of the WASHC2C-associated gene set was evaluated across cancer types, followed by comparison of GSVA scores between tumor and normal tissues and assessment of their associations with patient survival. The WASHC2C-associated gene set displayed heterogeneous enrichment patterns across cancers. Positive normalized enrichment scores were observed in LIHC and PRAD, whereas negative enrichment was detected in HNSC, KICH, BLCA, BRCA, LUAD, LUSC, and COAD. The strongest negative enrichment was observed in COAD and LUSC, while LIHC showed the most prominent positive enrichment.
Consistent with these patterns, tumor tissues generally exhibited lower GSVA scores than normal tissues in BLCA, BRCA, COAD, HNSC, KICH, LUAD, and LUSC. In contrast, LIHC tumors showed higher GSVA scores, while PRAD displayed comparatively modest tumor–normal differences. As statistical values were not displayed for these comparisons, these findings should be interpreted as descriptive trends.
Survival analysis demonstrated that a high WASHC2C-associated GSVA score was significantly associated with favorable outcomes in LUAD across multiple endpoints, including OS (P = 0.013), PFS (P = 0.015), DSS (P = 0.024), and DFI (P = 0.0088). The strongest association was observed for DFI in LUAD. In BLCA, a high GSVA score was also associated with improved OS (P = 0.018) and PFS (P = 0.022). No comparably strong statistically significant adverse association with survival was evident among the displayed cohorts. Collectively, these findings suggest that the biological and prognostic relevance of the WASHC2C-associated signature is cancer type-dependent (Figure 9A–D).
3.6. Cancer-Specific Associations Between the WASHC2C-Related GSVA Signature and Oncogenic Pathway Activity
To characterize the signaling context associated with WASHC2C, Spearman correlations were calculated between the WASHC2C-related GSVA score and the activities of major cancer-related pathways across selected TCGA cohorts. The correlation analysis revealed predominantly weak-to-moderate, cancer-specific associations between the WASHC2C-related GSVA score and pathway activity. The strongest positive association was observed between the GSVA score and DNADamage activity in KICH (Spearman rₛ = 0.38, FDR = 0.020). Positive associations were also detected in READ with RASMAPK activity (rₛ = 0.33, FDR = 0.045) and Hormone ER activity (rₛ = 0.32, FDR = 0.050). In PRAD, the GSVA score correlated positively with PI3KAKT (rₛ = 0.17, FDR = 0.016), RASMAPK (rₛ = 0.16, FDR = 0.026), and RTK (rₛ = 0.15, FDR = 0.034) activities. A positive association with Hormone ER activity was additionally observed in COAD (rₛ = 0.19, FDR = 0.023).
The strongest negative associations involved CellCycle activity. The GSVA score was inversely correlated with CellCycle activity in COAD (rₛ = −0.23, FDR = 3.9 × 10⁻³), PRAD (rₛ = −0.22, FDR = 2.8 × 10⁻⁴), BRCA (rₛ = −0.16, FDR = 1.2 × 10⁻⁶), and LUAD (rₛ = −0.15, FDR = 0.037). A significant inverse association with PI3KAKT activity was also detected in LUSC (rₛ = −0.20, FDR = 3.9 × 10⁻³). Several additional correlations showed nominal significance but did not remain significant after FDR correction. Collectively, these findings suggest that the pathway context associated with the WASHC2C signature differs substantially among cancer types (Figure 10A,B).
3.7. Pan-Cancer Genomic Alteration Landscape of WASHC2C
To characterize the genomic alteration profile of WASHC2C, its SNV frequency, variant spectrum, per-sample mutation burden, and copy-number alterations were examined across selected TCGA cohorts. WASHC2C exhibited a relatively low SNV frequency across most cancer types. The highest frequency was observed in UCEC, with 35 altered cases among 531 samples (approximately 6.6%), followed by COAD, with 13 altered cases among 407 samples (approximately 3.2%), and BLCA, with 8 altered cases among 411 samples (approximately 2.0%). Mutation frequencies were lower in LUSC, LUAD, HNSC, PRAD, BRCA, READ, LIHC, and GBM, with the lowest frequency observed in GBM.
Missense mutations represented the predominant variant classification, followed by frameshift deletions, nonsense mutations, frameshift insertions, and splice-site alterations. SNPs constituted the principal variant type, whereas deletions and insertions were less frequent. Among the SNV classes, C>T substitutions were most abundant, followed by C>A substitutions; T>G substitutions were the least common. Most altered samples carried a single WASHC2C variant, with a median of one variant per sample and a maximum of five.
Copy-number analysis revealed heterogeneous patterns across cancers. Heterozygous deletions were particularly prominent in KICH and GBM and were also evident in LUSC, HNSC, COAD, and BLCA. Copy-number gains were comparatively infrequent but detectable in several cohorts, including CHOL, UCEC, LUAD, LIHC, BRCA, and LUSC. Nevertheless, most samples remained copy-number neutral across most cancer types (Figure 11A–H).
3.8. Prognostic Association of WASHC2C SNV Status Across Selected Cancers
To assess the clinical relevance of WASHC2C genomic variation, survival outcomes were compared between patients with WASHC2C-mutant and WT tumors across selected TCGA cohorts. The prognostic association of WASHC2C SNV status varied across cancer types and survival endpoints. Most comparisons showed hazard ratios below 1, suggesting a general tendency toward more favorable outcomes in patients with WASHC2C-mutant tumors; however, these associations were not statistically significant in most cohorts.
The strongest and only clearly significant association was observed for PFS in UCEC, where WASHC2C mutation was associated with a lower progression hazard relative to WT tumors. Kaplan–Meier analysis confirmed significantly prolonged PFS in the mutant group compared with the WT group (mutant, n = 34; WT, n = 496; log-rank P = 0.0042). The mutant group maintained a higher estimated PFS probability throughout most of the follow-up period.
A nonsignificant adverse trend in PFS was observed in PRAD, as indicated by a hazard ratio>1. No significant survival differences according to WASHC2C mutation status were evident for DFI, DSS, or OS across the displayed cancer types. These findings suggest that the prognostic relevance of WASHC2C SNVs may be cancer- and endpoint-specific, with the strongest association observed for PFS in UCEC (Figure 12A,B).
3.9. Pan-Cancer WASHC2C Copy-Number Alterations
WASHC2C heterozygous and homozygous copy-number alterations were assessed across selected TCGA cancers. Heterozygous alterations were more frequent than homozygous events. Heterozygous deletions predominated, particularly in GBM and KICH, followed by LUSC and BLCA, whereas heterozygous amplifications occurred at lower frequencies across most cohorts. Homozygous alterations were rare, with amplification most evident in CHOL and BLCA and deletion most prominent in PRAD. No statistical comparisons were provided; therefore, these patterns are descriptive (Figure 13A,B)
3.10. WASHC2C Copy-Number Variation Is Positively Associated with mRNA Expression Across Cancers
To assess whether genomic dosage contributes to WASHC2C transcriptional variation, Spearman correlations between WASHC2C CNV and mRNA expression were evaluated across selected TCGA cohorts. WASHC2C CNV showed positive correlations with mRNA expression in nearly all evaluated cancer types, suggesting that copy-number gain or loss may contribute to corresponding changes in transcript abundance. The strongest association was observed in KICH (rₛ = 0.64, FDR = 2.3 × 10⁻⁵), followed by LUSC (rₛ = 0.53, FDR = 1.2 × 10⁻³⁵) and BLCA (rₛ = 0.46, FDR = 2.6 × 10⁻²¹).
Moderate positive correlations were also detected in GBM (rₛ = 0.43, FDR = 3.3 × 10⁻⁶), LUAD (rₛ = 0.42, FDR = 3.1 × 10⁻²²), HNSC (rₛ = 0.40, FDR = 1.4 × 10⁻¹⁹), READ (rₛ = 0.40, FDR = 9.6 × 10⁻⁴), UCEC (rₛ = 0.38, FDR = 5.4 × 10⁻⁶), and BRCA (rₛ = 0.37, FDR = 2.3 × 10⁻³⁴). Weaker but significant associations were observed in COAD (rₛ = 0.33, FDR = 1.5 × 10⁻⁷), LIHC (rₛ = 0.28, FDR = 5.5 × 10⁻⁷), and PRAD (rₛ = 0.14, FDR = 0.016). No significant inverse association was evident, while the association in CHOL appeared weak and nonsignificant. Collectively, these findings support a cancer-dependent positive relationship between WASHC2C copy number and transcript abundance without establishing a causal effect (Figure 14A,B).
3.11. Cancer-Specific Prognostic Associations of WASHC2C Copy-Number Alterations
To evaluate the clinical relevance of WASHC2C copy-number alterations, DFI, DSS, OS, and PFS were compared among amplification, deletion, and WT groups across selected TCGA cohorts. The prognostic association of WASHC2C CNV status varied across cancer types and survival endpoints. The strongest differences were observed in GBM, where CNV groups differed significantly for DSS (log-rank P = 6.6 × 10⁻⁵), OS (P = 3.5 × 10⁻⁶), and PFS (P = 5.7 × 10⁻⁶). Across analyses, the deletion group generally had worse survival than the WT group, whereas the amplification group comprised only 4 cases and should therefore be interpreted cautiously (Figure 15A,B).
In COAD, significant differences were observed for DFI (P = 0.0081) and PFS (P = 0.013), with WT tumors generally showing more favorable outcomes than CNV-altered tumors. In PRAD, deletion was associated with shorter DFI, whereas the amplification group showed a favorable trend, although this group included only 8 cases (P = 0.002). DFI also differed among CNV groups in READ (P = 0.023), although the limited numbers of amplified and deleted tumors limit firm interpretation (Figure 15A,B).
In BRCA, CNV status was associated with DSS (P = 0.0077) and OS (P = 0.025), with the deletion group showing comparatively favorable survival. In LIHC, amplification was associated with poorer DSS than the deletion and WT groups (P = 0.024). BLCA showed significant OS differences (P = 0.025), with WT tumors generally exhibiting better survival than CNV-altered tumors, whereas the PFS difference did not reach statistical significance (P = 0.084). Overall, the findings indicate that the prognostic relevance of WASHC2C CNVs is cancer- and endpoint-dependent, without a uniform effect across cohorts (Figure 15A,B).
3.12. Probe-Specific DNA Methylation Alterations of WASHC2C Across Cancer Types
To examine the potential epigenetic regulation of WASHC2C, the genomic distribution of its associated CpG probes and their methylation levels in tumor and normal tissues were evaluated across TCGA cohorts. The analyzed methylation probes were localized within the WASHC2C genomic region, including a CpG island and its flanking shore regions. Pan-cancer analysis revealed marked probe- and cancer-specific differences in DNA methylation.
The probe shown in panel B exhibited generally low methylation levels, with β-values predominantly ranging from approximately 0.05 to 0.20. Significant tumor–normal differences were observed in several cohorts, although most changes were modest. UCEC showed an apparent tumor-associated increase at this probe, whereas reduced methylation was evident in selected renal and other cancer cohorts (Figure 16A–C).
In contrast, the probe shown in panel C displayed higher and more stable methylation levels, generally around β = 0.35–0.42. The most pronounced tumor-associated hypomethylation was observed in TGCT, followed by UCEC. Significant but smaller methylation differences were also detected in several additional cancers. The contrasting patterns between panels B and C, particularly in UCEC, indicate that WASHC2C methylation alterations depend on both the CpG site and the cancer context (Figure 16A–C).
3.13. Pan-Cancer Association of WASHC2C with Chemokine, Immune-Checkpoint, and Antigen-Presentation Genes
To characterize the immunoregulatory context of WASHC2C, Spearman correlation analysis was performed between WASHC2C expression and selected chemokines, chemokine receptors, immune-checkpoint genes, and antigen-presentation molecules across TCGA cohorts. WASHC2C expression showed predominantly positive associations with immune-related genes, although the magnitude and direction varied across cancer types. The most extensive positive correlation pattern was observed in UVM, where WASHC2C was positively associated with nearly all evaluated chemokine, checkpoint, and antigen-presentation genes. Broad positive associations were also evident in HNSC-HPV+, HNSC-HPV−, DLBC, LIHC, PAAD, and several BRCA subgroups, particularly for CCL2, CXCL9, CXCL10, CCR2, CCR5, CD274, CTLA4, LAG3, TIGIT, HAVCR2, and PDCD1LG2. Positive correlations with HLA-A, HLA-B, HLA-C, and B2M further suggested an association between WASHC2C expression and antigen-presentation activity in selected cohorts (Figure 17).
In contrast, LGG displayed the most prominent inverse correlation profile, including negative associations with several chemokines, immune-checkpoint genes, HLA molecules, and B2M. Additional cancer-specific negative associations were observed in KIRP and selected BRCA, CESC, SKCM, and UCEC cohorts, particularly for CD276 and some checkpoint-related genes. Crossed cells indicated that several visually apparent correlations did not reach statistical significance. Overall, the findings suggest that WASHC2C is linked to distinct immune-regulatory transcriptional patterns that depend on the cancer context, without implying a direct regulatory relationship.
3.14. WASHC2C Expression Is Associated with Distinct Immune and Stromal Infiltration Patterns Across Cancers
To characterize the immune and stromal context of WASHC2C, purity-adjusted Spearman correlation analyses were performed between WASHC2C expression and infiltration estimates for T-cell subsets, B cells, macrophages, NK cells, and cancer-associated fibroblasts across TCGA cohorts. Pan-cancer analysis revealed heterogeneous yet predominantly positive associations between WASHC2C expression and immune cell infiltration. Among the representative findings, the strongest positive CD8+ T-cell association was observed in PRAD using EPIC (ρ = 0.434, P = 1.57 × 10⁻²⁰), followed by READ using CIBERSORT-ABS (ρ = 0.402, P = 8.59 × 10⁻⁵). CD4+ T-cell infiltration showed its strongest positive association in COAD using TIMER (ρ = 0.485, P = 1.21 × 10⁻¹⁷), whereas an inverse association with central-memory CD4+ T cells was detected in KICH using xCell (ρ = −0.392, P = 1.23 × 10⁻³).
Positive B-cell associations were particularly evident in HNSC (ρ = 0.432, P = 8.29 × 10⁻²⁴), KICH (ρ = 0.411, P = 6.69 × 10⁻⁴), and LIHC (ρ = 0.405, P = 4.46 × 10⁻¹⁵). Macrophage-related infiltration was also positively associated with WASHC2C expression in several cohorts, including READ (ρ = 0.422, P = 3.47 × 10⁻⁵), HNSC (ρ = 0.405, P = 8.55 × 10⁻²¹), and LIHC (ρ = 0.400, P = 1.03 × 10⁻¹⁴). In contrast, a negative association with M1 macrophage infiltration was observed in UCEC (ρ = −0.259, P = 1.48 × 10⁻²).
For NK cells, the strongest positive correlations were detected in HNSC using MCP-counter (ρ = 0.372, P = 1.34 × 10⁻¹⁷) and GBM (ρ = 0.338, P = 5.36 × 10⁻⁵). Cancer-associated fibroblast infiltration was positively related to WASHC2C expression in multiple cancers, with the most prominent associations observed in GBM using EPIC (ρ = 0.325, P = 1.07 × 10⁻⁴), HNSC using xCell (ρ = 0.274, P = 6.85 × 10⁻¹⁰), and LIHC using EPIC (ρ = 0.270, P = 3.50 × 10⁻⁷). Collectively, these findings suggest that WASHC2C is associated with cancer-specific immune and stromal infiltration patterns, although the direction and magnitude of these relationships vary by cell subset, cancer type, and deconvolution method (Figure 18A–I).
3.15. Context-Dependent Association of WASHC2C Expression with Immune-Checkpoint Blockade Response
To evaluate whether WASHC2C expression is associated with response to immune checkpoint blockade, transcript levels were compared across baseline, responder, and non-responder groups across multiple experimental tumor models and treatment conditions.
WASHC2C expression varied substantially across datasets and showed no uniform relationship with treatment response. The largest reductions in responders relative to baseline were apparent in the T11 UV day 3/day 7 and KPB25L day 3/day 7 cohorts receiving combined anti-CTLA4 and anti-PD1 treatment. Lower responder expression was also observed in selected 402230 radiation, CT26, EMT6, MC38, and B16 conditions.
Conversely, higher expression in responders was evident in selected 4T1 young, BNL-MEA regorafenib, KPB25L end-treatment, T11 end-treatment, and YTN16 anti-CTLA4 cohorts. Non-responders showed comparatively elevated expression in several 4T1 old, B16 intracranial, E0771 high-fat-diet, and p53-2225L conditions, whereas lower expression was apparent in selected LLC and p53-2336R models. Many comparisons showed overlapping distributions, suggesting limited discrimination between response groups. Overall, the findings indicate that the relationship between WASHC2C expression and immunotherapy response is model-, treatment-, and time-point-dependent and does not support WASHC2C as a universally consistent, standalone response marker (Figure 19).
3.16. Single-Cell Associations Between WASHC2C Expression and Cancer Functional States
To investigate the potential functional relevance of WASHC2C at single-cell resolution, its expression was correlated with 14 cancer-related cellular states across multiple single-cell datasets. WASHC2C expression showed heterogeneous, cancer-dependent associations with cellular functional states. Positive correlations predominated, with metastasis showing the most significant associations across datasets, followed by EMT, hypoxia, inflammation, invasion, and quiescence. Strong positive relationships with metastasis were particularly evident in GBM, HGG, LUAD, MEL, HNSCC, and UM, while EMT and hypoxia also showed prominent positive correlations in GBM, HGG, LUAD, and MEL (Figure 20).
Negative associations were less frequent and were concentrated on selected datasets. HGG showed the most pronounced inverse pattern, including strong negative correlations with cell cycle, DNA damage, DNA repair, proliferation, and stemness. Negative associations with stemness were also observed in AST, NSCLC, RCC, and HNSCC. Overall, the findings suggest that elevated WASHC2C expression is preferentially associated with invasive, metastatic, and stress-adaptation states in several cancers, although the direction and magnitude of the relationships vary by dataset and do not establish causality (Figure 20).
CancerSEA evaluates gene–state associations using Spearman’s rank correlation with Benjamini–Hochberg FDR correction; significant associations are defined by the database as a correlation magnitude> 0.30 and an FDR < 0.05.
4. Discussion
This study provides an integrated pan-cancer multi-omics characterization of WASHC2C by combining transcriptomic and protein expression, clinicopathological and survival associations, pathway activity, gene-set enrichment, genomic and epigenetic alterations, immune features, immunotherapy-related observations, and single-cell functional states. Collectively, the findings indicate that WASHC2C does not exhibit a uniform oncogenic or tumor-suppressive pattern. Instead, its expression, prognostic direction, molecular regulation, signaling context, and immune associations vary substantially across cancer lineages. This context dependence extends the limited gene-specific evidence for WASHC2C and positions it within the broader biology of WASH-complex-mediated actin remodeling, endosomal organization, and intracellular trafficking.
WASHC2C showed widespread but directionally heterogeneous tumor–normal dysregulation. Increased expression in CHOL, HNSC, LIHC, and PRAD contrasted with reduced expression in BRCA, COAD, LUAD, LUSC, KICH, UCEC, and other malignancies. These opposing patterns argue against assigning a universal biological function to WASHC2C across cancers and may reflect lineage-specific dependence on receptor recycling, endosomal transport, membrane organization, and actin remodeling. The WASH regulatory complex controls endosomal cargo sorting, membrane-tubule fission, receptor recycling, retrograde transport, and actin-network organization [16,17,18,19,20,21,22,23,24]. Although these processes may facilitate cell adhesion, migration, receptor signaling, and extracellular-matrix interactions, their consequences are likely to depend on tissue origin, molecular subtype, genomic background, and cellular composition.
The increased expression and adverse clinical associations observed in LIHC are consistent with direct experimental evidence showing that FAM21C/WASHC2C promotes hepatocellular carcinoma invasion and metastasis through actin remodeling and inhibition of CAPZA1-mediated capping [27]. In contrast, reduced expression in several other cancers may reflect distinct trafficking requirements, loss of potentially restraining functions, or differences in the cellular source of the measured transcript. Findings involving WASHC1, retromer-associated proteins, or the wider WASH complex provide useful mechanistic context but should not be interpreted as direct evidence for WASHC2C [23,25,26,29].
Proteomic and immunohistochemical observations provided partial cross-layer validation of the transcriptomic results. Concordant increases in LIHC and decreases in COAD, LUAD, and UCEC support the conclusion that WASHC2C dysregulation in these cancers is not confined to RNA abundance. However, the absence of significant protein changes in some tumors with altered mRNA expression highlights the importance of multi-omics integration. RNA abundance may be uncoupled from protein abundance through translational regulation, protein degradation, alternative transcripts, tumor purity, or cellular heterogeneity. Moreover, mass-spectrometry-based proteomics and immunohistochemistry capture different biological and technical properties, including bulk protein abundance, tissue localization, antibody specificity, sample processing, and intratumoral variation [8,9,10,11,12,13]. Thus, concordant findings across molecular layers strengthen biological confidence, whereas discordant findings may themselves reveal important regulatory complexity.
The tumor–normal differences suggest possible cancer-specific diagnostic relevance, particularly where expression separation was pronounced. Nevertheless, differential expression alone is insufficient to establish diagnostic utility. Independent cohorts, formal classification analyses, comparison with established biomarkers, and prospective validation remain necessary. Stage-related differences in BRCA, CHOL, KICH, and LIHC were also heterogeneous and did not follow a uniform monotonic pattern. Such variation may reflect nonlinear tumor evolution, subtype imbalance, changes in cellular composition, or unequal representation of early- and late-stage disease. Therefore, WASHC2C is more appropriately viewed as a context-dependent clinical correlate than as a universal marker of tumor progression.
Survival analyses reinforced this interpretation. Higher WASHC2C expression was associated with favorable outcomes across several endpoints in LUAD and with improved overall survival in BLCA, whereas adverse disease-specific survival and disease-free interval were observed in LIHC. The LIHC findings are consistent with its experimentally reported pro-invasive role [27]. Conversely, the favorable association in LUAD, despite reduced tumor expression, may indicate that retained WASHC2C identifies a less aggressive molecular state, a distinct cellular composition, or a more immune-infiltrated subgroup. Differences in disease stage, treatment exposure, genomic background, and the cellular origin of WASHC2C may also contribute to these opposing associations. Because survival endpoints measure different clinical events and are influenced by treatment, competing mortality, recurrence definitions, and follow-up duration [31], the consistency across multiple LUAD endpoints is notable but remains observational. External validation and multivariable adjustment are required before WASHC2C can be considered an independent prognostic factor.
Pathway analyses provided potential biological context for these clinical patterns. High WASHC2C expression was associated with reduced CellCycle activity in BRCA, COAD, and PRAD and with reduced PI3KAKT activity in BLCA and LUSC. These findings may partly support favorable associations in selected settings if WASHC2C marks tumors with lower proliferative or growth-signaling activity. However, PRAD simultaneously displayed reduced CellCycle activity and increased PI3KAKT, RASMAPK, and RTK activity, demonstrating that pathway states are not mutually exclusive. Given its scaffolding role within an endosome-associated complex, WASHC2C could plausibly influence receptor localization, recycling, or signal duration [20,21,22,23,24]. Nevertheless, the computational results do not establish direct activation or inhibition of these pathways. Associations with Hormone ER signaling in COAD and READ, DNA-damage activity in KICH, and borderline EMT activity in LUAD may similarly reflect co-regulation, cellular composition, or downstream consequences.
The WASHC2C-associated GSVA signature captured a broader transcriptional program accompanying gene expression. Signature enrichment was increased in LIHC and PRAD but reduced in several cancers in which WASHC2C itself was downregulated, including COAD, LUAD, and LUSC. This concordance suggests that tumor–normal differences involve coordinated molecular networks rather than isolated changes in a single transcript. High signature scores were also associated with favorable outcomes in LUAD and BLCA, paralleling the single-gene survival results. However, GSVA represents the collective behavior of multiple genes and is not equivalent to WASHC2C expression alone [54,55]. Its prognostic behavior may be influenced by tumor purity, immune or stromal content, and genes that are correlated with but not functionally dependent on WASHC2C.
Correlations between the GSVA signature and pathway activity supported the expression-stratified analyses. Recurrent inverse relationships with CellCycle activity in BRCA, COAD, LUAD, and PRAD suggest that reduced proliferative signaling is a feature of the WASHC2C-associated program in several cancers. Positive relationships with DNA-damage activity in KICH, Hormone ER signaling in COAD and READ, and PI3KAKT, RASMAPK, and RTK signaling in PRAD further demonstrate lineage-specific network organization. The generally weak-to-moderate correlations are compatible with the multifactorial nature of a multigene signature but should not be interpreted as evidence of direct pathway regulation.
Genomic analyses indicated that sequence mutations are unlikely to be the major mechanism underlying WASHC2C dysregulation. Mutation frequencies were low in most cancers, although relatively higher rates were observed in UCEC, COAD, and BLCA. Missense substitutions predominated, but their functional significance cannot be inferred without assessing recurrence, domain localization, predicted structural effects, and experimental consequences. The favorable progression-free survival observed in WASHC2C-mutant UCEC should be interpreted cautiously because it may reflect co-occurring molecular features, mutation burden, treatment sensitivity, or subtype composition rather than a protective effect of WASHC2C mutation [32,33].
Copy-number alterations appeared more closely related to WASHC2C transcription. Heterozygous deletions were more frequent than homozygous events, particularly in GBM and KICH, whereas high-level amplification was uncommon. Positive correlations between copy number and mRNA abundance across most cancers, especially KICH, LUSC, and BLCA, support a possible gene-dosage contribution. Nevertheless, copy-number segments contain multiple neighboring genes, and these associations do not establish WASHC2C as the selected target. Heterogeneous survival associations among amplification, deletion, and copy-number-neutral groups may reflect lineage-specific dosage effects, co-altered genes, treatment differences, and small altered subgroups. Locus-specific functional validation is therefore required.
Methylation analysis also revealed probe- and cancer-specific alterations, including contrasting CpG patterns within UCEC. Such heterogeneity is biologically plausible because methylation effects depend on genomic location, baseline methylation, chromatin accessibility, tissue-specific regulation, tumor purity, and cell composition [34]. Because direct methylation–expression correlations were not available, hypermethylation or hypomethylation cannot be assumed to regulate WASHC2C transcription. Targeted methylation assays and functional manipulation are needed to determine whether specific CpG sites influence its expression.
The immune analyses demonstrated broad but tumor-specific relationships between WASHC2C and immune-checkpoint genes, chemokines, chemokine receptors, and antigen-presentation molecules. Positive co-expression with CD274, PDCD1, CTLA4, LAG3, TIGIT, HAVCR2, CCL5, CXCL9, CXCL10, and HLA-related genes in selected cancers may indicate an inflamed microenvironment accompanied by compensatory immunosuppression. Negative associations in other malignancies may instead reflect immune-excluded or lineage-specific states. These relationships are biologically plausible because actin remodeling and endosomal trafficking contribute to immune-cell migration, receptor recycling, antigen processing, and immune-synapse organization [30,44,45,46,47,48]. However, these functions have largely been established for immune-cell actin systems or the broader FAM21/WASH machinery and cannot be assigned directly to tumor-cell WASHC2C.
WASHC2C expression was also associated with inferred infiltration by CD8+ and CD4+ T cells, B cells, macrophages, NK cells, and cancer-associated fibroblasts. Variation across tumors and analytical methods suggests that WASHC2C is linked to multiple immune and stromal environments rather than a single pan-cancer phenotype. Agreement across several deconvolution methods strengthens selected observations, but reference signatures, tumor purity, marker specificity, and cellular composition remain important confounders [49,50]. Bulk-tissue WASHC2C expression may also originate partly from infiltrating immune or stromal cells.
Immunotherapy-related datasets showed differences in WASHC2C expression among responders, non-responders, and baseline samples in selected models, but no consistent pattern emerged across treatments or sampling points. This heterogeneity, together with limited cohort sizes and variation among experimental systems, indicates that WASHC2C cannot currently be regarded as a predictive immunotherapy biomarker [51]. Rather, these findings identify tumor contexts in which its potential relationship with treatment response warrants further investigation.
Single-cell analyses provided additional resolution by linking WASHC2C to metastasis, EMT, hypoxia, inflammation, invasion, and quiescence, while inverse associations with cell-cycle activity, DNA-damage or repair programs, proliferation, and stemness occurred in selected datasets. These patterns may help reconcile apparently opposing bulk-tissue findings. For example, an invasion-associated state in one lineage may coexist with reduced proliferative activity in another. Although single-cell analysis reduces the averaging inherent in bulk transcriptomics, it remains affected by dataset size, cellular annotation, transcript dropout, and inter-study heterogeneity [56,57,58,59]. Accordingly, these associations remain hypothesis-generating.
Overall, the results support a context-dependent model in which WASHC2C-related biology is shaped by cancer lineage, cellular origin, pathway environment, genomic dosage, epigenetic state, and tumor-microenvironment composition. A major strength of this study is the integration of transcriptomic, proteomic, genomic, epigenetic, immunological, clinical, pathway, and single-cell evidence. This multi-omics strategy enabled both cross-layer validation and the identification of biologically informative discordance that would not be apparent from a single analytical modality. The use of multiple survival endpoints and complementary analytical approaches further strengthened the overall assessment.
Several limitations should nevertheless be acknowledged. Publicly available cohorts differ in sample size, normal-tissue representation, treatment annotation, platform characteristics, tumor purity, and clinical follow-up. Most analyses were associative, and small genomic or immunotherapy subgroups may have produced unstable estimates. Moreover, bulk measurements cannot fully distinguish tumor-cell-intrinsic expression from immune or stromal contributions. Therefore, the findings do not establish WASHC2C as an oncogene, tumor suppressor, therapeutic target, or validated clinical biomarker.
Future studies should validate WASHC2C transcript and protein abundance in independent, well-characterized cohorts using quantitative PCR, immunoblotting, and standardized immunohistochemistry. Loss- and gain-of-function experiments are required to define its effects on migration, invasion, proliferation, endosomal trafficking, receptor recycling, and PI3K–AKT, RAS–MAPK, RTK, and DNA-damage signaling. Functional characterization of recurrent variants, locus-specific methylation studies, immune-cell coculture models, organoids, xenografts, expanded single-cell datasets, and prospective immunotherapy cohorts will be essential to distinguish tumor-cell-intrinsic effects from microenvironmental associations. Such studies may ultimately determine whether the multi-omics patterns identified here can be translated into clinically useful applications.
5. Conclusions
In conclusion, integrated pan-cancer multi-omics profiling identified WASHC2C as a context-dependent cancer-associated molecule whose expression, regulation, clinical significance, and immune relationships vary across human malignancies. The coordinated assessment of transcriptomic, proteomic, genomic, epigenetic, pathway, immunological, and single-cell data linked WASHC2C to cytoskeletal regulation, intracellular trafficking, oncogenic signaling, copy-number-dependent expression, immune-microenvironment composition, and cellular-state heterogeneity. Importantly, concordant findings across multiple molecular layers strengthened selected observations, whereas discordant patterns highlighted the biological complexity and lineage specificity of WASHC2C-related processes. These results provide a comprehensive multi-omics framework for prioritizing tumor contexts in which WASHC2C may have potential diagnostic, prognostic, therapeutic, or immunotherapy-related relevance. However, its clinical utility remains unestablished and requires validation through mechanistic experiments, independent multi-omics cohorts, and prospective clinical studies.
Supplementary Materials
The following supporting information can be downloaded at the website of this paper posted on Preprints.org, Table S1: Top 50 genes positively correlated with WASHC2C expression.
Funding
This scientific paper is derived from a research grant funded by Taibah University, Madinah, Kingdom of Saudi Arabia, with grant number1064-16-447.
Institutional Review Board Statement Institutional Review Board Statement
This computational study exclusively analyzed publicly available datasets and did not recruit participants, perform interventions, or collect new human specimens. Therefore, additional institutional ethical approval and informed consent were not applicable to the present secondary analysis.
Informed Consent Statement
Not applicable.
Data Availability Statement
The original contributions presented in this study are included in the Methods section. Further inquiries can be directed to the corresponding author.
Conflicts of Interest
The authors declare no conflicts of interest.
Acknowledgments
The authors thank the contributors of the TCGA project for making their data publicly available. During the preparation of this manuscript, Grammarly AI was used solely for language editing, including grammar, spelling, punctuation, sentence structure, and readability improvement. The authors reviewed and revised all AI-assisted edits and took full responsibility for the final content of the manuscript.
References
- Bray, F.; Laversanne, M.; Sung, H.; Ferlay, J.; Siegel, R.L.; Soerjomataram, I.; Jemal, A. Global cancer statistics 2022: GLOBOCAN estimates of incidence and mortality worldwide for 36 cancers in 185 countries. CA Cancer J. Clin. 2024, 74, 229–263. [Google Scholar] [CrossRef] [PubMed]
- Sung, H.; Ferlay, J.; Siegel, R.L.; Laversanne, M.; Soerjomataram, I.; Jemal, A.; Bray, F. Global cancer statistics 2020: GLOBOCAN estimates of incidence and mortality worldwide for 36 cancers in 185 countries. CA Cancer J. Clin. 2021, 71, 209–249. [Google Scholar] [CrossRef] [PubMed]
- Hanahan, D. Hallmarks of cancer: New dimensions. Cancer Discov. 2022, 12, 31–46. [Google Scholar] [CrossRef] [PubMed]
- Weinstein, J.N.; Collisson, E.A.; Mills, G.B.; Shaw, K.R.M.; Ozenberger, B.A.; Ellrott, K.; Shmulevich, I.; Sander, C.; Stuart, J.M. Cancer Genome Atlas Research Network. The Cancer Genome Atlas Pan-Cancer analysis project. Nat. Genet. 2013, 45, 1113–1120. [Google Scholar] [CrossRef] [PubMed]
- Hoadley, K.A.; Yau, C.; Hinoue, T.; Wolf, D.M.; Lazar, A.J.; Drill, E.; Shen, R.; Taylor, A.M.; Cherniack, A.D.; Thorsson, V.; et al. Cell-of-origin patterns dominate the molecular classification of 10,000 tumors from 33 types of cancer. Cell 2018, 173, 291–304.e6. [Google Scholar] [CrossRef] [PubMed]
- ICGC/TCGA Pan-Cancer Analysis of Whole Genomes Consortium. Pan-cancer analysis of whole genomes. Nature 2020, 578, 82–93. [CrossRef] [PubMed]
- GTEx Consortium. The GTEx Consortium atlas of genetic regulatory effects across human tissues. Science 2020, 369, 1318–1330. [Google Scholar] [CrossRef] [PubMed]
- Li, Y.; Dou, Y.; Da Veiga Leprevost, F.; Geffen, Y.; Calinawan, A.P.; Aguet, F.; et al. Proteogenomic data and resources for pan-cancer analysis. Cancer Cell 2023, 41, 1397–1406. [Google Scholar] [CrossRef] [PubMed]
- Savage, S.R.; Shi, Z.; Liao, Y.; Zhang, B.; et al. Pan-cancer proteogenomics expands the landscape of therapeutic targets. Cell 2024, 187, 4389–4407.e15. [Google Scholar] [CrossRef] [PubMed]
- Rodriguez, H.; Zenklusen, J.C.; Staudt, L.M.; Doroshow, J.H.; Lowy, D.R. The next horizon in precision oncology: Proteogenomics to inform cancer diagnosis and treatment. Cell 2021, 184, 1661–1670. [Google Scholar] [CrossRef] [PubMed]
- Mani, D.R.; Krug, K.; Zhang, B.; Satpathy, S.; Clauser, K.R.; Ding, L.; et al. Cancer proteogenomics: Current impact and future prospects. Nat. Rev. Cancer 2022, 22, 298–313. [Google Scholar] [CrossRef] [PubMed]
- Uhlen, M.; Fagerberg, L.; Hallstrom, B.M.; Lindskog, C.; Oksvold, P.; Mardinoglu, A.; et al. Proteomics. Tissue-based map of the human proteome. Science 2015, 347, 1260419. [Google Scholar] [CrossRef] [PubMed]
- Karlsson, M.; Zhang, C.; Mear, L.; Zhong, W.; Digre, A.; Katona, B.; et al. A single-cell type transcriptomics map of human tissues. Sci. Adv. 2021, 7, eabh2169. [Google Scholar] [CrossRef] [PubMed]
- Seal, R.L.; Braschi, B.; Gray, K.; Jones, T.E.M.; Tweedie, S.; Haim-Vilmovsky, L.; Bruford, E.A. Genenames.org: The HGNC resources in 2023. Nucleic Acids Res. 2023, 51, D1003–D1009. [Google Scholar] [CrossRef] [PubMed]
- UniProt Consortium. UniProt: The Universal Protein Knowledgebase in 2025. Nucleic Acids Res. 2025, 53, D609–D617. [Google Scholar] [CrossRef] [PubMed]
- Gomez, T.S.; Billadeau, D.D. A FAM21-containing WASH complex regulates retromer-dependent sorting. Dev. Cell 2009, 17, 699–711. [Google Scholar] [CrossRef] [PubMed]
- Derivery, E.; Sousa, C.; Gautier, J.J.; Lombard, B.; Loew, D.; Gautreau, A. The Arp2/3 activator WASH controls the fission of endosomes through a large multiprotein complex. Dev. Cell 2009, 17, 712–723. [Google Scholar] [CrossRef] [PubMed]
- Jia, D.; Gomez, T.S.; Metlagel, Z.; Umetani, J.; Otwinowski, Z.; Rosen, M.K.; Billadeau, D.D. WASH and WAVE actin regulators of the Wiskott-Aldrich syndrome protein family are controlled by analogous structurally related complexes. Proc. Natl. Acad. Sci. USA 2010, 107, 10442–10447. [Google Scholar] [CrossRef] [PubMed]
- Jia, D.; Gomez, T.S.; Billadeau, D.D.; Rosen, M.K. Multiple repeat elements within the FAM21 tail link the WASH actin regulatory complex to the retromer. Mol. Biol. Cell 2012, 23, 2352–2361. [Google Scholar] [CrossRef] [PubMed]
- Park, L.; Thomason, P.A.; Zech, T.; King, J.S.; Veltman, D.M.; Carnell, M.; et al. Cyclical action of the WASH complex: FAM21 and capping protein drive WASH recycling, not initial recruitment. Dev. Cell 2013, 24, 169–181. [Google Scholar] [CrossRef] [PubMed]
- Steinberg, F.; Gallon, M.; Winfield, M.; Thomas, E.C.; Bell, A.J.; Heesom, K.J.; et al. A global analysis of SNX27-retromer assembly and cargo specificity reveals a function in glucose and metal ion transport. Nat. Cell Biol. 2013, 15, 461–471. [Google Scholar] [CrossRef] [PubMed]
- Phillips-Krawczak, C.A.; Singla, A.; Starokadomskyy, P.; Deng, Z.; Osborne, D.G.; Li, H.; et al. COMMD1 is linked to the WASH complex and regulates endosomal trafficking of the copper transporter ATP7A. Mol. Biol. Cell 2015, 26, 91–103. [Google Scholar] [CrossRef] [PubMed]
- Ryder, P.V.; Vistein, R.; Gokhale, A.; Seaman, M.N.; Puthenveedu, M.A.; Faundez, V. The WASH complex, an endosomal Arp2/3 activator, interacts with the Hermansky-Pudlak syndrome complex BLOC-1 and its cargo phosphatidylinositol-4-kinase type IIα. Mol. Biol. Cell 2013, 24(14), 2269–84. [Google Scholar] [CrossRef] [PubMed]
- Guo, Q.; et al. Structural basis for coupling of the WASH subunit FAM21 with the endosomal SNX27-retromer complex. Proc. Natl. Acad. Sci. USA 2024, 121, e2405041121. [Google Scholar] [CrossRef] [PubMed]
- Seaman, M.N.J.; Freeman, C.L. Analysis of the retromer complex–WASH complex interaction illuminates new avenues to explore in Parkinson disease. Commun. Integr. Biol. 2014, 7, e29483. [Google Scholar] [CrossRef] [PubMed]
- Deb, S.; Sun, J. Endosomal sorting protein SNX27 and its emerging roles in human cancers. Cancers 2022, 15, 70. [Google Scholar] [CrossRef] [PubMed]
- Lu, Y.; Huang, D.; Wang, B.; Zheng, B.; Liu, J.; Song, J.; Zheng, S. FAM21C promotes hepatocellular carcinoma invasion and metastasis by driving actin cytoskeleton remodeling via inhibiting capping ability of CAPZA1. Front. Oncol. 2022, 11, 809195. [Google Scholar] [CrossRef] [PubMed]
- Deng, Z.; et al. Nuclear FAM21 participates in NF-kappaB-dependent gene regulation in pancreatic cancer cells. J. Cell Sci. 2015, 128, 373–384. [Google Scholar] [CrossRef] [PubMed]
- Huang, L.; et al. WASH overexpression enhances cancer stem cell properties and correlates with poor prognosis of esophageal carcinoma. Cancer Sci. 2017, 108, 2358–2365. [Google Scholar] [CrossRef] [PubMed]
- Kulkarni, A.; et al. FAM21 is critical for TLR2/CLEC4E-mediated dendritic cell function against Candida albicans. Life Sci. Alliance 2023, 6, e202201414. [Google Scholar] [CrossRef] [PubMed]
- Liu, J.; Lichtenberg, T.; Hoadley, K.A.; Poisson, L.M.; Lazar, A.J.; Cherniack, A.D.; et al. An integrated TCGA pan-cancer clinical data resource to drive high-quality survival outcome analytics. Cell 2018, 173, 400–416.e11. [Google Scholar] [CrossRef] [PubMed]
- Cerami, E.; Gao, J.; Dogrusoz, U.; Gross, B.E.; Sumer, S.O.; Aksoy, B.A.; et al. The cBio cancer genomics portal: An open platform for exploring multidimensional cancer genomics data. Cancer Discov. 2012, 2, 401–404. [Google Scholar] [CrossRef] [PubMed]
- Gao, J.; Aksoy, B.A.; Dogrusoz, U.; Dresdner, G.; Gross, B.; Sumer, S.O.; et al. Integrative analysis of complex cancer genomics and clinical profiles using the cBioPortal. Sci. Signal. 2013, 6, pl1. [Google Scholar] [CrossRef] [PubMed]
- Li, Y.; Ge, D.; Lu, C. The SMART App: An interactive web application for comprehensive DNA methylation analysis and visualization. Epigenet. Chromatin 2019, 12, 71. [Google Scholar] [CrossRef] [PubMed]
- Strickler, J.H.; Hanks, B.A.; Khasraw, M. Tumor mutational burden as a predictor of immunotherapy response: Is more always better? Clin. Cancer Res. 2021, 27, 1236–1241. [Google Scholar] [CrossRef] [PubMed]
- Cristescu, R.; Aurora-Garg, D.; Albright, A.; Xu, L.; Liu, X.Q.; Loboda, A.; et al. Tumor mutational burden predicts the efficacy of pembrolizumab monotherapy: A pan-tumor retrospective analysis of participants with advanced solid tumors. J. Immunother. Cancer 2022, 10, e003091. [Google Scholar] [CrossRef] [PubMed]
- Luchini, C.; Bibeau, F.; Ligtenberg, M.J.L.; Singh, N.; Nottegar, A.; Bosse, T.; et al. ESMO recommendations on microsatellite instability testing for immunotherapy in cancer, and its relationship with PD-1/PD-L1 expression and tumour mutational burden. Ann. Oncol. 2019, 30, 1232–1243. [Google Scholar] [CrossRef] [PubMed]
- Le, D.T.; Durham, J.N.; Smith, K.N.; Wang, H.; Bartlett, B.R.; Aulakh, L.K.; et al. Mismatch repair deficiency predicts response of solid tumors to PD-1 blockade. Science 2017, 357, 409–413. [Google Scholar] [CrossRef] [PubMed]
- Wagener-Ryczek, S.; Merkelbach-Bruse, S.; Siemanowski, J. Biomarkers for homologous recombination deficiency in cancer. J. Pers. Med. 2021, 11, 612. [Google Scholar] [CrossRef] [PubMed]
- Miller, R.E.; Leary, A.; Scott, C.L.; Serra, V.; Lord, C.J.; Bowtell, D.; et al. ESMO recommendations on predictive biomarker testing for homologous recombination deficiency and PARP inhibitor benefit in ovarian cancer. Ann. Oncol. 2020, 31, 1606–1622. [Google Scholar] [CrossRef] [PubMed]
- Mroz, E.A.; Rocco, J.W. MATH, a novel measure of intratumor genetic heterogeneity, is high in poor-outcome classes of head and neck squamous cell carcinoma. Oral Oncol. 2013, 49, 211–215. [Google Scholar] [CrossRef] [PubMed]
- Davoli, T.; Uno, H.; Wooten, E.C.; Elledge, S.J. Tumor aneuploidy correlates with markers of immune evasion and with reduced response to immunotherapy. Science 2017, 355, eaaf8399. [Google Scholar] [CrossRef] [PubMed]
- Lau, T.Y.; Poon, R.Y.C. Whole-Genome Duplication and Genome Instability in Cancer Cells: Double the Trouble. Int. J. Mol. Sci. 2023, 24, 3733. [Google Scholar] [CrossRef] [PubMed]
- Thorsson, V.; Gibbs, D.L.; Brown, S.D.; Wolf, D.; Bortone, D.S.; Ou Yang, T.H.; et al. The immune landscape of cancer. Immunity 2018, 48, 812–830.e14. [Google Scholar] [CrossRef] [PubMed]
- Goenka, A.; Khan, F.; Verma, B.; Sinha, P.; Dmello, C.C.; Jogalekar, M.P.; et al. Tumor microenvironment signaling and therapeutics in cancer progression. Cancer Commun. 2023, 43, 525–561. [Google Scholar] [CrossRef] [PubMed]
- Jhunjhunwala, S.; Hammer, C.; Delamarre, L. Antigen presentation in cancer: Insights into tumour immunogenicity and immune evasion. Nat. Rev. Cancer 2021, 21, 298–312. [Google Scholar] [CrossRef] [PubMed]
- Galassi, C.; Chan, T.A.; Vitale, I.; Galluzzi, L. The hallmarks of cancer immune evasion. Cancer Cell 2024, 42, 1825–1863. [Google Scholar] [CrossRef] [PubMed]
- Dupre, L.; Boztug, K.; Pfajfer, L. Actin dynamics at the T cell synapse as revealed by immune-related actinopathies. Front. Cell Dev. Biol. 2021, 9, 665519. [Google Scholar] [CrossRef] [PubMed]
- Li, T.; Fu, J.; Zeng, Z.; Cohen, D.; Li, J.; Chen, Q.; et al. TIMER2.0 for analysis of tumor-infiltrating immune cells. Nucleic Acids Res. 2020, 48, W509–W514. [Google Scholar] [CrossRef] [PubMed]
- Yoshihara, K.; Shahmoradgoli, M.; Martinez, E.; Vegesna, R.; Kim, H.; Torres-Garcia, W.; et al. Inferring tumour purity and stromal and immune cell admixture from expression data. Nat. Commun. 2013, 4, 2612. [Google Scholar] [CrossRef] [PubMed]
- Edgar, R.; Domrachev, M.; Lash, A.E. Gene Expression Omnibus: NCBI gene expression and hybridization array data repository. Nucleic Acids Res. 2002, 30, 207–210. [Google Scholar] [CrossRef] [PubMed]
- Gene Ontology Consortium. The Gene Ontology resource: Enriching a GOld mine. Nucleic Acids Res. 2021, 49, D325–D334. [Google Scholar] [CrossRef] [PubMed]
- Szklarczyk, D.; Gable, A.L.; Nastou, K.C.; Lyon, D.; Kirsch, R.; Pyysalo, S.; et al. The STRING database in 2021: Customizable protein-protein networks, and functional characterization of user-uploaded gene/measurement sets. Nucleic Acids Res. 2021, 49, D605–D612. [Google Scholar] [CrossRef] [PubMed]
- Hanzelmann, S.; Castelo, R.; Guinney, J. GSVA: Gene set variation analysis for microarray and RNA-seq data. BMC Bioinform. 2013, 14, 7. [Google Scholar] [CrossRef] [PubMed]
- Subramanian, A.; Tamayo, P.; Mootha, V.K.; Mukherjee, S.; Ebert, B.L.; Gillette, M.A.; et al. Gene set enrichment analysis: A knowledge-based approach for interpreting genome-wide expression profiles. Proc. Natl. Acad. Sci. USA 2005, 102, 15545–15550. [Google Scholar] [CrossRef] [PubMed]
- Yuan, H.; Yan, M.; Zhang, G.; Liu, W.; Deng, C.; Liao, G.; et al. CancerSEA: A cancer single-cell state atlas. Nucleic Acids Res. 2019, 47, D900–D908. [Google Scholar] [CrossRef] [PubMed]
- Han, Y.; Wang, Y.; Dong, X.; Sun, D.; Liu, Z.; Yue, J.; et al. TISCH2: Expanded datasets and new tools for single-cell transcriptome analyses of the tumor microenvironment. Nucleic Acids Res. 2023, 51, D1425–D1431. [Google Scholar] [CrossRef] [PubMed]
- Heumos, L.; Schaar, A.C.; Lance, C.; Litinetskaya, A.; Drost, F.; Zappia, L.; et al. Best practices for single-cell analysis across modalities. Nat. Rev. Genet. 2023, 24, 550–572. [Google Scholar] [CrossRef] [PubMed]
- Rozenblatt-Rosen, O.; Regev, A.; Oberdoerffer, P.; Nawy, T.; Hupalowska, A.; Rood, J.E.; et al. The Human Tumor Atlas Network: Charting tumor transitions across space and time at single-cell resolution. Cell 2020, 181, 236–249. [Google Scholar] [CrossRef] [PubMed]
Figure 1.
Integrated pan-cancer multi-omic analysis workflow of WASHC2C. The study integrated transcriptomic, proteomic, immunohistochemical, genomic, epigenetic, immune, and single-cell data. Analyses included differential expression and cross-platform validation, survival and tumor-stage assessment, oncogenic pathway and WASHC2C-associated gene-signature analyses, somatic mutation and copy-number evaluation, DNA methylation, immune-regulatory gene correlations, immune-cell infiltration, immunotherapy-response datasets, and single-cell functional-state analysis. The workflow generated integrated insights into WASHC2C expression, protein-level validation, prognostic relevance, molecular alterations, immune context, and cancer-cell functional heterogeneity.Created by figurelabs.ai.
Figure 1.
Integrated pan-cancer multi-omic analysis workflow of WASHC2C. The study integrated transcriptomic, proteomic, immunohistochemical, genomic, epigenetic, immune, and single-cell data. Analyses included differential expression and cross-platform validation, survival and tumor-stage assessment, oncogenic pathway and WASHC2C-associated gene-signature analyses, somatic mutation and copy-number evaluation, DNA methylation, immune-regulatory gene correlations, immune-cell infiltration, immunotherapy-response datasets, and single-cell functional-state analysis. The workflow generated integrated insights into WASHC2C expression, protein-level validation, prognostic relevance, molecular alterations, immune context, and cancer-cell functional heterogeneity.Created by figurelabs.ai.
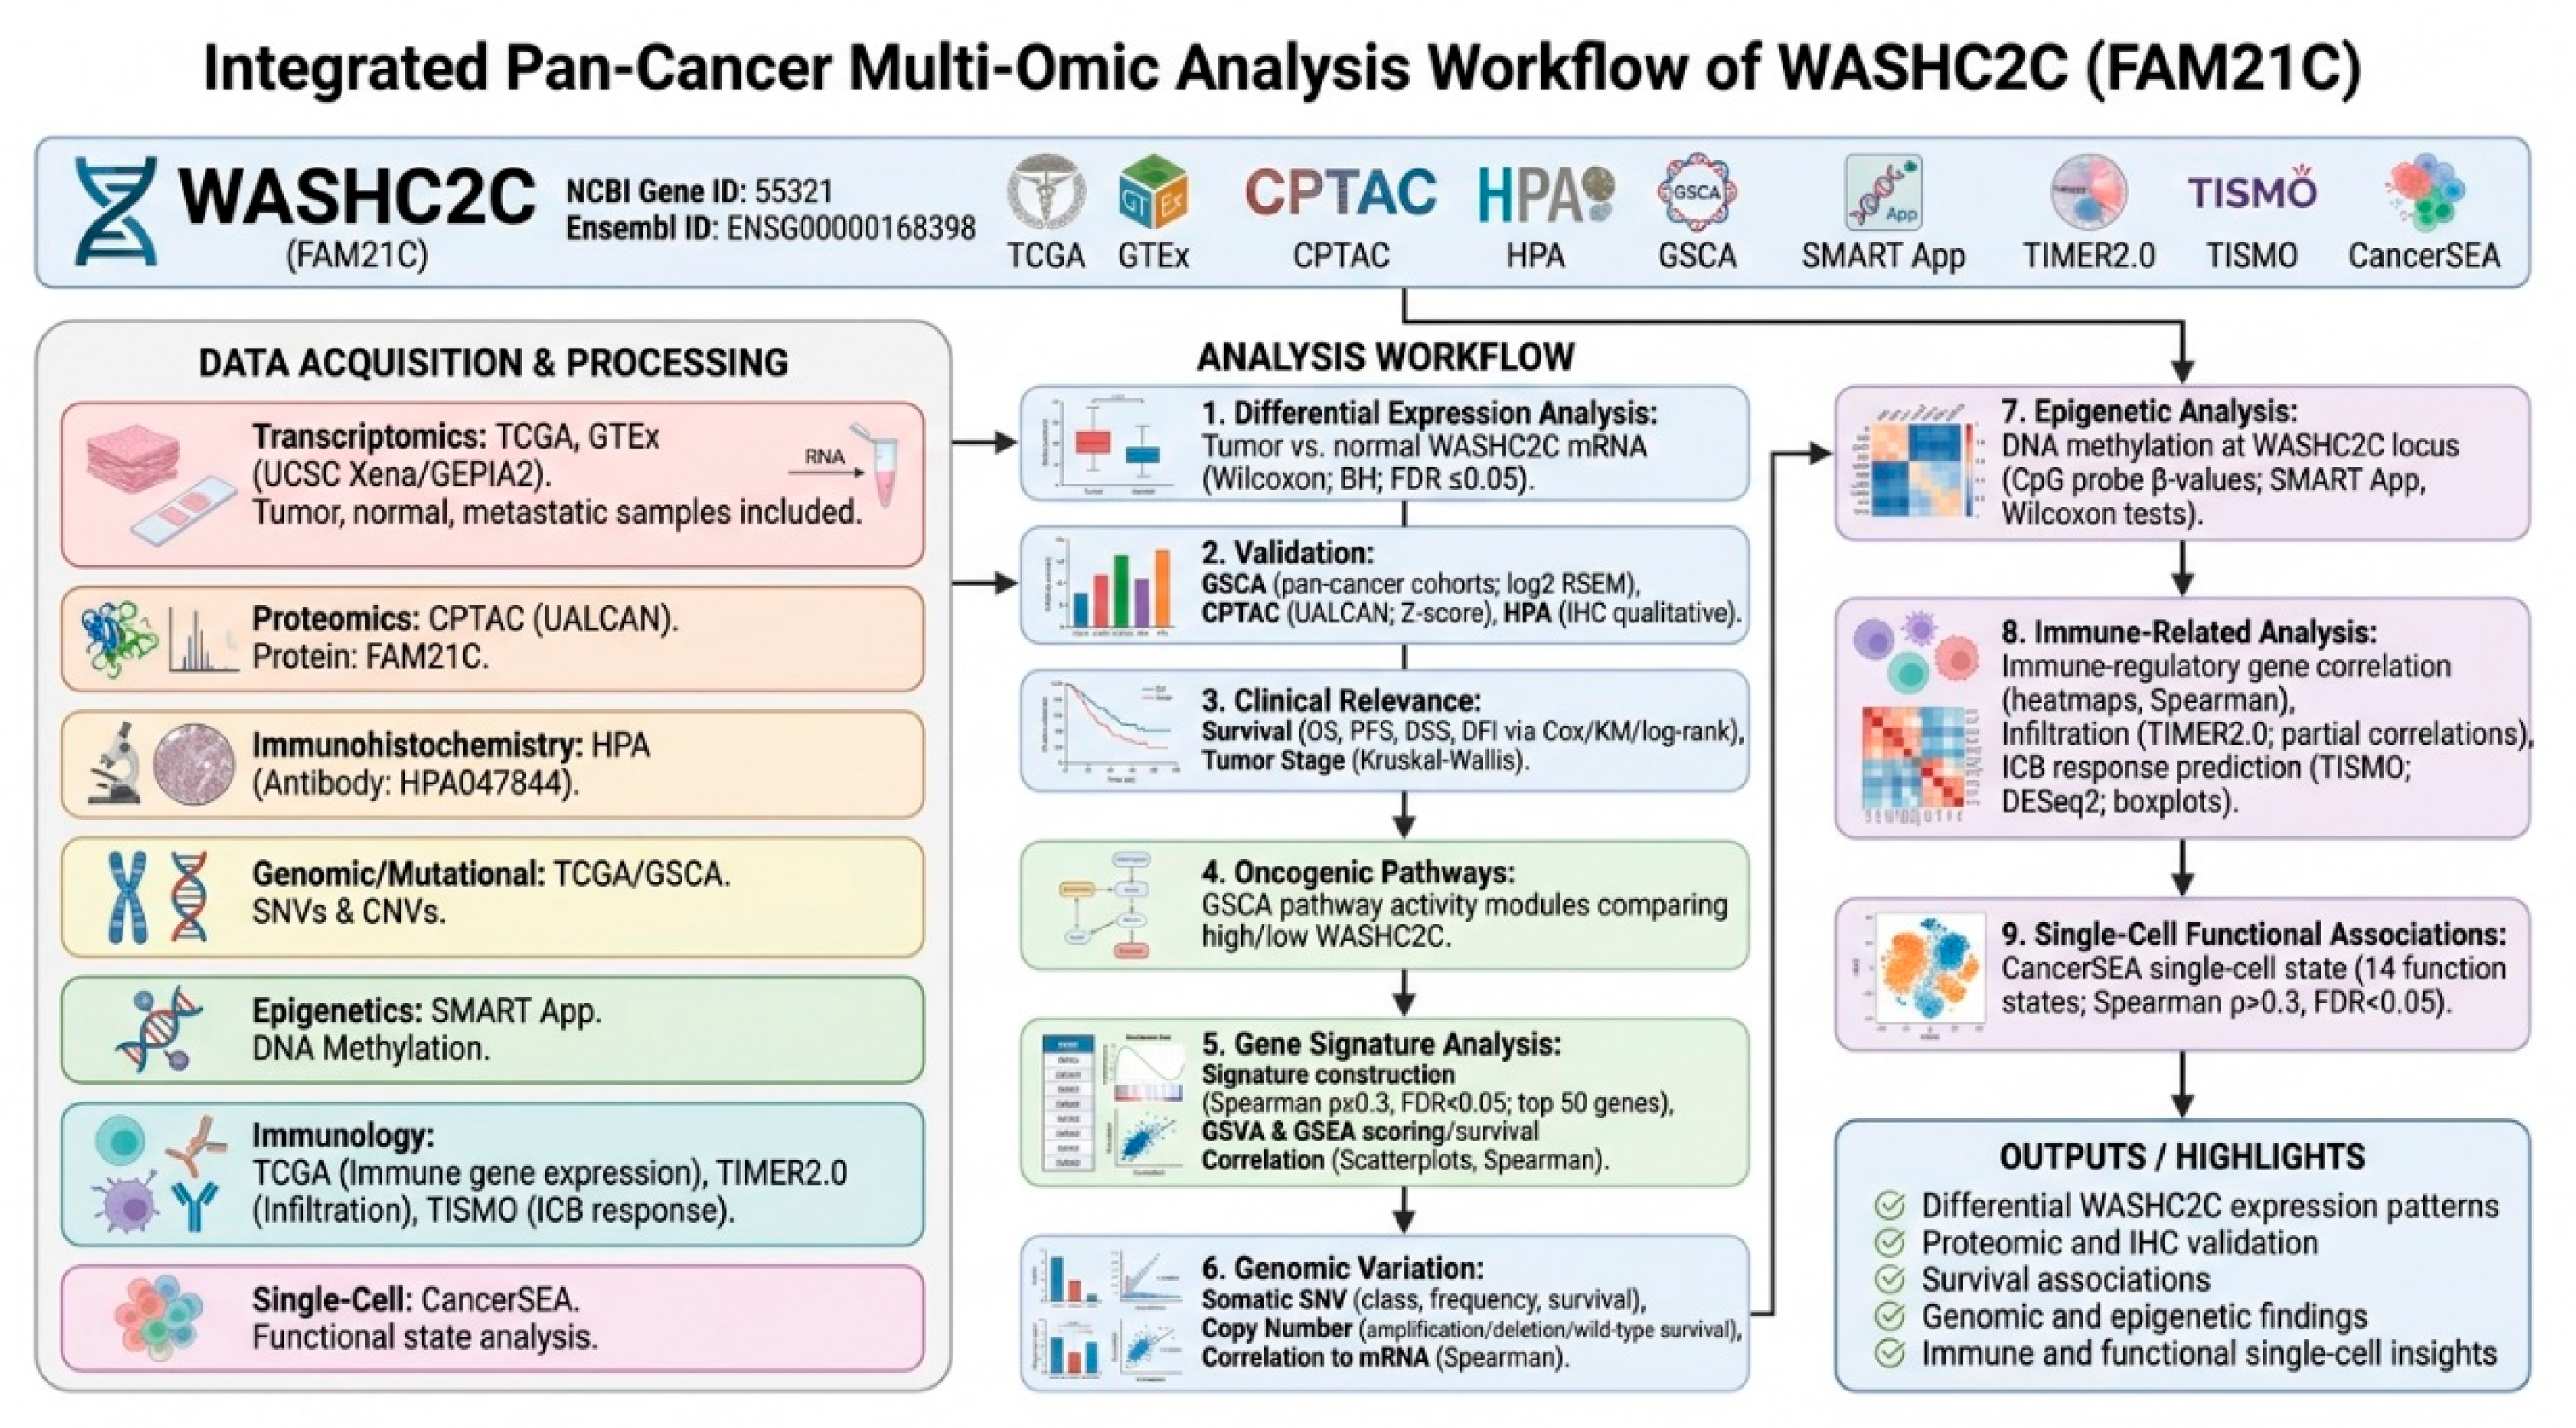
Figure 2.
Differential expression of WASHC2C across human cancers based on TCGA and GTEx datasets. (A) Pan-cancer analysis of WASHC2C mRNA expression in tumor, normal, and metastatic tissues using the TCGA dataset. Violin plots compare log2(TPM + 1) expression levels across 33 cancer types. Red, blue, and gray colors represent primary tumor, normal, and metastatic samples, respectively. Statistical significance was assessed using the Wilcoxon rank-sum test. P < 0.05, P < 0.01, P < 0.001; ns, not significant.
Figure 2.
Differential expression of WASHC2C across human cancers based on TCGA and GTEx datasets. (A) Pan-cancer analysis of WASHC2C mRNA expression in tumor, normal, and metastatic tissues using the TCGA dataset. Violin plots compare log2(TPM + 1) expression levels across 33 cancer types. Red, blue, and gray colors represent primary tumor, normal, and metastatic samples, respectively. Statistical significance was assessed using the Wilcoxon rank-sum test. P < 0.05, P < 0.01, P < 0.001; ns, not significant.
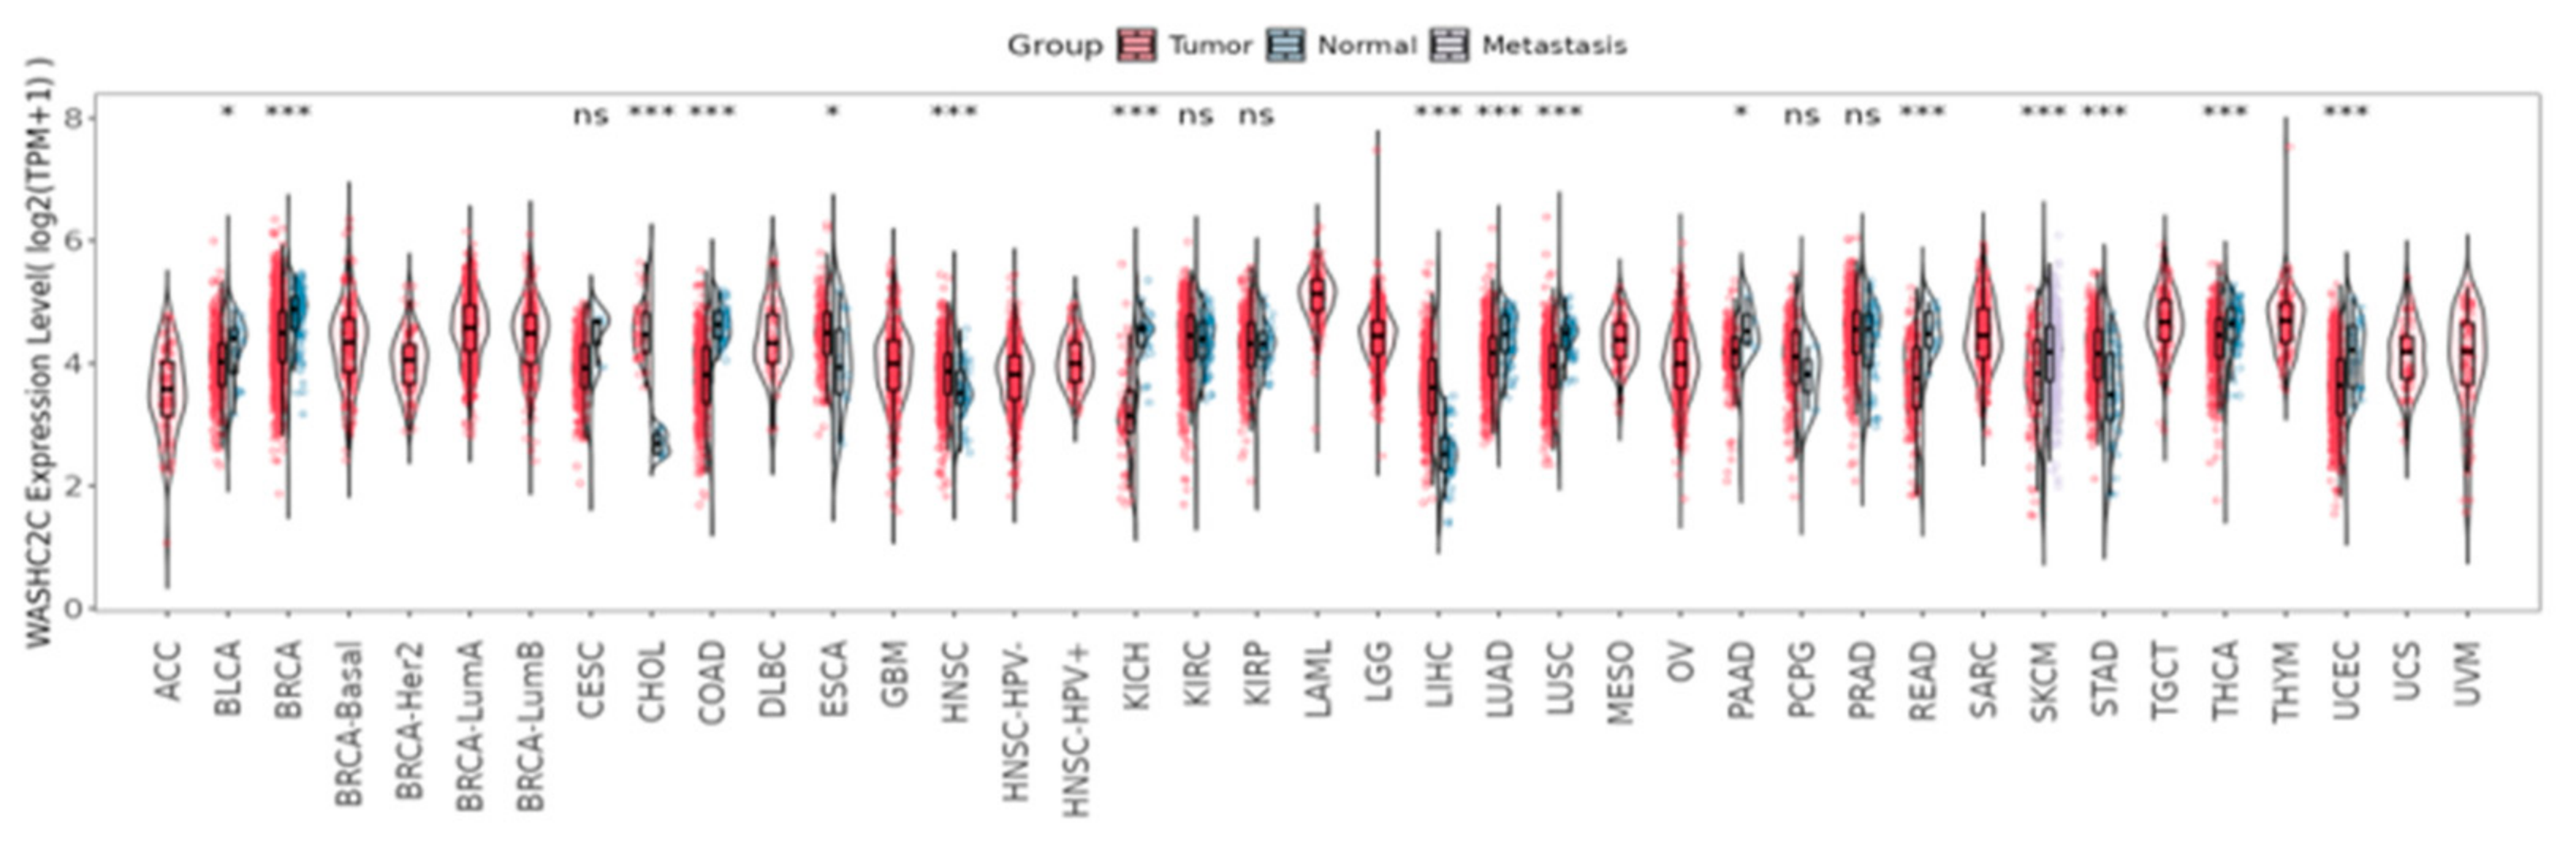
Figure 3.
Validation of differential expression of WASHC2C across selected cancer types. (A) Bubble plot summarizing tumor-versus-normal differential expression of WASHC2C. Bubble color represents log2 fold change, with red and blue indicating increased and decreased tumor expression, respectively. Bubble size is proportional to −log10(FDR). Black outlines denote FDR ≤ 0.05, whereas gray outlines indicate FDR > 0.05. (B) Boxplots showing log2-transformed RSEM expression in normal tissues (blue) and primary tumors (red) for BLCA, BRCA, COAD, HNSC, LIHC, LUAD, LUSC, and PRAD. Individual points represent samples, center lines indicate medians, and boxes represent interquartile ranges. FDR-adjusted P values are displayed above each comparison. No correlation coefficients are presented.
Figure 3.
Validation of differential expression of WASHC2C across selected cancer types. (A) Bubble plot summarizing tumor-versus-normal differential expression of WASHC2C. Bubble color represents log2 fold change, with red and blue indicating increased and decreased tumor expression, respectively. Bubble size is proportional to −log10(FDR). Black outlines denote FDR ≤ 0.05, whereas gray outlines indicate FDR > 0.05. (B) Boxplots showing log2-transformed RSEM expression in normal tissues (blue) and primary tumors (red) for BLCA, BRCA, COAD, HNSC, LIHC, LUAD, LUSC, and PRAD. Individual points represent samples, center lines indicate medians, and boxes represent interquartile ranges. FDR-adjusted P values are displayed above each comparison. No correlation coefficients are presented.
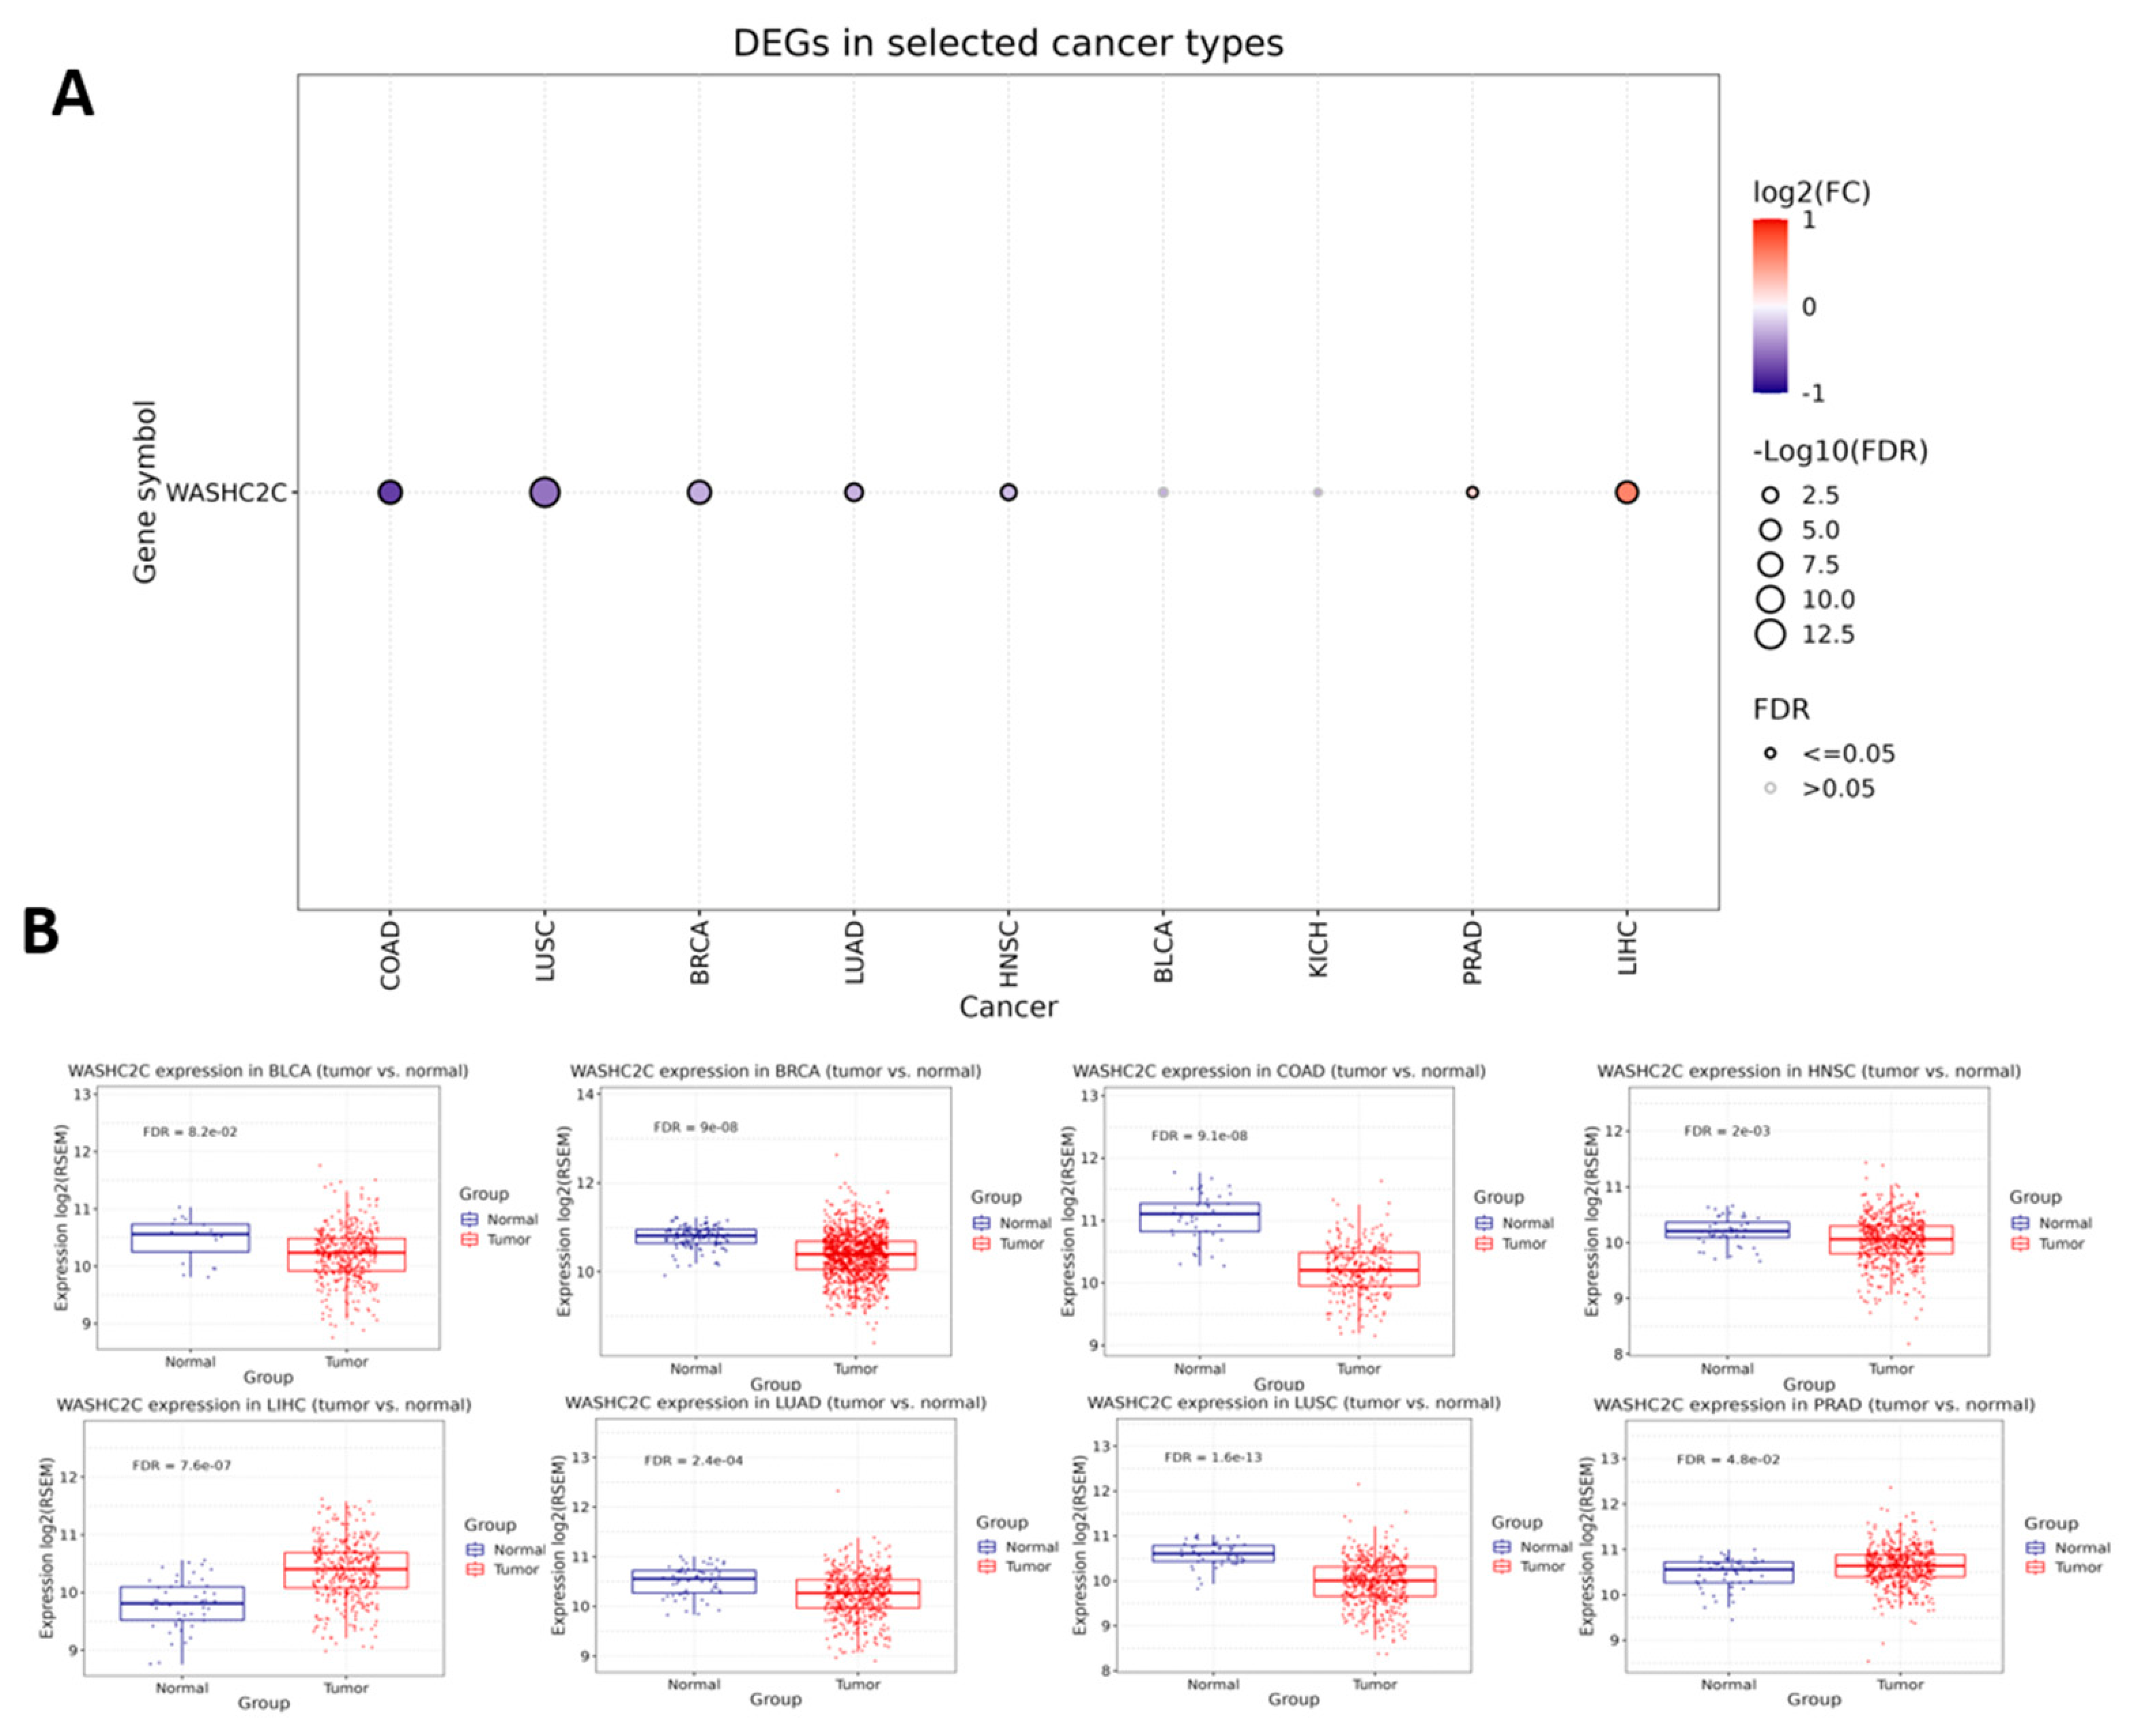
Figure 4.
Validation of WASHC2C protein expression in human cancers using the CPTAC proteomic dataset. Representative boxplots show WASHC2C protein expression (Z-score) in normal (blue) and primary tumor (red) tissues from CPTAC for (A) BRCA, (B) COAD, (C) LUAD, (D) HNSC, (E) LIHC, and (F) UCEC. WASHC2C protein levels were significantly decreased in COAD, LUAD, and UCEC, and significantly increased in LIHC, with no significant differences in BRCA or HNSC.
Figure 4.
Validation of WASHC2C protein expression in human cancers using the CPTAC proteomic dataset. Representative boxplots show WASHC2C protein expression (Z-score) in normal (blue) and primary tumor (red) tissues from CPTAC for (A) BRCA, (B) COAD, (C) LUAD, (D) HNSC, (E) LIHC, and (F) UCEC. WASHC2C protein levels were significantly decreased in COAD, LUAD, and UCEC, and significantly increased in LIHC, with no significant differences in BRCA or HNSC.
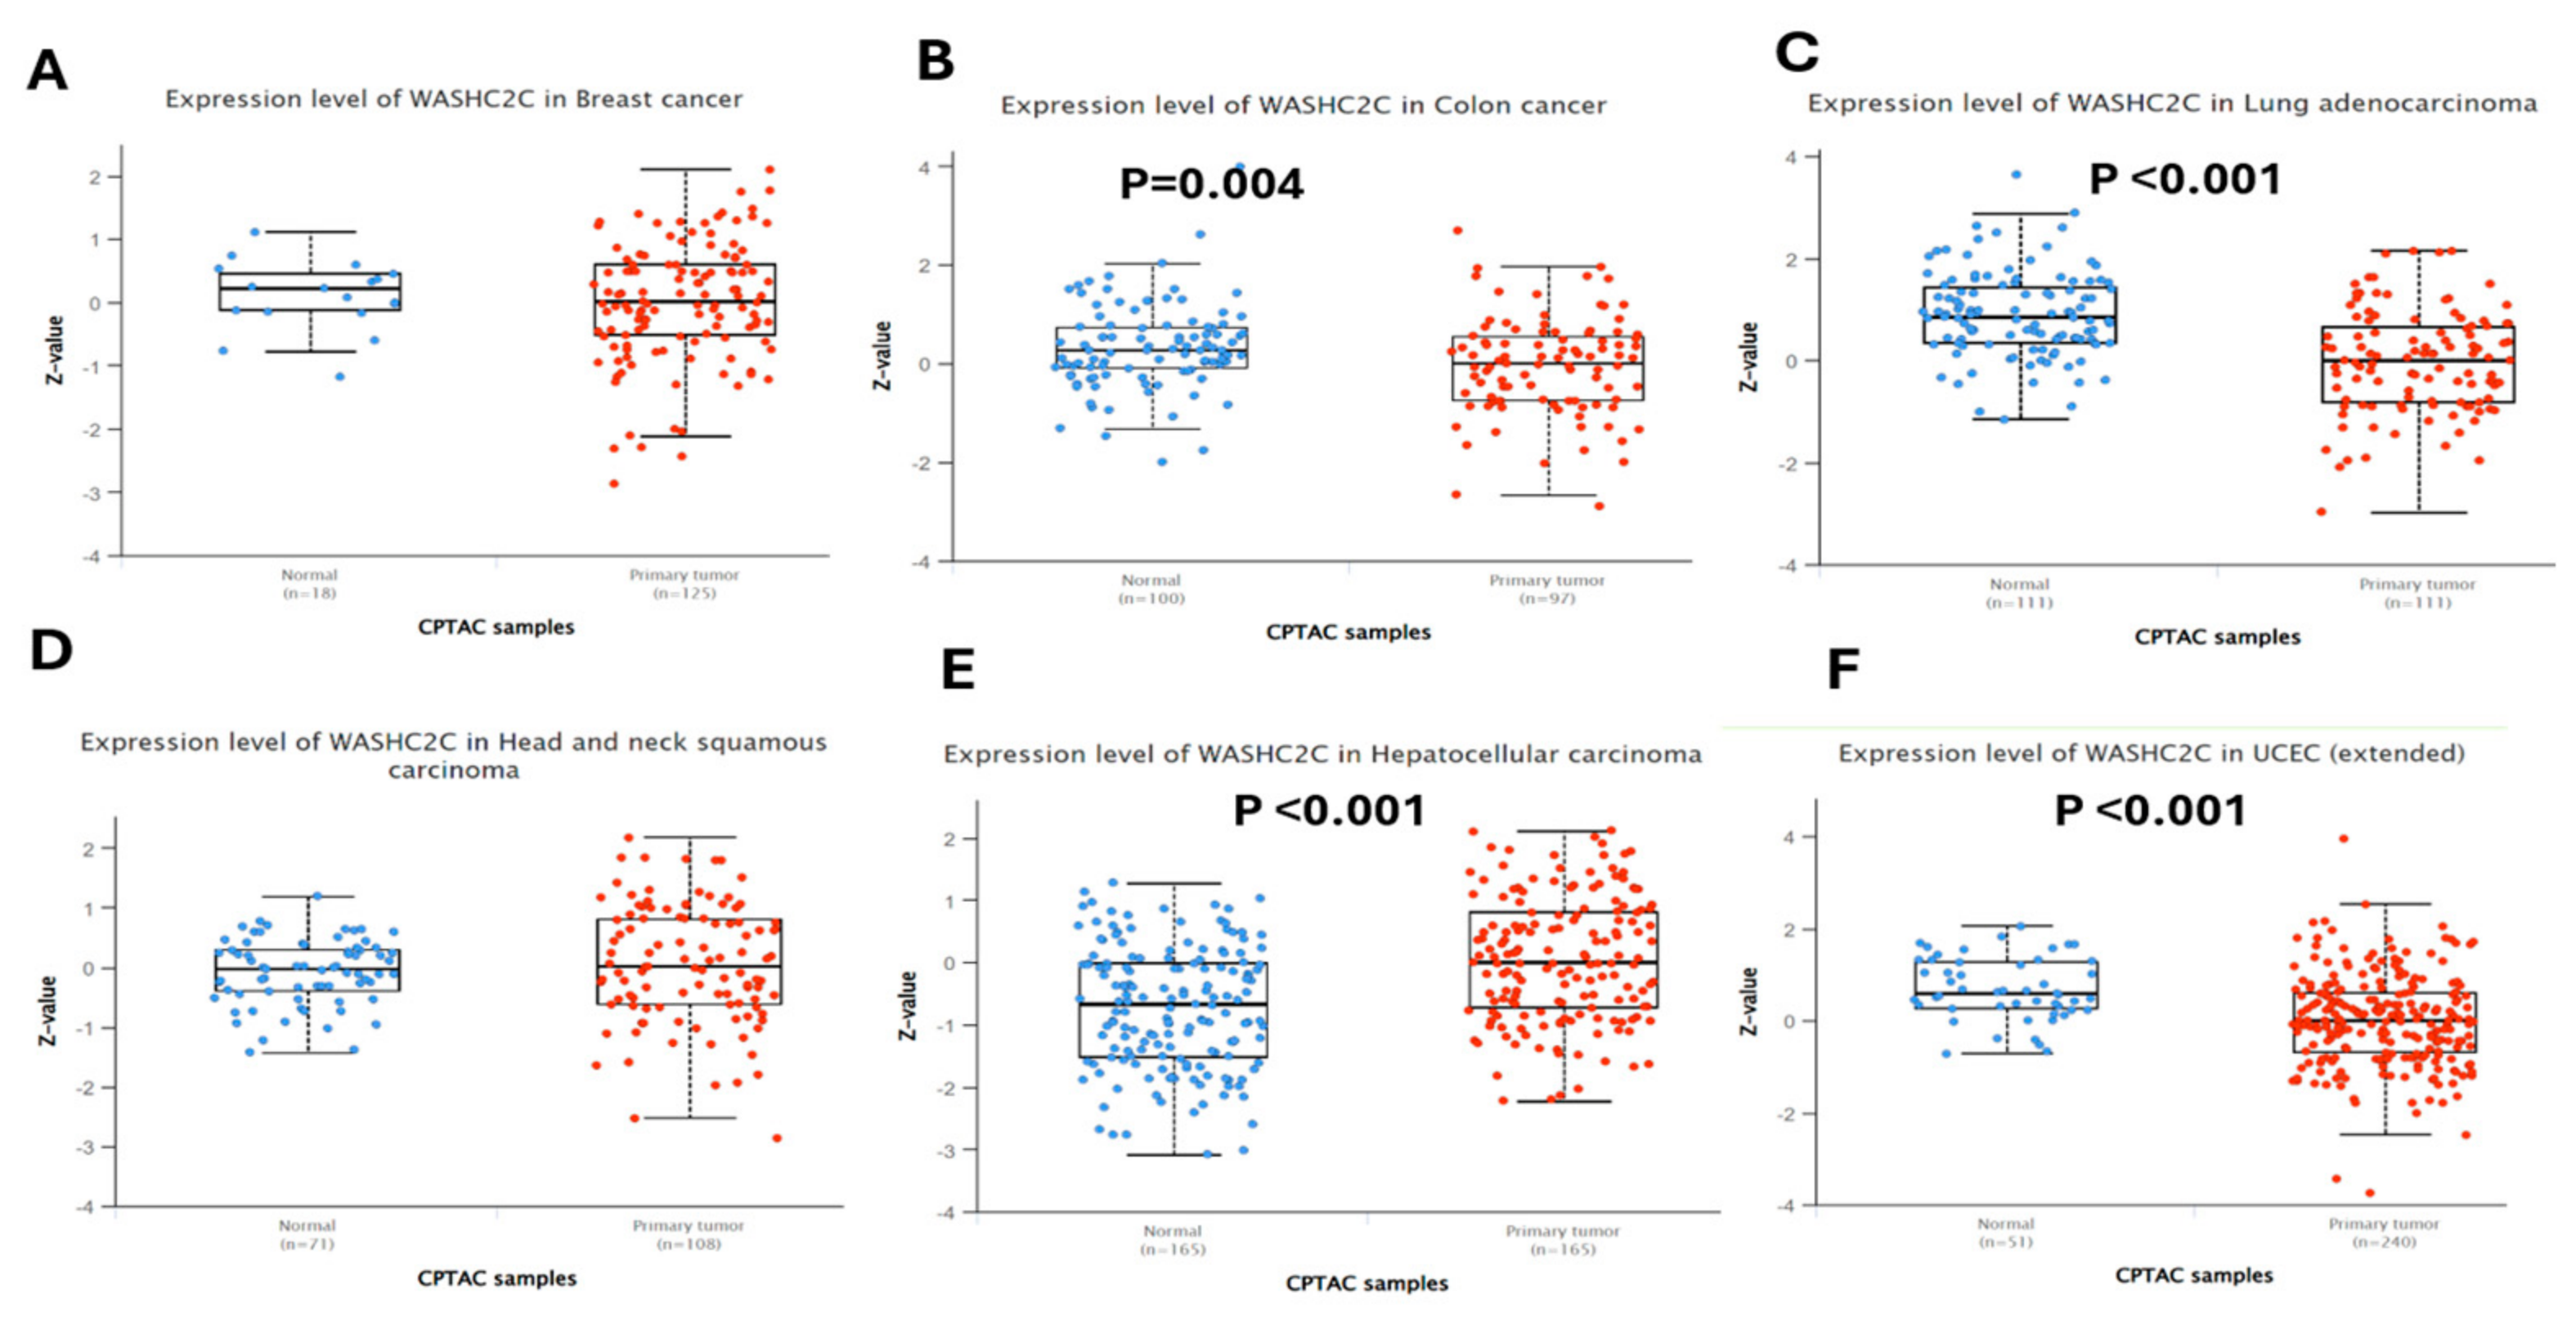
Figure 5.
Immunohistochemical validation of WASHC2C protein expression using the Human Protein Atlas. Representative IHC images compare normal tissues (left) with corresponding tumors (right). Brown staining indicates WASHC2C immunoreactivity. Increased staining was observed in CHOL, LIHC, and HNSC, whereas reduced staining was detected in BRCA, COAD, LUAD, KICH, LUSC, and UCEC.
Figure 5.
Immunohistochemical validation of WASHC2C protein expression using the Human Protein Atlas. Representative IHC images compare normal tissues (left) with corresponding tumors (right). Brown staining indicates WASHC2C immunoreactivity. Increased staining was observed in CHOL, LIHC, and HNSC, whereas reduced staining was detected in BRCA, COAD, LUAD, KICH, LUSC, and UCEC.
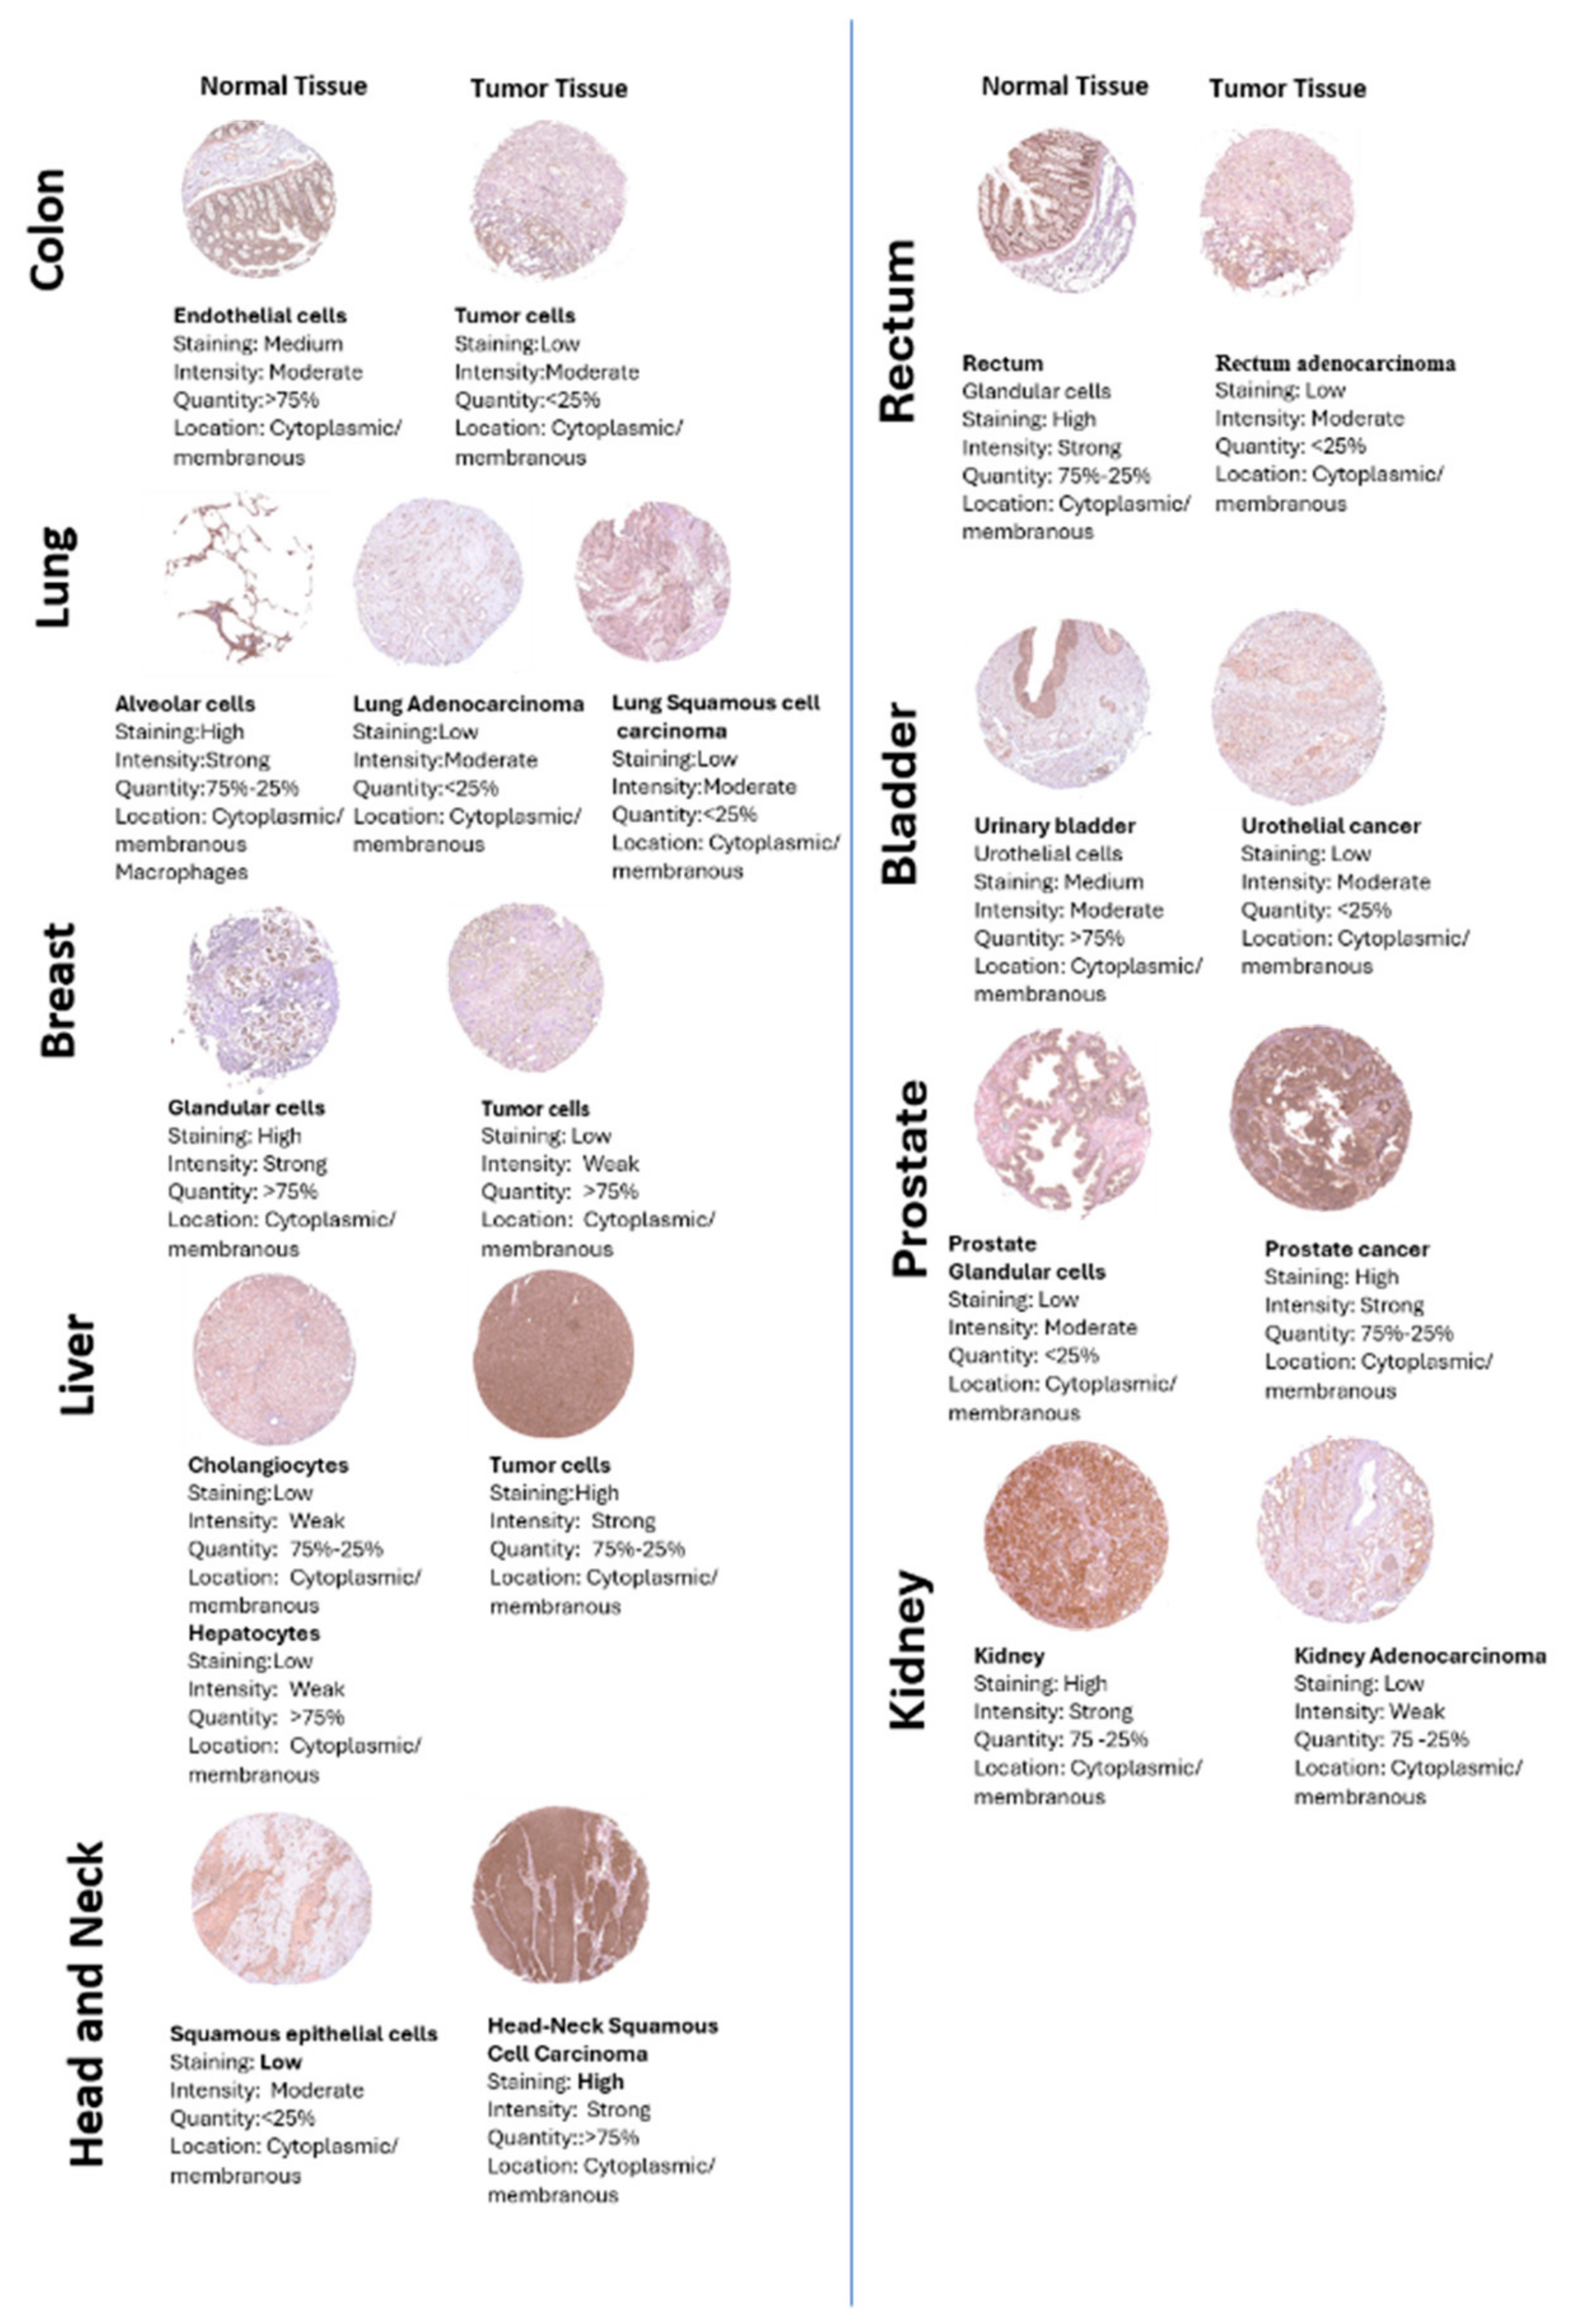
Figure 6.
Pan-cancer association of WASHC2C expression with survival outcomes. (A) Bubble plots summarizing Cox proportional-hazards analyses of WASHC2C expression in relation to DFI, DSS, OS, and PFS across selected cancer types. Bubble color represents the hazard ratio, with blue–purple indicating values below 1 and red indicating values above 1. Bubble size is proportional to −log10(FDR). Black outlines denote Cox P ≤ 0.05, whereas gray outlines indicate P > 0.05. No correlation coefficients are presented. (B) Kaplan–Meier curves showing significant differences in survival between high- and low-WASHC2C expression groups in BLCA, LIHC, and LUAD. The red and blue curves represent the higher- and lower-expression groups, respectively; vertical marks indicate censored observations. Survival distributions were compared using the log-rank test, and dashed lines indicate median survival estimates where reached.
Figure 6.
Pan-cancer association of WASHC2C expression with survival outcomes. (A) Bubble plots summarizing Cox proportional-hazards analyses of WASHC2C expression in relation to DFI, DSS, OS, and PFS across selected cancer types. Bubble color represents the hazard ratio, with blue–purple indicating values below 1 and red indicating values above 1. Bubble size is proportional to −log10(FDR). Black outlines denote Cox P ≤ 0.05, whereas gray outlines indicate P > 0.05. No correlation coefficients are presented. (B) Kaplan–Meier curves showing significant differences in survival between high- and low-WASHC2C expression groups in BLCA, LIHC, and LUAD. The red and blue curves represent the higher- and lower-expression groups, respectively; vertical marks indicate censored observations. Survival distributions were compared using the log-rank test, and dashed lines indicate median survival estimates where reached.
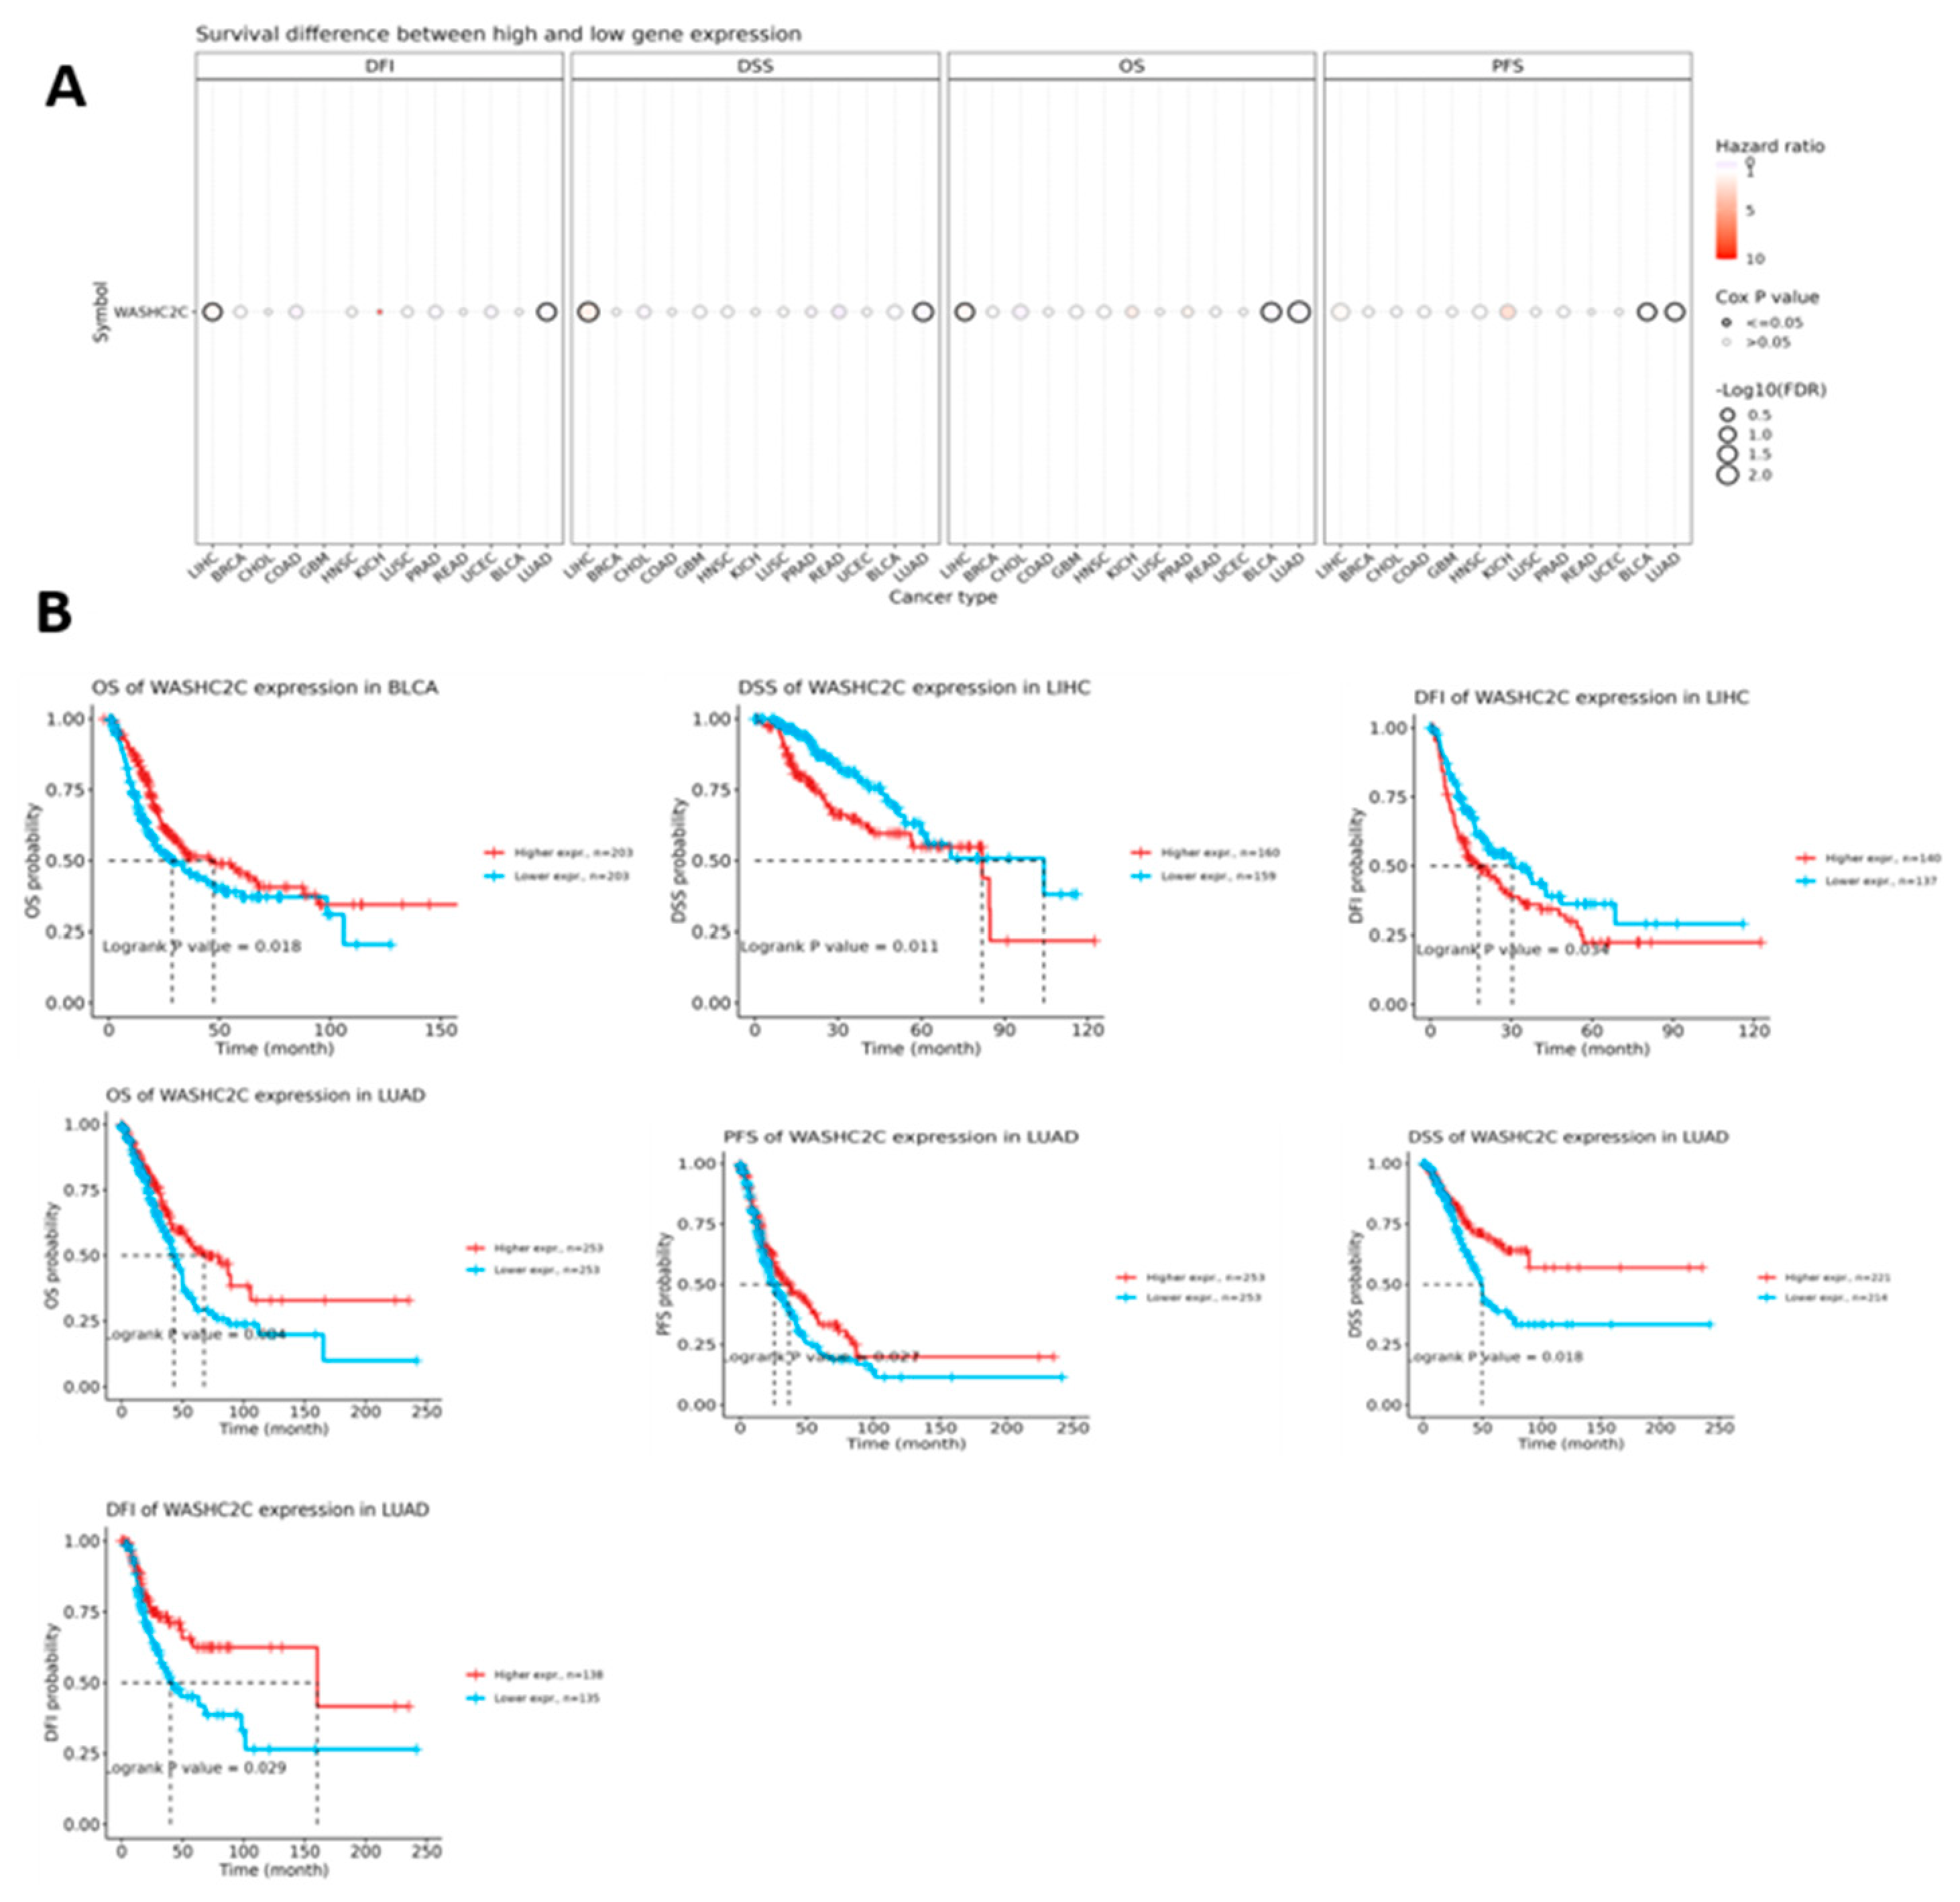
Figure 7.
Association of WASHC2C expression with tumor stage across selected TCGA cancer types. (A) Heatmap showing the distribution of WASHC2C expression across pathological stages I–IV in BLCA, COAD, LUAD, HNSC, BRCA, CHOL, LIHC, LUSC, KICH, and READ. Expression levels are presented as log2-transformed RSEM values. (B) Bubble plots summarizing differences in WASHC2C expression among clinical and pathological stages. Bubble size and color represent −log10(FDR), while outlined bubbles indicate statistically significant stage-related differences. (C) Trend plot illustrating increasing, decreasing, or relatively unchanged WASHC2C expression across pathological stages in each cancer type. (D) Boxplots comparing WASHC2C expression among pathological stages I–IV in BLCA, BRCA, CHOL, COAD, HNSC, KICH, LIHC, LUAD, and LUSC. Sample sizes are shown in the legends, and pairwise P values are displayed above the corresponding comparisons.
Figure 7.
Association of WASHC2C expression with tumor stage across selected TCGA cancer types. (A) Heatmap showing the distribution of WASHC2C expression across pathological stages I–IV in BLCA, COAD, LUAD, HNSC, BRCA, CHOL, LIHC, LUSC, KICH, and READ. Expression levels are presented as log2-transformed RSEM values. (B) Bubble plots summarizing differences in WASHC2C expression among clinical and pathological stages. Bubble size and color represent −log10(FDR), while outlined bubbles indicate statistically significant stage-related differences. (C) Trend plot illustrating increasing, decreasing, or relatively unchanged WASHC2C expression across pathological stages in each cancer type. (D) Boxplots comparing WASHC2C expression among pathological stages I–IV in BLCA, BRCA, CHOL, COAD, HNSC, KICH, LIHC, LUAD, and LUSC. Sample sizes are shown in the legends, and pairwise P values are displayed above the corresponding comparisons.
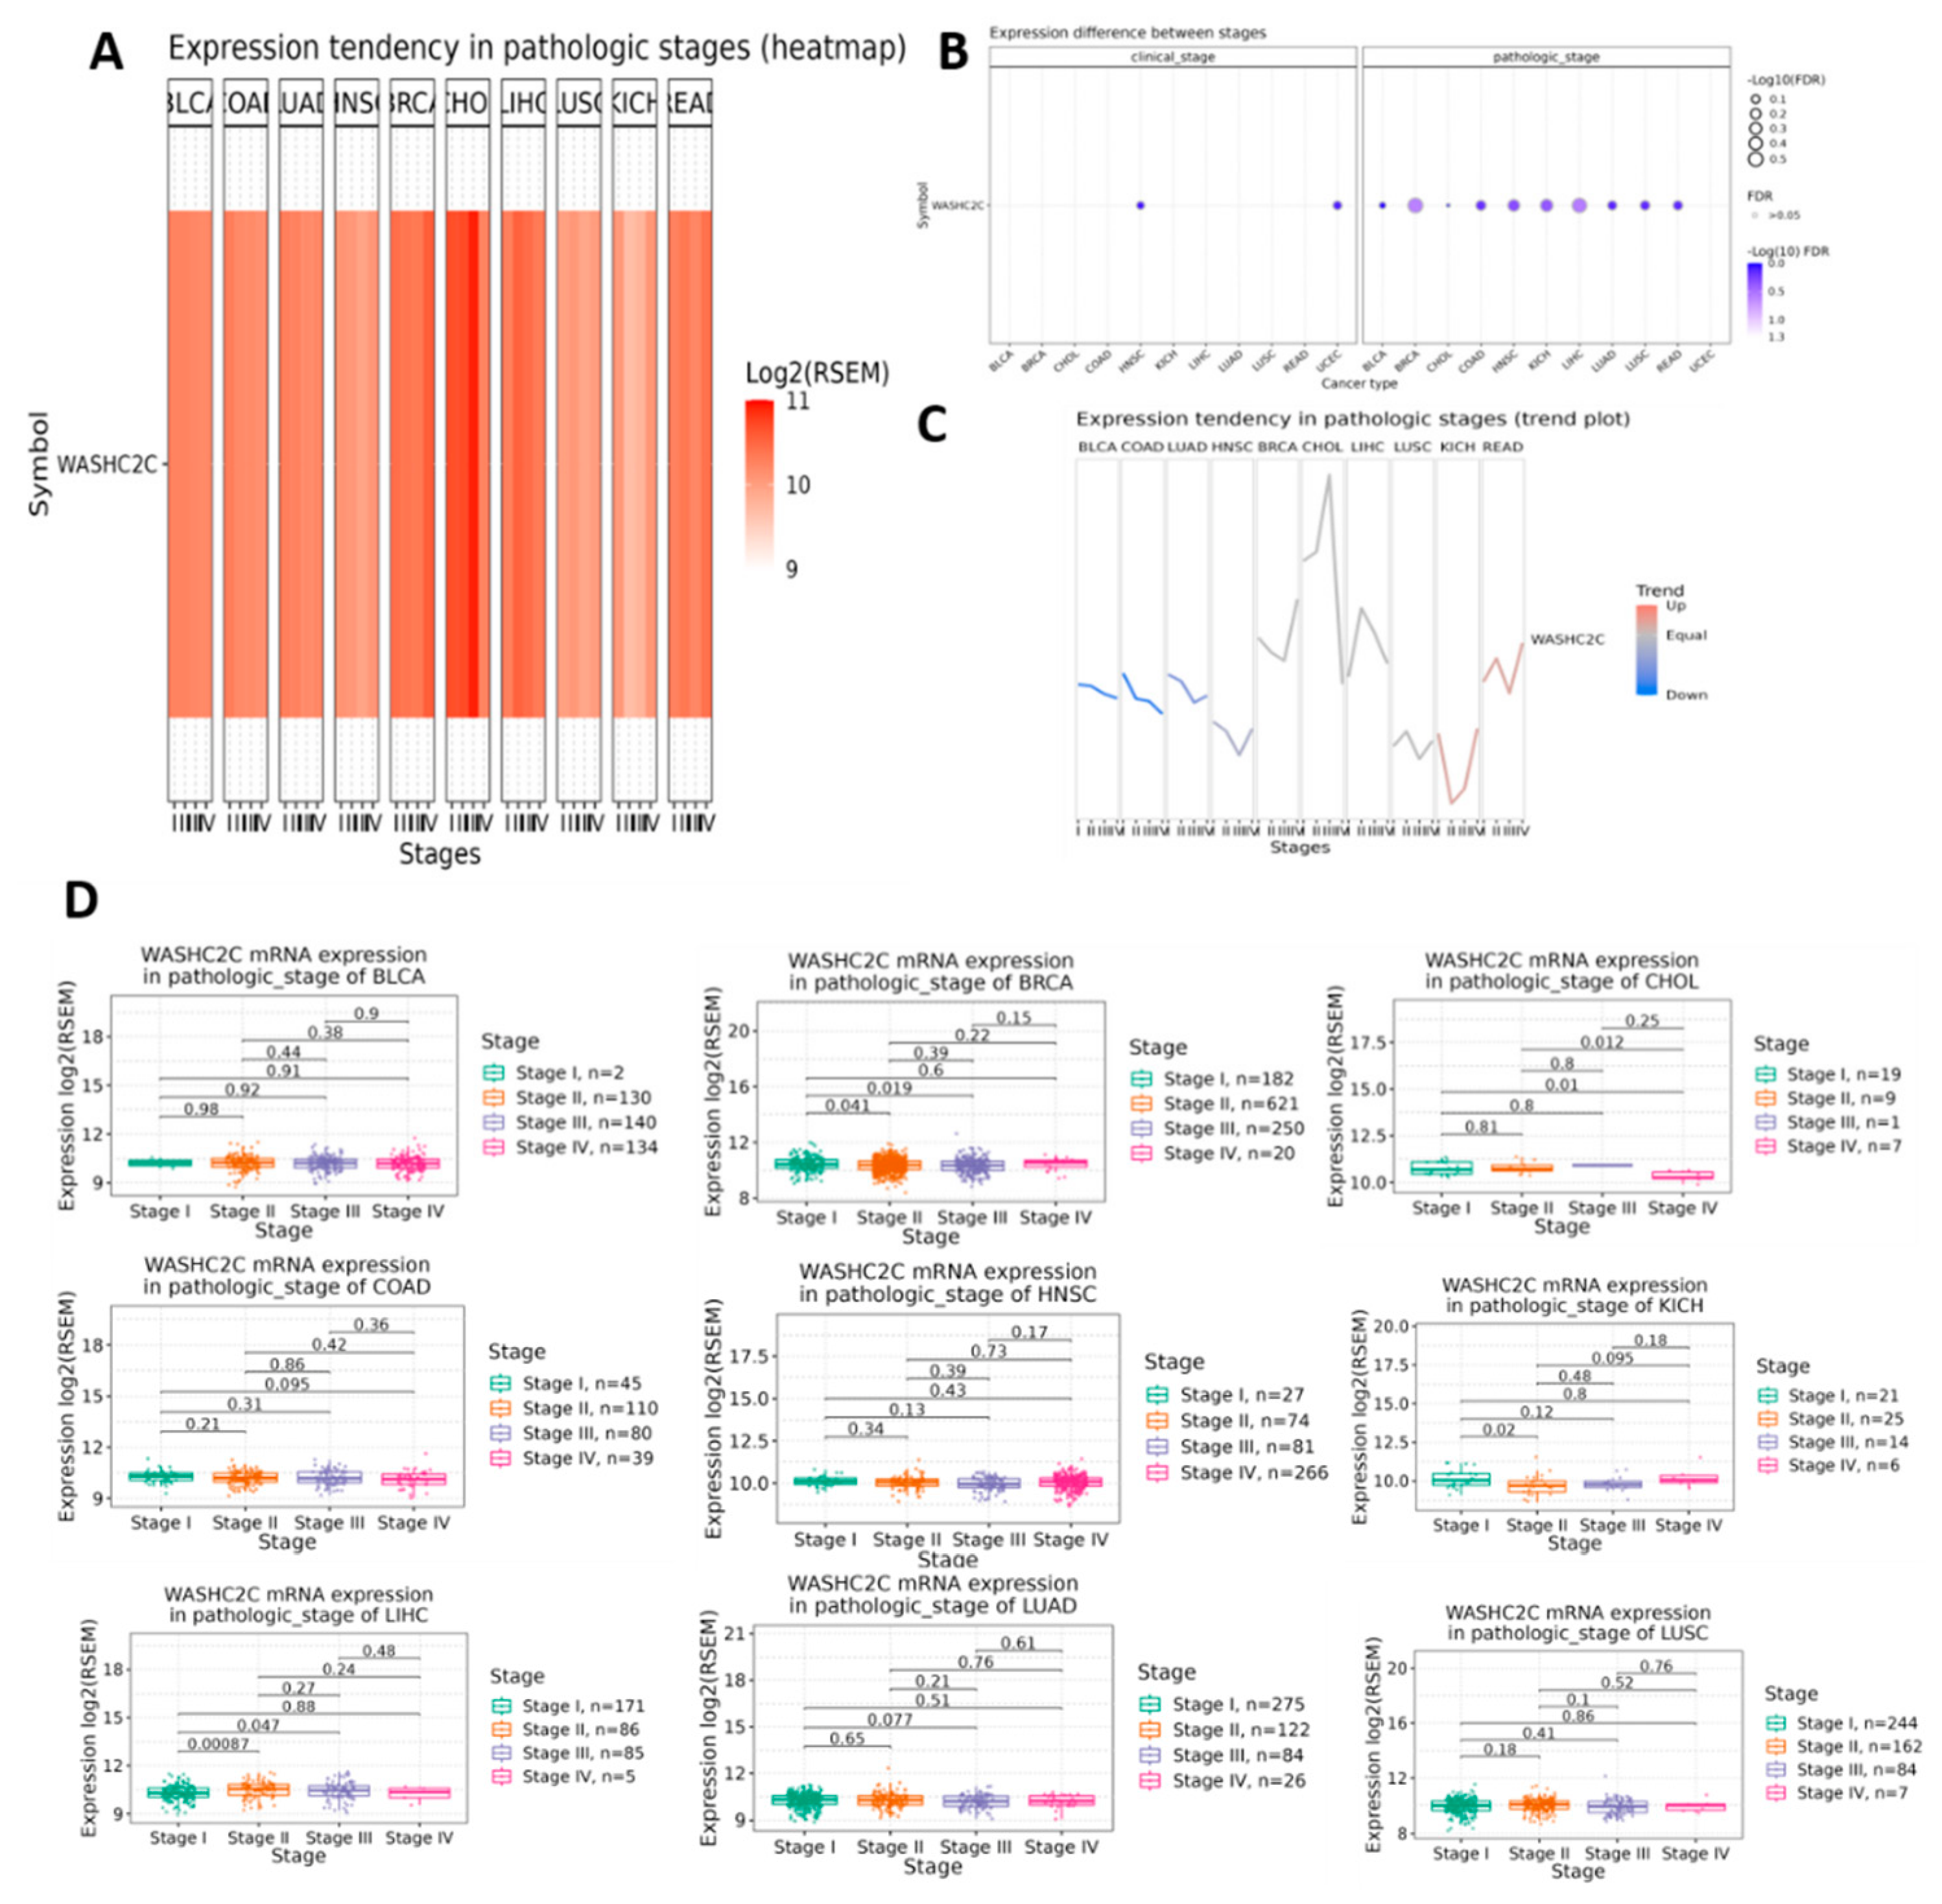
Figure 8.
Association between WASHC2C expression and oncogenic pathway activity across selected cancer types. (A) Summary heatmap showing the percentage of cancer types in which WASHC2C expression was associated with activation (A) or inhibition (I) of CellCycle, DNADamage, Hormone ER, PI3KAKT, RASMAPK, and RTK pathways. Red and blue indicate pathway activation and inhibition, respectively. (B) Boxplots comparing pathway activity scores between high- and low-WASHC2C expression groups in BLCA, BRCA, COAD, KICH, LUAD, LUSC, PRAD, and READ. Individual points represent tumor samples, center lines indicate medians, and boxes represent interquartile ranges. FDR-adjusted P values are displayed above each comparison.
Figure 8.
Association between WASHC2C expression and oncogenic pathway activity across selected cancer types. (A) Summary heatmap showing the percentage of cancer types in which WASHC2C expression was associated with activation (A) or inhibition (I) of CellCycle, DNADamage, Hormone ER, PI3KAKT, RASMAPK, and RTK pathways. Red and blue indicate pathway activation and inhibition, respectively. (B) Boxplots comparing pathway activity scores between high- and low-WASHC2C expression groups in BLCA, BRCA, COAD, KICH, LUAD, LUSC, PRAD, and READ. Individual points represent tumor samples, center lines indicate medians, and boxes represent interquartile ranges. FDR-adjusted P values are displayed above each comparison.
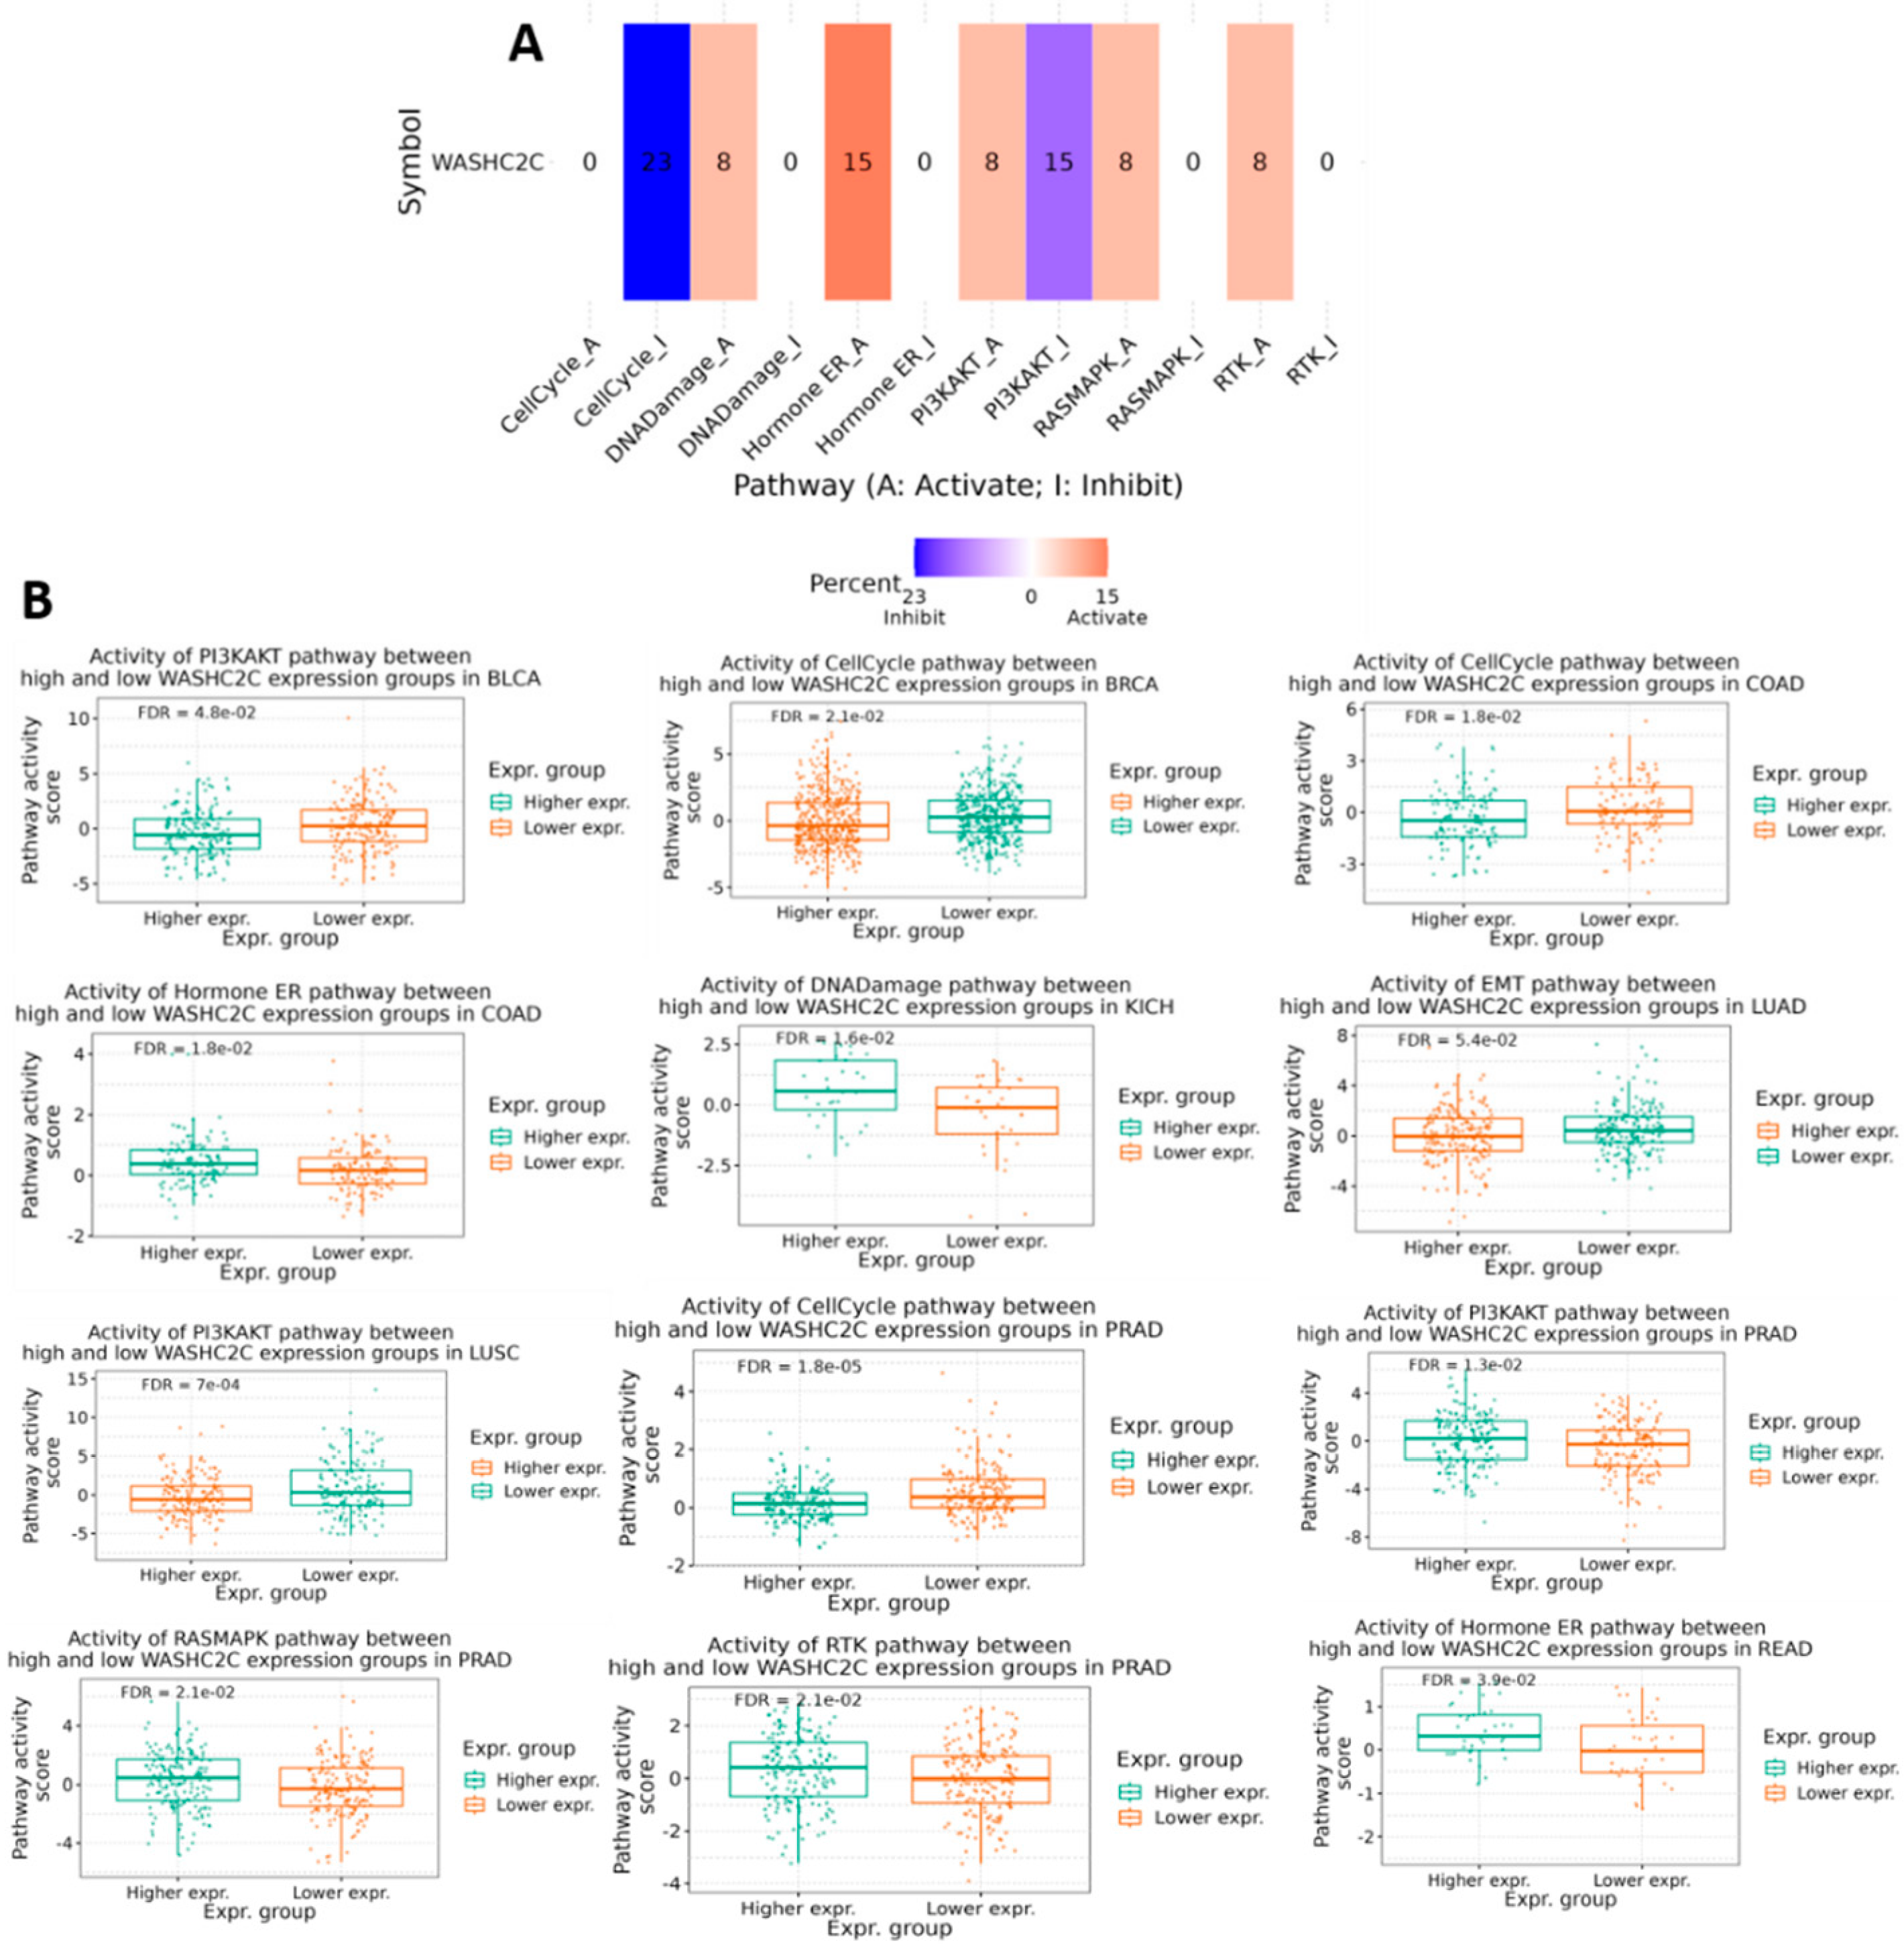
Figure 9.
Cancer-specific enrichment, expression distribution, and prognostic relevance of the WASHC2C-associated GSVA signature.(A) Gene-set enrichment analysis showing normalized enrichment scores for the WASHC2C-associated gene set across selected cancer types. Positive and negative scores indicate relative enrichment and depletion, respectively, while color intensity represents −log10-adjusted P values. (B) Distribution of GSVA scores in tumor tissues (red) and normal tissues (blue). Boxes represent the interquartile range, center lines indicate medians, and individual points represent samples. (C) Bubble plot summarizing univariate Cox regression analyses of GSVA scores for OS, PFS, DSS, and DFI. Bubble color represents the hazard ratio, with values below 1 indicating a favorable association with a higher GSVA score and values above 1 indicating an adverse association. Bubble size corresponds to −log10(FDR); black outlines indicate Cox P ≤ 0.05, whereas gray outlines indicate P > 0.05. (D) Kaplan–Meier curves for the significant associations in BLCA and LUAD. Patients were stratified into high- and low-GSVA groups, shown in red and blue, respectively. Survival differences were evaluated using the log-rank test; vertical marks indicate censored observations, and dashed lines indicate median survival. Effect direction is represented by the normalized enrichment score in panel A and the hazard ratio in panel C.
Figure 9.
Cancer-specific enrichment, expression distribution, and prognostic relevance of the WASHC2C-associated GSVA signature.(A) Gene-set enrichment analysis showing normalized enrichment scores for the WASHC2C-associated gene set across selected cancer types. Positive and negative scores indicate relative enrichment and depletion, respectively, while color intensity represents −log10-adjusted P values. (B) Distribution of GSVA scores in tumor tissues (red) and normal tissues (blue). Boxes represent the interquartile range, center lines indicate medians, and individual points represent samples. (C) Bubble plot summarizing univariate Cox regression analyses of GSVA scores for OS, PFS, DSS, and DFI. Bubble color represents the hazard ratio, with values below 1 indicating a favorable association with a higher GSVA score and values above 1 indicating an adverse association. Bubble size corresponds to −log10(FDR); black outlines indicate Cox P ≤ 0.05, whereas gray outlines indicate P > 0.05. (D) Kaplan–Meier curves for the significant associations in BLCA and LUAD. Patients were stratified into high- and low-GSVA groups, shown in red and blue, respectively. Survival differences were evaluated using the log-rank test; vertical marks indicate censored observations, and dashed lines indicate median survival. Effect direction is represented by the normalized enrichment score in panel A and the hazard ratio in panel C.
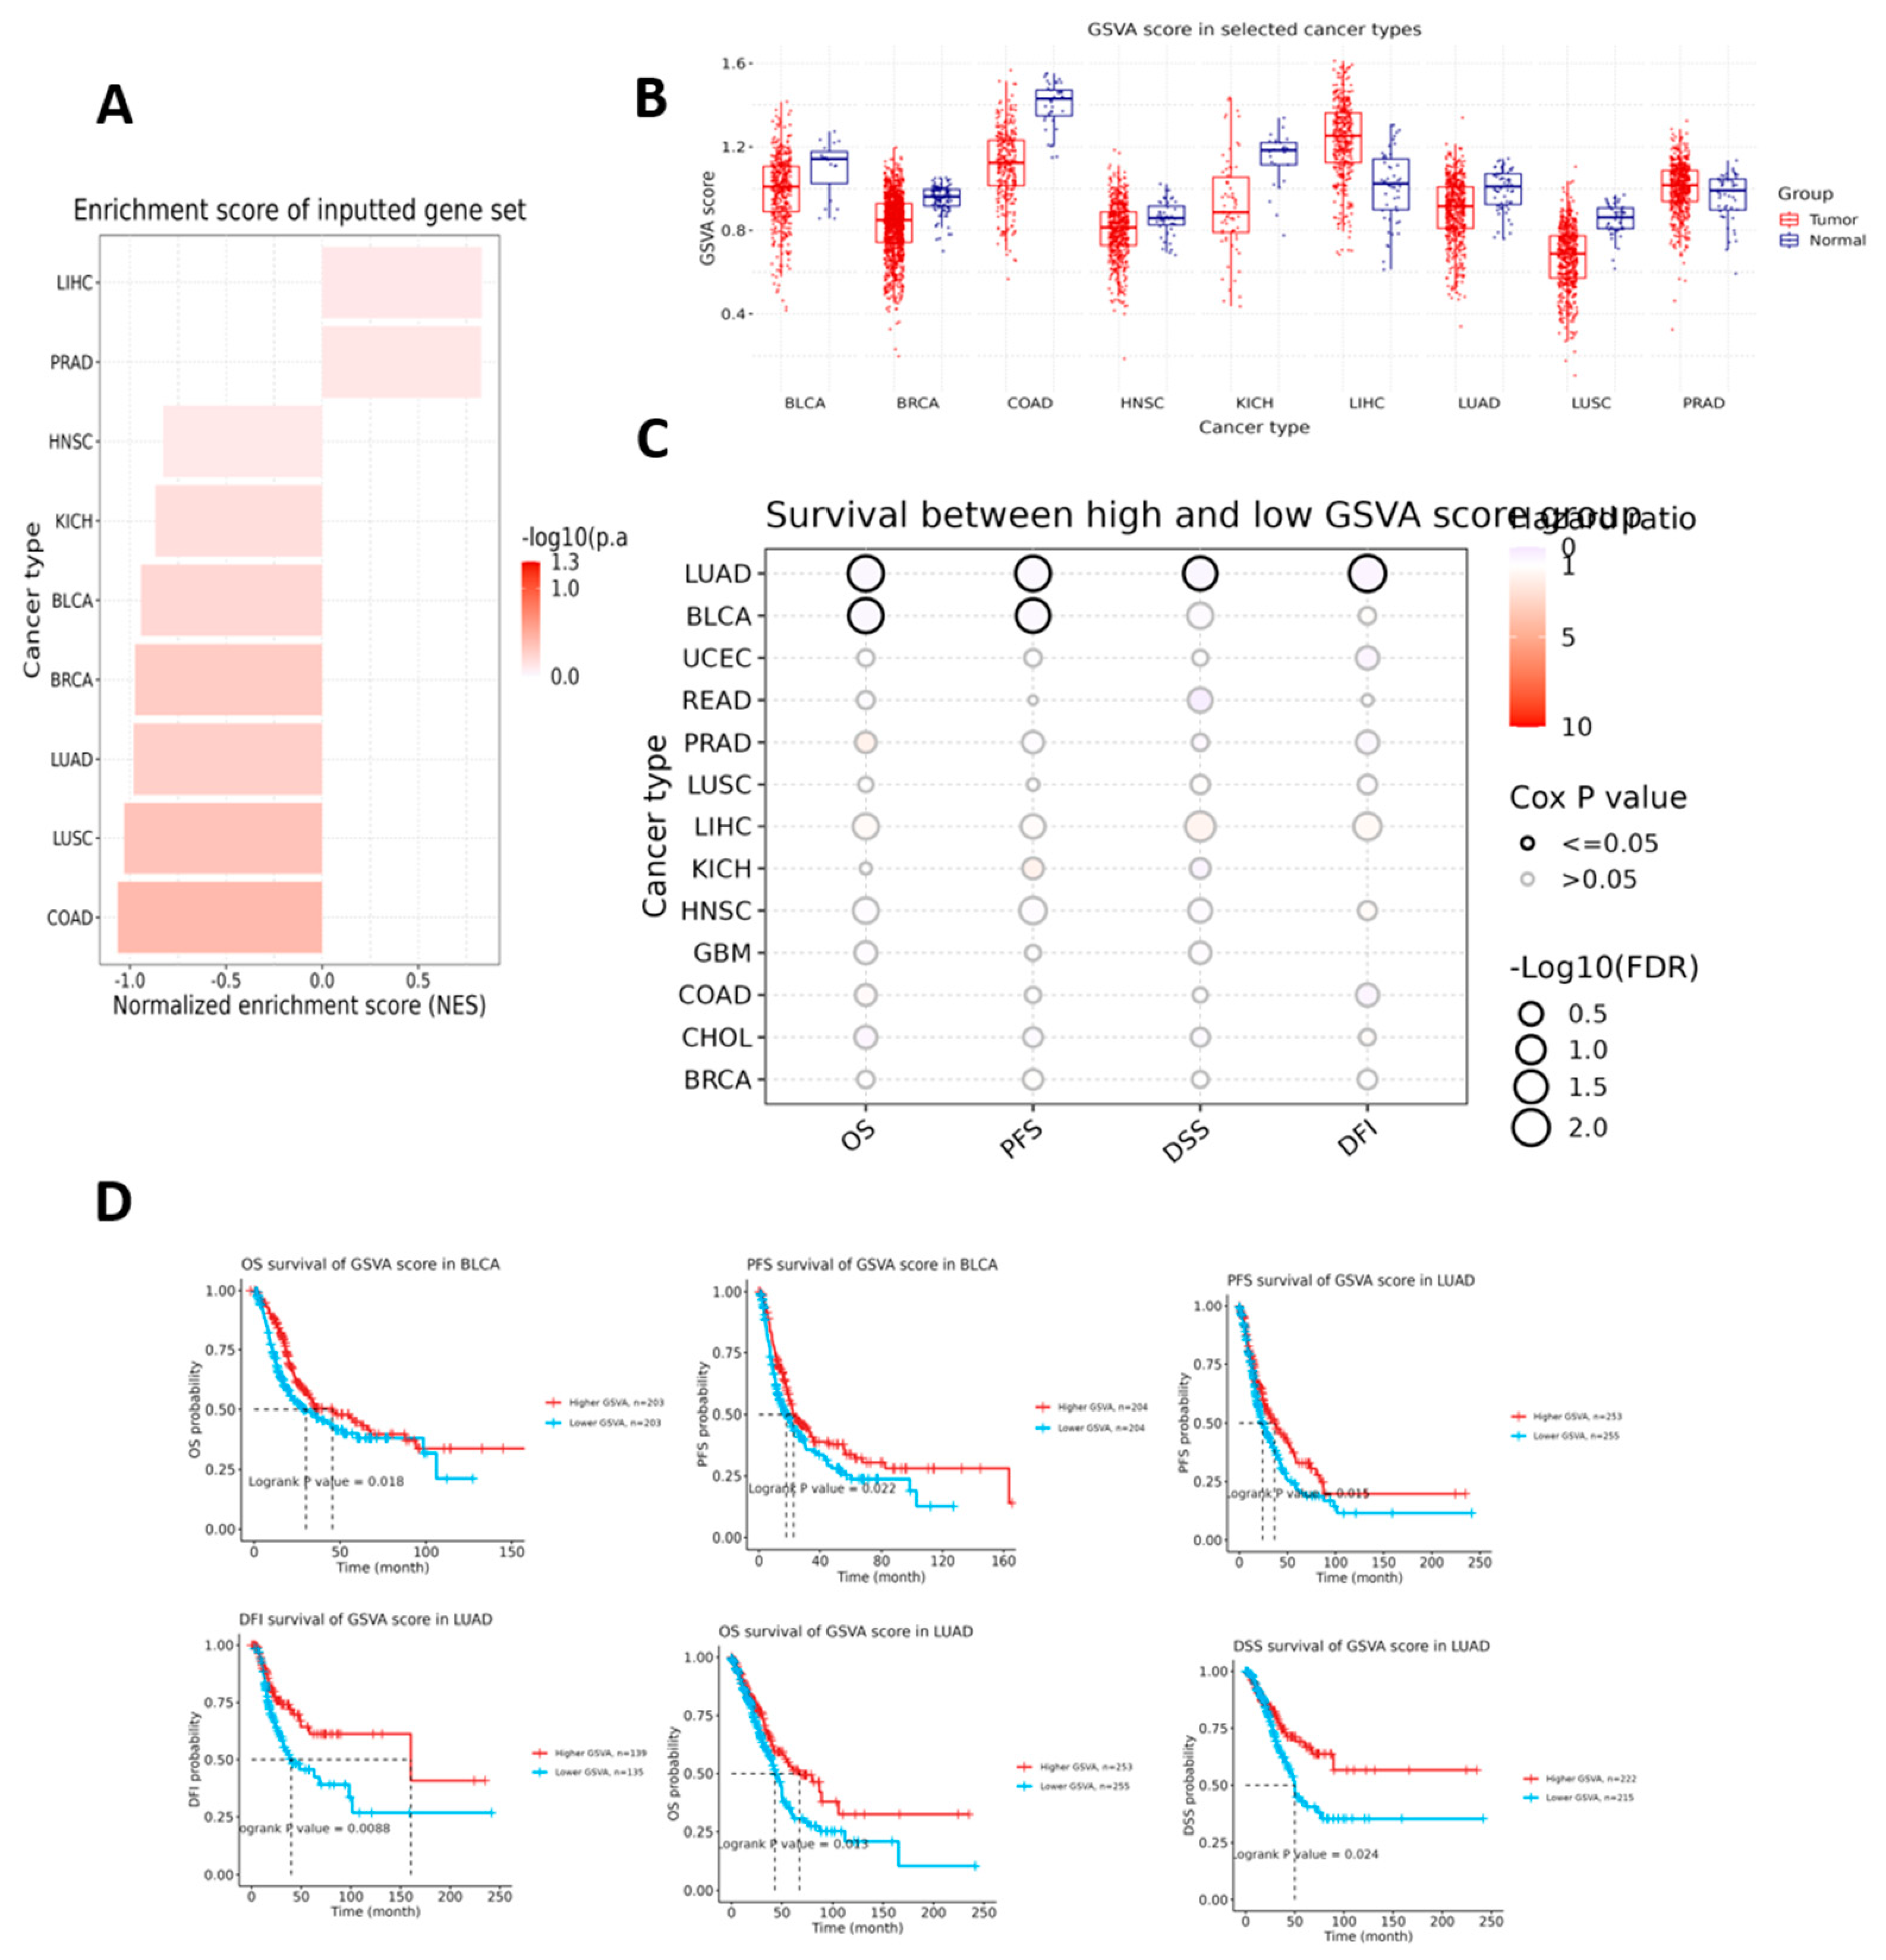
Figure 10.
Pan-cancer associations between the WASHC2C-related GSVA score and cancer-related pathway activity. (A) Heatmap showing Spearman correlation coefficients between the WASHC2C-related GSVA score and the activities of Apoptosis, CellCycle, DNADamage, EMT, Hormone AR, Hormone ER, PI3KAKT, RASMAPK, RTK, and TSCmTOR pathways across selected cancer types. Red indicates positive correlations, blue indicates negative correlations, and lighter colors indicate coefficients closer to zero. Asterisks denote nominal statistical significance, whereas hash symbols indicate associations that remained significant after FDR correction.(B) Representative scatterplots illustrating associations between the GSVA score and selected pathway activity scores in BLCA, BRCA, COAD, GBM, HNSC, KICH, LUAD, LUSC, PRAD, and READ. Each point represents an individual tumor sample. Blue lines show fitted trends, and gray-shaded regions represent 95% confidence intervals. The insets report the Spearman correlation coefficient and the FDR-adjusted P value. Multiple-testing correction was performed using the FDR method.
Figure 10.
Pan-cancer associations between the WASHC2C-related GSVA score and cancer-related pathway activity. (A) Heatmap showing Spearman correlation coefficients between the WASHC2C-related GSVA score and the activities of Apoptosis, CellCycle, DNADamage, EMT, Hormone AR, Hormone ER, PI3KAKT, RASMAPK, RTK, and TSCmTOR pathways across selected cancer types. Red indicates positive correlations, blue indicates negative correlations, and lighter colors indicate coefficients closer to zero. Asterisks denote nominal statistical significance, whereas hash symbols indicate associations that remained significant after FDR correction.(B) Representative scatterplots illustrating associations between the GSVA score and selected pathway activity scores in BLCA, BRCA, COAD, GBM, HNSC, KICH, LUAD, LUSC, PRAD, and READ. Each point represents an individual tumor sample. Blue lines show fitted trends, and gray-shaded regions represent 95% confidence intervals. The insets report the Spearman correlation coefficient and the FDR-adjusted P value. Multiple-testing correction was performed using the FDR method.
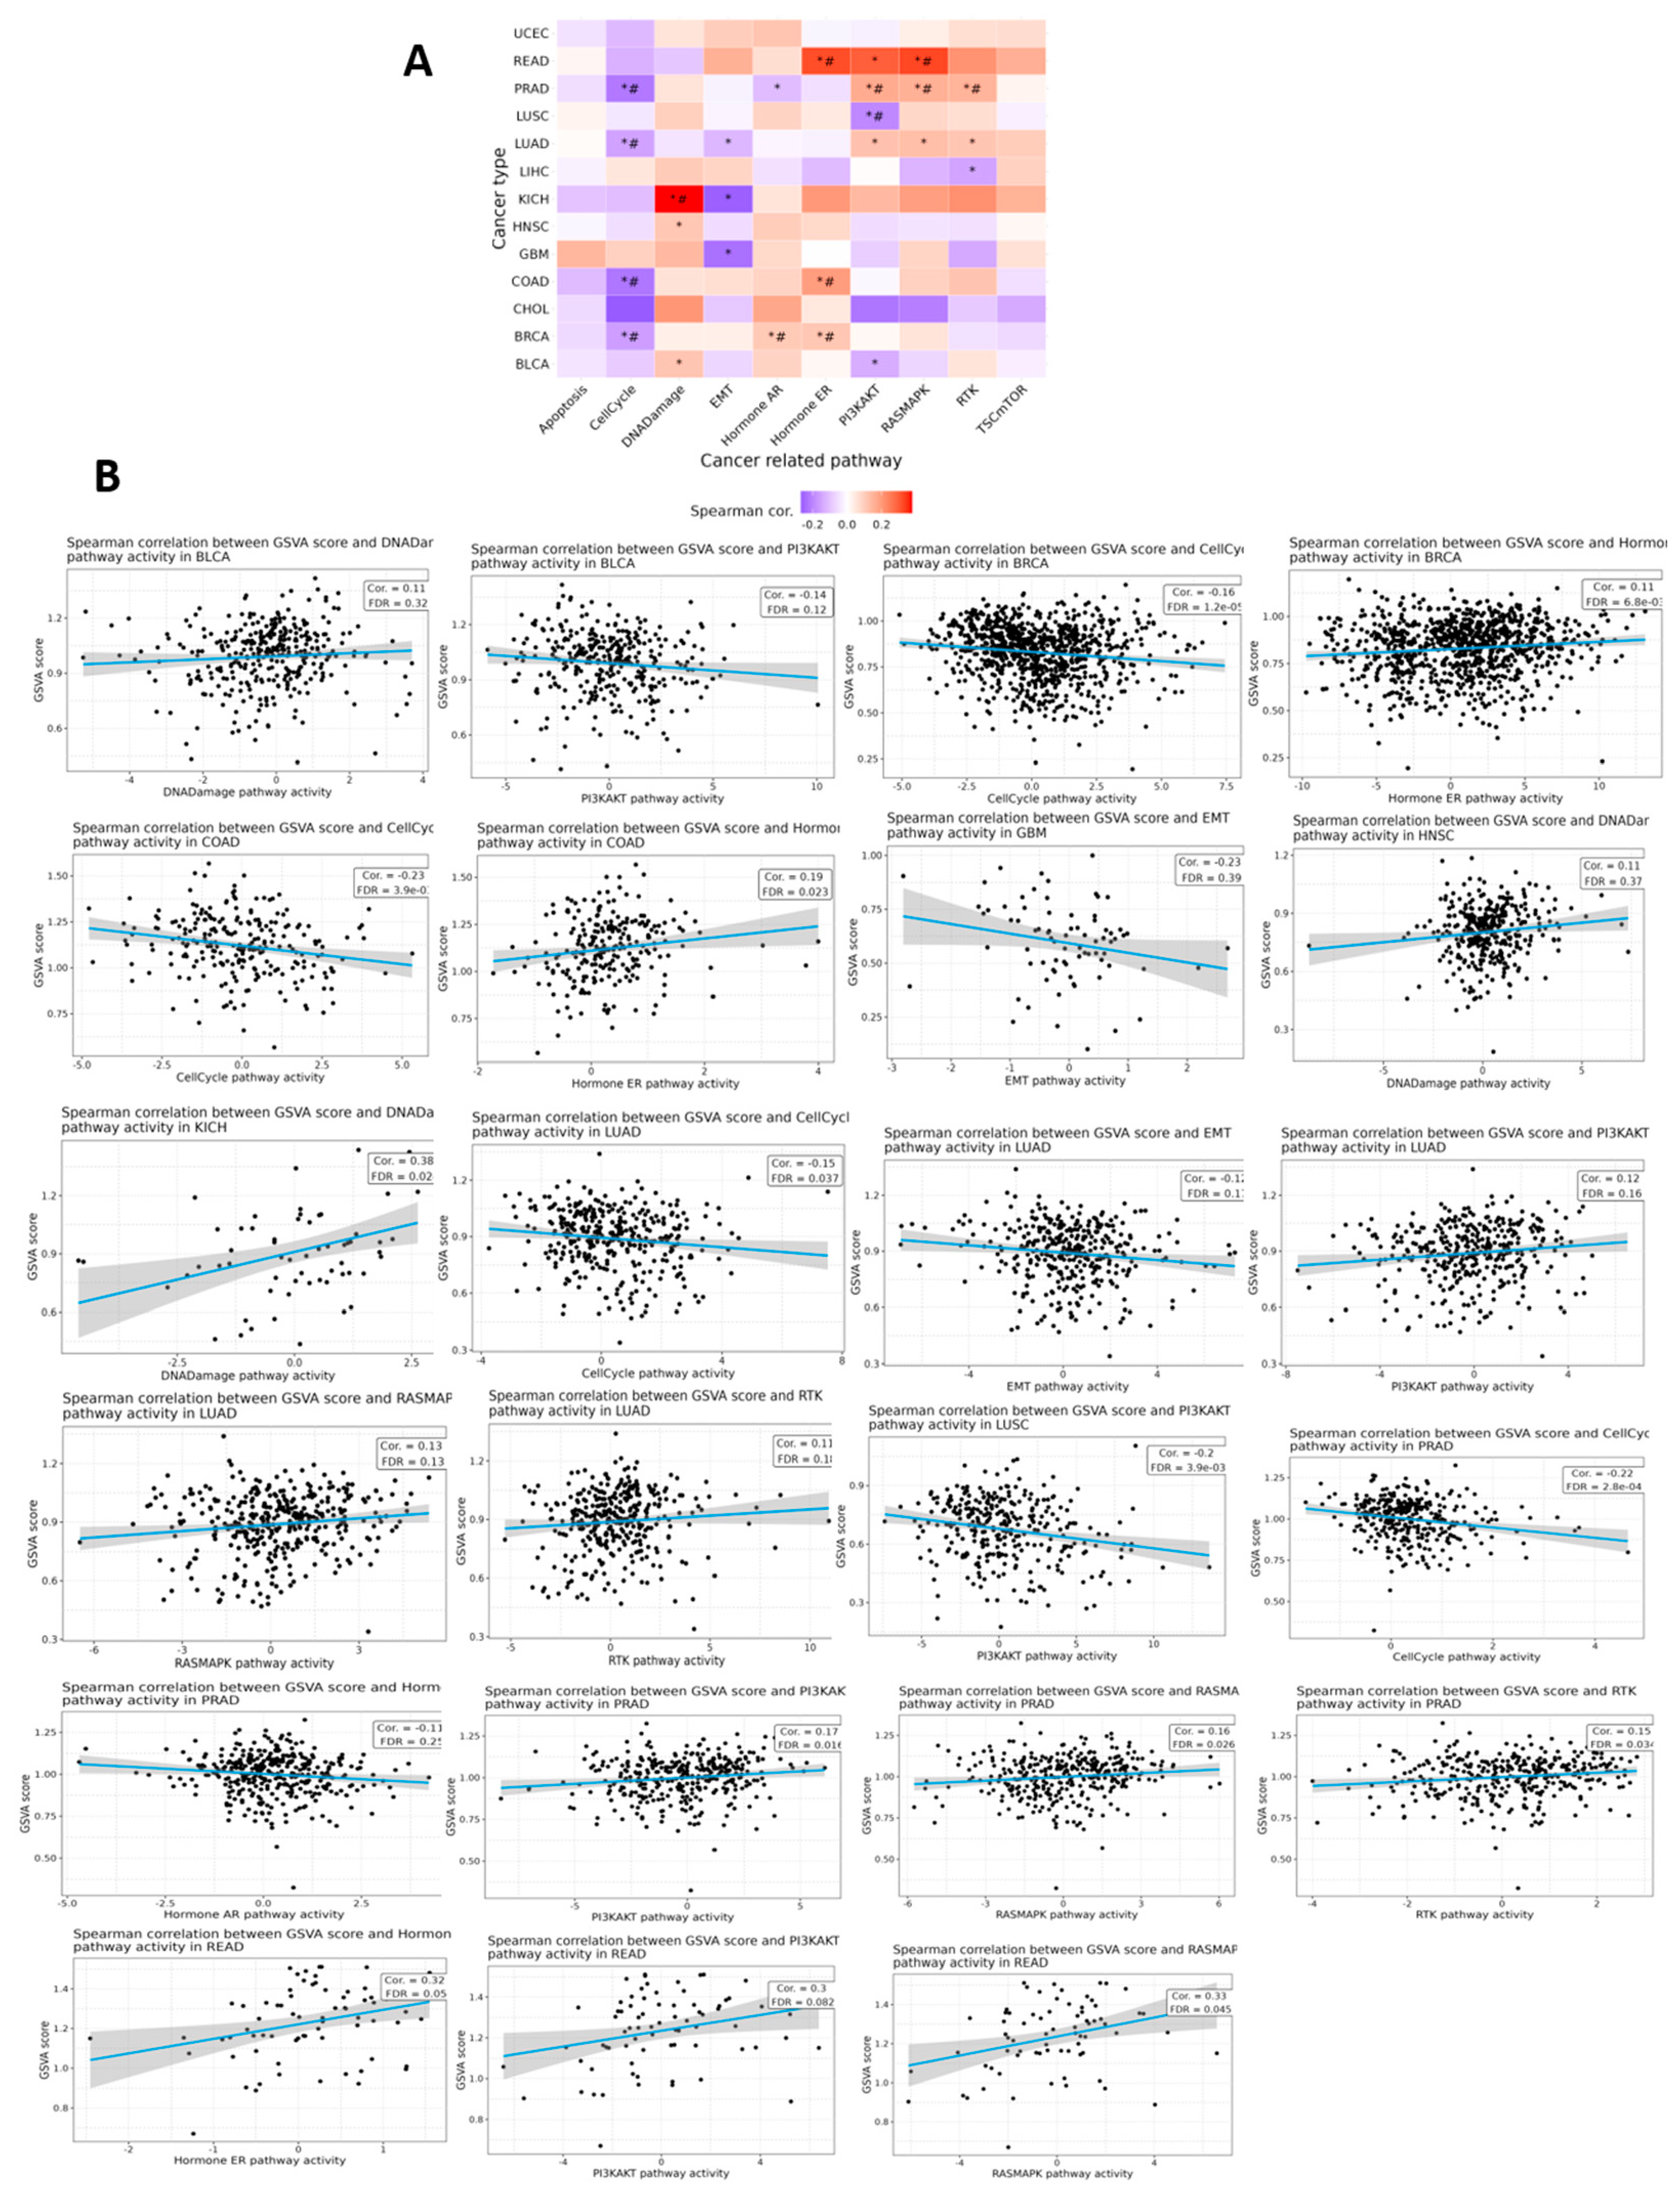
Figure 11.
Pan-cancer genomic alteration landscape of WASHC2C. (A) Heatmap showing the frequency of WASHC2C SNVs across selected cancer types. Columns represent cancer cohorts, with the total sample size indicated in parentheses. Numbers within cells indicate the number of samples carrying an SNV, whereas color intensity represents the corresponding mutation frequency. (B) Distribution of WASHC2C variants according to functional classification, including missense, frameshift deletion, nonsense, frameshift insertion, and splice-site variants. (C) Distribution of variant types, classified as SNPs, insertions, or deletions. (D) Spectrum of nucleotide substitutions, showing the numbers of C>A, C>G, C>T, T>A, T>C, and T>G events. (E) Number and classification of WASHC2C variants per altered sample; bar colors correspond to the variant classifications shown in panel B, and the median number of variants per sample is indicated. (F) Proportional summary of the detected variant classifications. (G) Gene-level mutation summary showing WASHC2C alterations among the 113 mutation-positive samples included in the gene-specific dataset; stacked colors represent the different variant classifications. (H) Distribution of WASHC2C copy-number states across selected cancer types. Red and dark red indicate heterozygous and homozygous amplification, respectively; light and dark green indicate heterozygous and homozygous deletion, respectively; gray indicates no copy-number alteration. No correlation coefficients, statistical tests, or significance indicators are displayed.
Figure 11.
Pan-cancer genomic alteration landscape of WASHC2C. (A) Heatmap showing the frequency of WASHC2C SNVs across selected cancer types. Columns represent cancer cohorts, with the total sample size indicated in parentheses. Numbers within cells indicate the number of samples carrying an SNV, whereas color intensity represents the corresponding mutation frequency. (B) Distribution of WASHC2C variants according to functional classification, including missense, frameshift deletion, nonsense, frameshift insertion, and splice-site variants. (C) Distribution of variant types, classified as SNPs, insertions, or deletions. (D) Spectrum of nucleotide substitutions, showing the numbers of C>A, C>G, C>T, T>A, T>C, and T>G events. (E) Number and classification of WASHC2C variants per altered sample; bar colors correspond to the variant classifications shown in panel B, and the median number of variants per sample is indicated. (F) Proportional summary of the detected variant classifications. (G) Gene-level mutation summary showing WASHC2C alterations among the 113 mutation-positive samples included in the gene-specific dataset; stacked colors represent the different variant classifications. (H) Distribution of WASHC2C copy-number states across selected cancer types. Red and dark red indicate heterozygous and homozygous amplification, respectively; light and dark green indicate heterozygous and homozygous deletion, respectively; gray indicates no copy-number alteration. No correlation coefficients, statistical tests, or significance indicators are displayed.
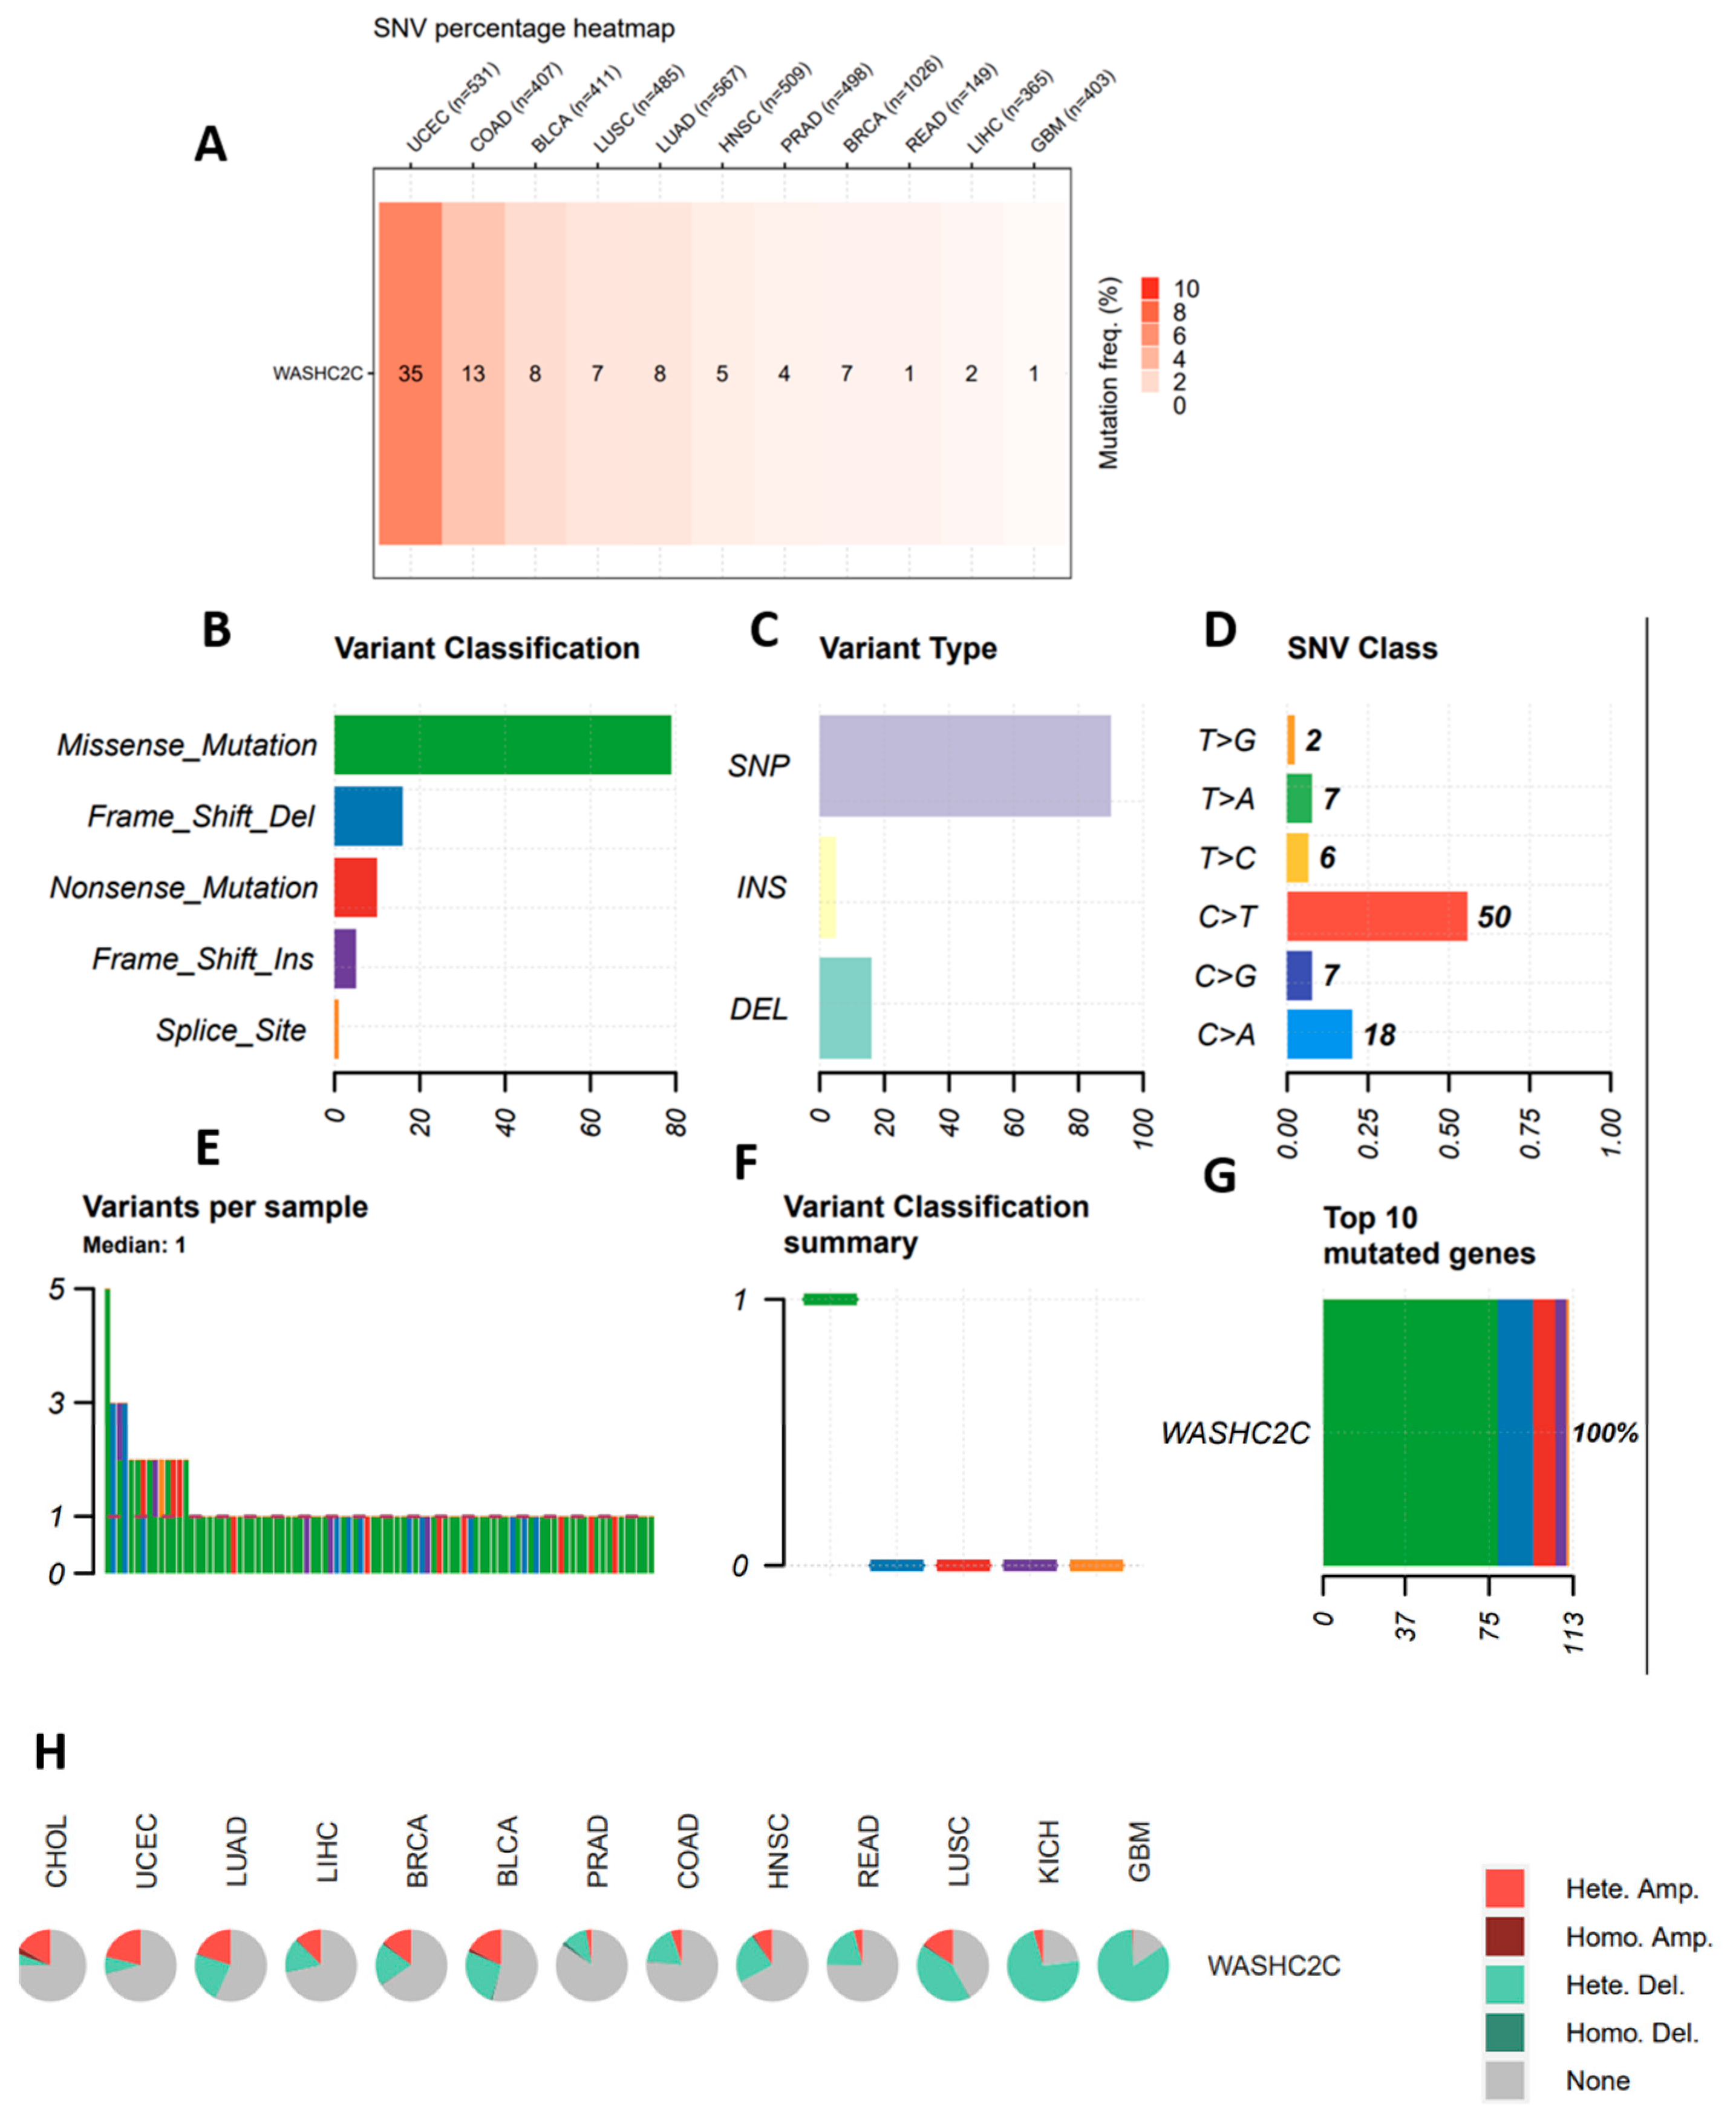
Figure 12.
Association of WASHC2C SNV status with survival outcomes. (A) Bubble plots summarize Cox analyses of DFI, DSS, OS, and PFS in WASHC2C-mutant versus wild-type tumors. Bubble color indicates the hazard ratio, size represents −log10(FDR), and outlines denote statistical significance. (B) Kaplan–Meier analysis of PFS in UCEC according to WASHC2C SNV status. Survival differences were assessed using the log-rank test.
Figure 12.
Association of WASHC2C SNV status with survival outcomes. (A) Bubble plots summarize Cox analyses of DFI, DSS, OS, and PFS in WASHC2C-mutant versus wild-type tumors. Bubble color indicates the hazard ratio, size represents −log10(FDR), and outlines denote statistical significance. (B) Kaplan–Meier analysis of PFS in UCEC according to WASHC2C SNV status. Survival differences were assessed using the log-rank test.
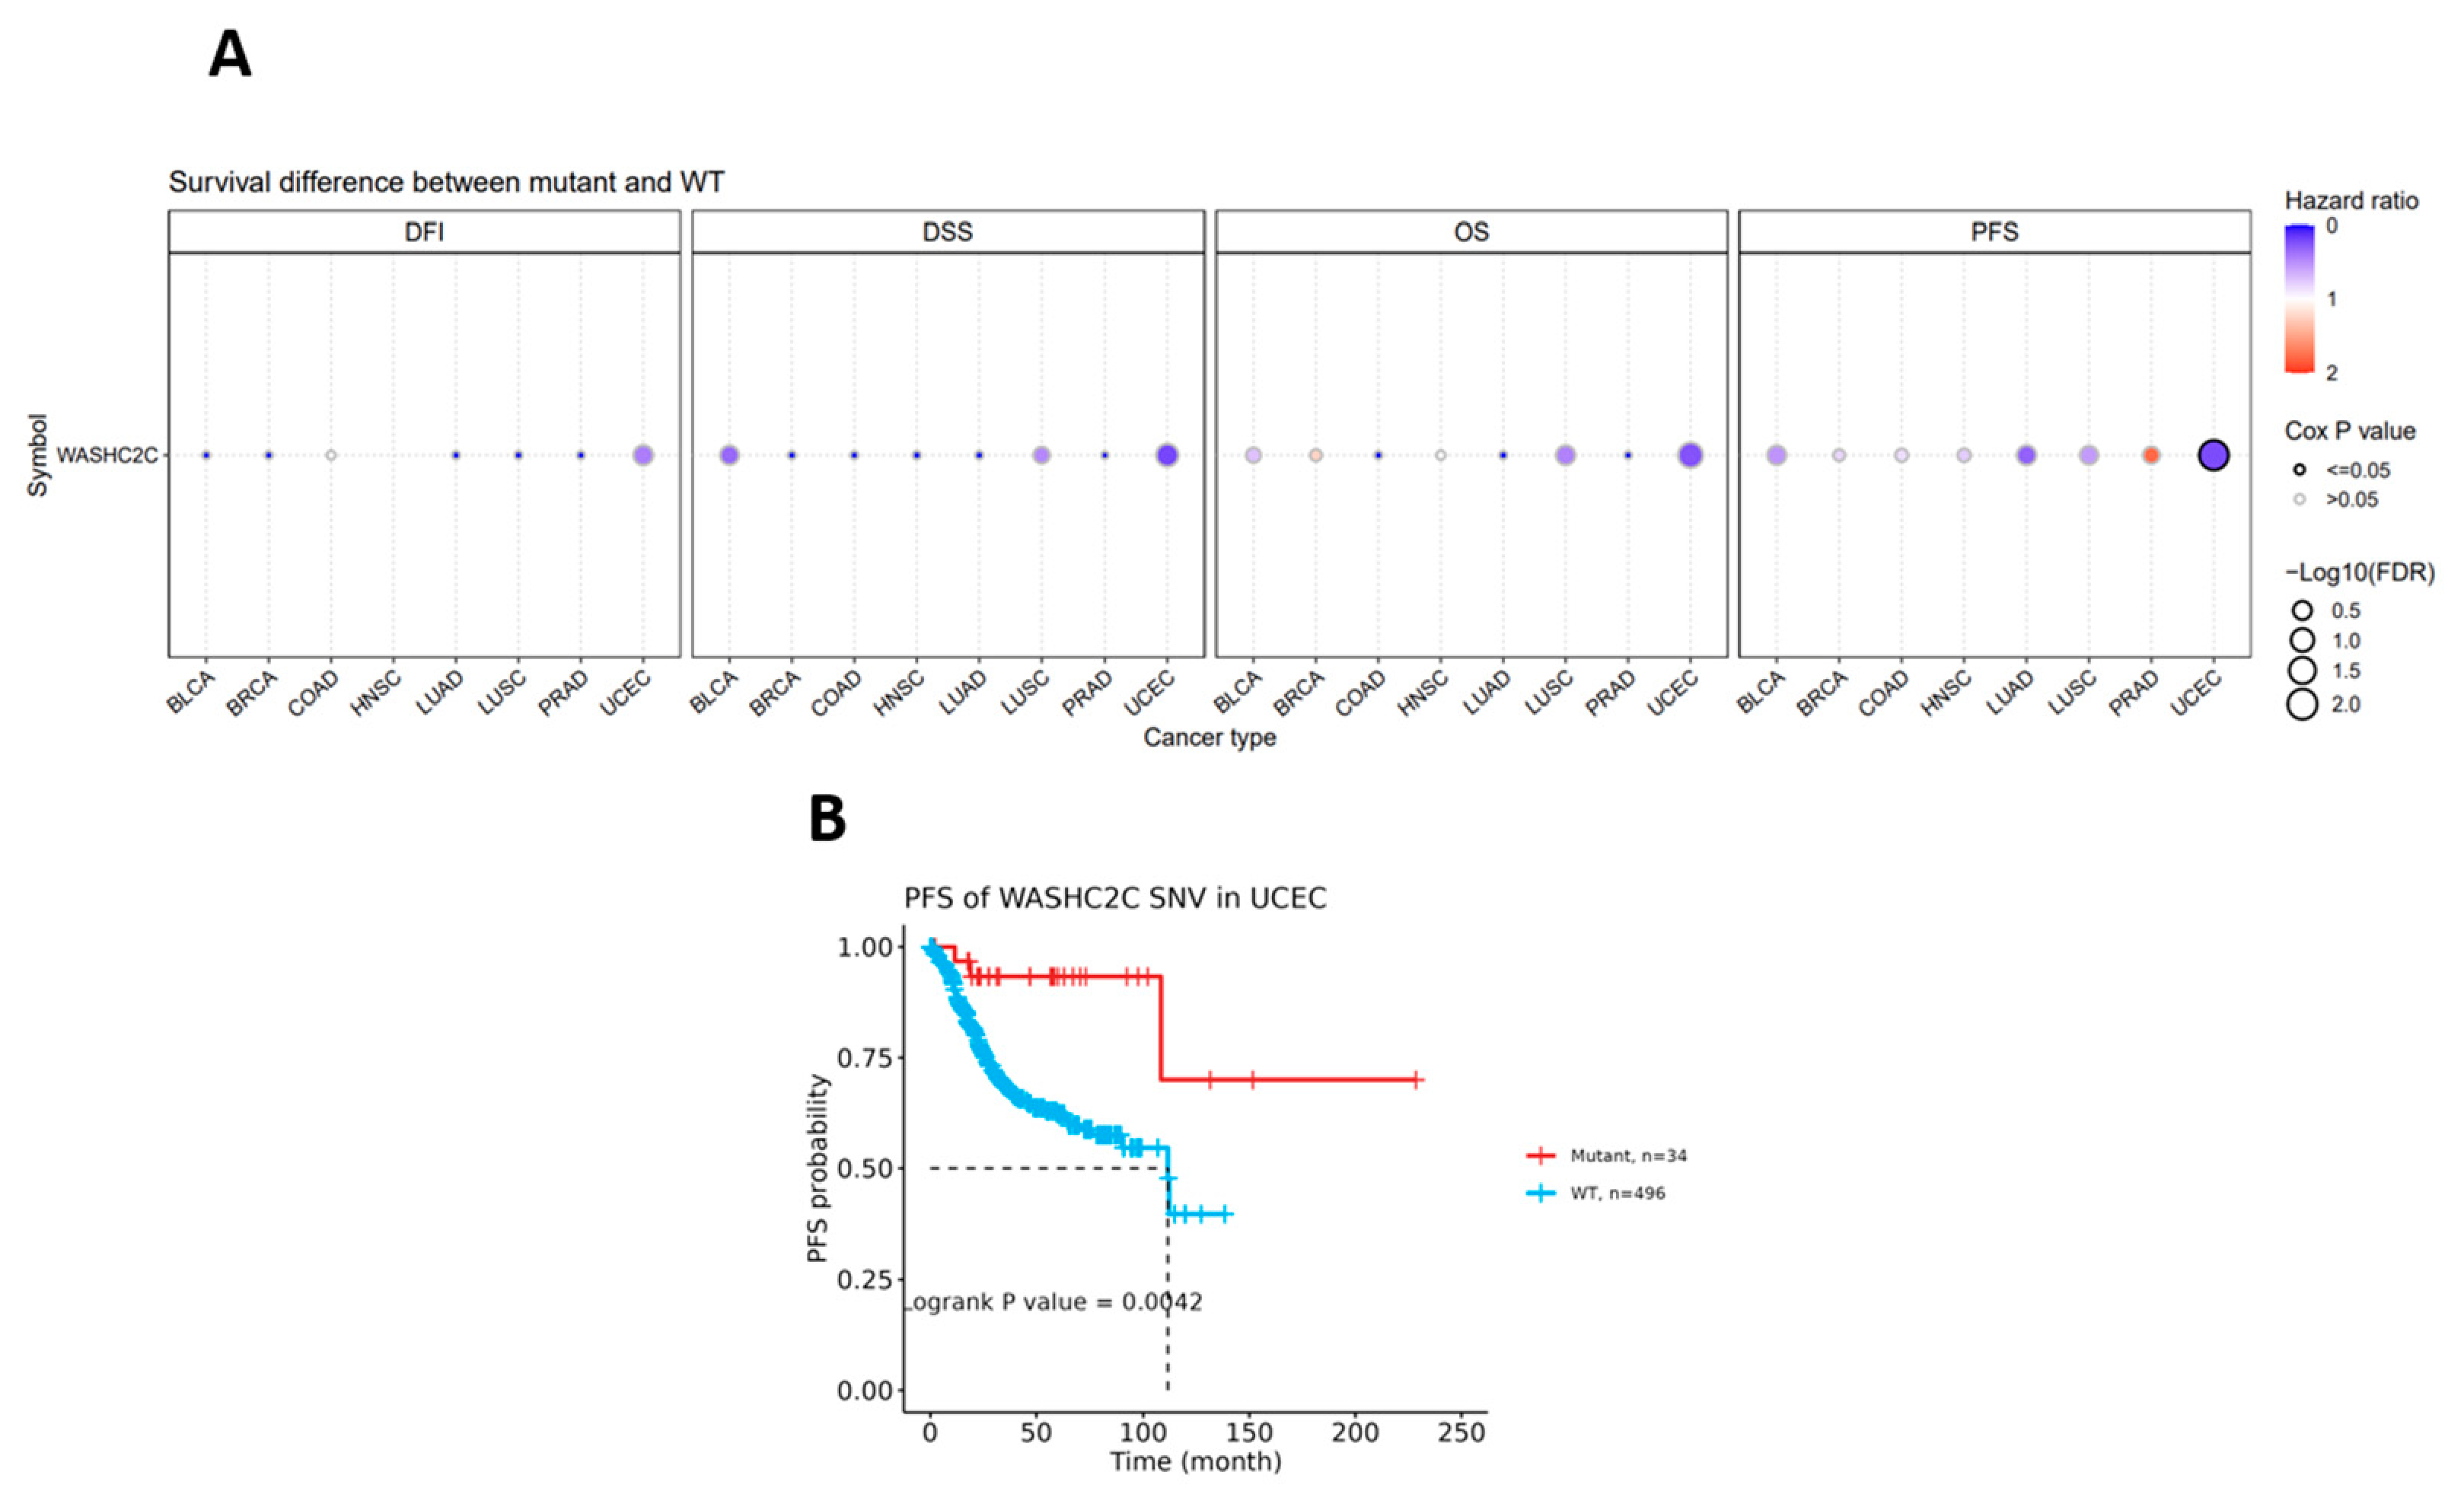
Figure 13.
Pan-cancer distribution of WASHC2C copy-number alterations. (A) Frequencies of heterozygous amplification and deletion. (B) Frequencies of homozygous amplification and deletion. Bubble size represents CNV percentage; red and blue indicate amplification and deletion, respectively. Absence of a bubble indicates no detected alteration or a frequency below the displayed threshold.
Figure 13.
Pan-cancer distribution of WASHC2C copy-number alterations. (A) Frequencies of heterozygous amplification and deletion. (B) Frequencies of homozygous amplification and deletion. Bubble size represents CNV percentage; red and blue indicate amplification and deletion, respectively. Absence of a bubble indicates no detected alteration or a frequency below the displayed threshold.
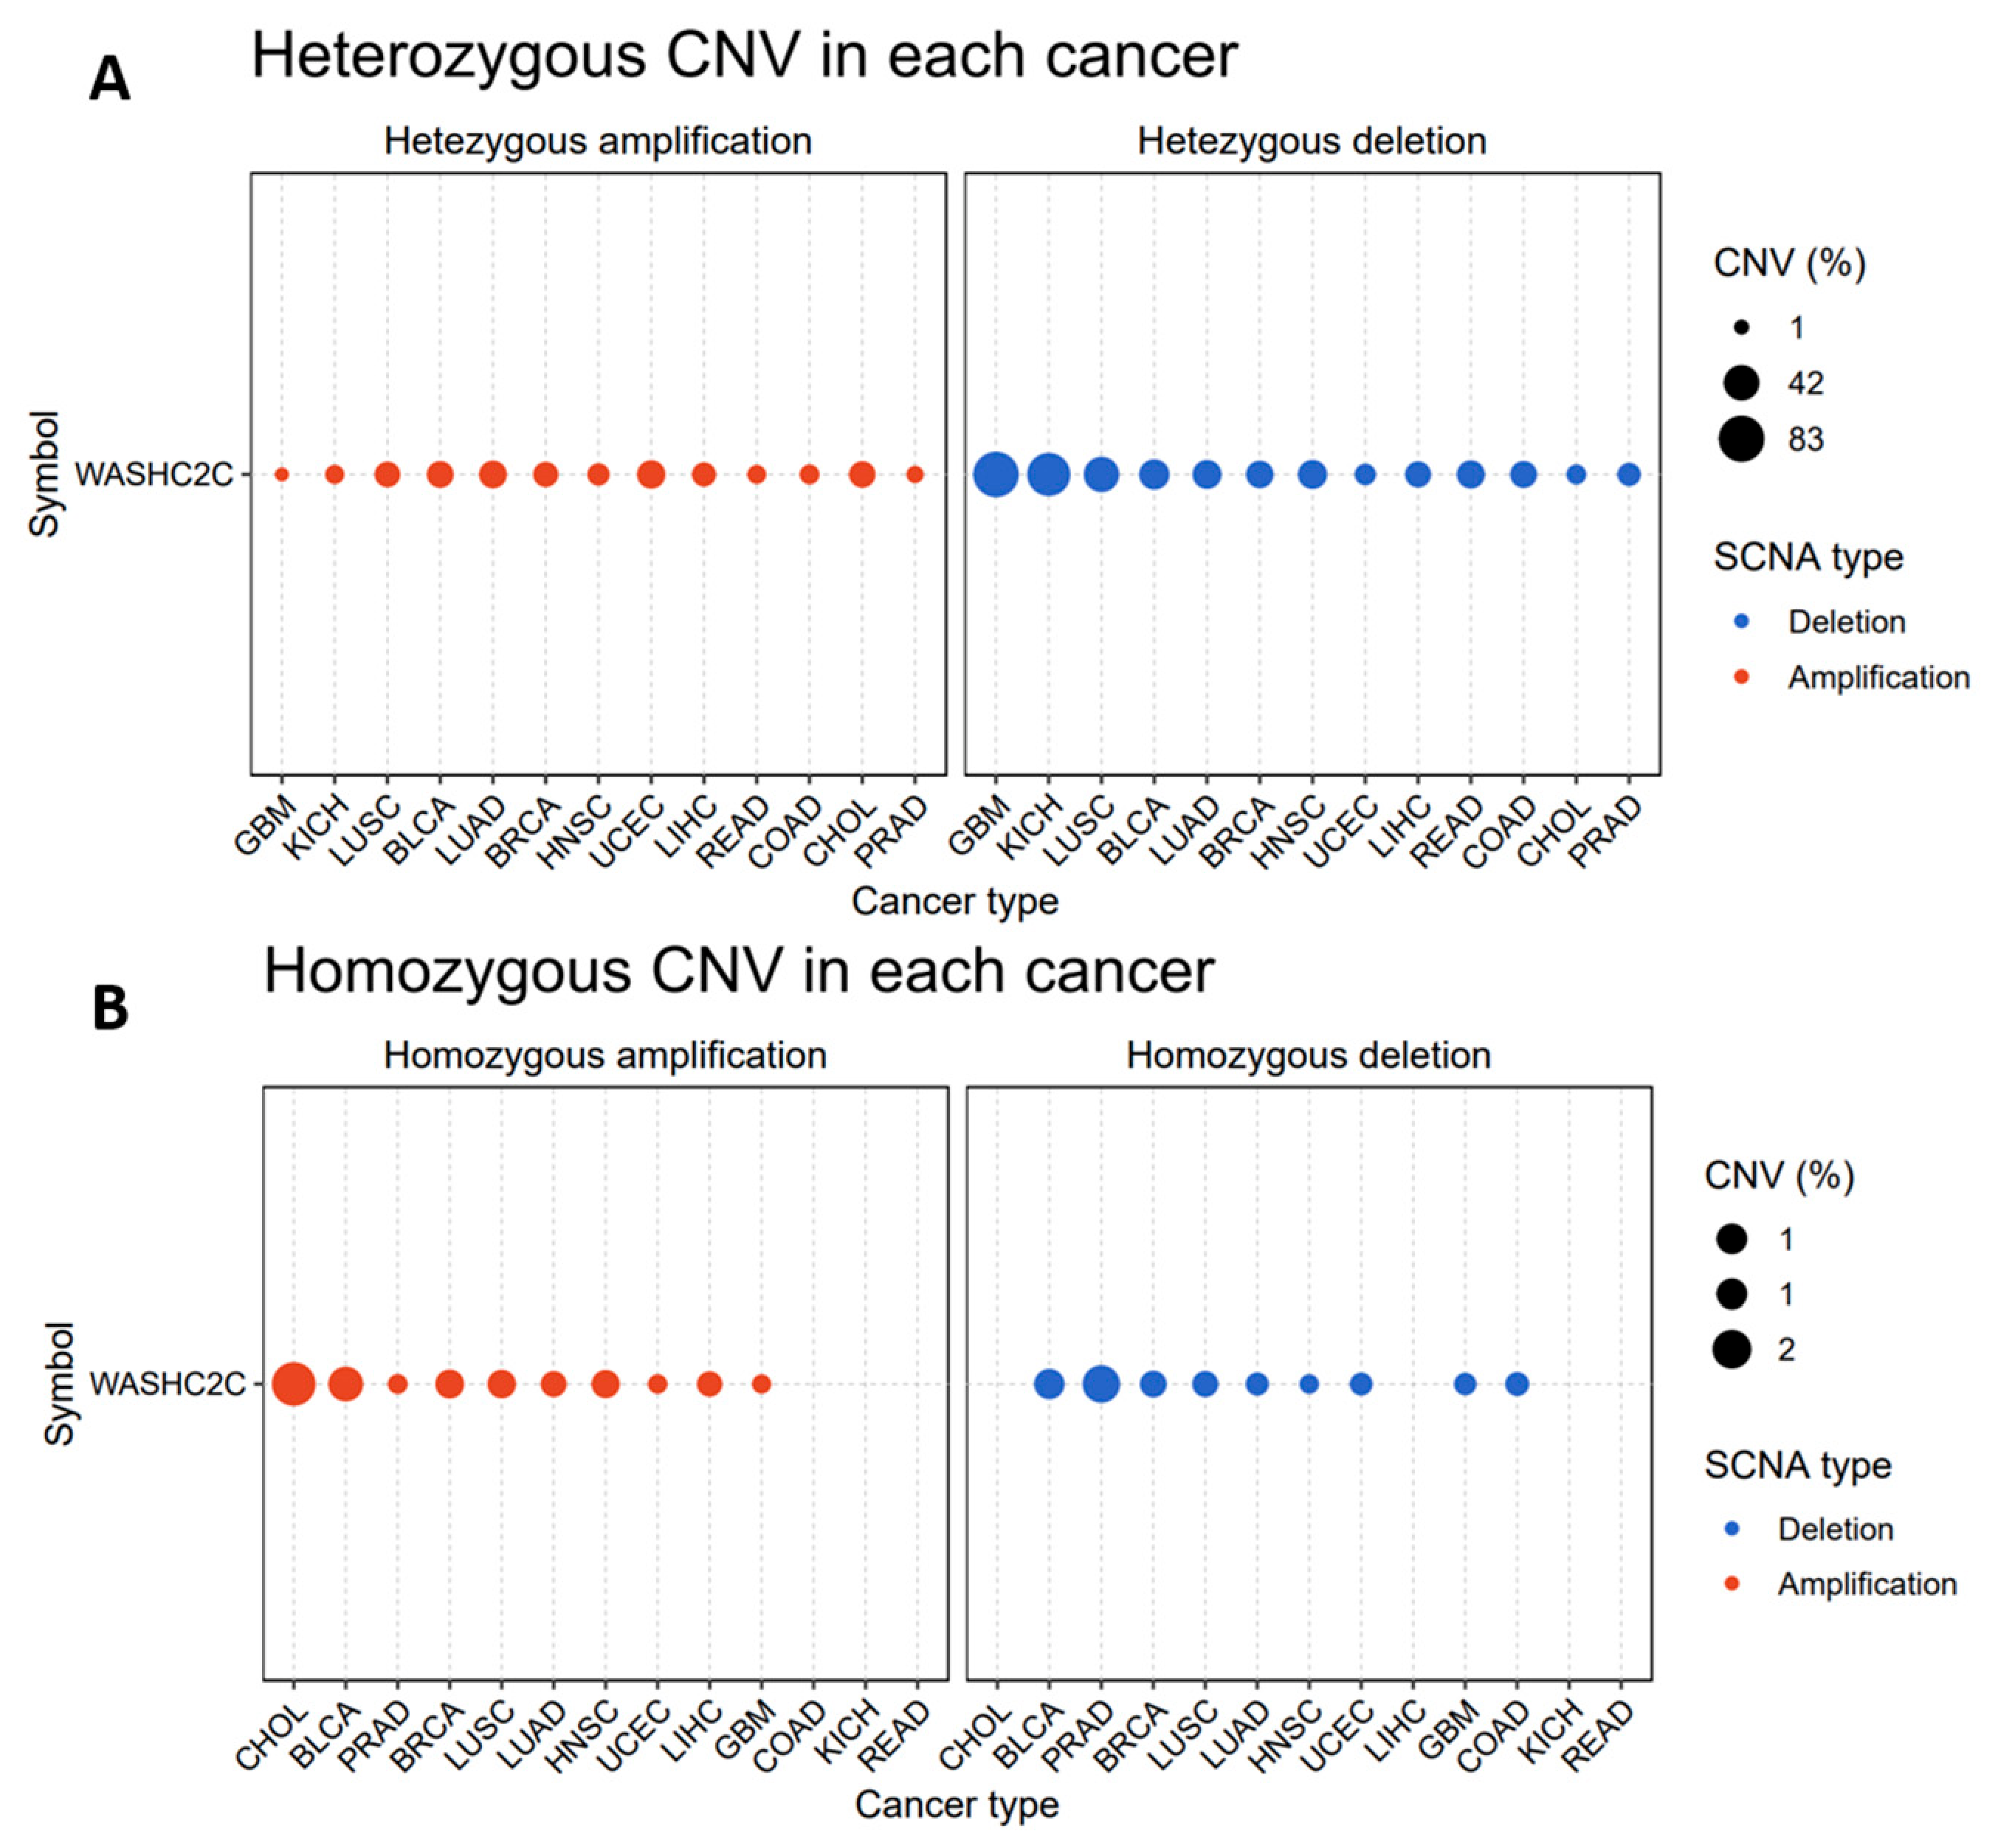
Figure 14.
Correlation between WASHC2C copy-number variation and mRNA expression across selected cancer types. (A) Bubble plot summarizing Spearman correlations between WASHC2C CNV and mRNA expression. Bubble color intensity represents the Spearman correlation coefficient, with darker red indicating a stronger positive correlation. Bubble size is proportional to −log10(FDR). Black outlines indicate FDR ≤ 0.05, whereas gray outlines indicate FDR > 0.05. (B) Representative scatterplots showing the relationship between WASHC2C CNV and log2-transformed RSEM expression in BLCA, BRCA, COAD, GBM, HNSC, KICH, LIHC, LUAD, LUSC, PRAD, READ, and UCEC. Each point represents one tumor sample; blue lines show fitted trends, and gray shading indicates the 95% confidence interval. Insets report Spearman correlation coefficients and FDR-adjusted P values.
Figure 14.
Correlation between WASHC2C copy-number variation and mRNA expression across selected cancer types. (A) Bubble plot summarizing Spearman correlations between WASHC2C CNV and mRNA expression. Bubble color intensity represents the Spearman correlation coefficient, with darker red indicating a stronger positive correlation. Bubble size is proportional to −log10(FDR). Black outlines indicate FDR ≤ 0.05, whereas gray outlines indicate FDR > 0.05. (B) Representative scatterplots showing the relationship between WASHC2C CNV and log2-transformed RSEM expression in BLCA, BRCA, COAD, GBM, HNSC, KICH, LIHC, LUAD, LUSC, PRAD, READ, and UCEC. Each point represents one tumor sample; blue lines show fitted trends, and gray shading indicates the 95% confidence interval. Insets report Spearman correlation coefficients and FDR-adjusted P values.
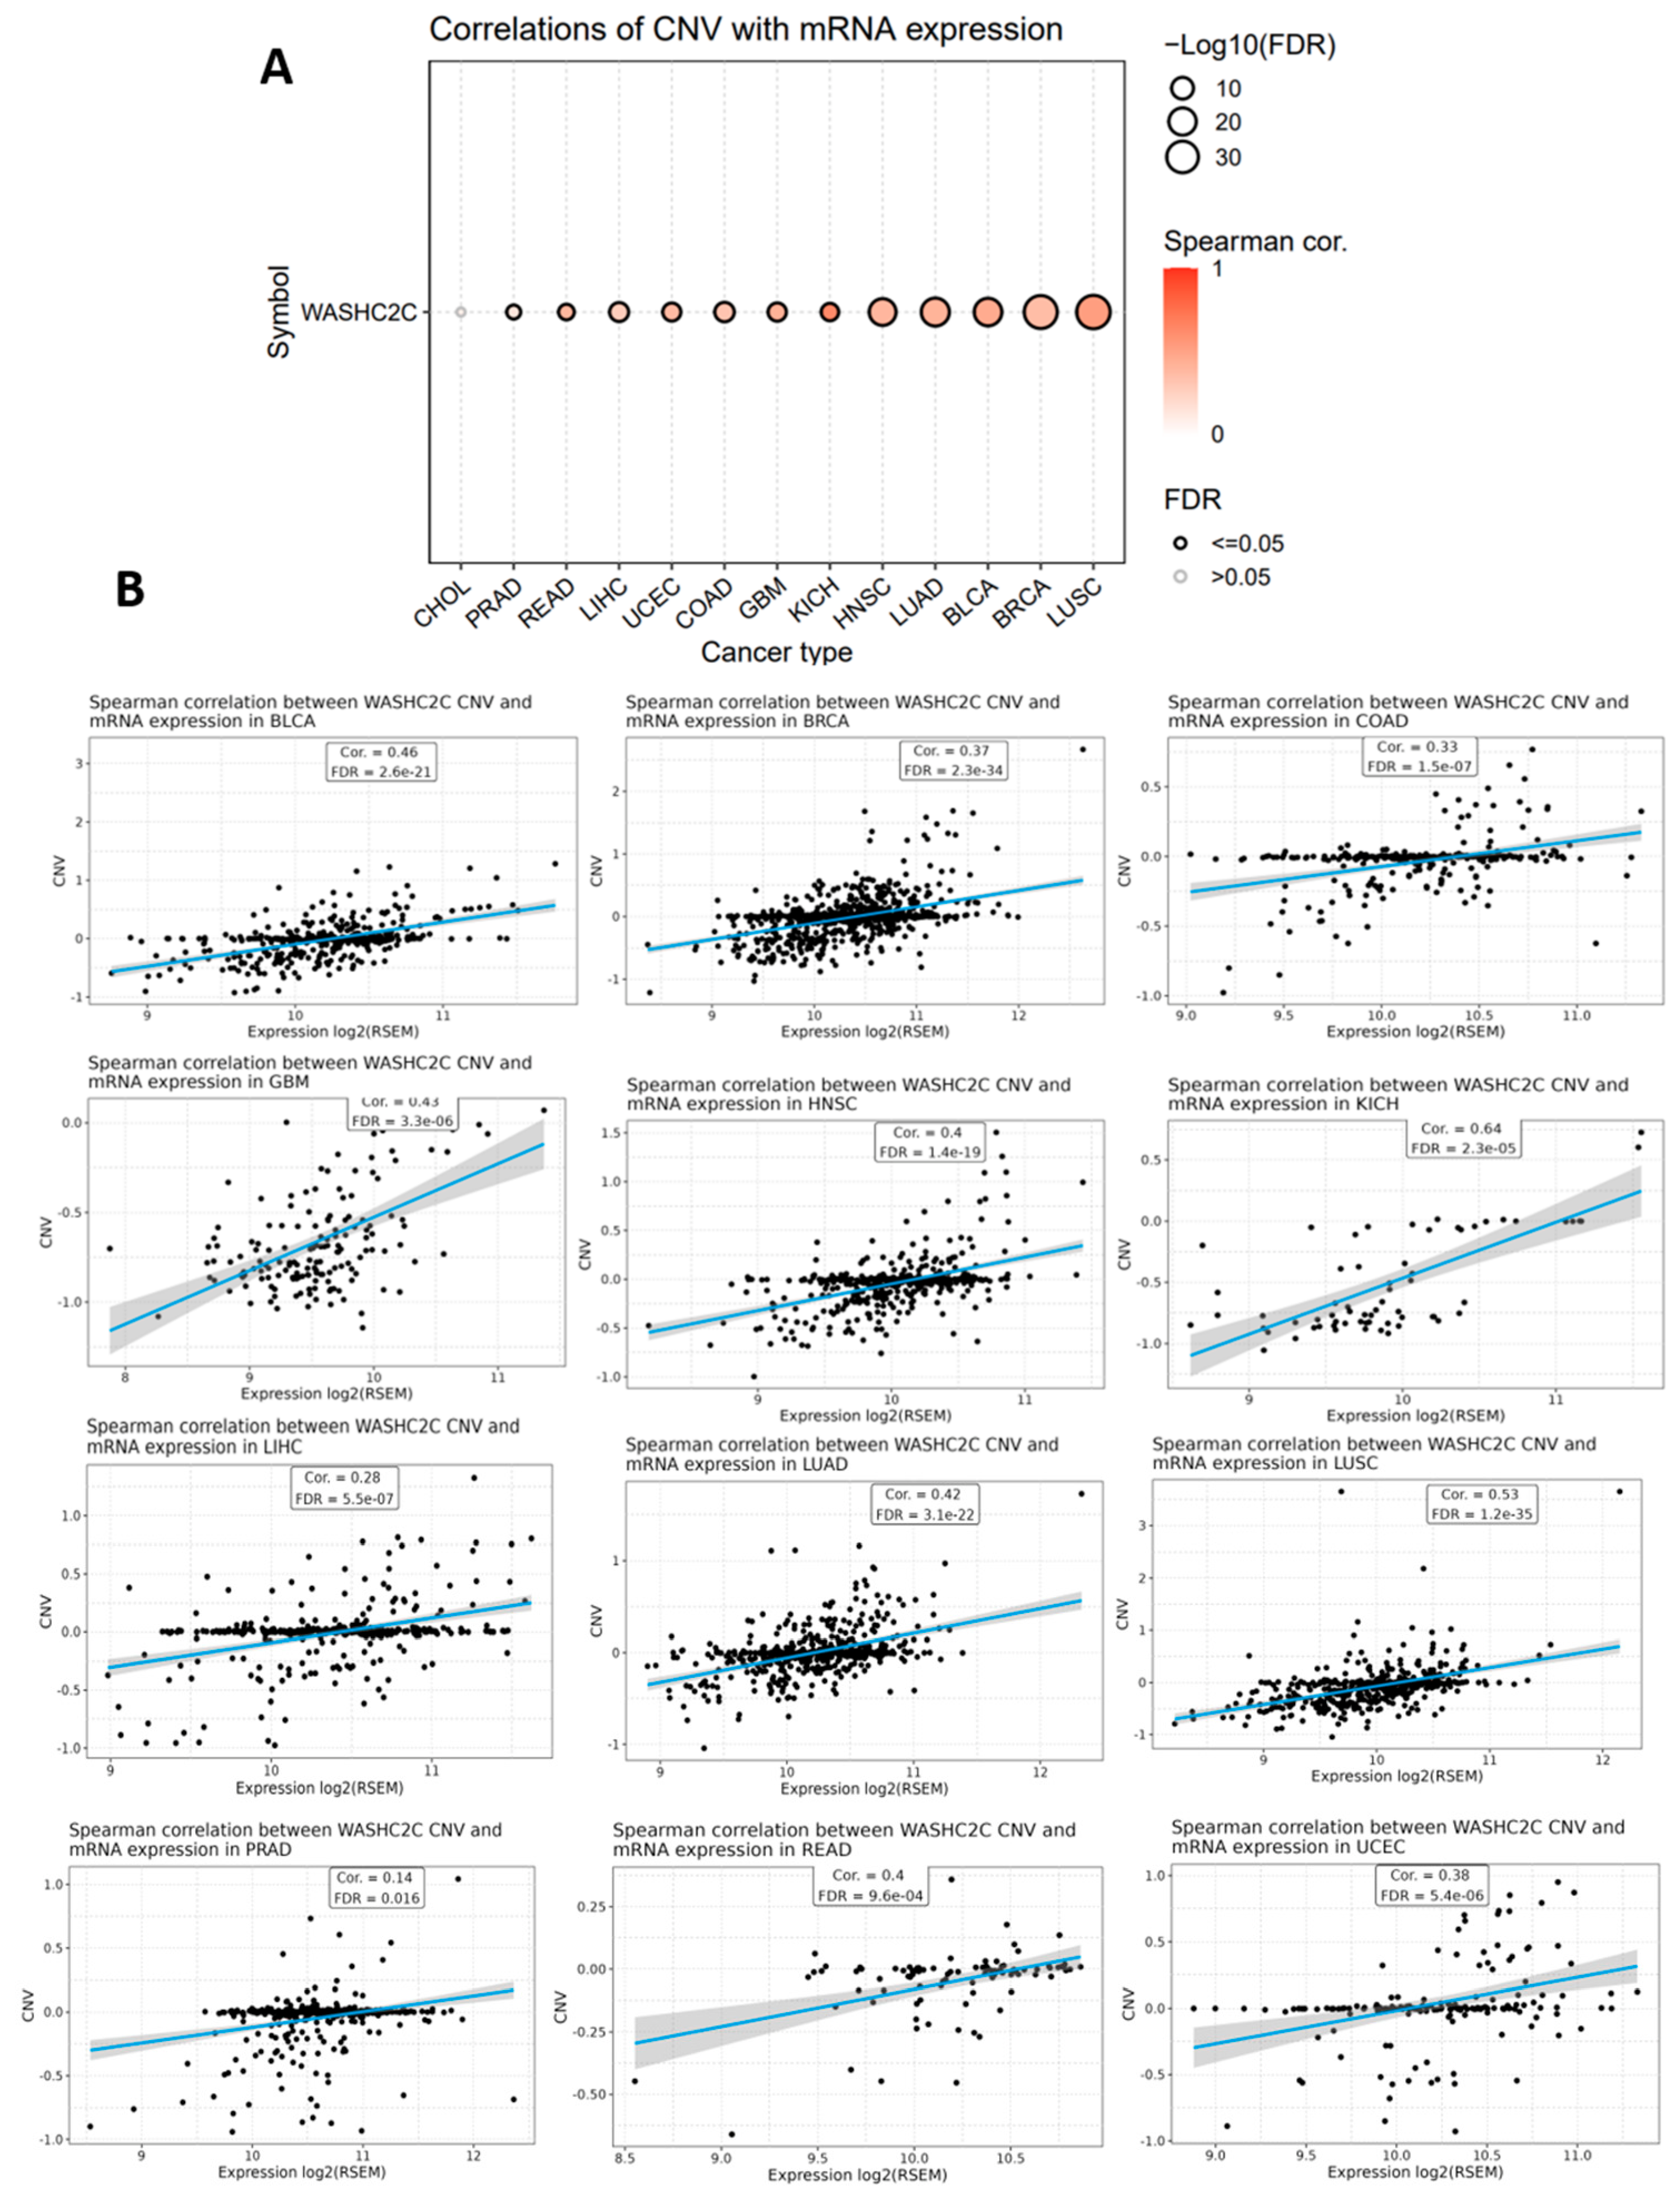
Figure 15.
Association of WASHC2C copy-number status with survival outcomes across selected cancer types. (A) Bubble plots summarizing survival differences among WASHC2C amplification, deletion, and WT groups for DFI, DSS, OS, and PFS. Bubble color represents −log10 of the log-rank P value, with increasing red intensity indicating stronger statistical evidence. Bubble size is proportional to −log10(FDR). Black outlines indicate log-rank P ≤ 0.05, whereas gray outlines indicate P > 0.05. (B) Kaplan–Meier curves for selected associations in COAD, PRAD, READ, BRCA, GBM, LIHC, and BLCA. Red, blue, and olive curves represent amplification, deletion, and WT groups, respectively; vertical ticks indicate censored observations. Group differences were assessed using the log-rank test, and sample sizes are provided in each panel. Dashed horizontal and vertical lines denote median survival estimates when reached.
Figure 15.
Association of WASHC2C copy-number status with survival outcomes across selected cancer types. (A) Bubble plots summarizing survival differences among WASHC2C amplification, deletion, and WT groups for DFI, DSS, OS, and PFS. Bubble color represents −log10 of the log-rank P value, with increasing red intensity indicating stronger statistical evidence. Bubble size is proportional to −log10(FDR). Black outlines indicate log-rank P ≤ 0.05, whereas gray outlines indicate P > 0.05. (B) Kaplan–Meier curves for selected associations in COAD, PRAD, READ, BRCA, GBM, LIHC, and BLCA. Red, blue, and olive curves represent amplification, deletion, and WT groups, respectively; vertical ticks indicate censored observations. Group differences were assessed using the log-rank test, and sample sizes are provided in each panel. Dashed horizontal and vertical lines denote median survival estimates when reached.
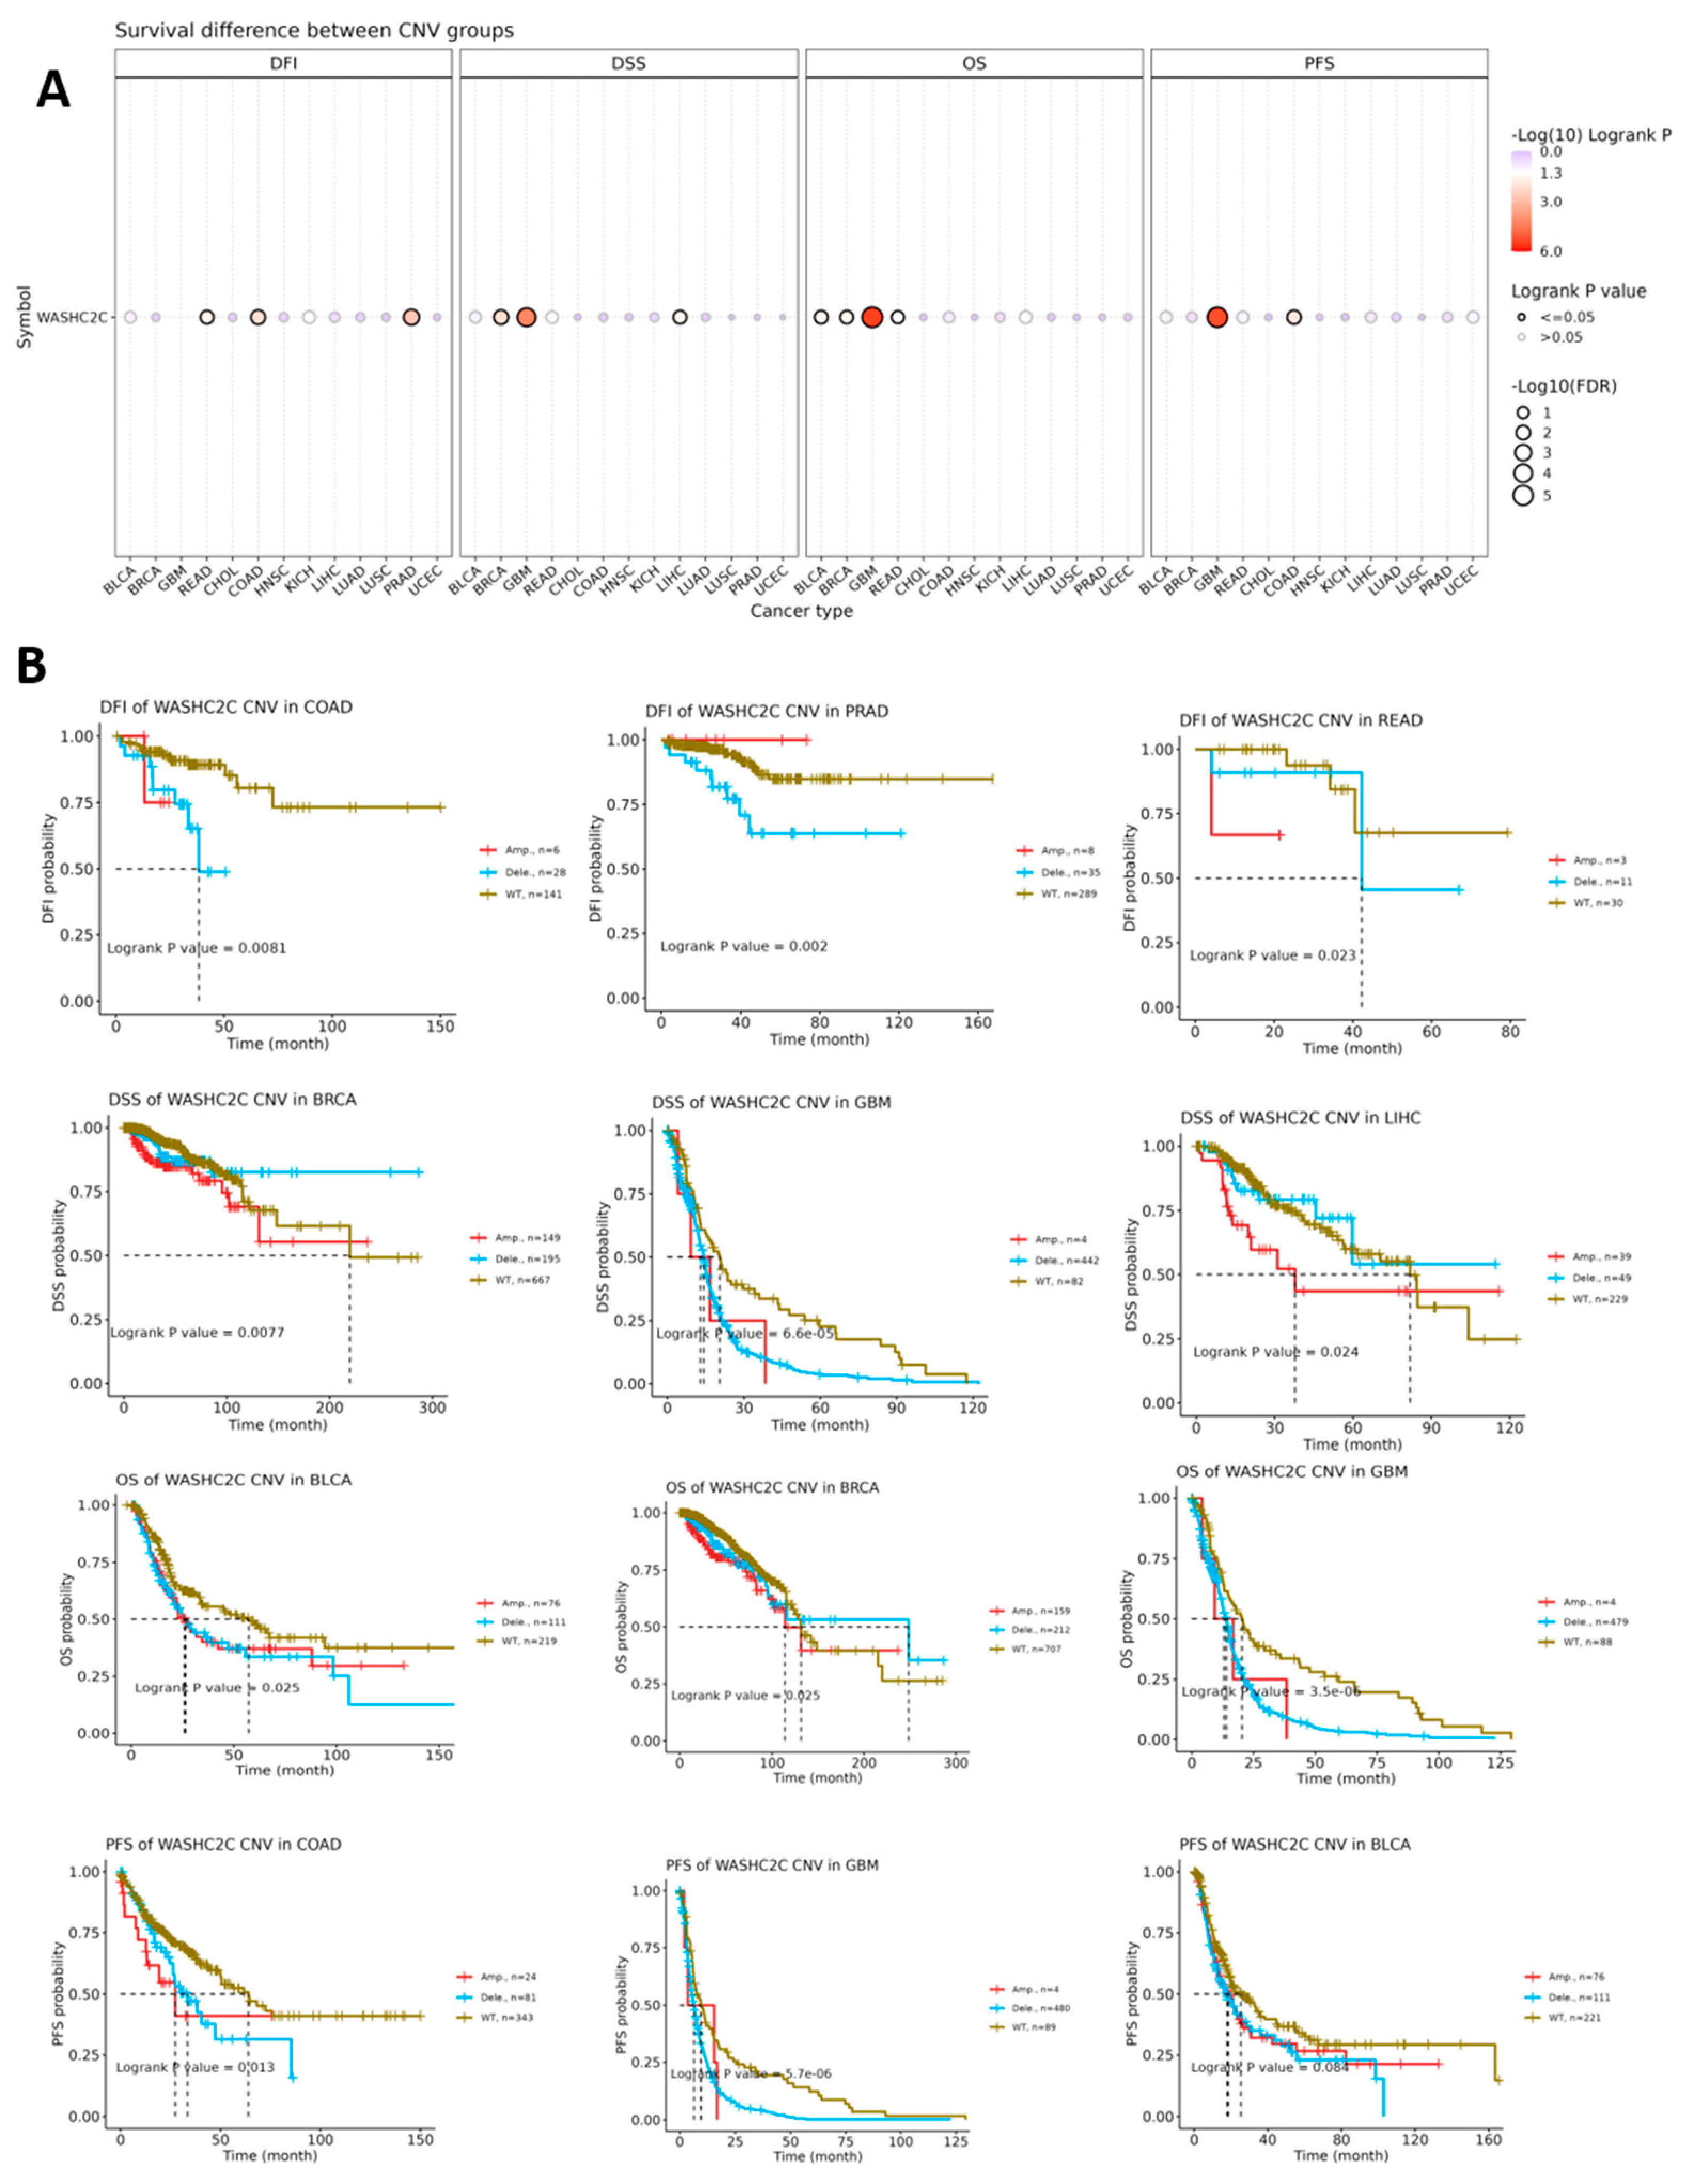
Figure 16.
Pan-cancer DNA methylation landscape of WASHC2C. (A) Visualization of the chromosomal localization of methylation probes associated with WASHC2C.(B) Boxplots depicting differential WASHC2C methylation levels between tumor tissues (red) and corresponding normal tissues (gray) across a spectrum of cancer types, using the N-shore probe cg15344919. Beta values range from 0 (no methylation) to 1 (complete methylation). Statistical significance, assessed via the Wilcoxon test, is indicated by asterisks (*p < 0.05, **p < 0.01, ***p < 0.001, ****p < 0.0001). (C) CpG-aggregated methylation profiling of WASHC2C across human cancers generated using the SMART platform.
Figure 16.
Pan-cancer DNA methylation landscape of WASHC2C. (A) Visualization of the chromosomal localization of methylation probes associated with WASHC2C.(B) Boxplots depicting differential WASHC2C methylation levels between tumor tissues (red) and corresponding normal tissues (gray) across a spectrum of cancer types, using the N-shore probe cg15344919. Beta values range from 0 (no methylation) to 1 (complete methylation). Statistical significance, assessed via the Wilcoxon test, is indicated by asterisks (*p < 0.05, **p < 0.01, ***p < 0.001, ****p < 0.0001). (C) CpG-aggregated methylation profiling of WASHC2C across human cancers generated using the SMART platform.
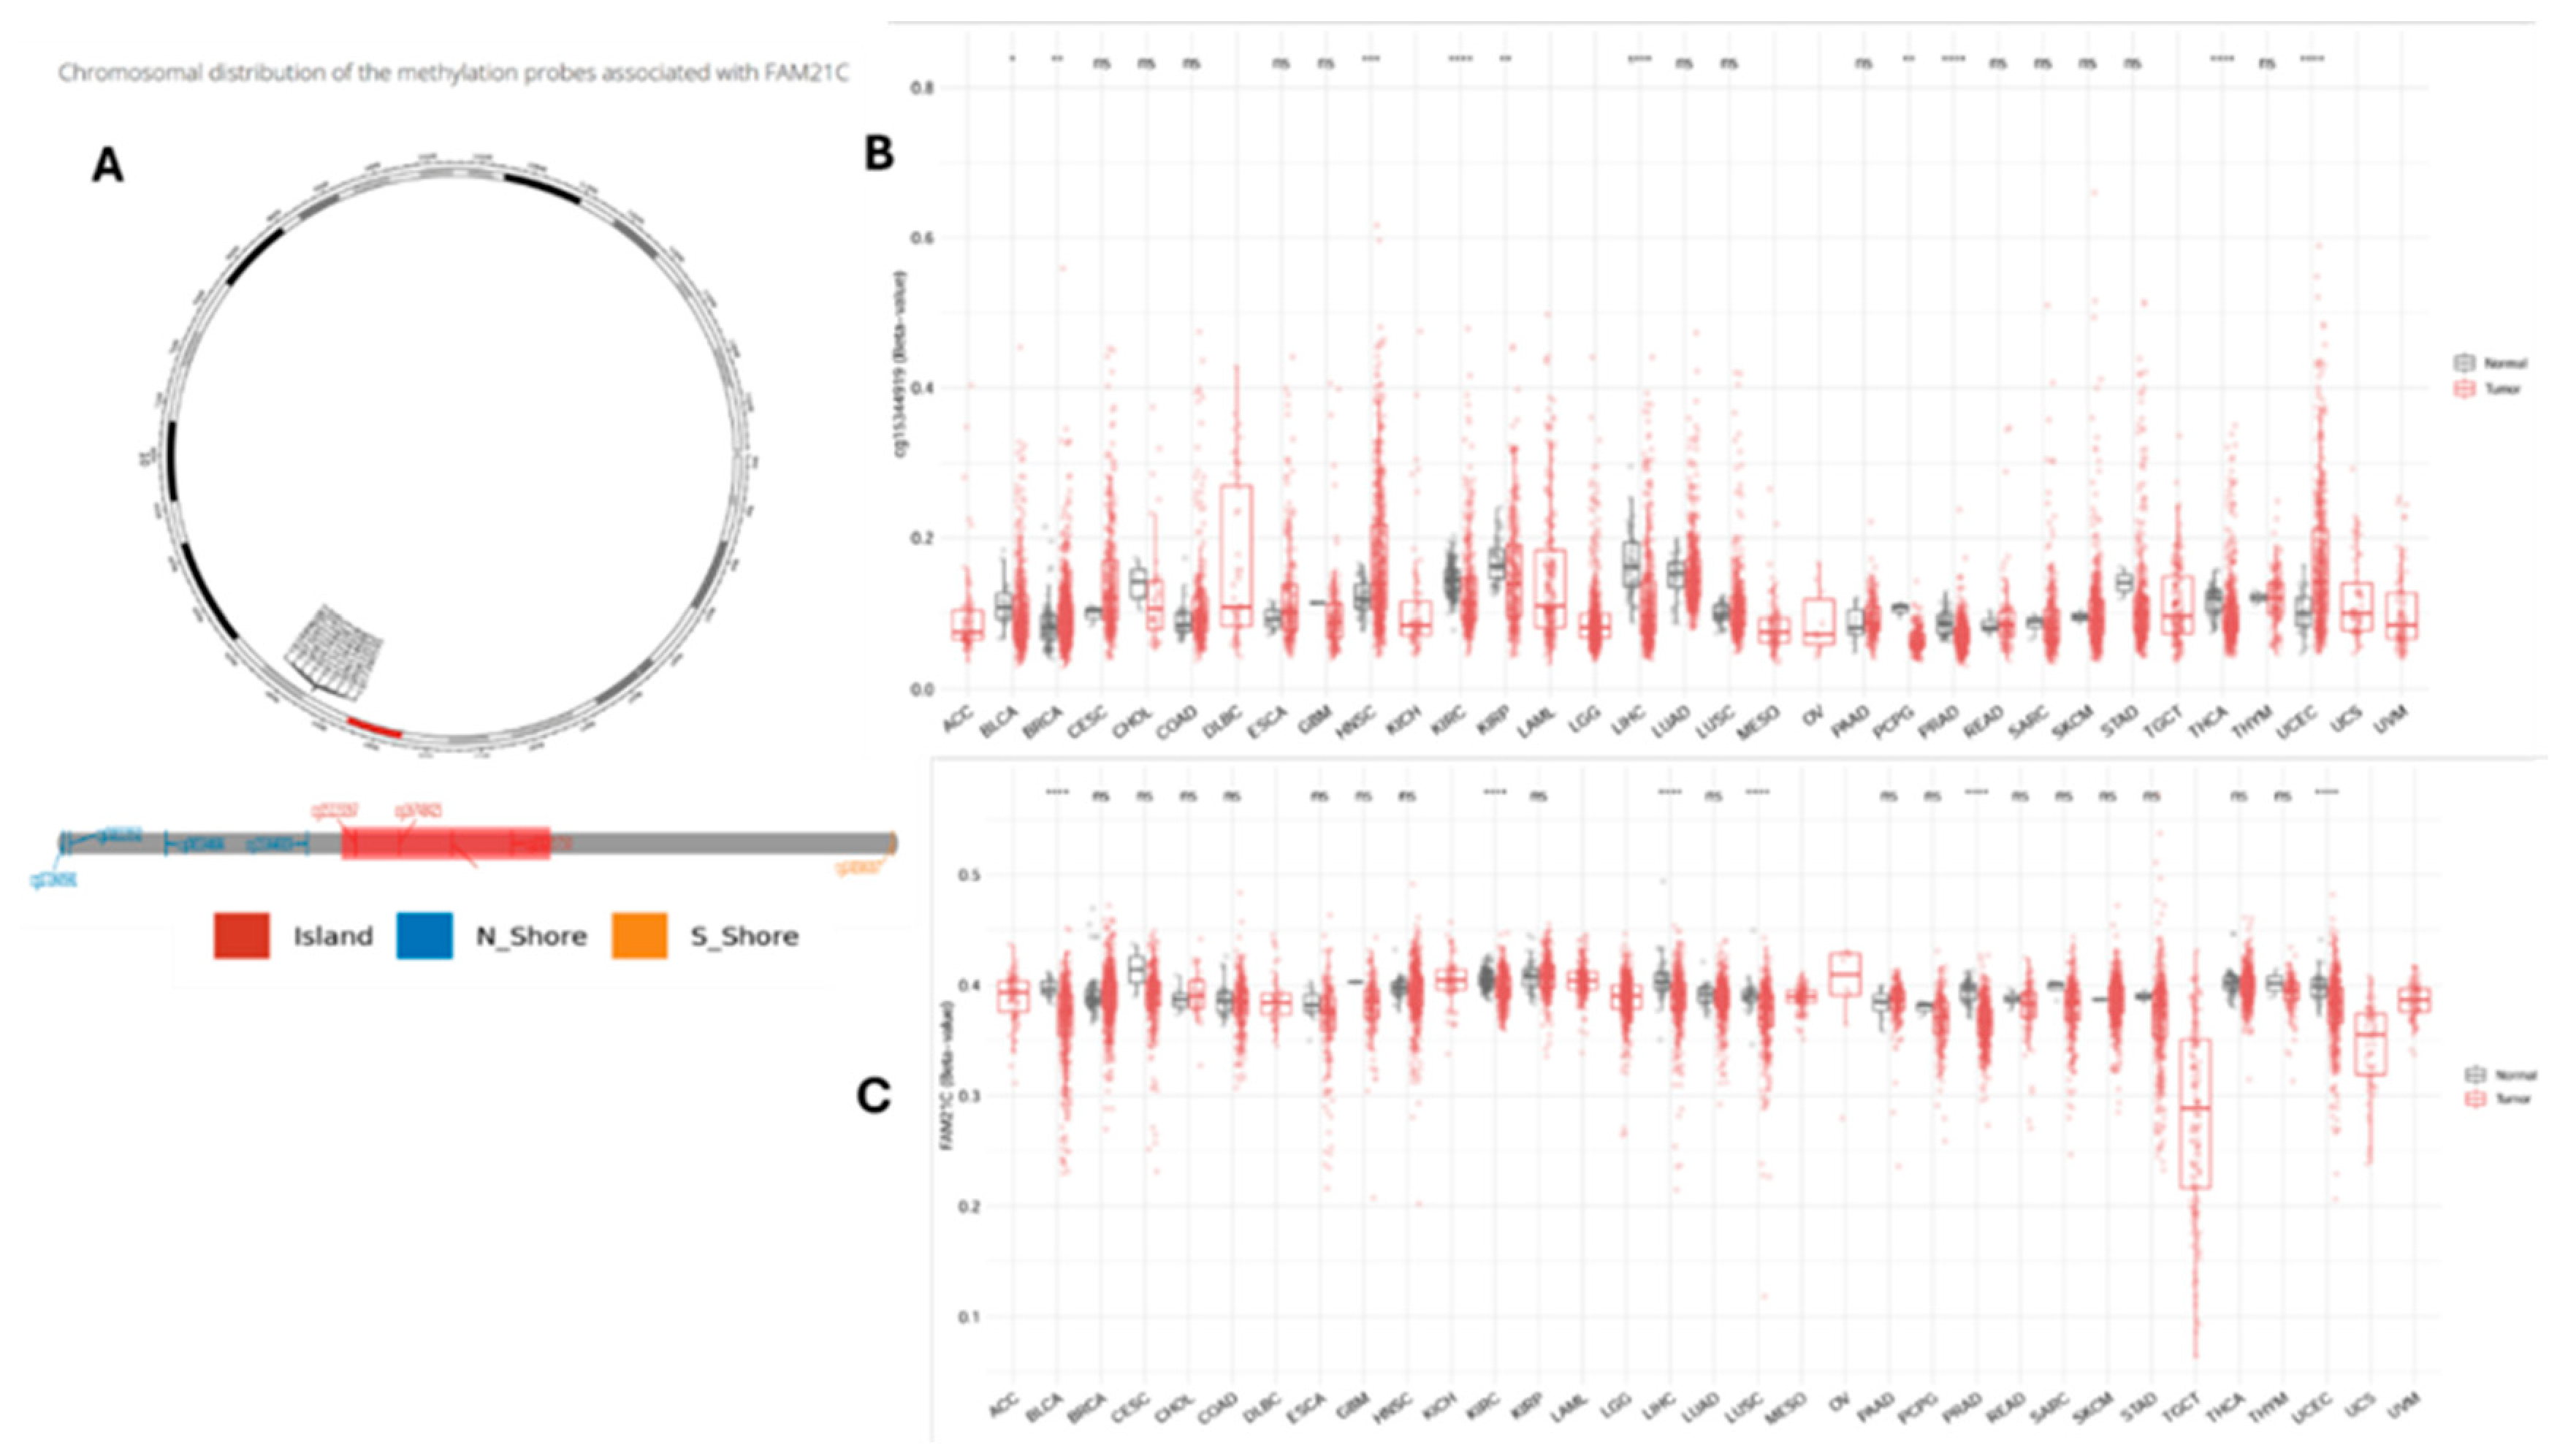
Figure 17.
Pan-cancer correlations between WASHC2C expression and immune-regulatory genes. Heatmap showing Spearman correlation coefficients between WASHC2C expression and chemokines and chemokine receptors (CCL2, CCL5, CXCL9, CXCL10, CXCL12, CCR2, CCR5, and CXCR4), immune-checkpoint molecules (CD274, CD276, PDCD1, CTLA4, LAG3, TIGIT, HAVCR2, and PDCD1LG2), and antigen-presentation-related genes (HLA-A, HLA-B, HLA-C, and B2M) across TCGA cohorts. Red and blue indicate positive and negative Spearman correlation coefficients (ρ), respectively, with increasing color intensity representing stronger correlations; white indicates coefficients close to zero. Crossed cells denote nonsignificant correlations (P > 0.05), whereas uncrossed cells indicate P ≤ 0.05. The sample size for each cohort is shown in parentheses.
Figure 17.
Pan-cancer correlations between WASHC2C expression and immune-regulatory genes. Heatmap showing Spearman correlation coefficients between WASHC2C expression and chemokines and chemokine receptors (CCL2, CCL5, CXCL9, CXCL10, CXCL12, CCR2, CCR5, and CXCR4), immune-checkpoint molecules (CD274, CD276, PDCD1, CTLA4, LAG3, TIGIT, HAVCR2, and PDCD1LG2), and antigen-presentation-related genes (HLA-A, HLA-B, HLA-C, and B2M) across TCGA cohorts. Red and blue indicate positive and negative Spearman correlation coefficients (ρ), respectively, with increasing color intensity representing stronger correlations; white indicates coefficients close to zero. Crossed cells denote nonsignificant correlations (P > 0.05), whereas uncrossed cells indicate P ≤ 0.05. The sample size for each cohort is shown in parentheses.
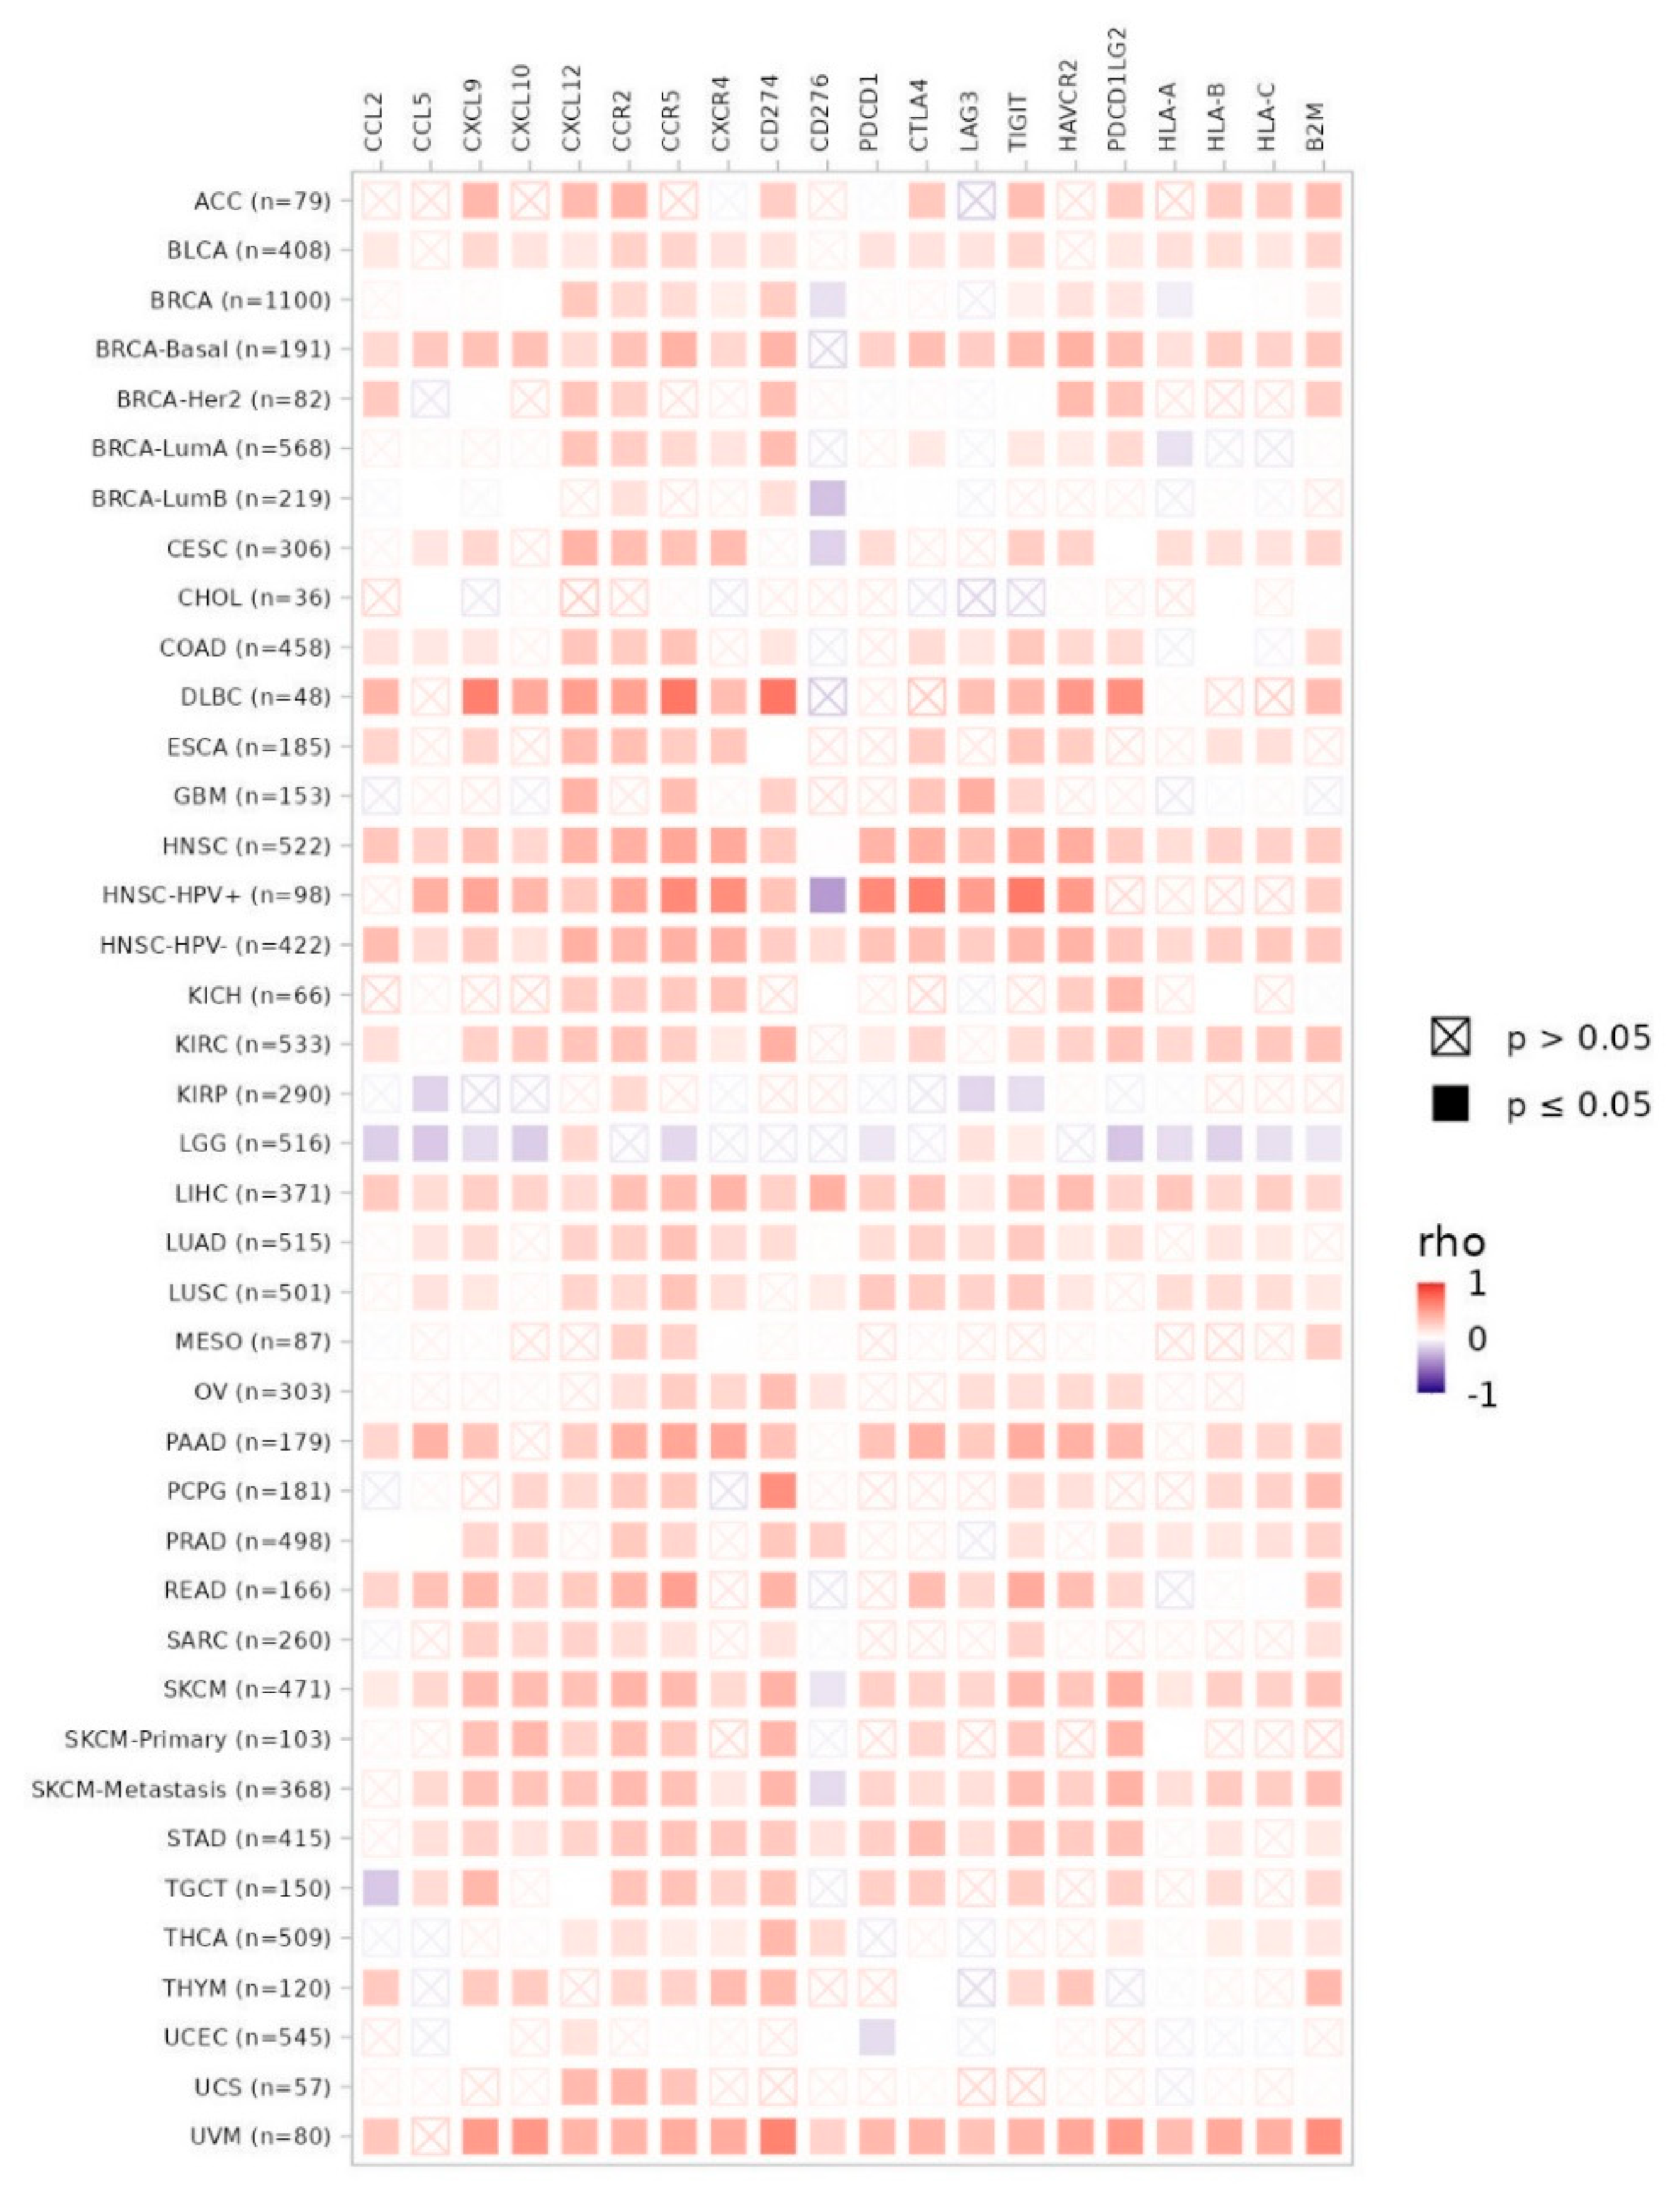
Figure 18.
Pan-cancer association of WASHC2C expression with immune and stromal infiltration. (A,C,E,G,I,K) Heatmaps show purity-adjusted Spearman correlations between WASHC2C expression and infiltration of CD8+ T cells, CD4+ T cells, B cells, macrophage/monocyte subsets, NK cells, and cancer-associated fibroblasts, respectively, estimated using TIMER, EPIC, MCP-counter, quanTIseq, CIBERSORT, CIBERSORT-ABS, xCell, and TIDE where applicable. (B,D,F,H,J,L) Representative scatterplots show associations between WASHC2C expression and tumor purity or selected infiltration estimates across representative cancer types. Red and blue heatmap cells indicate positive and negative partial correlations, respectively; crossed cells denote P > 0.05. Each scatterplot point represents one tumor sample, with Spearman’s ρ and corresponding P value shown. WASHC2C expression is presented as log2-transformed TPM.
Figure 18.
Pan-cancer association of WASHC2C expression with immune and stromal infiltration. (A,C,E,G,I,K) Heatmaps show purity-adjusted Spearman correlations between WASHC2C expression and infiltration of CD8+ T cells, CD4+ T cells, B cells, macrophage/monocyte subsets, NK cells, and cancer-associated fibroblasts, respectively, estimated using TIMER, EPIC, MCP-counter, quanTIseq, CIBERSORT, CIBERSORT-ABS, xCell, and TIDE where applicable. (B,D,F,H,J,L) Representative scatterplots show associations between WASHC2C expression and tumor purity or selected infiltration estimates across representative cancer types. Red and blue heatmap cells indicate positive and negative partial correlations, respectively; crossed cells denote P > 0.05. Each scatterplot point represents one tumor sample, with Spearman’s ρ and corresponding P value shown. WASHC2C expression is presented as log2-transformed TPM.
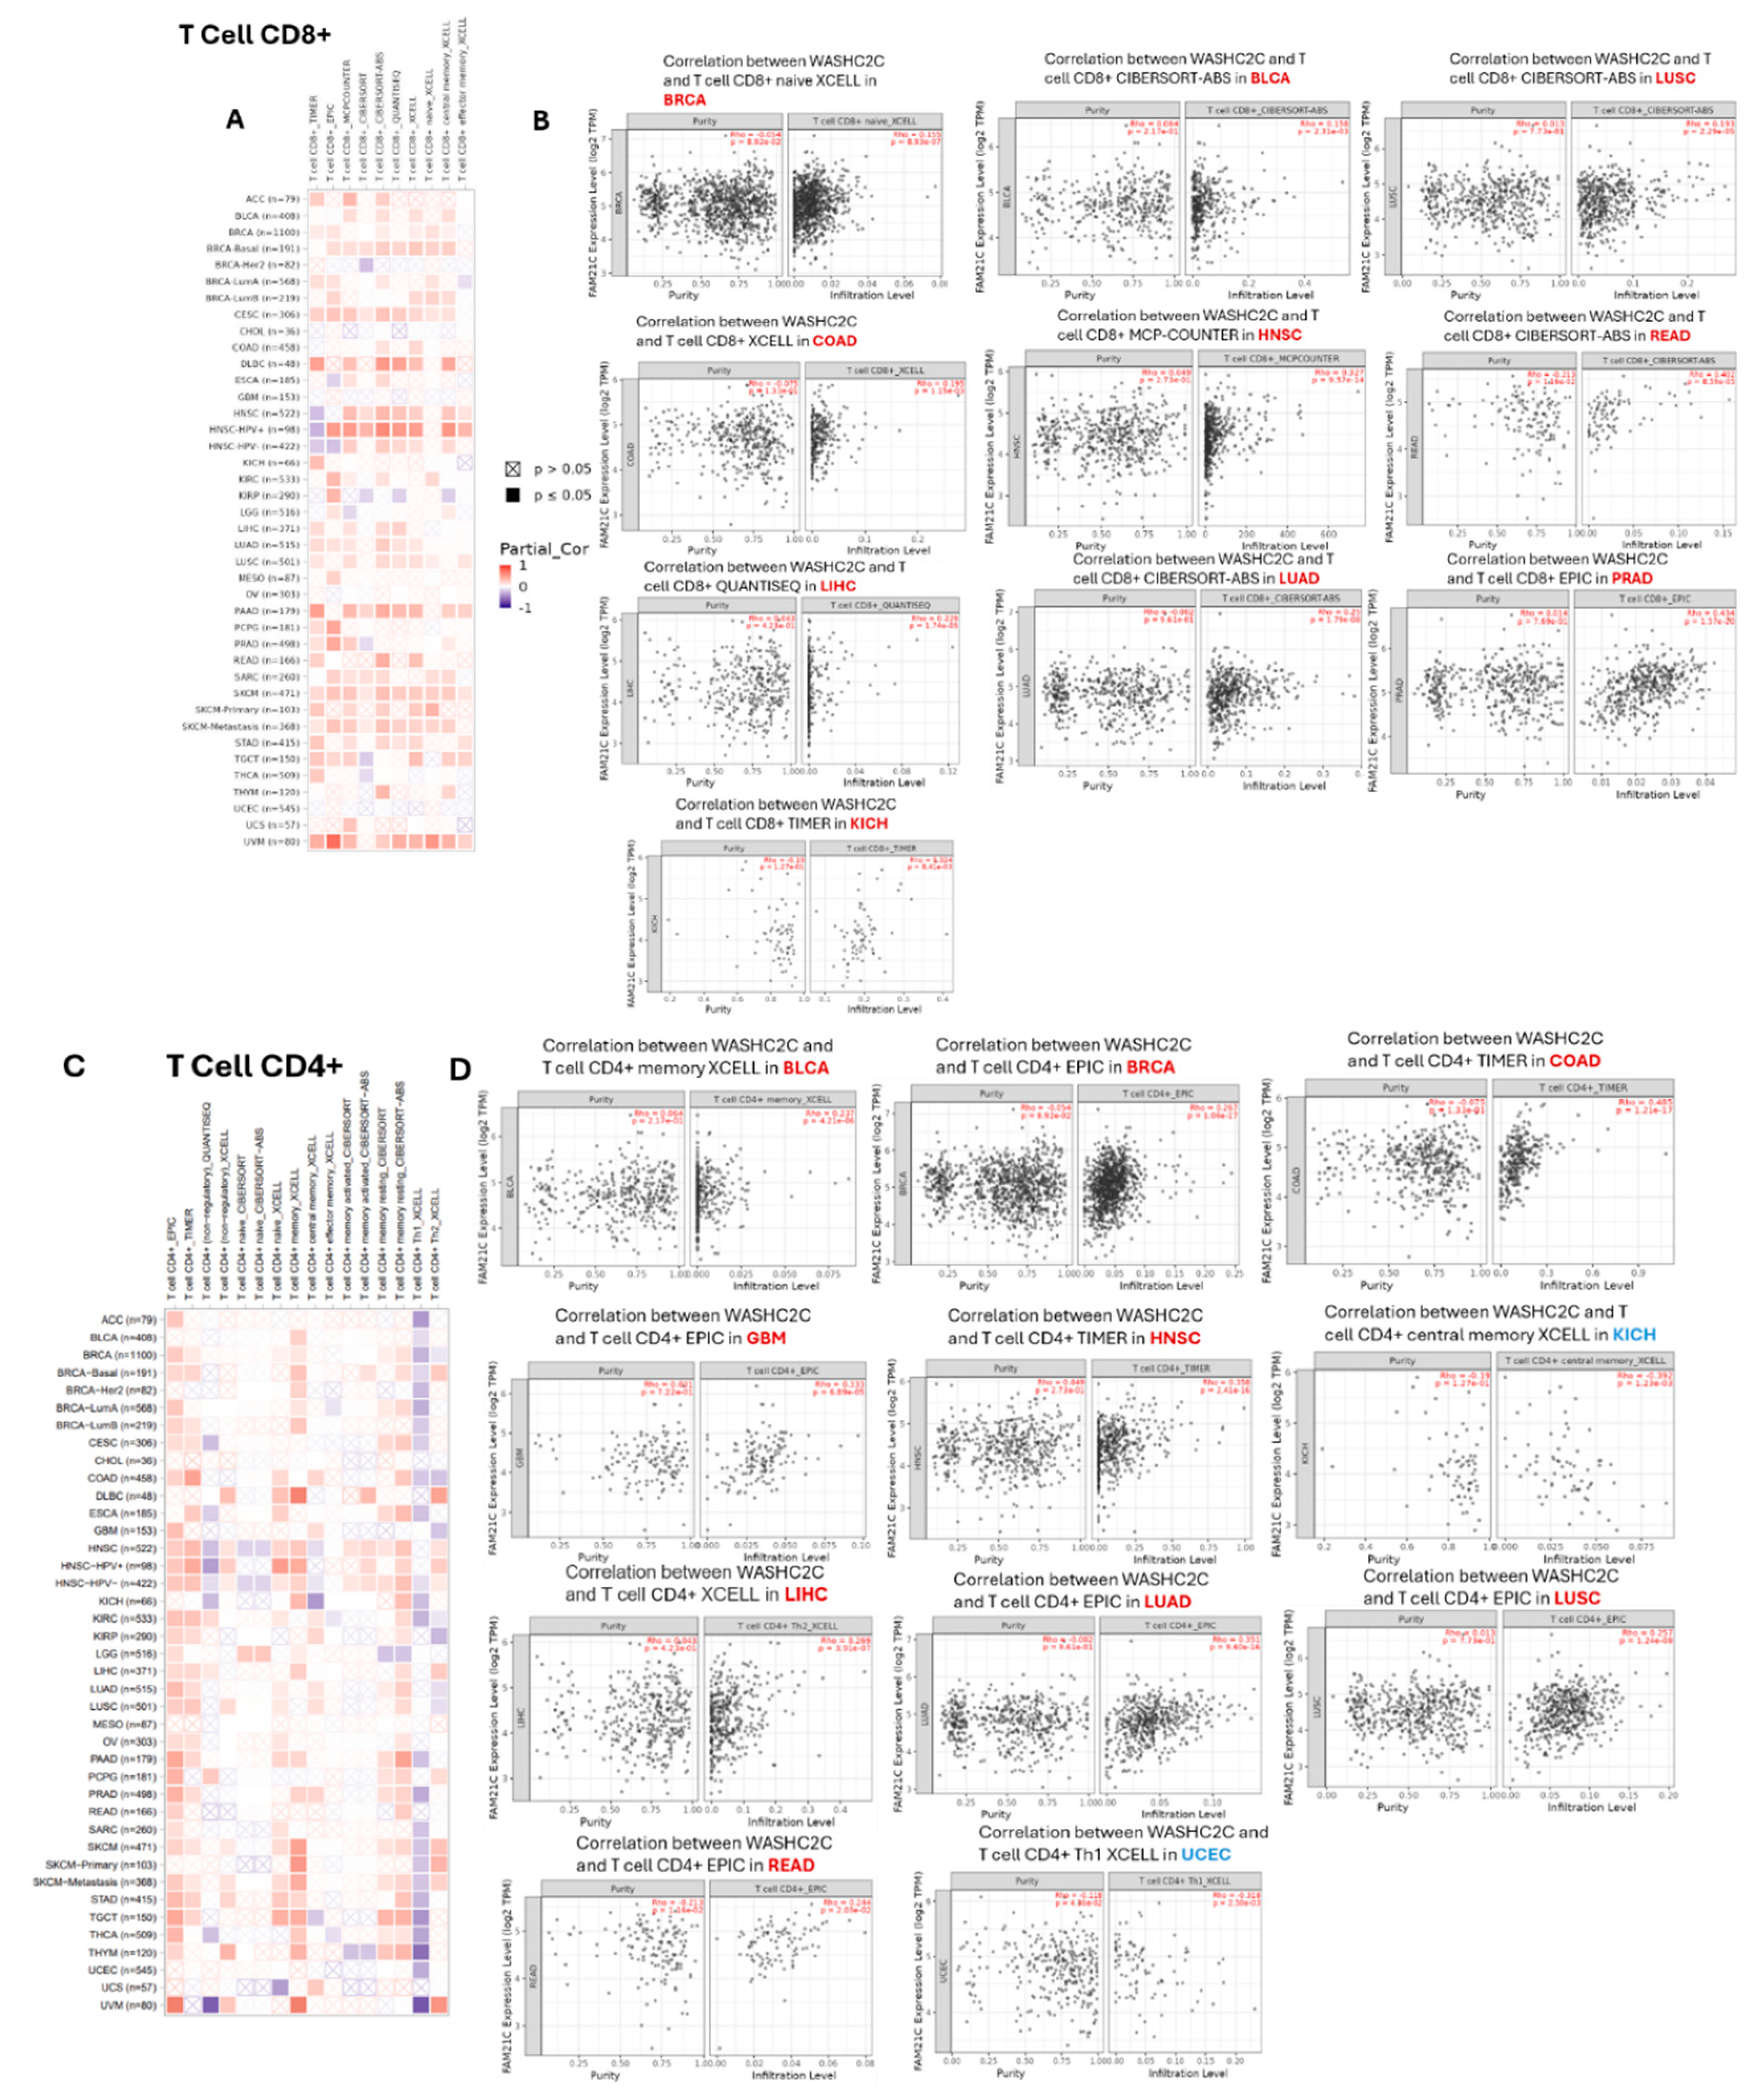
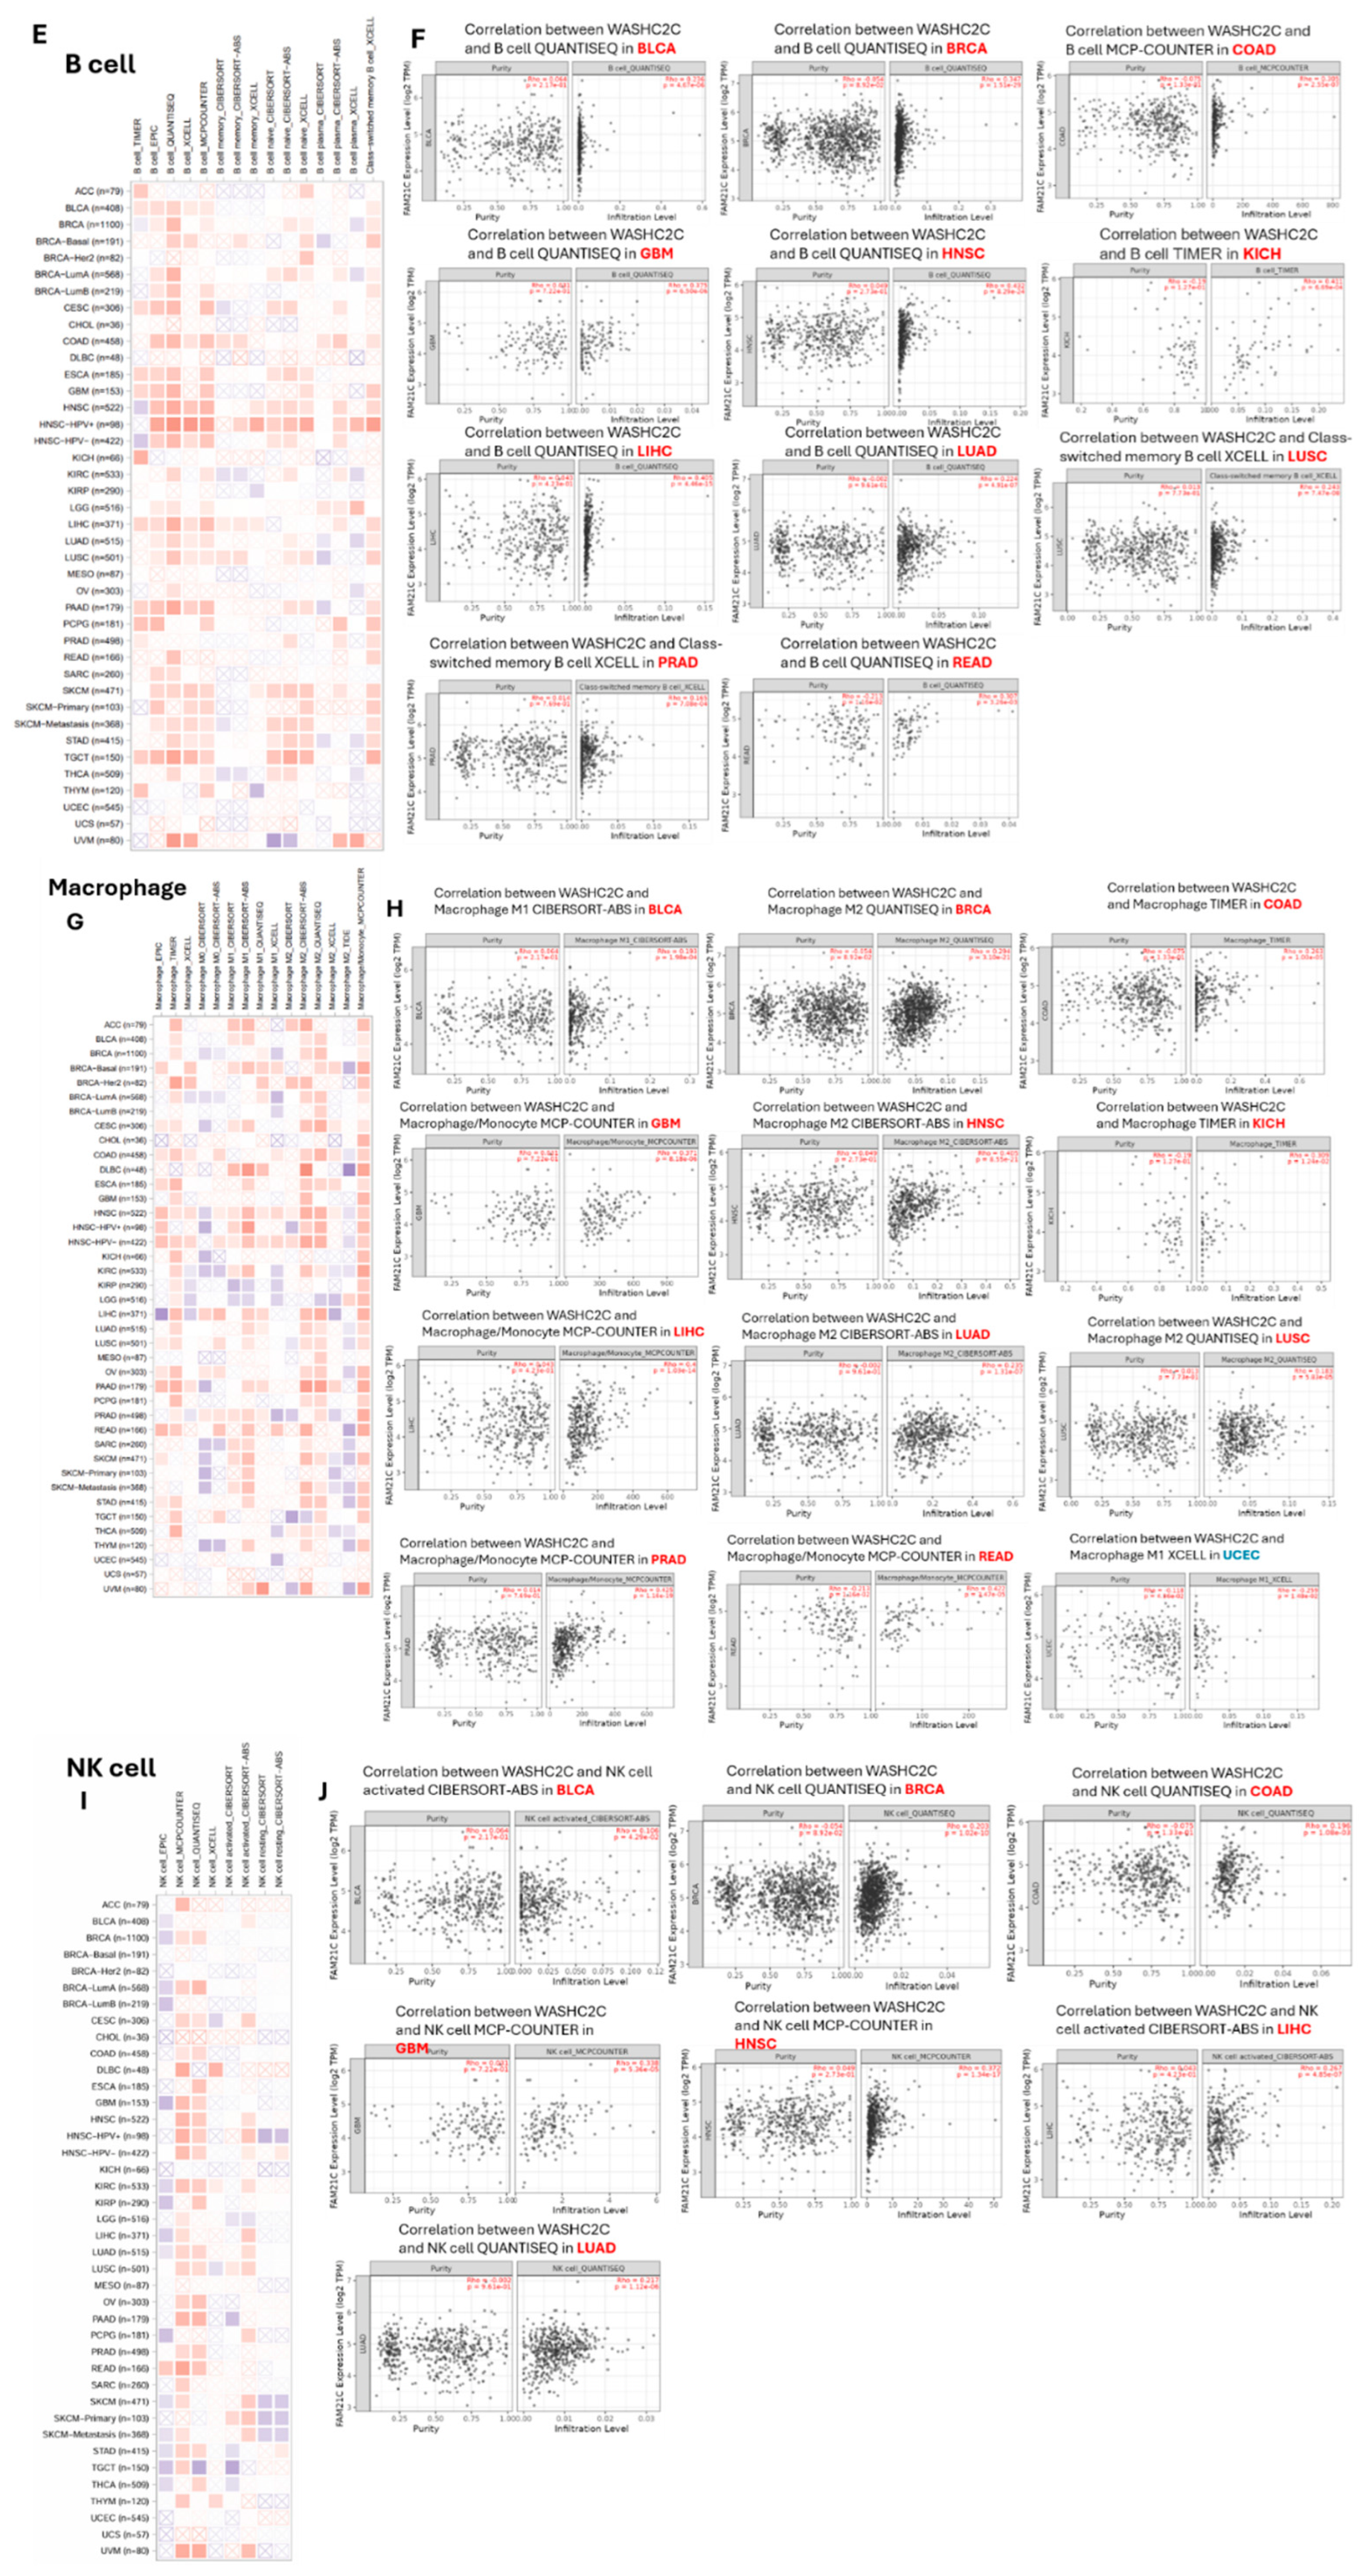
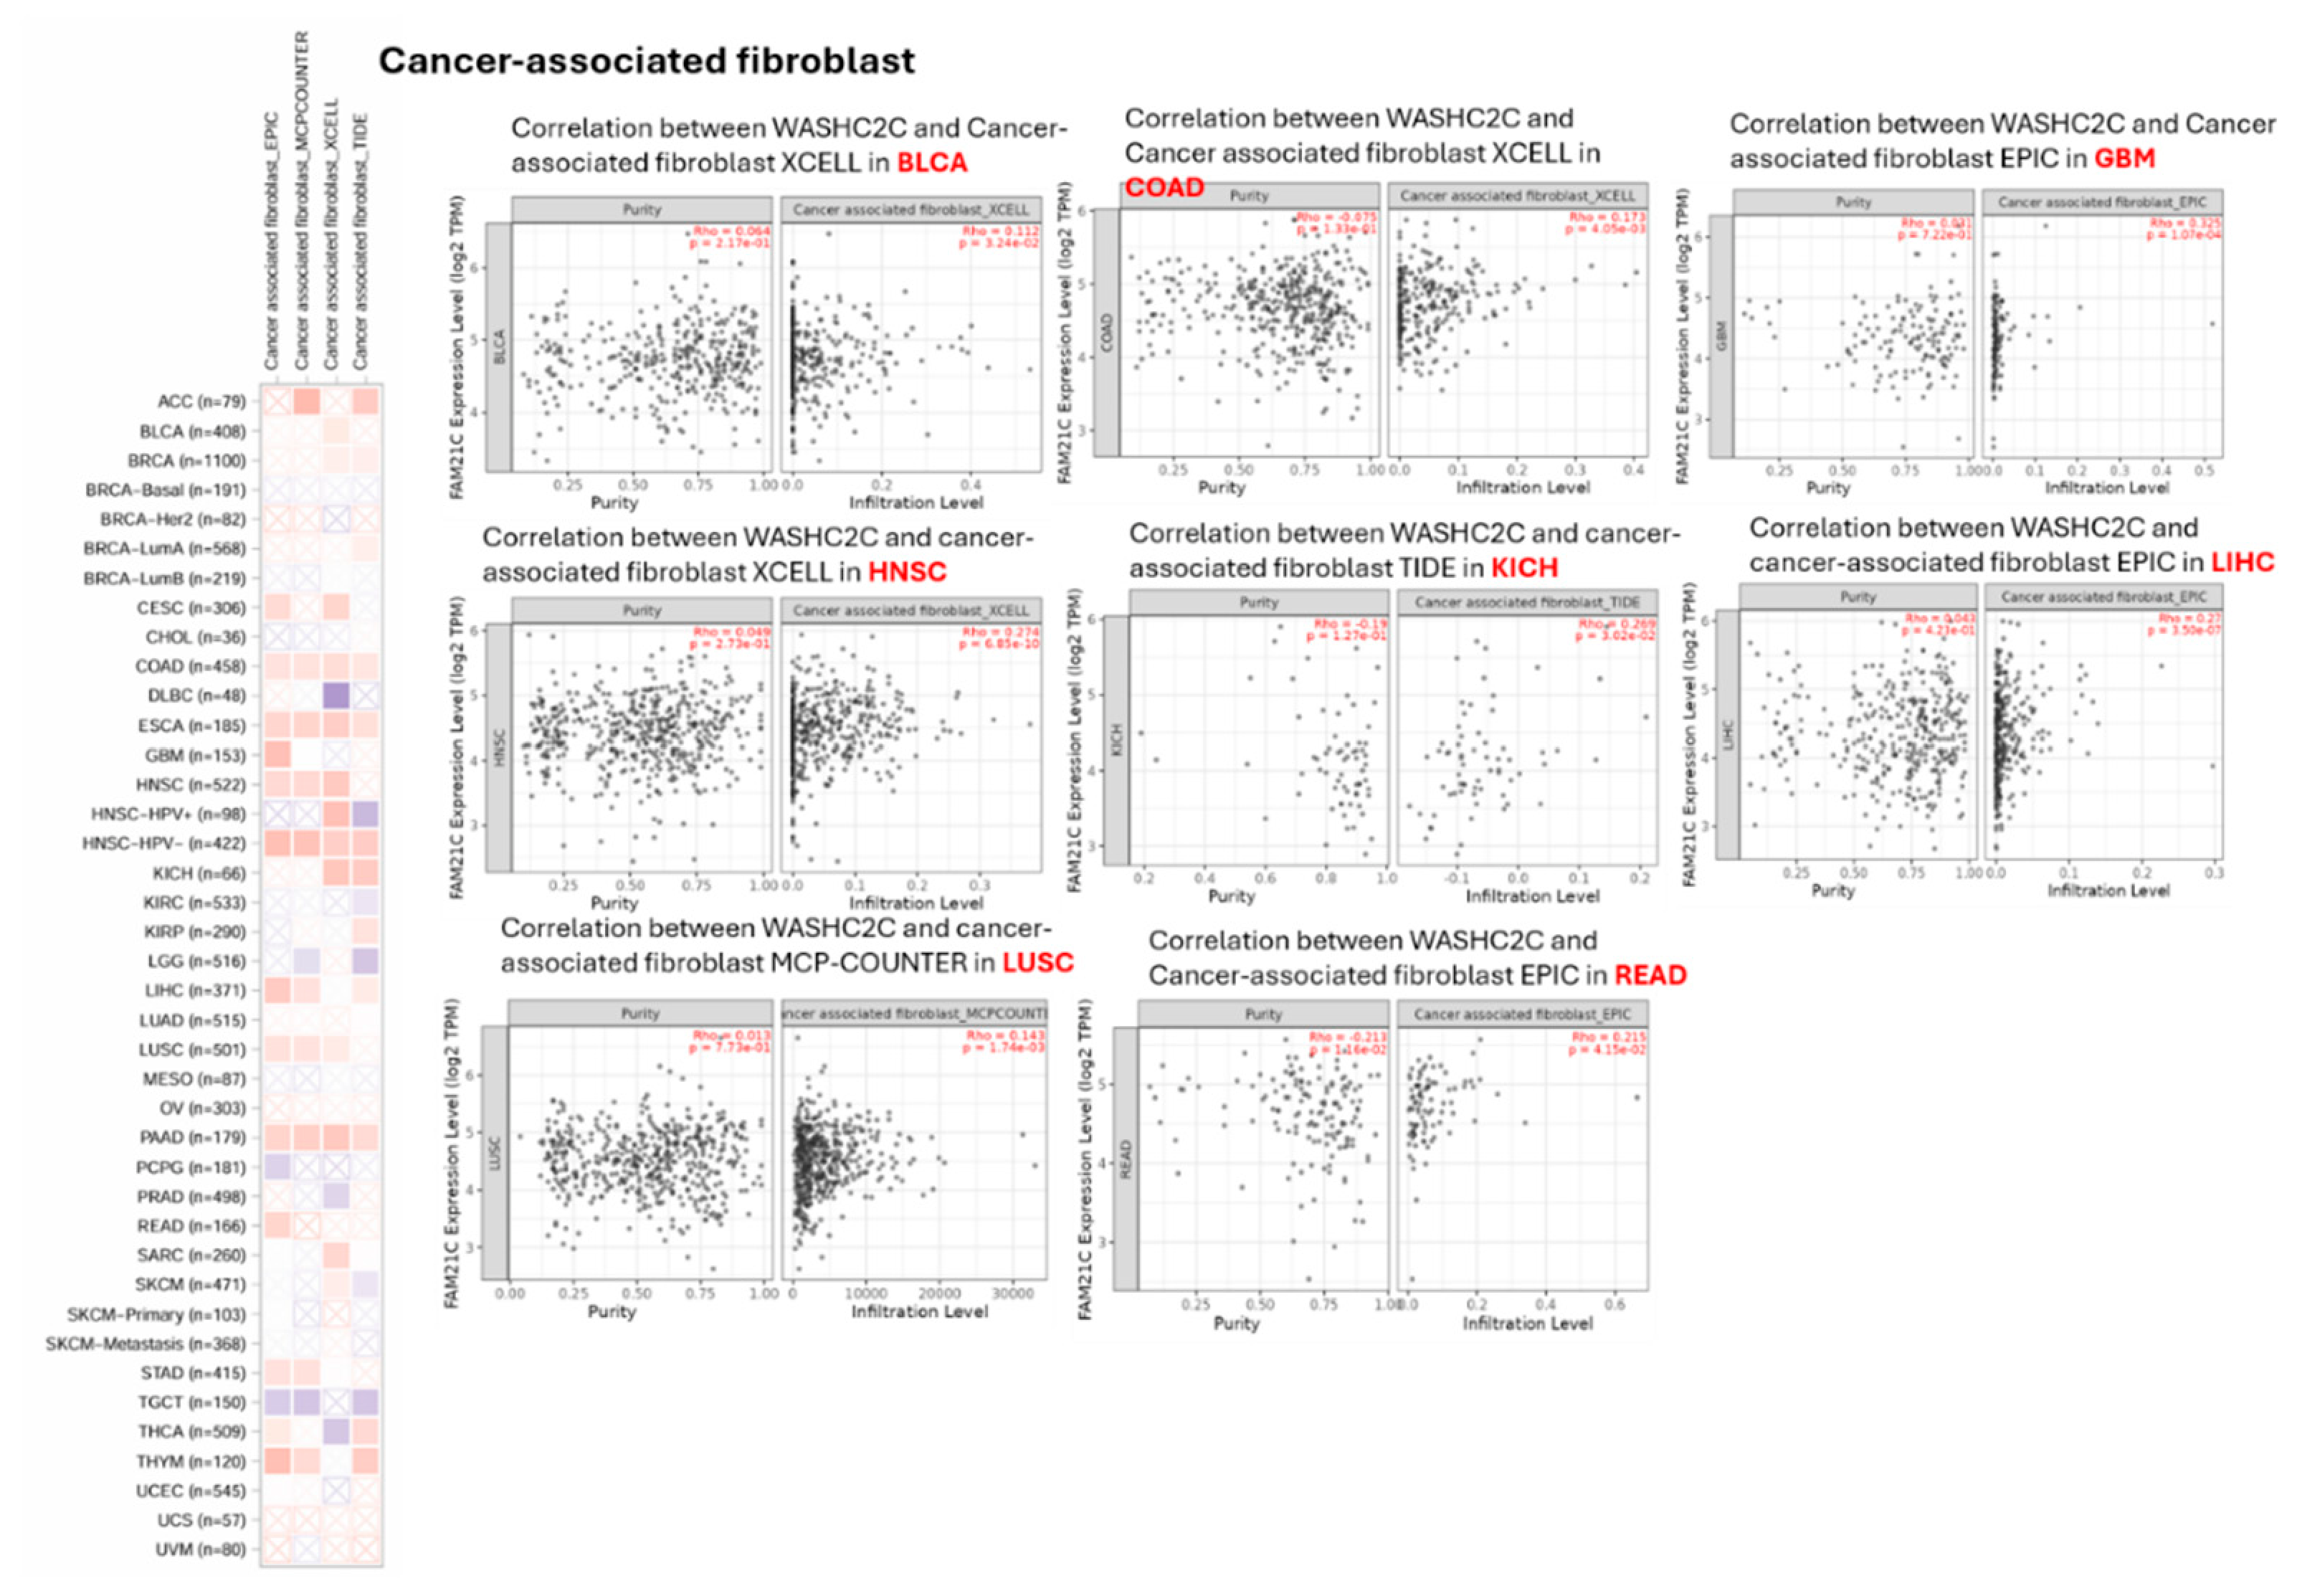
Figure 19.
WASHC2C expression across immune-checkpoint blockade response groups. Boxplots compare log2(TPM) expression of WASHC2C among baseline samples (gray), non-responders (orange), and responders (green) across experimental datasets involving anti-PD1, anti-PDL1, anti-CTLA4, or combination treatments. Each row indicates the model, dataset, treatment condition, sampling time, and sample size. Boxes represent the interquartile range, center lines indicate medians, whiskers show the data spread, and points represent individual samples. Green, orange, and red asterisks indicate responder-versus-baseline, non-responder-versus-baseline, and responder-versus-non-responder comparisons, respectively; underlining indicates that the group listed on the left had the higher expression value. The specific statistical test, significance threshold, and exact P-values are not displayed and should be defined in the Methods section.
Figure 19.
WASHC2C expression across immune-checkpoint blockade response groups. Boxplots compare log2(TPM) expression of WASHC2C among baseline samples (gray), non-responders (orange), and responders (green) across experimental datasets involving anti-PD1, anti-PDL1, anti-CTLA4, or combination treatments. Each row indicates the model, dataset, treatment condition, sampling time, and sample size. Boxes represent the interquartile range, center lines indicate medians, whiskers show the data spread, and points represent individual samples. Green, orange, and red asterisks indicate responder-versus-baseline, non-responder-versus-baseline, and responder-versus-non-responder comparisons, respectively; underlining indicates that the group listed on the left had the higher expression value. The specific statistical test, significance threshold, and exact P-values are not displayed and should be defined in the Methods section.
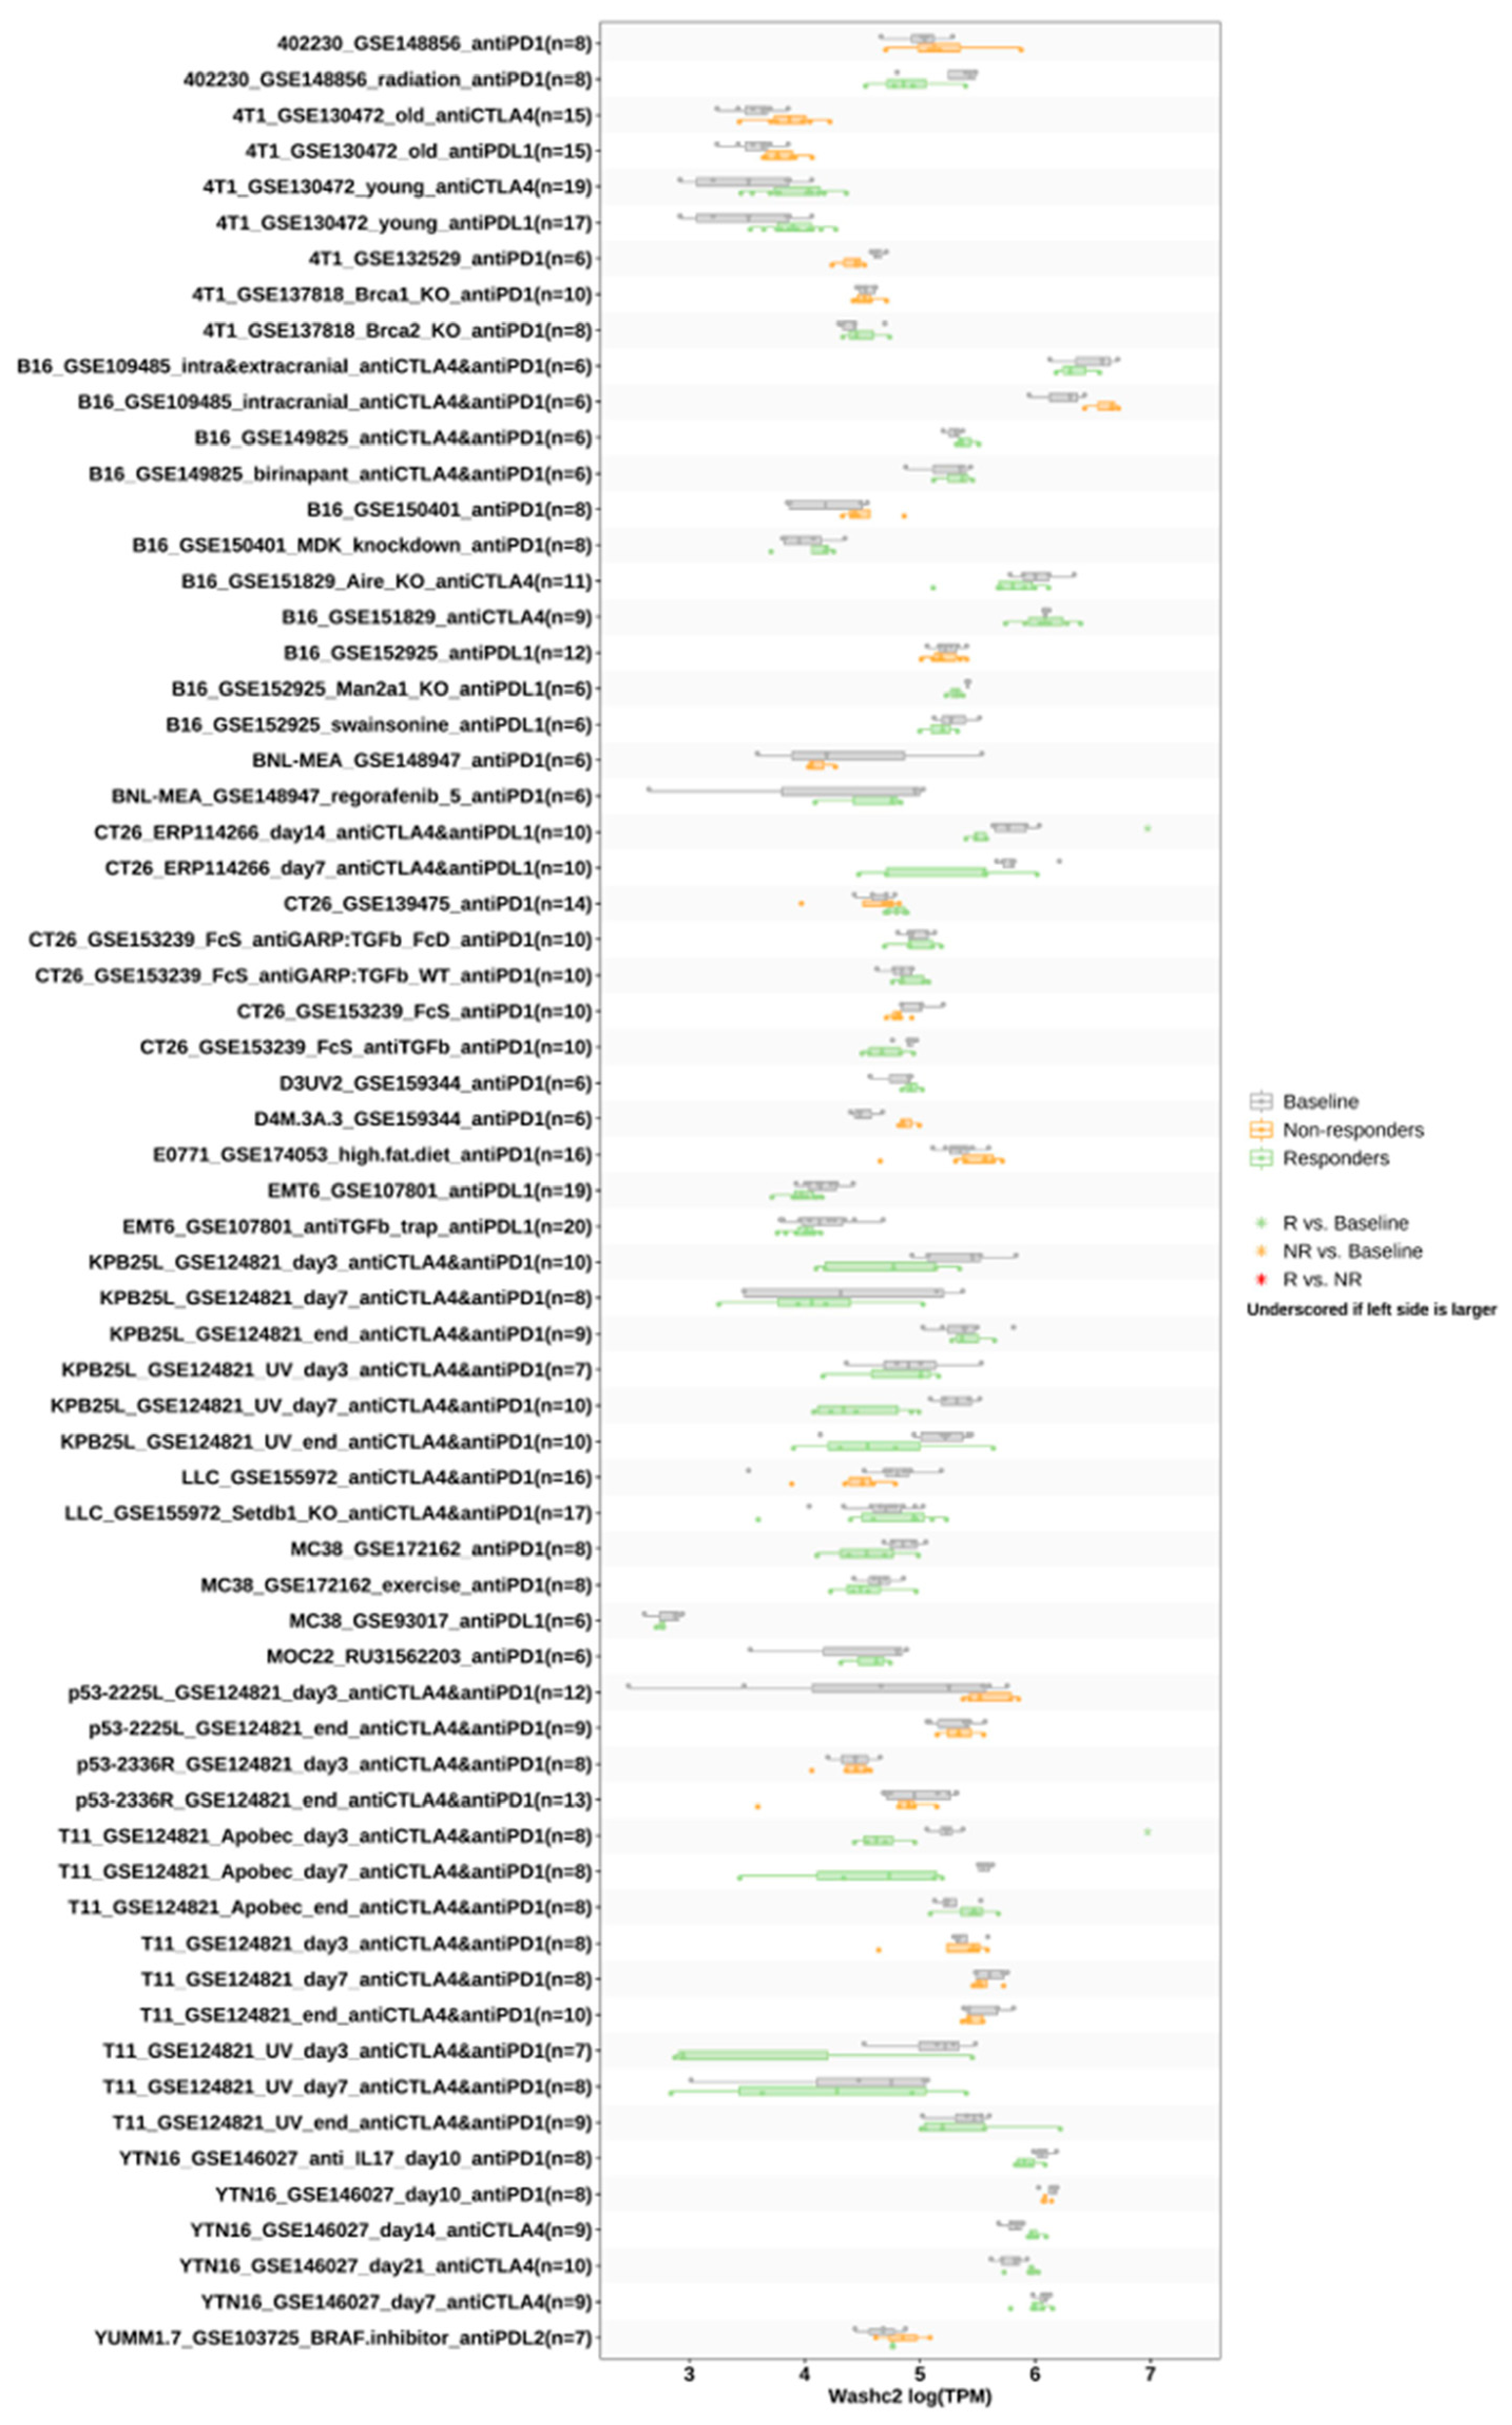
Figure 20.
Single-cell association of WASHC2C expression with cancer functional states. The upper bar chart shows the number of datasets with significant positive (red) or negative (blue) correlations. The bubble plot summarizes correlations across cancer datasets, with bubble color indicating the direction and size representing the strength of the correlation. WASHC2C was most frequently positively associated with metastasis, EMT, hypoxia, inflammation, invasion, and quiescence, whereas negative associations were less common.
Figure 20.
Single-cell association of WASHC2C expression with cancer functional states. The upper bar chart shows the number of datasets with significant positive (red) or negative (blue) correlations. The bubble plot summarizes correlations across cancer datasets, with bubble color indicating the direction and size representing the strength of the correlation. WASHC2C was most frequently positively associated with metastasis, EMT, hypoxia, inflammation, invasion, and quiescence, whereas negative associations were less common.
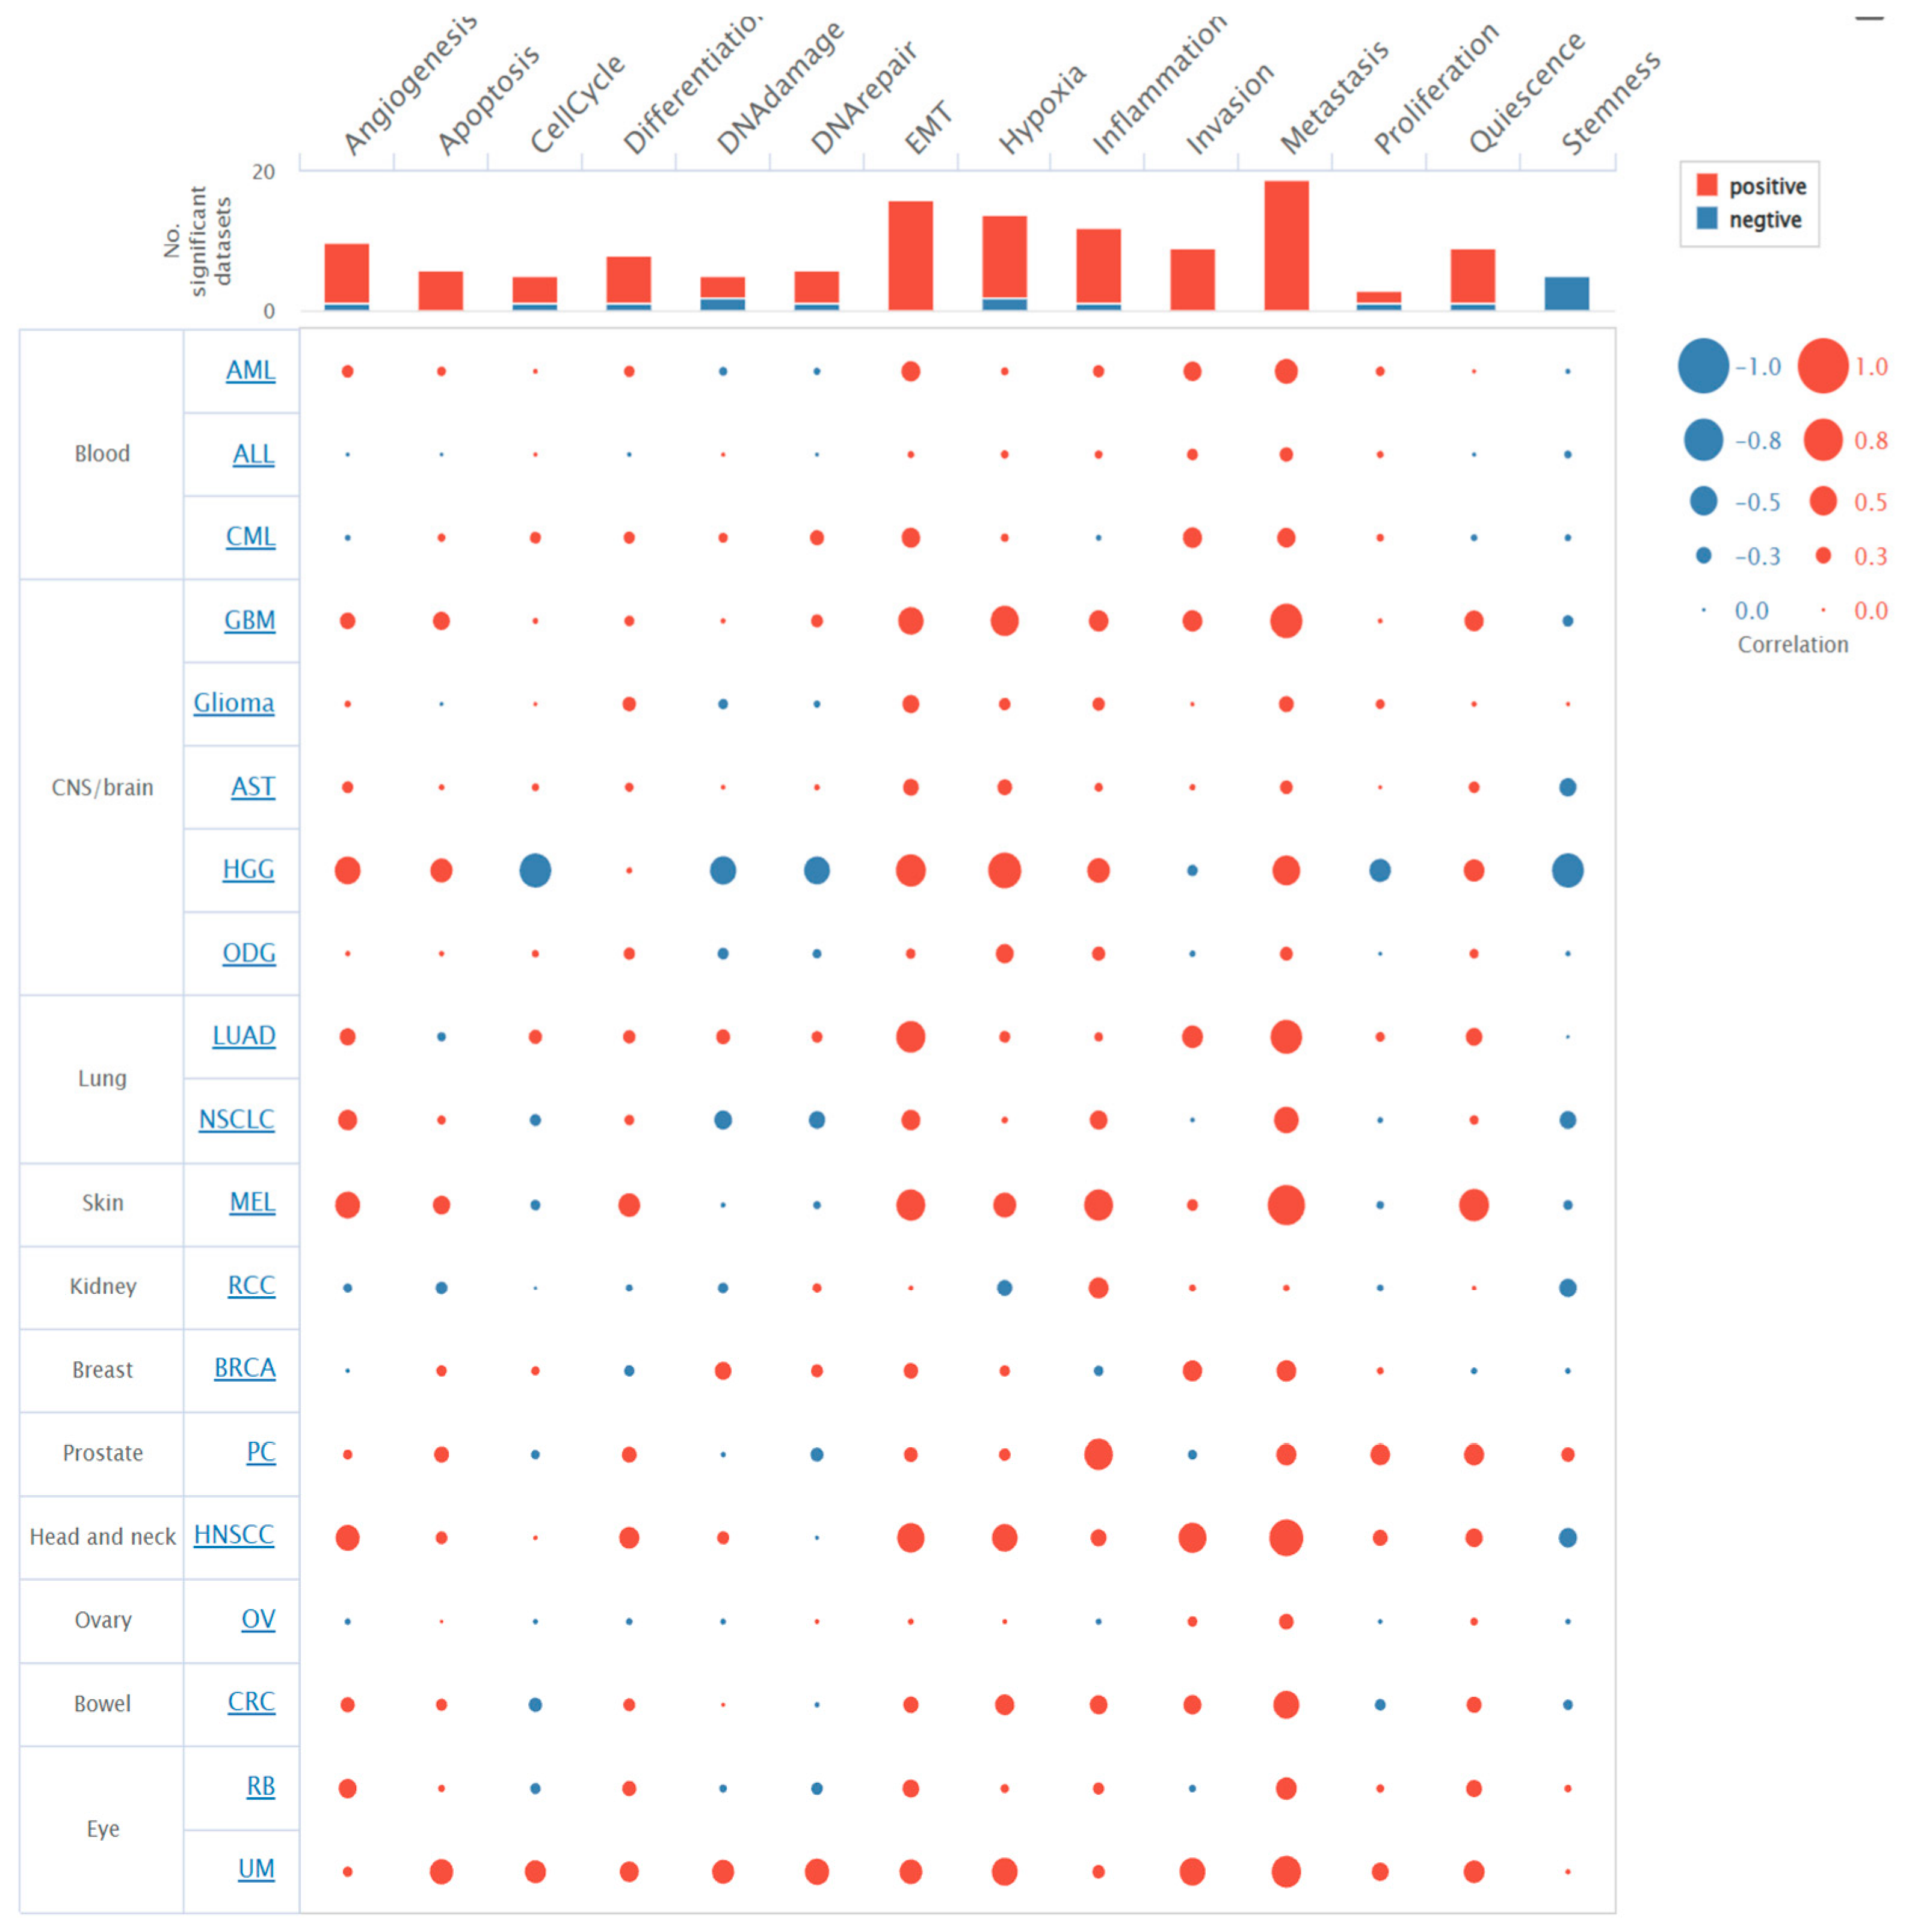
Disclaimer/Publisher’s Note: The statements, opinions and data contained in all publications are solely those of the individual author(s) and contributor(s) and not of MDPI and/or the editor(s). MDPI and/or the editor(s) disclaim responsibility for any injury to people or property resulting from any ideas, methods, instructions or products referred to in the content. |
© 2026 by the authors. Licensee MDPI, Basel, Switzerland. This article is an open access article distributed under the terms and conditions of the Creative Commons Attribution (CC BY) license (http://creativecommons.org/licenses/by/4.0/).
Copyright: This open access article is published under a Creative Commons CC BY 4.0 license, which permit the free download, distribution, and reuse, provided that the author and preprint are cited in any reuse.