

Submitted:
14 August 2026
Posted:
14 August 2026
You are already at the latest version
Abstract
HIV-associated neurocognitive disorders (HAND) involve persistent central nervous system (CNS) viral reservoirs in microglia, driving chronic neuroinflammation, synaptic dysfunction, and neuronal injury. Thus, scalable, human-relevant multicellular CNS models are needed to elucidate neuroHIV pathogenesis and ART neurotoxicity. Here, we establish and characterize a fully human iPSC-derived (hiPSC) CNS tri-culture platform comprising isogenic neurons, astrocytes, and microglia that remains viable and functionally active for up to 32 days in vitro. Using a microglia-tropic fluorescent HIV reporter virus, GFP-HIV-AD8, we demonstrate selective infection of microglia with no detectable neuronal infection, consistent with human neuroHIV. HIV replication was quantified over 14 days post-infection and effectively suppressed by the first-generation integrase strand transfer inhibitor (INSTI)-containing regimen elvitegravir/tenofovir disoproxil fumarate/emtricitabine (EVG/TDF/FTC), and the second-generation INSTI-containing regimens dolutegravir/tenofovir disoproxil fumarate/emtricitabine (DTG/TDF/FTC) and bictegravir/tenofovir alafenamide/emtricitabine (BIC/TAF/FTC), at clinically achievable concentrations. HIV infection reduced microglial viability by approximately 70%, partially rescued by low-dose ART but worsened by high-dose DTG-containing regimens, suggesting concentration-dependent toxicity. In uninfected cultures, DTG induced microglial morphological changes consistent with a reactive or dysfunctional state. Calcium imaging revealed ART-specific neuronal effects: EVG/TDF/FTC reduced neuronal activity, whereas BIC/TAF/FTC enhanced it. In HIV-infected cultures, DTG shortened neuronal spike duration, suggesting HIV–ART interactions on synaptic physiology. Overall, second-generation INSTIs, particularly BIC/TAF/FTC, showed the most favorable CNS safety profile. Together, these findings establish a scalable iPSC-derived CNS tri-culture model for neuroHIV research, ART efficacy testing, and neurotoxicity assessment.
Keywords:
neuroHIV
; iPSC
; microglia
; antiretroviral therapy
; neuronal calcium
; morphology
; tri-culture
; dolutegravir
; bictegravir
; neurotoxicity
1. Introduction
HIV-associated neurocognitive disorders (HAND) continue to affect 30–50% of people living with HIV despite effective viral suppression on combination antiretroviral therapy (ART) [1,2]. The prevalence of HAND is actually increasing in the aging HIV population, with milder forms such as asymptomatic neurocognitive impairment and mild neurocognitive disorder dominating the clinical spectrum [3,4]. The pathogenesis of HAND is multifactorial, involving expression of HIV proteins and persistent HIV replication in CNS reservoirs, chronic immune activation, neuroinflammation, and ART-related neurotoxicity [5,6,7,8,9,10,11,12,13]. Microglia, the resident myeloid cells of the CNS, are the primary cellular reservoir for HIV in the brain, harboring latent or low-level replicating virus even in the setting of suppressive ART [6,14]. Infected microglia secrete neurotoxic factors, including inflammatory cytokines, chemokines, and viral proteins such as gp120 and Tat, which indirectly disrupt neuronal function and survival [2,15,16]. Direct infection of neurons does not occur, a feature our model recapitulates.
HIV infection of humanized mouse models and HIV-1 transgenic rodents, and SIV-infection of macaques, have provided critical insights into neuroHIV pathogenesis [17,18,19]. However, they are costly, low-throughput, and often fail to fully replicate human-specific viral–host interactions, neuroimmune signaling, or ART pharmacokinetics [18,20,21]. Immortalized cell lines, such as U937 microglia or SH-SY5Y neurons, lack primary cell characteristics and do not support the complex neuron–astrocyte–microglia cross-talk essential for CNS homeostasis and pathology [22,23]. Primary human fetal or adult CNS cells are scarce, variable, and ethically challenging to obtain.
In recent years, human-induced pluripotent stem cell (hiPSC) technology has revolutionized disease modeling [22]. iPSC-derived neurons, astrocytes, and microglia can be generated in large quantities from individual donors, enabling patient-specific modeling of neuroHIV [24]. However, there is a need for iPSC-based CNS models containing multiple disease-relevant cell types that replicate HIV infection dynamics and are scalable for studies of neuroHIV virology, ART efficacy testing, and neurotoxicity assessment. Most existing platforms are either monocultures or simple dual co-cultures (e.g., neuron–astrocyte), lacking the full tri-cellular architecture that includes microglia, the primary target of HIV in the brain.
Here, we established an hiPSC-derived tri-culture platform containing neurons, astrocytes, and microglia, which is amenable to high-content imaging and functional readouts such as dynamic single cell calcium imaging, and tested HIV infection and the effects of ART combinations containing integrase strand transfer inhibitors (INSTIs). The INSTIs block the strand-transfer step of HIV integration into the host genome and are currently a preferred first-line ART worldwide [25]. Five INSTIs have been introduced to date [25]. The first-generation INSTI elvitegravir (EVG) remains clinically available in fixed-dose combinations [25]. The second-generation INSTIs dolutegravir (DTG) and bictegravir (BIC) are currently more widely used as first-line antiretroviral therapy due to their higher genetic barriers to resistance [25].
We show that the hiPSC-derived tri-culture containing neurons, astrocytes, and microglia remains healthy for up to 32 days in vitro (DIV32) and demonstrate that: [1] this platform supports productive HIV infection exclusively in microglia; [2] HIV replication can be quantified longitudinally via GFP expression; [3] three major ART combinations suppressed HIV replication effectively; [4] HIV infection reduced microglial viability, with partial rescue by low-dose ART but exacerbation by high-dose DTG/TDF/FTC; [5] high-dose DTG and DTG/TDF/FTC induced microglial morphological changes consistent with activation or toxicity; [6] ART combinations showed differential effects on neuronal calcium dynamics, with second-generation INSTI combinations, and BIC/TAF/FTC in particular, showing a favorable profile; and [7] HIV infection in the presence of DTG shortened neuronal spike duration, a novel finding with implications for synaptic dysfunction in HAND.
This platform offers a scalable, human-relevant, high-content screening tool for neuroHIV research and preclinical ART safety assessment. These findings are particularly relevant to the FDA's emphasis on New Approach Methodologies (NAMs), including human in vitro models, to improve translational predictivity, reduce reliance on animal testing, and support more efficient drug development.
2. Materials and Methods
2.1. Human iPSC (hiPSC)-Derived CNS Tri-Culture Platform
Isogenic human induced pluripotent stem cell (hiPSC)-derived neurons, astrocytes, and microglia were obtained from BrainXell Madison WI USA. All three cell types were generated using BrainXell proprietary differentiation protocols. For tri-culture assembly in HIV experiments (day in vitro 0, DIV0), cortical glutamatergic neurons and cortical astrocytes were thawed and seeded into 96-well plates (Revvity, #6055302) pre-coated with Poly-D-Lysine (Sigma, P0899) at a final density of 27,200 neurons and 3,400 astrocytes (neuron:astrocyte ratio 8:1) in BrainXell recommended co-culture media containing Geltrex (Gibco A14132-01). Co-cultures were maintained according to BrainXell’s recommendations. On DIV7 13,600 microglia were added per well (neuron:microglia ratio of 8:4). Tri-cultures were maintained in BrainXell’s recommended media (Phenol Free Neurobasal (Gibco 12348-017) and Phenol Free DMEM/F12 (Gibco 11039-021) supplemented with B27 (Gibco 17504-044), N2 (Defined Biosciences HiDef N2), GlutaMAX (Gibco 35050-061), Ascorbic Acid (Thermo Fisher 036237.14), Chemically Defined Lipid Mix (Gibco 11905-031), 20ng/mL M-CSF (Peprotech 300-25), 100ng/mL IL-34 (Peprotech 200-34). Half-medium changes were performed every 3-4 days. For tri-culture assembly for ARV toxicity studies, co-cultures in 384-well plates pre-coated with Poly-D-Lysine were plated at neuron:astrocyte ratio 4:1. On DIV14 microglia were stained with Cellvue Far Red membrane dye (Sigma) and were added per well (neuron:microglia ratio of 5:1). Cultures were used for experiments at DIV21–32.
2.2. HIV-1 Strain and Infection
The GFP-expressing HIV-1 strain GFP-HIV-AD8 (HIV-1(AD8)-GFP) was custom ordered from Virongy Biosciences (Manassas, VA, USA). This strain is based on the pNL-AD8 molecular clone (CCR5-tropic) that has been modified so the GFP is produced on the same reading frame as the NEF gene; the NEF gene is expressed from an internal ribosome entry site (IRES) downstream of GFP. The stock titer was approximately 1.46 × 10⁶ IU/mL.
For infections, tri-cultures at DIV11 were exposed to virus diluted in culture medium at 1:250 final dilution (corresponding to approximately 5,840 IU per well) for 24 hours at 37°C in 5% CO₂. Following infection, the medium was discarded, cultures were washed once with complete media and replaced with fresh complete medium. Mock infections were performed identically using complete media only (no virus). GFP expression (indicating HIV replication) was monitored daily for 14–28 days post-infection (DPI) using Vala Sciences' Kinetic Image Cytometer (IC200 KIC®).
2.3. Antiretroviral Drugs
The following antiretroviral drugs were obtained from commercial sources: Dolutegravir (DTG; HY-13238), Elvitegravir (EVG; HY-14740), Bictegravir (BIC; HY-17605), Tenofovir Disoproxil Fumarate (TDF; HY-13782) and Tenofovir Alafenamide (TAF; HY-15232) all from MedChemExpress (Monmouth Junction, NJ, USA), Emtricitabine (FTC; E525000) from Toronto Research Chemicals (Vaughan, ON, Canada). All drugs were reconstituted in DMSO (Sigma, D2650) as 100mM stock solutions and stored at −80°C. Working dilutions were prepared fresh in culture medium on the day of use. The final DMSO concentration never exceeded 0.1%, which served as vehicle control.
Concentrations tested were based on published maximum plasma concentration (Cmax) values from clinical studies: DTG: 8 µM; EVG: 3.5 µM; BIC: 13.5 µM; TDF: 0.6 µM; TAF: 0.6 µM; FTC: 7 µM.
Drugs were tested alone or in clinically relevant combinations: DTG/TDF/FTC (integrase inhibitor + NRTI backbone); EVG/TDF/FTC (integrase inhibitor + NRTI backbone); BIC/TAF/FTC (integrase inhibitor + NRTI backbone). Each combination was tested at 0.1×, 1×, and 3× Cmax of each component, as well as a fixed concentration of 10 µM each. For HIV infection studies, antiretrovirals (ARVs) were added starting at DPI 1 (or DPI 4 for delayed treatment experiments) and continued for 7–14 days with twice weekly half-medium changes to maintain drug levels. For uninfected toxicity studies, ARVs were added at DIV22 for 7 days.
Concentrations up to 3× the reported human plasma Cmax were included to provide a conservative supratherapeutic exposure margin and detect subclinical or concentration-dependent neurotoxicity that may not be apparent at standard therapeutic exposure but could emerge in susceptible patient populations or specific dosing scenarios. This approach is consistent with nonclinical safety testing [26]. Additionally, nominal concentrations used in vitro are not directly equivalent to in vivo exposure due to differences in protein binding and freely available drug concentrations can substantially affect in vitro-to-in vivo extrapolation [27,28]. This is particularly relevant for TDF, TAF, and FTC because plasma parent-drug concentrations do not directly reflect intracellular exposure to their active phosphorylated metabolites [29]. DTG-associated neuropsychiatric adverse events and discontinuations occur more frequently in women and older patients, suggesting greater susceptibility in certain populations [30]. Higher CNS drug exposure may also occur in specific clinical settings because of drug–drug interactions—particularly CYP3A4 inhibition with EVG—altered blood–brain barrier integrity during neuroinflammation, or variability in the expression or activity of efflux transporters such as P-gp and BCRP [31,32,33,34]. Thus, testing up to 3× Cmax provides a conservative hazard-identification condition and helps define the concentration range between antiviral efficacy and measurable cellular toxicity.
2.4. Live-Cell Imaging of HIV Replication (GFP Quantification)
HIV replication was monitored longitudinally using GFP expression as a surrogate for p24 expression. Live tri-cultures were imaged daily (5x per week) from DPI 1 to DPI 17 using Vala Sciences' IC200 Kinetic Image Cytometer (KIC®) equipped with a 20× objective (0.75 NA). For each well, a 3×3 grid of fields (9 fields total) was acquired. GFP+ microglia were identified using automated image analysis.
2.5. Immunofluorescence and High-Content Imaging
At experimental endpoints, cultures were fixed with 2% PFA and 1.7% sucrose in PBS for 20 minutes at room temperature, washed three times with PBS, and permeabilized with 0.3% Triton X-100 (Sigma, T8787) in PBS for 15 minutes. Blocking was performed with 5% Goat serum and 1% BSA in PBS for 1 hour at room temperature. Primary antibodies (all from commercial sources) were diluted in blocking buffer and incubated overnight at 4°C: Chicken anti-TUBB3 (neurons; Synaptic Systems, 302-306; 1:250); Mouse anti-GFAP (astrocytes; Cell Signaling, 367S; 1:300);
Rabbit anti-IBA1 (Wako, 019-19741; 1:500). After three washes with PBS, secondary antibodies were diluted in 2% BSA in PBS and applied for 2 hours at room temperature: Goat anti-Mouse, Alexa Fluor™ 488 (Invitrogen, A11029; 1:1000), Goat anti-Chicken, Alexa Fluor™ 555 (Invitrogen, A21437; 1:1000), Goat anti-Rabbit, Alexa Fluor™ 647 (Invitrogen, A21245; 1:1000).
Nuclei were stained with Hoechst 33342 (Invitrogen, H3570; 1:1000).
Plates were imaged using Vala Sciences' IC200 Kinetic Image Cytometer (KIC®) equipped with a 20× objective (0.75 NA). For each well, a 3×3 grid of fields (9 fields total) was acquired. Each image was acquired as a Synthetic Focus with a range of 10 µm and step size of 1 µm to ensure sharp focus across the entire well.
2.6. Calcium Imaging (Neuronal Activity)
Neuronal activity was assessed using the fluorescent calcium indicator Cal-520 AM (AAT Bioquest) or Cal-590 AM (AAT Bioquest). At the end of ART treatment (DIV28 for uninfected studies; DPI 17 for HIV-infected studies), culture medium was replaced with Brainphys Phenol Free Imaging Buffer (StemCell Technologies, Vancouver, CAN) containing 5 µM Cal-520 AM (non-infected cultures) or 2.5 µM Cal-590 AM (HIV cultures), 1X Powerload, 1mM Probenecid, and 0.1 µg/mL Hoechst 33342 (all from ThermoFisher, Waltham, MA, USA) for 45 minutes at 37°C. Cells were then washed twice with Brainphys and allowed to equilibrate for 15 minutes at 37°C in the IC200 KIC. Kinetic imaging was performed using the IC200 KIC® at 37°C with 5% CO₂ with 1 field of view per well imaged using a 20× objective. A single image of the nuclear channel was obtained, followed by a single image of the CellVue stained microglia, and the calcium was acquired by imaging four frames per second for 2 minutes (480 frames, non-infected cultures) or 20 fps for 1min (infected cultures).
2.7. Image Analysis and Quantification (CyteSeer®)
All image analysis was performed using Vala Sciences' CyteSeer® automated image analysis software, which identifies, segments, and indexes each cell. For live HIV-GFP analysis: GFP+ cells were counted per well, and the mean ± SD from N=6 wells was calculated for each time point. For fixed cell analysis: Cells were first indexed based on Hoechst nuclear staining. Microglia were classified by IBA+ positive nuclei, and infected microglia were classified as IBA1+ and GFP+. Microglia morphology analysis was performed on IBA1+ cells using CyteSeer® algorithms. For each individual cell, the following parameters were calculated: Cell area (µm²): total area of IBA1 staining; Cell body width (µm): average width of the cell body; Roundness: = 4 × area / (π × major axis²); values close to 1 indicate perfect circularity; Elongation: = 1 – (width / length); higher values indicate more elongated cells; For population-level analysis, mean values per well were used. Calcium trace analysis was performed using Vala Sciences' CyteSeer® AI-enabled image analysis software. Measurements are made on single cell traces and single transients in each trace using custom algorithm to baseline the calcium trace (ΔF/F), identify transients, and define the upstroke portion of calcium transient as an activity spike. For each active neuron, the following parameters were calculated: Percent Active: percent of neurons with at least one spike; Event frequency (spikes per second, Hz); Spiking fraction: fraction of time neuron was spiking; Mean spike amplitude (ΔF/F), Max rise speed (ΔF/F per second). A neuron was considered "active" if it fired at least one spike during the recording. For each well, data from all cells were aggregated, and well-level means were calculated.
2.8. Statistical Analysis
All experiments were performed with N=4-6 independent wells per condition. Data are presented as mean ± standard deviation (SD). Comparisons between two groups were performed using two-tailed Student's t-test (parametric) or Mann–Whitney U test (non-parametric). For multiple comparisons, one-way ANOVA with Dunnett's post-hoc test (comparing all conditions to control) or two-way ANOVA with Sidak's multiple comparisons test (for two independent variables, e.g., infection status and treatment) was used. Statistical analyses were performed using GraphPad Prism 9.5 (San Diego, CA, USA). Significance thresholds: *p < 0.05, **p < 0.01, ***p < 0.001, ****p < 0.0001.
3. Results
3.1. iPSC-Triculture Platform Supports Long-Term CNS Cell Survival and Maintains Cell-Type-Specific Marker Expression
We first characterized the baseline health and composition of the tri-culture platform at DIV 32, the latest time point evaluated (Figure 1). Immunofluorescence staining revealed robust and spatially organized expression of cell-type-specific markers. TUBB3 (neurons) was present in a substantial proportion of total cells, with elaborate neurite networks extending across the well surface. Neuronal cell bodies appeared phase-bright and formed small clusters, consistent with synaptic network formation. GFAP (astrocytes) was expressed in a large fraction of cells, with a stellate morphology and fine processes interacting with both neurons and microglia. IBA1 (microglia) was present in a smaller subset of cells, displaying a ramified morphology under basal conditions, small cell body with multiple thin, branching processes, characteristic of surveillant, non-activated microglia (Figure 1A). Hoechst nuclear staining confirmed that total cell density remained stable from DIV 21 to DIV 32, with no evidence of spontaneous cell death or detachment. The overlay image (Figure 1B) demonstrated close physical association between the three cell types, with microglial processes often contacting neuronal somata and dendrites. Importantly, no signs of spontaneous activation or reactive gliosis were observed, as assessed by IBA1 intensity and GFAP upregulation. This platform thus provides a stable, long-lived, physiologically relevant CNS microenvironment suitable for HIV infection and drug exposure studies lasting up to 4 weeks.
3.2. HIV Selectively Infects Microglia in Tri-culture but Not Neurons
To model HIV infection in the CNS, we exposed tri-cultures at DIV 21 to GFP-HIV-AD8 (1:250 dilution) or mock control. At DPI 14, cultures were fixed and stained for TUBB3 (neurons), IBA1 (microglia), and Hoechst (nuclei). GFP expression (HIV) was visualized directly without immunostaining. Across all fields examined (N=6 wells, 9 fields/well), GFP signal colocalized exclusively with IBA1+ microglia (Figure 2). In contrast, non-infected cultures showed no GFP signal in any cell type. Quantitative analysis of neuronal (TUBB3+), microglial (IBA1+), and GFP+ populations across 10 random fields per well confirmed that 100% of GFP+ cells were IBA1+, and 0% were TUBB3+. This selectivity mirrors the known tropism of HIV for myeloid cells in the CNS and validates the platform for studies of HIV-microglia interactions without confounding direct neuronal infection.
3.3. Longitudinal Quantification of HIV Replication in Tri-culture Using GFP Expression
We next tracked the temporal dynamics of HIV replication over 14 days post-infection (DPI) using live-cell GFP imaging. At DPI 1, rare isolated GFP+ microglia were observed (Figure 3A, top row). By DPI 7, the number of GFP+ microglia increased markedly, and small clusters of infected cells appeared, suggesting local viral spread (middle row). At DPI 14, GFP+ microglia were widespread throughout the well, with many cells exhibiting bright GFP fluorescence (bottom row). Non-infected cultures showed no GFP+ cells at any time point. To confirm that the GFP signal reflected authentic viral replication and not pseudotyping or residual inoculum, we fixed cultures at DPI 14 and immunostained for IBA1. All GFP+ cells were IBA1+, and their morphology ranged from ramified to amoeboid, consistent with HIV-induced microglial activation (Figure 3B). Quantitative time-course analysis (Figure 3C) revealed an increase in GFP+ microglia count, with a lag phase (DPI 1–3), a slow rise phase (DPI 3–9), and an exponential growth phase (DPI 9–14). Two-way ANOVA with Sidak’s multiple comparisons test showed significant differences between HIV-infected and mock at all time points from DPI 7 onward (p < 0.01 on D7). The intra-assay coefficient of variation across multiple wells was low, indicating excellent reproducibility. This longitudinal GFP readout enables non-invasive, real-time monitoring of HIV replication and can be used to assess antiviral efficacy or viral reactivation.
3.4. Clinically Relevant ART Combinations Suppress HIV Replication in Tri-culture
We next asked whether the tri-culture platform could recapitulate the antiviral efficacy of standard ART combinations. Three modern integrase inhibitor-based regimens were tested: DTG/TDF/FTC, EVG/TDF/FTC, and BIC/TAF/FTC. ART was added starting at DPI 4 and maintained for 13 or 17 days, with half-medium changes every 3 days with fresh drug addition to sustain drug levels. GFP+ microglia counts were quantified 5 times a week for 2+ weeks after infection. In the untreated HIV control, GFP+ microglia increased exponentially as described above (Figure 4A–C, blue curves). In contrast, all three ART combinations at 0.1 × Cmax, 1× Cmax, and 3× Cmax nearly completely suppressed HIV replication, with GFP+ counts remaining at baseline levels throughout the 13 or 17-day time course (orange, green, and pink curves). The BIC/TAF/FTC cultures were stopped at 13 days due to excessive toxicity in the 3× Cmax condition. No significant differences in antiviral efficacy were observed between the three ART combinations at matched concentration multiples. Notably, the BIC/TAF/FTC combination appeared to suppress viral replication slightly faster than the DTG- or EVG-based regimens, as divergence from the HIV control begins on DPI 7 and becomes significant on DPI 10 in BIC/TAF/FTC, but divergence does not begin until DPI 10 and significant changes don’t appear until DPI 12 and 11 respectively in the DTG- and EVG-based regimens. These data demonstrate that the tri-culture platform is sensitive to ART-mediated suppression and can distinguish between suboptimal and optimal drug concentrations.
3.5. HIV Infection Reduces Microglial Viability; Low-Dose ART Rescues but High-Dose DTG Exacerbates Toxicity
While ART suppresses viral replication, its impact on microglial survival in the context of HIV infection is not well understood. To address this, we quantified total microglia (IBA1+ nuclei) at DPI 17. HIV infection alone significantly reduced microglial count compared to mock (Figure 5C). Treatment with 0.1× Cmax of DTG/TDF/FTC partially but significantly rescued microglial numbers, suggesting that even suboptimal ART reduces viral cytopathic effects. Similarly, 0.1× Cmax EVG/TDF/FTC also rescued microglia. However, 3× Cmax DTG/TDF/FTC unexpectedly reduced microglial counts below those seen with HIV alone, indicating concentration-dependent ART toxicity. In contrast, 3× Cmax EVG/TDF/FTC did not further reduce microglia compared to HIV alone. Notably, neither HIV nor any ART combination significantly altered the total number of neurons (TUBB3+) and astrocytes (GFAP+) (Figure 5B), indicating that the observed effects are microglia-specific. These findings highlight a dual role for ART: protective at low doses via viral suppression, but potentially harmful at high doses, particularly with DTG-containing regimens.
3.6. ART Alters Microglia Morphology in Uninfected Tri-cultures
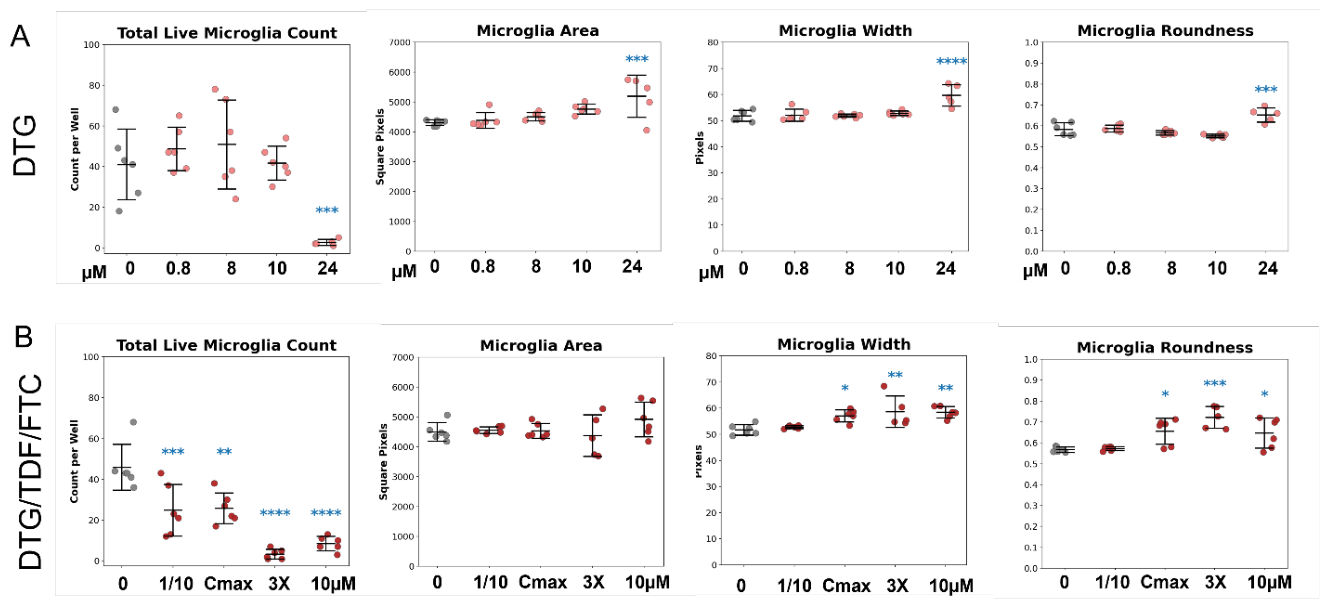
Given the microglial count changes induced by ART, we next examined whether ART alone (in the absence of HIV) affects microglial morphology, a sensitive indicator of activation state. Uninfected tri-cultures were treated with DTG alone or DTG/TDF/FTC at 0.1×, 1×, and 3× Cmax for 7 days. At 3× Cmax, DTG alone significantly reduced the number of live microglia (Figure 7A) and caused striking morphological changes (Figure 6A). IBA1+ cells became more rounded, with fewer processes, and increased cell body width. The DTG/TDF/FTC combination produced even more pronounced effects at 1× and 3× Cmax. Quantitative analysis (Figure 7) showed that DTG alone increased microglial roundness at 3× Cmax and increased cell body width. The combination ART increased roundness and width at both 1× and 3× Cmax. These morphological changes are consistent with a transition from a surveillant, ramified phenotype to an activated, amoeboid-like state, which may have functional consequences for neuroimmune interactions. No significant morphological changes were observed with EVG or BIC combinations at any concentration (data not shown), suggesting that DTG is a primary driver of microglial morphological alteration.
Figure 7.
Dolutegravir and combination dolutegravir-containing ARVs reduce microglia count and alter morphology. Single or combination ARVs and DMSO (control) were added to tri-cultures of neurons, astrocytes, and microglia for 7 days at 0.1x Cmax, Cmax, 3X Cmax or 10µM for each compound. Data are shown as means ± SD of N=6 wells. Statistical analysis was performed using one-way ANOVA with Dunnet’s post-hoc test (*p<0.05, **p<0.01, ***p<0.001, ****p<0.0001). DTG; Dolutegravir, TDF; Tenofovir Disoproxil Fumarate, FTC; Emtricitabine.
Figure 7.
Dolutegravir and combination dolutegravir-containing ARVs reduce microglia count and alter morphology. Single or combination ARVs and DMSO (control) were added to tri-cultures of neurons, astrocytes, and microglia for 7 days at 0.1x Cmax, Cmax, 3X Cmax or 10µM for each compound. Data are shown as means ± SD of N=6 wells. Statistical analysis was performed using one-way ANOVA with Dunnet’s post-hoc test (*p<0.05, **p<0.01, ***p<0.001, ****p<0.0001). DTG; Dolutegravir, TDF; Tenofovir Disoproxil Fumarate, FTC; Emtricitabine.
3.7. HIV Infection Overrides ART Effects on Microglia Morphology
We next asked whether HIV infection itself drives microglial morphology changes and whether ART modifies this effect. In HIV-infected tri-cultures treated with various ART regimens, we separately analyzed GFP+ (infected) and GFP– (uninfected bystander) microglia within the same well. Strikingly, regardless of ART treatment, GFP+ microglia were significantly more elongated and less round compared to GFP-microglia (Figure 8B-C). This HIV-induced morphological shift was consistent across all ART conditions, including untreated HIV and fully suppressed (1× Cmax ART) cultures. In contrast, ART alone (in GFP- cells) had no significant effect on elongation or roundness compared to mock controls. These data indicate that HIV infection itself is the dominant driver of microglial morphological changes, overriding any modulatory effects of ART. The persistence of morphological alterations even under fully suppressive ART suggests that either low-level residual viral protein expression or irreversible cellular remodeling occurs.
3.8. ART Combinations Differentially Affect Neuronal Calcium Activity
Given that ART can cross the blood–brain barrier and potentially affect neuronal function directly, we performed calcium imaging to assess network-level neuronal activity after 7-day ART exposure in uninfected tri-cultures. EVG/TDF/FTC at 3× Cmax significantly reduced the number of active neurons per field, event frequency, spiking fraction, mean spike amplitude, and max rise speed (Figure 9B, middle panels). DTG/TDF/FTC at 3× Cmax also reduced the percent of active neurons and event frequency, with only trends toward reduction of other parameters (Figure 9A, top panels). BIC/TAF/FTC showed the most favorable profile: at 0.1× Cmax and 10 µM, it increased event frequency and spiking fraction, and at 10 µM increased mean spike amplitude with no reductions in calcium activity at any dose (Figure 9, bottom panels). These data reveal striking differences in ART neuroactivity: EVG combinations suppress neuronal function, DTG combinations alter spike dynamics, and BIC combinations enhance activity, a potential advantage for patients with cognitive deficits.
3.9. HIV Infection Combined with DTG Shortens Neuronal Spike Duration
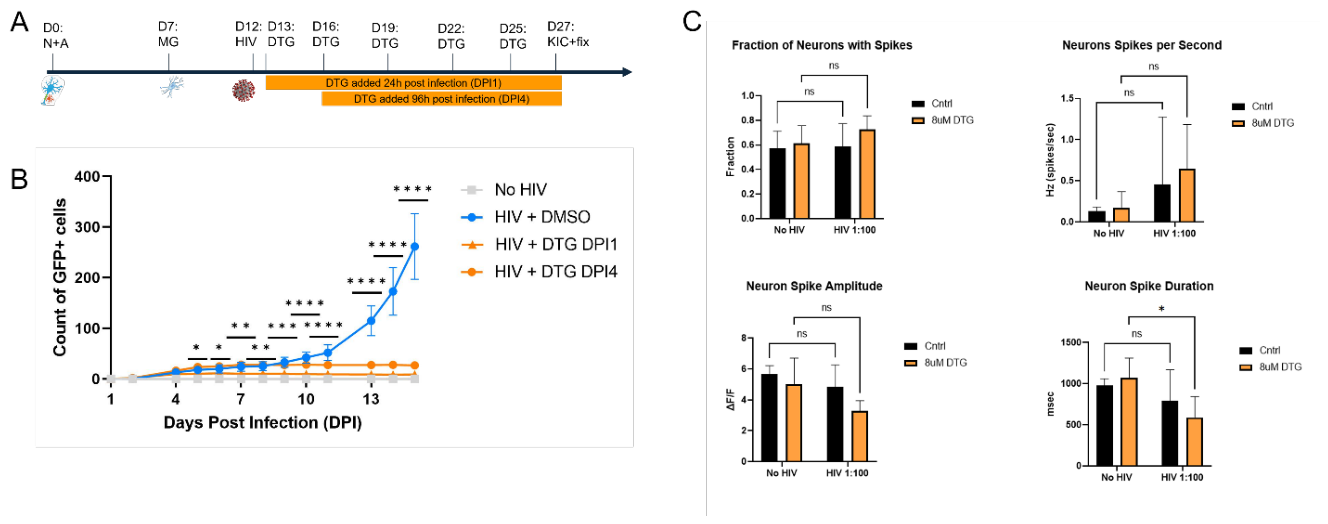
Finally, we examined whether HIV infection modifies ART effects on neurons. HIV-infected tri-cultures were treated with DTG (Cmax, 8 µM) added either at DPI 1 (early) or DPI 4 (delayed). Both treatment regimens fully suppressed viral replication by DPI 10 (Figure 10A–B). Calcium imaging at DPI 14 revealed that in HIV-infected cultures treated with DTG (DPI 1), neuronal spike duration was significantly shorter compared to uninfected cultures treated with DTG (Figure 10C). No differences were observed in spike frequency, amplitude, or rise speed. The DPI 4 treatment group showed a similar trend but did not reach statistical significance. These results suggest a synergistic effect of HIV and DTG on synaptic physiology, potentially mediated by persistent low-level inflammation or viral protein expression despite viral suppression. This finding has important implications for understanding HAND in ART-treated individuals.
4. Discussion
We have developed and extensively characterized a hiPSC-derived tri-culture model of neuroHIV that recapitulates key aspects of CNS HIV infection and ART exposure. This platform offers several major advantages over existing models: (1) all three cell types are derived from isogenic hiPSCs, avoiding species and genetic background differences; (2) the cultures remain stable for >4 weeks, enabling long-term studies; (3) HIV infection is restricted to microglia, mirroring human pathology; (4) viral replication can be tracked in real time via GFP; (5) the system is compatible with high-content imaging and functional calcium readouts; and (6) it is scalable to 96- or 384-well plates for drug screening. Below, we discuss the implications of our key findings.
4.1. Selective Microglial Infection and Viral Spread
Our observation that HIV infects only microglia, not neurons, is consistent with the known restricted tropism of HIV for CD4+ myeloid cells in the CNS [11,12,13]. We used a GFP-expressing virus to unambiguously demonstrate that no GFP signal arises from TUBB3+ cells. This selectivity is critical for interpreting downstream neuronal effects, which must be mediated indirectly via infected microglia.
4.2. ART Efficacy and Microglial Toxicity
All three ART combinations suppressed HIV replication effectively, demonstrating the platform’s utility for antiviral testing. However, we uncovered a concentration-dependent toxicity of DTG-containing regimens on microglia. At 3× Cmax, DTG/TDF/FTC reduced microglial counts below those seen with HIV alone. While DTG is generally well tolerated, it has been associated with neuropsychiatric adverse events, including insomnia, anxiety, and depression [35,36,37]. Previous studies suggested that DTG can perturb mitochondrial respiration and immunometabolic function in microglia cell lines, including murine BV2 microglial cells[38] and human microglia-derived hµglia cells [39], although not in hiPSC-derived microglia cells, as we report here.
Interestingly, EVG and BIC combinations did not show such toxicity, even at 3× Cmax. Our morphological data support DTG-induced activation of hiPSC-derived microglia, as evidenced by increased roundness and reduced ramification, a phenotype associated with enhanced production and release of pro-inflammatory cytokines [40,41]. DTG-induced morphological alterations have also been observed in a microglia cell line and in primary rat oligodendrocytes [38,42]. These results argue for careful consideration of DTG dosing in patients with pre-existing CNS compromise.
4.3. ART-Induced Neuronal Effects
The differential effects of ART combinations on neuronal calcium activity are striking and potentially clinically relevant. EVG broadly suppressed neuronal activity, including reduced spike frequency and amplitude, which may provide a cellular correlate of the neuropsychiatric adverse events occasionally reported in patients receiving EVG-containing regimens [43]. EVG has also been shown to alter spontaneous electrical activity in hiPSC-derived neurons, as measured by microelectrode array [44]. In contrast, BIC/TAF/FTC enhanced neuronal activity, particularly at low concentrations, increasing spike frequency and the fraction of active neurons. Although BIC exhibits relatively low CSF penetration [45], our data suggest that it may exert direct positive effects on neuronal excitability, possibly through modulation of voltage-gated ion channels or synaptic-vesicle release, thereby suggesting a potentially beneficial effect on cognitive function.
4.4. Additive effects of HIV and ART on Neuronal Dysfunction
Perhaps our most novel finding is that the combination of HIV infection and DTG shortened neuronal spike duration, an effect not observed with either condition alone. Action-potential duration is an important determinant of presynaptic calcium influx and neurotransmitter release and can thereby influence synaptic strength and plasticity [46,47]. Shortened spikes can reduce presynaptic calcium influx and diminish neurotransmitter release, potentially impairing network synchrony and information processing. The mechanism may involve HIV-associated inflammatory cytokines, including TNF-α and IL-1β, which can modify neuronal sodium and potassium currents, combined with direct effects of DTG on neuronal physiology [48,49]. Importantly, this effect occurred despite complete suppression of viral replication, consistent with evidence that neuroinflammation and HIV-associated CNS pathology can persist during suppressive ART [50]. This finding provides a potential mechanistic link between ART-treated HIV infection and persistent HAND.
The current findings provide a foundation for several important future applications. Future studies will expand this isogenic tri-culture model by incorporating additional CNS cell types, including oligodendrocytes, as well as neurovascular components such as pericytes and endothelial cells, to establish a functional blood–brain barrier [51,52]. The platform can also be adapted to microfluidic systems with dynamic flow conditions to more closely model physiological drug transport and distribution across the blood–brain barrier.
The model also provides a basis for testing diverse HIV strains, including patient-derived isolates, to improve translational relevance. The calcium-imaging findings can be extended using complementary electrophysiological approaches, including patch-clamp and multielectrode-array recordings, to characterize changes in neuronal excitability, network activity, and synaptic transmission more directly. Finally, although the present study used a single-donor hiPSC line, this platform can be expanded to assess interindividual variability and support more genetically diverse and generalizable conclusions.
5. Conclusions
The hiPSC-derived tri-culture platform is a robust, scalable, human-relevant model for neuroHIV research. It enables simultaneous assessment of HIV replication, ART efficacy, microglial health, and neuronal function. Our data reveal important differences between ART combinations, with BIC/TAF/FTC showing the most favorable profile for CNS safety. This platform is now ready for wider application in drug screening, mechanistic studies, and personalized medicine approaches to HAND, as well as for investigating mechanisms by which HIV-infected or HIV-latent microglia contribute to HAND, particularly under chronic ART and with or without addictive substances. These include studies of viral and host genetic, epigenetic, and transcriptional regulation; inflammatory, excitotoxic, and viral-factor–mediated neuronal injury; alterations in neuronal excitability, synaptic plasticity, synaptodendritic integrity, glial function, and neural circuit activity; and biomarkers or imaging markers of chronic HIV-associated neurological damage.
Author Contributions
Conceptualization, KLG, VRC, JHP, PMMcD, PPS, BLT; methodology, KLG, CGR, LMO, SG, LH, AS, RI ; formal analysis, KLG, CGR, LMO, AS; writing—original draft preparation, BLT, KLG, CGR; writing—review and editing, KLG, VRC, JHP, PMMcD, PPS, BLT; funding acquisition, VRC, JHP, PMMcD, PPS, BLT. All authors have read and agreed to the published version of the manuscript.
Funding
This research was funded by the National Institute of Mental Health (NIMH) SBIR Contract 75N95024C00035 and FastTrack Phase II SBIR R44MH135526; and National Institute on Drug Abuse (NIDA) Grant R01DA053801.
Data Availability Statement
The original contributions presented in this study are included in the article/supplementary material. Further inquiries can be directed to the corresponding author(s).
Conflicts of Interest
The authors declare no conflicts of interest.
Abbreviations
The following abbreviations are used in this manuscript:
HIV-associated neurocognitive disorders (HAND)
central nervous system (CNS)
human iPSC-derived (hiPSC)
integrase strand transfer inhibitor (INSTI)
elvitegravir/tenofovir disoproxil fumarate/emtricitabine (EVG/TDF/FTC)
dolutegravir/tenofovir disoproxil fumarate/emtricitabine (DTG/TDF/FTC)
bictegravir/tenofovir alafenamide/emtricitabine (BIC/TAF/FTC)
References
- Heaton, R. K.; Franklin, D. R.; Ellis, R. J.; McCutchan, J. A.; Letendre, S. L.; Leblanc, S.; Corkran, S. H.; Duarte, N. A.; Clifford, D. B.; Woods, S. P.; Collier, A. C.; Marra, C. M.; Morgello, S.; Mindt, M. R.; Taylor, M. J.; Marcotte, T. D.; Atkinson, J. H.; Wolfson, T.; Gelman, B. B.; McArthur, J. C.; Simpson, D. M.; Abramson, I.; Gamst, A.; Fennema-Notestine, C.; Jernigan, T. L.; Wong, J.; Grant, I. HIV-associated neurocognitive disorders before and during the era of combination antiretroviral therapy: differences in rates, nature, and predictors. J. Neurovirol 2011, 17, 3–16. [Google Scholar] [CrossRef] [PubMed]
- Saylor, D.; Dickens, A. M.; Sacktor, N.; Haughey, N.; Slusher, B.; Pletnikov, M.; Mankowski, J. L.; Brown, A.; Volsky, D. J.; McArthur, J. C. HIV-associated neurocognitive disorder--pathogenesis and prospects for treatment. Nat. Rev. Neurol. 2016, 12, 234–48. [Google Scholar] [CrossRef] [PubMed]
- Chan, P.; Valcour, V. Neurocognition and the Aging Brain in People With HIV: Implications for Screening. Top. Antivir. Med. 2022, 29, 423–429. [Google Scholar] [PubMed]
- Diaz, M. M. Update on neurological complications of HIV. Curr. Opin. HIV AIDS 2025, 20, 337–343. [Google Scholar] [CrossRef] [PubMed]
- Letendre, S. L.; Chen, H.; McKhann, A.; Roa, J.; Vecchio, A.; Daar, E. S.; Berzins, B.; Hunt, P. W.; Marra, C. M.; Campbell, T. B.; Coombs, R. W.; Ma, Q.; Swaminathan, S.; Macatangay, B. J. C.; Morse, G. D.; Miller, T.; Rusin, D.; Greninger, A. L.; Ha, B.; Alston-Smith, B.; Robertson, K.; Paul, R.; Spudich, S.; Team, A. S. Antiretroviral Therapy Intensification for Neurocognitive Impairment in Human Immunodeficiency Virus. Clin. Infect. Dis. 2023, 77, 866–874. [Google Scholar] [CrossRef] [PubMed]
- Alvarez-Carbonell, D.; Ye, F.; Ramanath, N.; Garcia-Mesa, Y.; Knapp, P. E.; Hauser, K. F.; Karn, J. Cross-talk between microglia and neurons regulates HIV latency. PLoS Pathog. 2019, 15, e1008249. [Google Scholar] [CrossRef] [PubMed]
- Williams, M. E.; Muvenda, T.; Mugwena, V.; Zulu, S. S. Neuroinflammatory and Neurodegenerative Roles of HIV-1 Tat: A Review of Recent Evidence. Adv. Exp. Med. Biol. 2026, 1507, 87–108. [Google Scholar] [CrossRef] [PubMed]
- Yokote, H.; Kobayashi, T.; Miura, Y. [HIV-Associated Neurocognitive Disorders (HAND)]. Brain Nerve 2026, 78, 519–522. [Google Scholar] [PubMed]
- Gagliardi, S.; Hotchkin, T.; Hillmer, G.; Engelbride, M.; Diggs, A.; Tibebe, H.; Izumi, C.; Sullivan, C.; Cropp, C.; Lantz, O.; Marquez, D.; Chang, J.; Ezaki, J.; Zestos, A. G.; Riley, A. L.; Izumi, T. Oxidative Stress in HIV-Associated Neurodegeneration: Mechanisms of Pathogenesis and Therapeutic Targets. Int. J. Mol. Sci. 2025, 26. [Google Scholar] [CrossRef] [PubMed]
- Jia, F. F.; Brew, B. J. Neuropathogenesis of acute HIV: mechanisms, biomarkers, and therapeutic approaches. Curr. Opin. HIV AIDS 2025, 20, 199–208. [Google Scholar] [CrossRef] [PubMed]
- Bai, R.; Song, C.; Lv, S.; Chang, L.; Hua, W.; Weng, W.; Wu, H.; Dai, L. Role of microglia in HIV-1 infection. AIDS Res. Ther. 2023, 20, 16. [Google Scholar] [CrossRef] [PubMed]
- Nuhn, M. M.; Gumbs, S. B. H.; Schipper, P. J.; Drosou, I.; Gharu, L.; Buchholtz, N.; Snijders, G.; Gigase, F. A. J.; Wensing, A. M. J.; Symons, J.; de Witte, L. D.; Nijhuis, M. Microglia Exhibit a Unique Intact HIV Reservoir in Human Postmortem Brain Tissue. Viruses 2025, 17. [Google Scholar] [CrossRef] [PubMed]
- Borrajo, A.; Spuch, C.; Penedo, M. A.; Olivares, J. M.; Agis-Balboa, R. C. Important role of microglia in HIV-1 associated neurocognitive disorders and the molecular pathways implicated in its pathogenesis. Ann. Med. 2021, 53, 43–69. [Google Scholar] [CrossRef] [PubMed]
- Matthew, Y.; Foley, N.; Claiborne, D. T.; Klase, Z.; Dick, A. Latent HIV Reservoirs in the Central Nervous System: Mechanisms, Barriers, and Therapeutic Approaches. ACS Infect. Dis. 2026, 12, 1233–1253. [Google Scholar] [CrossRef] [PubMed]
- Thaney, V. E.; Kaul, M. Type I Interferons in NeuroHIV. Viral Immunol. 2019, 32, 7–14. [Google Scholar] [CrossRef] [PubMed]
- Li, W.; Li, G.; Steiner, J.; Nath, A. Role of Tat protein in HIV neuropathogenesis. Neurotox. Res. 2009, 16, 205–20. [Google Scholar] [CrossRef] [PubMed]
- Fox, H. S.; Gendelman, H. E. Commentary: Animal models of neuroAIDS. J. Neuroimmune Pharmacol. 2012, 7, 301–5. [Google Scholar] [CrossRef] [PubMed]
- Waight, E.; Zhang, C.; Mathews, S.; Kevadiya, B. D.; Lloyd, K. C. K.; Gendelman, H. E.; Gorantla, S.; Poluektova, L. Y.; Dash, P. K. Animal models for studies of HIV-1 brain reservoirs. J. Leukoc. Biol. 2022, 112, 1285–1295. [Google Scholar] [CrossRef] [PubMed]
- Winkler, J. M.; Chaudhuri, A. D.; Fox, H. S. Translating the brain transcriptome in neuroAIDS: from non-human primates to humans. J. Neuroimmune Pharmacol. 2012, 7, 372–9. [Google Scholar] [CrossRef] [PubMed]
- Byrnes, S. J.; Angelovich, T. A.; Busman-Sahay, K.; Cochrane, C. R.; Roche, M.; Estes, J. D.; Churchill, M. J. Non-Human Primate Models of HIV Brain Infection and Cognitive Disorders. Viruses 2022, 14. [Google Scholar] [CrossRef] [PubMed]
- Lawrence, J. M.; Dampier, W.; Mell, J. C.; De Souza, D. R.; Schardien, K.; Yeakle, K.; Barnett, R. J.; Sen, B.; Ahmed, A.; Bouchard, M.; Wigdahl, B.; Nonnemacher, M. R. Inflammatory microglia signals drive A1-like polarization of astrocytes even in the presence of HIV-1 Tat. Mol. Neurobiol. 2025, 63, 251. [Google Scholar] [CrossRef] [PubMed]
- Badley, J. R.; Bhusal, A.; Lein, P. J. A primary rat neuron-astrocyte-microglia tri-culture model for studying mechanisms of neurotoxicity. Front Toxicol. 2024, 6, 1523387. [Google Scholar] [CrossRef] [PubMed]
- Boroczky, C.; Paszternak, A.; Laufer, R.; Tarnoczi, K.; Sikur, N.; Bagamery, F.; Szoko, E.; Varga, K.; Tabi, T. Neuroinflammation Based Neurodegenerative In Vitro Model of SH-SY5Y Cells-Differential Effects on Oxidative Stress and Insulin Resistance Relevant to Alzheimer's Pathology. Int. J. Mol. Sci. 2025, 26. [Google Scholar] [CrossRef] [PubMed]
- Almeida, N.; Acors, S.; Cox, D.; Kouphou, N.; Fotopoulos, L.; Williams, T.; Otto, P. A.; Kim, E. Y.; Wolinsky, S. M.; Danovi, D.; Vigilante, A.; Malim, M. H.; Apolonia, L. Generation and characterization of iPSC models from HIV-1-positive individuals with divergent clinical outcomes. Stem Cell Rep. 2026, 21, 102786. [Google Scholar] [CrossRef] [PubMed]
- Zhao, A. V.; Crutchley, R. D.; Guduru, R. C.; Ton, K.; Lam, T.; Min, A. C. A clinical review of HIV integrase strand transfer inhibitors (INSTIs) for the prevention and treatment of HIV-1 infection. Retrovirology 2022, 19, 22. [Google Scholar] [CrossRef] [PubMed]
- Sewell, F.; Corvaro, M.; Andrus, A.; Burke, J.; Daston, G.; Delaney, B.; Domoradzki, J.; Forlini, C.; Green, M. L.; Hofmann, T.; Jackel, S.; Lee, M. S.; Temerowski, M.; Whalley, P.; Lewis, R. Recommendations on dose level selection for repeat dose toxicity studies. Arch. Toxicol. 2022, 96, 1921–1934. [Google Scholar] [CrossRef] [PubMed]
- Henneberger, L.; Huchthausen, J.; Wojtysiak, N.; Escher, B. I. Quantitative In Vitro-to-In Vivo Extrapolation: Nominal versus Freely Dissolved Concentration. Chem. Res. Toxicol. 2021, 34, 1175–1182. [Google Scholar] [CrossRef] [PubMed]
- Kolli, A. R. Deriving protein binding-corrected chemical concentrations for in vitro testing. Clin. Transl. Sci. 2023, 16, 2123–2129. [Google Scholar] [CrossRef] [PubMed]
- Podany, A. T.; Bares, S. H.; Havens, J.; Dyavar, S. R.; O'Neill, J.; Lee, S.; Fletcher, C. V.; Swindells, S.; Scarsi, K. K. Plasma and intracellular pharmacokinetics of tenofovir in patients switched from tenofovir disoproxil fumarate to tenofovir alafenamide. AIDS 2018, 32, 761–765. [Google Scholar] [CrossRef] [PubMed]
- Hoffmann, C.; Welz, T.; Sabranski, M.; Kolb, M.; Wolf, E.; Stellbrink, H. J.; Wyen, C. Higher rates of neuropsychiatric adverse events leading to dolutegravir discontinuation in women and older patients. HIV Med. 2017, 18, 56–63. [Google Scholar] [CrossRef] [PubMed]
- Lu, C. H.; Bednarczyk, E. M.; Catanzaro, L. M.; Shon, A.; Xu, J. C.; Ma, Q. Pharmacokinetic drug interactions of integrase strand transfer inhibitors. Curr. Res. Pharmacol. Drug Discov. 2021, 2, 100044. [Google Scholar] [CrossRef] [PubMed]
- Podany, A. T.; Scarsi, K. K.; Pham, M. M.; Fletcher, C. V. Comparative Clinical Pharmacokinetics and Pharmacodynamics of HIV-1 Integrase Strand Transfer Inhibitors: An Updated Review. Clin. Pharmacokinet. 2020, 59, 1085–1107. [Google Scholar] [CrossRef] [PubMed]
- Miller, D. S. Regulation of P-glycoprotein and other ABC drug transporters at the blood-brain barrier. Trends Pharmacol. Sci. 2010, 31, 246–54. [Google Scholar] [CrossRef] [PubMed]
- Osborne, O.; Peyravian, N.; Nair, M.; Daunert, S.; Toborek, M. The Paradox of HIV Blood-Brain Barrier Penetrance and Antiretroviral Drug Delivery Deficiencies. Trends Neurosci. 2020, 43, 695–708. [Google Scholar] [CrossRef] [PubMed]
- Hoffmann, C.; Llibre, J. M. Neuropsychiatric Adverse Events with Dolutegravir and Other Integrase Strand Transfer Inhibitors. AIDS Rev. 2019, 21, 4–10. [Google Scholar] [CrossRef] [PubMed]
- Penafiel, J.; de Lazzari, E.; Padilla, M.; Rojas, J.; Gonzalez-Cordon, A.; Blanco, J. L.; Blanch, J.; Marcos, M. A.; Lonca, M.; Martinez-Rebollar, M.; Laguno, M.; Tricas, A.; Rodriguez, A.; Mallolas, J.; Gatell, J. M.; Martinez, E. Tolerability of integrase inhibitors in a real-life setting. J. Antimicrob. Chemother. 2017, 72, 1752–1759. [Google Scholar] [CrossRef] [PubMed]
- Fettiplace, A.; Stainsby, C.; Winston, A.; Givens, N.; Puccini, S.; Vannappagari, V.; Hsu, R.; Fusco, J.; Quercia, R.; Aboud, M.; Curtis, L. Psychiatric Symptoms in Patients Receiving Dolutegravir. J. Acquir Immune Defic. Syndr. 2017, 74, 423–431. [Google Scholar] [CrossRef] [PubMed]
- George, J. W.; Mattingly, J. E.; Roland, N. J.; Small, C. M.; Lamberty, B. G.; Fox, H. S.; Stauch, K. L. Physiologically Relevant Concentrations of Dolutegravir, Emtricitabine, and Efavirenz Induce Distinct Metabolic Alterations in HeLa Epithelial and BV2 Microglial Cells. Front Immunol. 2021, 12, 639378. [Google Scholar] [CrossRef] [PubMed]
- Kaur, H.; Minchella, P.; Alvarez-Carbonell, D.; Purandare, N.; Nagampalli, V. K.; Blankenberg, D.; Hulgan, T.; Gerschenson, M.; Karn, J.; Aras, S.; Kallianpur, A. R. Contemporary Antiretroviral Therapy Dysregulates Iron Transport and Augments Mitochondrial Dysfunction in HIV-Infected Human Microglia and Neural-Lineage Cells. Int. J. Mol. Sci. 2023, 24. [Google Scholar] [CrossRef] [PubMed]
- Woodburn, S. C.; Bollinger, J. L.; Wohleb, E. S. The semantics of microglia activation: neuroinflammation, homeostasis, and stress. J. Neuroinflammation 2021, 18, 258. [Google Scholar] [CrossRef] [PubMed]
- Adrian, M.; Weber, M.; Tsai, M. C.; Glock, C.; Kahn, O. I.; Phu, L.; Cheung, T. K.; Meilandt, W. J.; Rose, C. M.; Hoogenraad, C. C. Polarized microtubule remodeling transforms the morphology of reactive microglia and drives cytokine release. Nat. Commun. 2023, 14, 6322. [Google Scholar] [CrossRef] [PubMed]
- Monnerie, H.; Romer, M.; Roth, L. M.; Long, C.; Millar, J. S.; Jordan-Sciutto, K. L.; Grinspan, J. B. Inhibition of lipid synthesis by the HIV integrase strand transfer inhibitor elvitegravir in primary rat oligodendrocyte cultures. Front Mol. Neurosci. 2023, 16, 1323431. [Google Scholar] [CrossRef] [PubMed]
- Lepik, K. J.; Yip, B.; Ulloa, A. C.; Wang, L.; Toy, J.; Akagi, L.; Lima, V. D.; Guillemi, S.; Montaner, J. S. G.; Barrios, R. Adverse drug reactions to integrase strand transfer inhibitors. AIDS 2018, 32, 903–912. [Google Scholar] [CrossRef] [PubMed]
- Starr, A.; Nickoloff-Bybel, E.; Abedalthaqafi, R.; Albloushi, N.; Jordan-Sciutto, K. L. Human iPSC-derived neurons reveal NMDAR-independent dysfunction following HIV-associated insults. Front Mol. Neurosci. 2023, 16, 1353562. [Google Scholar] [CrossRef] [PubMed]
- Gele, T.; Cheret, A.; Castro Gordon, A.; Nkam, L.; Furlan, V.; Pallier, C.; Becker, P. H.; Catalan, P.; Goujard, C.; Taburet, A. M.; Gasnault, J.; Gouget, H.; Barrail-Tran, A. Cerebrospinal fluid exposure to bictegravir/emtricitabine/tenofovir in HIV-1-infected patients with CNS impairment. J. Antimicrob. Chemother. 2021, 76, 3280–3285. [Google Scholar] [CrossRef] [PubMed]
- Sabatini, B. L.; Regehr, W. G. Control of neurotransmitter release by presynaptic waveform at the granule cell to Purkinje cell synapse. J. Neurosci. 1997, 17, 3425–35. [Google Scholar] [CrossRef] [PubMed]
- Qian, J.; Saggau, P. Activity-dependent modulation of K+ currents at presynaptic terminals of mammalian central synapses. J. Physiol. 1999, 519, 427–37. [Google Scholar] [CrossRef] [PubMed]
- Diem, R.; Hobom, M.; Grotsch, P.; Kramer, B.; Bahr, M. Interleukin-1 beta protects neurons via the interleukin-1 (IL-1) receptor-mediated Akt pathway and by IL-1 receptor-independent decrease of transmembrane currents in vivo. Mol. Cell Neurosci. 2003, 22, 487–500. [Google Scholar] [CrossRef] [PubMed]
- Vezzani, A.; Viviani, B. Neuromodulatory properties of inflammatory cytokines and their impact on neuronal excitability. Neuropharmacology 2015, 96, 70–82. [Google Scholar] [CrossRef] [PubMed]
- Byrnes, S. J.; Jamal Eddine, J.; Zhou, J.; Chalmers, E.; Wanicek, E.; Osman, N.; Jenkins, T. A.; Roche, M.; Brew, B. J.; Estes, J. D.; Angelovich, T. A.; Churchill, M. J. Neuroinflammation associated with proviral DNA persists in the brain of virally suppressed people with HIV. Front Immunol. 2025, 16, 1570692. [Google Scholar] [CrossRef] [PubMed]
- Vatine, G. D.; Barrile, R.; Workman, M. J.; Sances, S.; Barriga, B. K.; Rahnama, M.; Barthakur, S.; Kasendra, M.; Lucchesi, C.; Kerns, J.; Wen, N.; Spivia, W. R.; Chen, Z.; Van Eyk, J.; Svendsen, C. N. Human iPSC-Derived Blood-Brain Barrier Chips Enable Disease Modeling and Personalized Medicine Applications. Cell Stem Cell 2019, 24, 995–1005 e6. [Google Scholar] [CrossRef] [PubMed]
- Stone, N. L.; England, T. J.; O'Sullivan, S. E. A Novel Transwell Blood Brain Barrier Model Using Primary Human Cells. Front Cell Neurosci. 2019, 13, 230. [Google Scholar] [CrossRef] [PubMed]
Figure 1.
Immunofluorescence image of the hiPSC-Triculture Platform. The culture was fixed and tested for biomarkers TUBB3 (neurons), GFAP (astrocytes) and IBA1 (microglia) at the end of the experiment (Day in vitro 32). Nuclei are stained with Hoechst. Shown are representative (A) single images and (B) composite image. Scale bar = 100μm.
Figure 1.
Immunofluorescence image of the hiPSC-Triculture Platform. The culture was fixed and tested for biomarkers TUBB3 (neurons), GFAP (astrocytes) and IBA1 (microglia) at the end of the experiment (Day in vitro 32). Nuclei are stained with Hoechst. Shown are representative (A) single images and (B) composite image. Scale bar = 100μm.
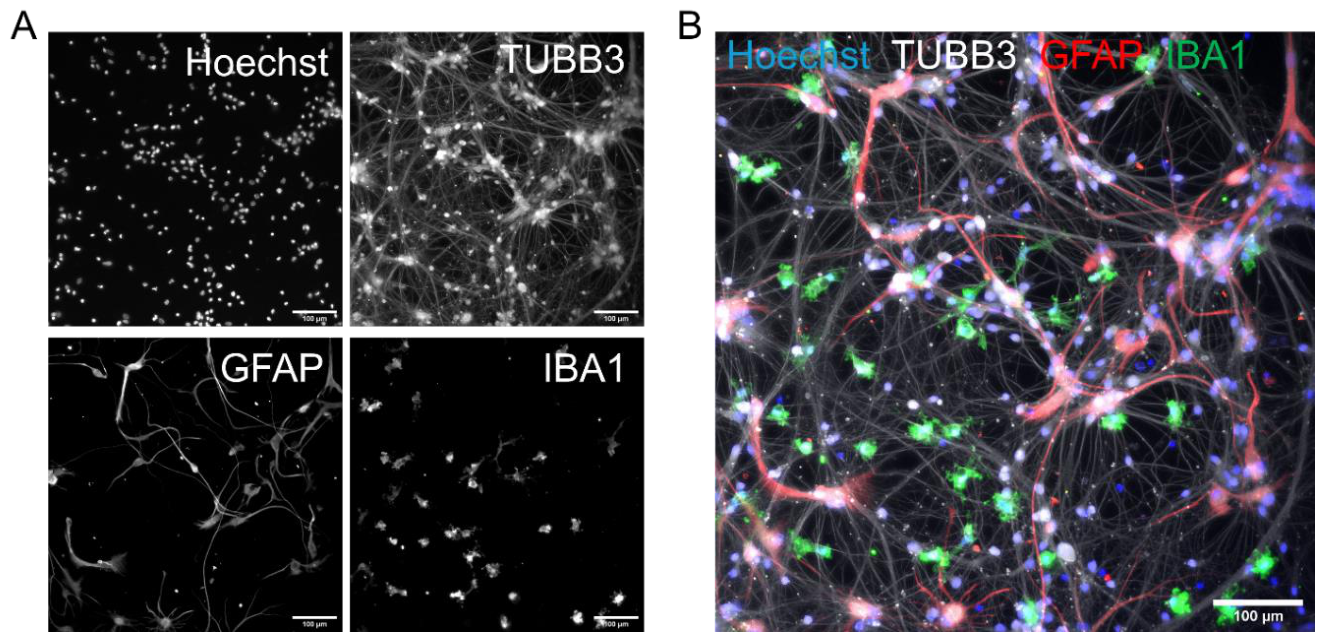
Figure 2.
HIV-infected tri-cultures were tested for biomarkers TUBB3 (neurons), and IBA1 (microglia) at the end of the experiment. HIV is represented by GFP-expression and nuclei are stained with Hoechst (biomarker staining of the astrocytes was not performed in this experiment). Shown are representative (A) single images and (B) composite image. Scale bar = 100μm. Only IBA1-positive cells show GFP expression indicating that neurons are not infected with HIV. A).
Figure 2.
HIV-infected tri-cultures were tested for biomarkers TUBB3 (neurons), and IBA1 (microglia) at the end of the experiment. HIV is represented by GFP-expression and nuclei are stained with Hoechst (biomarker staining of the astrocytes was not performed in this experiment). Shown are representative (A) single images and (B) composite image. Scale bar = 100μm. Only IBA1-positive cells show GFP expression indicating that neurons are not infected with HIV. A).
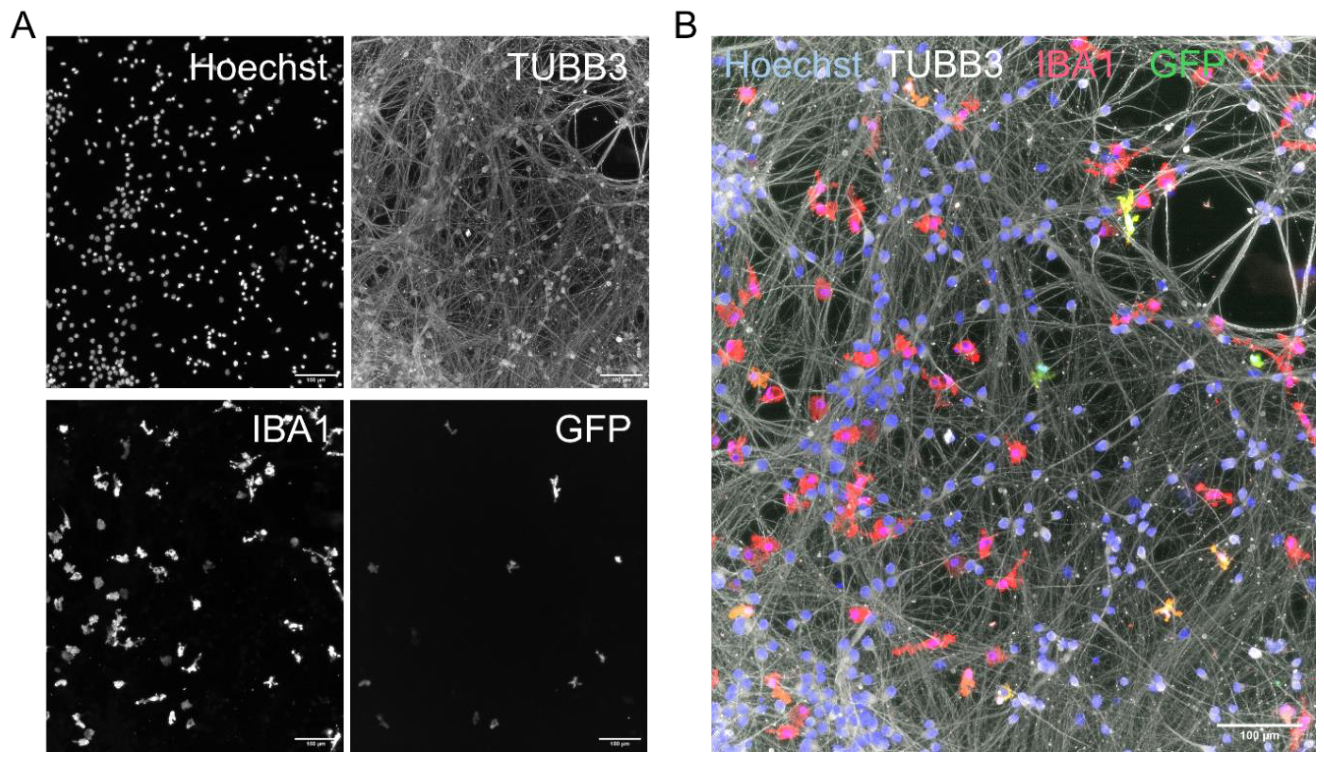
Figure 3.
HIV replication can be tracked in hiPSC-NeuroHIV tri-culture system. (A) Images from Day Post Infection (DPI) 1, 7, and14 of tri-culture infected with 1:250 dilution of GFP-HIV-AD8 or mock infection (No HIV) to demonstrate spread of HIV infection over time. (B) At DPI 14, cultures were fixed and labeled for neurons (TUBB3), microglia (IBA1), and nuclei (Hoechst). GFP+ microglia are still visible after fixation. (C) Shows the count of GFP+ microglia at each day of imaging in the tri-culture. Each day on the plot shows mean ± SD of N=6. Statistical analysis was used to compare the means of HIV infected cells with the means of non-infected cells, using two-way ANOVA followed by Sidak’s multiple comparisons test (**p<0.01, ****p<0.0001).
Figure 3.
HIV replication can be tracked in hiPSC-NeuroHIV tri-culture system. (A) Images from Day Post Infection (DPI) 1, 7, and14 of tri-culture infected with 1:250 dilution of GFP-HIV-AD8 or mock infection (No HIV) to demonstrate spread of HIV infection over time. (B) At DPI 14, cultures were fixed and labeled for neurons (TUBB3), microglia (IBA1), and nuclei (Hoechst). GFP+ microglia are still visible after fixation. (C) Shows the count of GFP+ microglia at each day of imaging in the tri-culture. Each day on the plot shows mean ± SD of N=6. Statistical analysis was used to compare the means of HIV infected cells with the means of non-infected cells, using two-way ANOVA followed by Sidak’s multiple comparisons test (**p<0.01, ****p<0.0001).
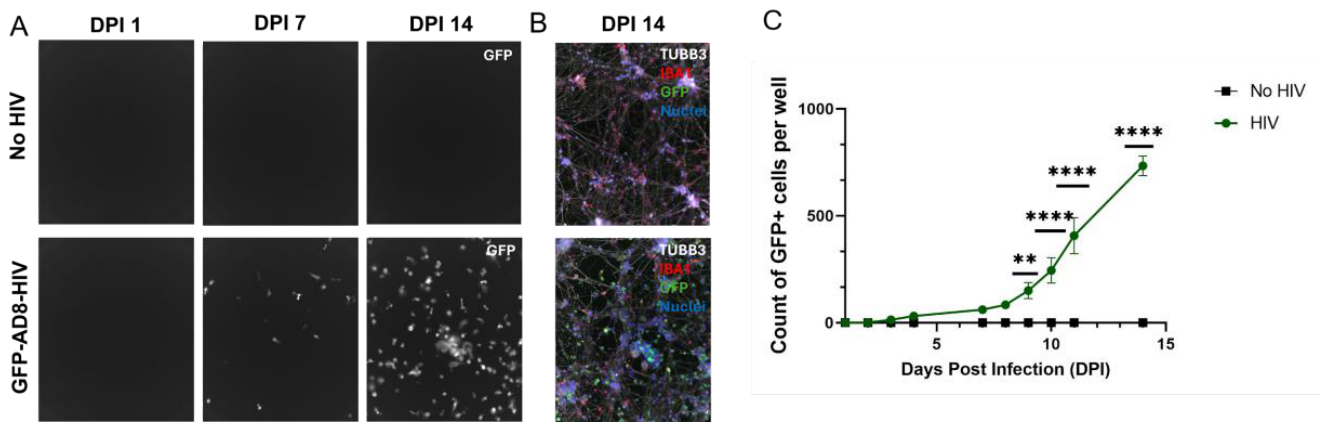
Figure 4.
ARV combinations inhibit HIV replication in hiPSC-NeuroHIV tri-culture. Count of GFP+ microglia was quantified over the experiment time course and plotted to show viral replication in microglia after treatment with DTG/TDF/FTC (A), EVG/TDF/FTC (B), or BIC/TAF/FTC (C). Plotted as mean ± SD of count per well from N=6 wells. Statistical analysis was used to compare the means of HIV infected cells with the means of 1XCmax treated HIV infected cells using two-way ANOVA followed by Sidak’s multiple comparisons test. (*p<0.05, **p<0.01, ***p<0.001, ****p<0.0001). DTG; Dolutegravir, TDF; Tenofovir Disoproxil Fumarate, FTC; Emtricitabine, EVG; Elvitegravir, TAF; Tenofovir Alafenamide, BIC; Bictegravir.
Figure 4.
ARV combinations inhibit HIV replication in hiPSC-NeuroHIV tri-culture. Count of GFP+ microglia was quantified over the experiment time course and plotted to show viral replication in microglia after treatment with DTG/TDF/FTC (A), EVG/TDF/FTC (B), or BIC/TAF/FTC (C). Plotted as mean ± SD of count per well from N=6 wells. Statistical analysis was used to compare the means of HIV infected cells with the means of 1XCmax treated HIV infected cells using two-way ANOVA followed by Sidak’s multiple comparisons test. (*p<0.05, **p<0.01, ***p<0.001, ****p<0.0001). DTG; Dolutegravir, TDF; Tenofovir Disoproxil Fumarate, FTC; Emtricitabine, EVG; Elvitegravir, TAF; Tenofovir Alafenamide, BIC; Bictegravir.
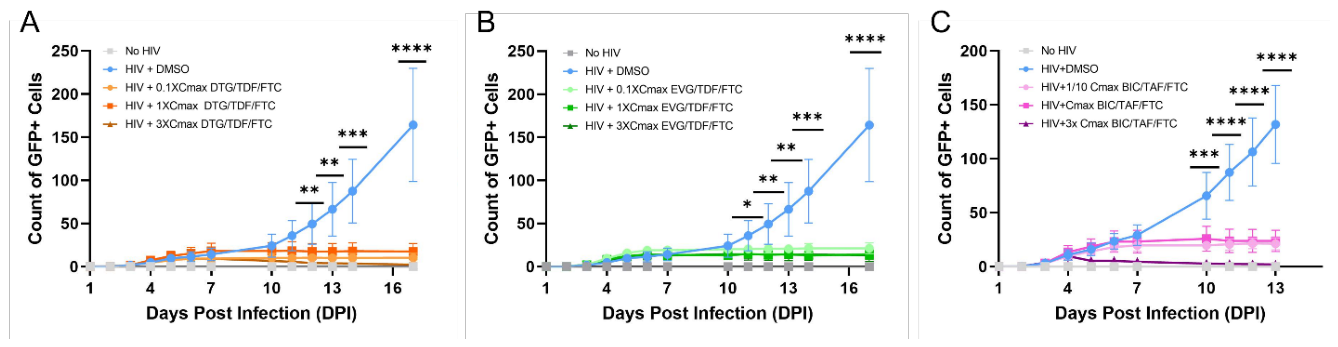
Figure 5.
HIV-infection reduces survival of microglial cells in tri-cultures. Fixed images of microglia labeled with IBA1, neurons labeled with TUBB3, and all nuclei labeled with Hoechst were used to quantify the total cells, the neurons and astrocytes (IBA1negative nuclei), and the microglia (IBA1+ nuclei) remaining on Experiment D28. Data are shown as means ± SD of N=6 wells. Statistical analysis was performed using one-way ANOVA with Dunnet’s post-hoc test. DTG; Dolutegravir, TDF; Tenofovir Disoproxil Fumarate, FTC; Emtricitabine, EVG; Elvitegravir (**p<0.01, ***p<0.001, ****p<0.0001).
Figure 5.
HIV-infection reduces survival of microglial cells in tri-cultures. Fixed images of microglia labeled with IBA1, neurons labeled with TUBB3, and all nuclei labeled with Hoechst were used to quantify the total cells, the neurons and astrocytes (IBA1negative nuclei), and the microglia (IBA1+ nuclei) remaining on Experiment D28. Data are shown as means ± SD of N=6 wells. Statistical analysis was performed using one-way ANOVA with Dunnet’s post-hoc test. DTG; Dolutegravir, TDF; Tenofovir Disoproxil Fumarate, FTC; Emtricitabine, EVG; Elvitegravir (**p<0.01, ***p<0.001, ****p<0.0001).
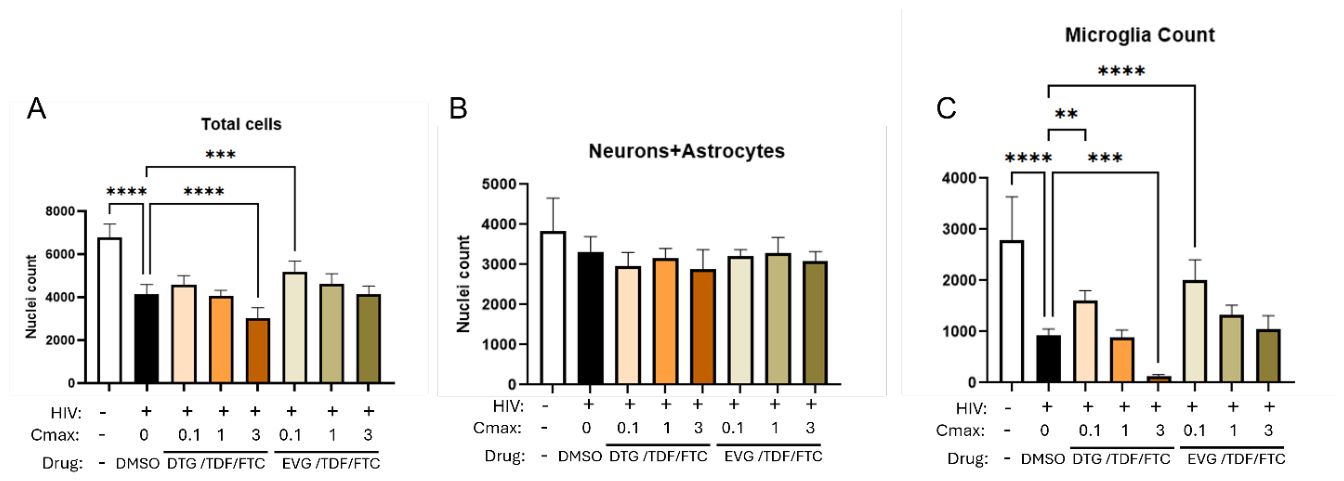
Figure 6.
Measuring microglia morphology changes after ARV treatment of Tri-cultures. IBA1 (grey) images are shown for DMSO control and treatment with (A) DTG or (B) DTG/TDF/FTC at 0.1X Cmax, 1X Cmax, and 3X Cmax for 7 days. DTG; Dolutegravir, TDF; Tenofovir Disoproxil Fumarate, FTC; Emtricitabine. Scalebar: 100µm.
Figure 6.
Measuring microglia morphology changes after ARV treatment of Tri-cultures. IBA1 (grey) images are shown for DMSO control and treatment with (A) DTG or (B) DTG/TDF/FTC at 0.1X Cmax, 1X Cmax, and 3X Cmax for 7 days. DTG; Dolutegravir, TDF; Tenofovir Disoproxil Fumarate, FTC; Emtricitabine. Scalebar: 100µm.
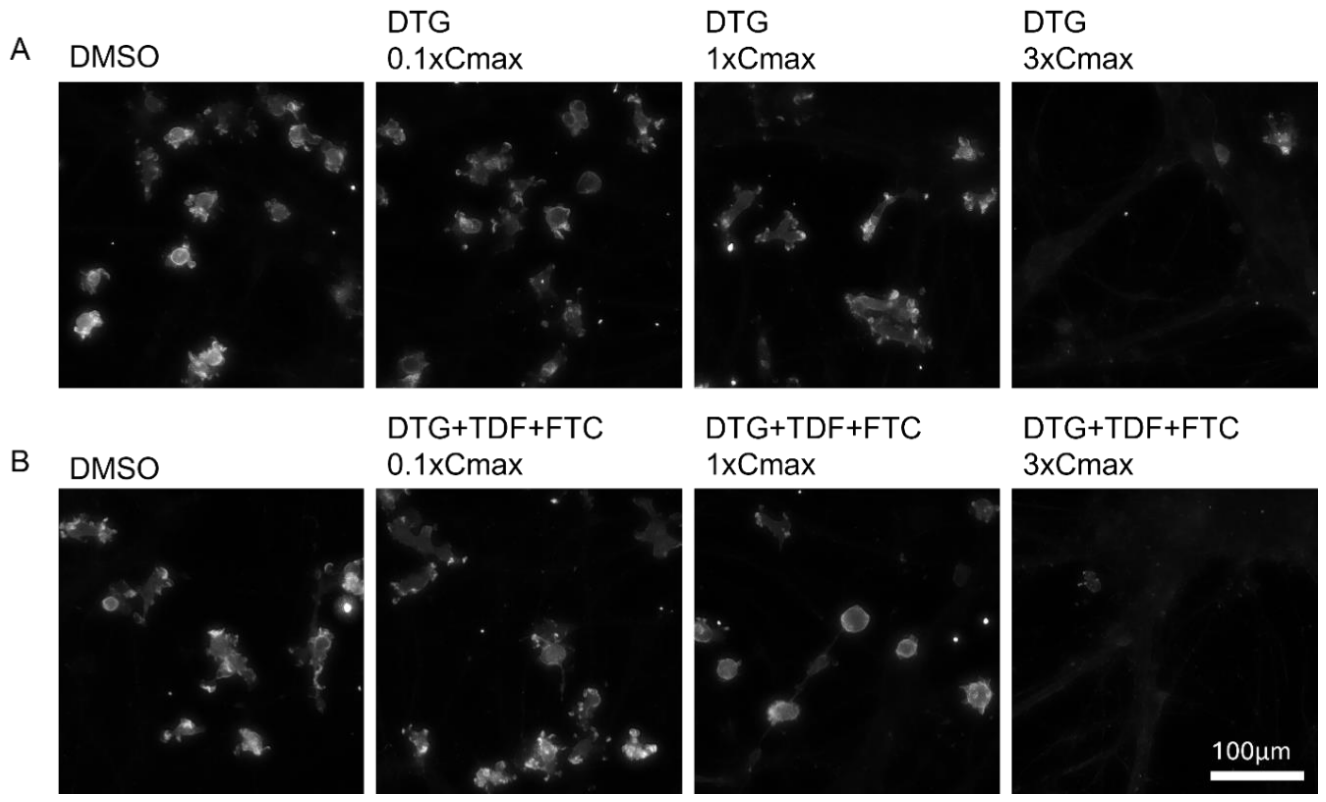
Figure 8.
HIV-infection alters morphology of microglial cells in tri-cultures. Fixed images of microglia labeled with IBA1, neurons labeled with TUBB3, and all nuclei labeled with Hoechst were used to quantify the total cells, the neurons and astrocytes (IBA1- nuclei), and the microglia (IBA1+ nuclei) remaining on Experiment D28. Measurements of microglia morphology are shown for each treatment condition as either infected (IBA+, GFP+) or non-infected (IBA+, GFP-) microglia. Data are shown as means ± SD of N=6 wells. Statistical analysis was performed using two-way ANOVA with Sidak’s multiple-comparisons test (*p<0.05, **p<0.01, ***p<0.001, ****p<0.0001).
Figure 8.
HIV-infection alters morphology of microglial cells in tri-cultures. Fixed images of microglia labeled with IBA1, neurons labeled with TUBB3, and all nuclei labeled with Hoechst were used to quantify the total cells, the neurons and astrocytes (IBA1- nuclei), and the microglia (IBA1+ nuclei) remaining on Experiment D28. Measurements of microglia morphology are shown for each treatment condition as either infected (IBA+, GFP+) or non-infected (IBA+, GFP-) microglia. Data are shown as means ± SD of N=6 wells. Statistical analysis was performed using two-way ANOVA with Sidak’s multiple-comparisons test (*p<0.05, **p<0.01, ***p<0.001, ****p<0.0001).
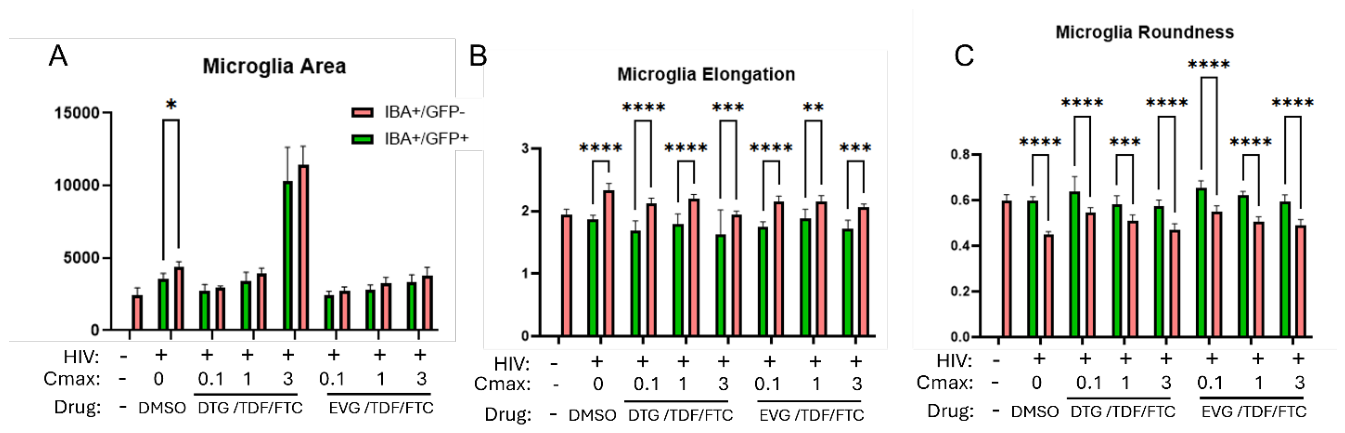
Figure 9.
Combination ARVs show altered calcium activity of neurons in tri-cultures. Combination ARVs (EVG/TDF/FTC, DTG/TDF/FTC or BIC/TAF/FTC) or control (DMSO) were added to tri-cultures of neurons, astrocytes and microglia for 7 days at 0.1x Cmax, Cmax. 3x Cmax and 10µM. Data are shown as means ± SD of N=6 wells. Statistical analysis was performed using one-way ANOVA with Dunnet’s post-hoc test (*p<0.05, **p<0.01, ***p<0.001, ****p<0.0001). DTG; Dolutegravir, TDF; Tenofovir Disoproxil Fumarate, FTC; Emtricitabine, TAF; Tenofovir Alafenamide, BIC; Bictegravir.
Figure 9.
Combination ARVs show altered calcium activity of neurons in tri-cultures. Combination ARVs (EVG/TDF/FTC, DTG/TDF/FTC or BIC/TAF/FTC) or control (DMSO) were added to tri-cultures of neurons, astrocytes and microglia for 7 days at 0.1x Cmax, Cmax. 3x Cmax and 10µM. Data are shown as means ± SD of N=6 wells. Statistical analysis was performed using one-way ANOVA with Dunnet’s post-hoc test (*p<0.05, **p<0.01, ***p<0.001, ****p<0.0001). DTG; Dolutegravir, TDF; Tenofovir Disoproxil Fumarate, FTC; Emtricitabine, TAF; Tenofovir Alafenamide, BIC; Bictegravir.
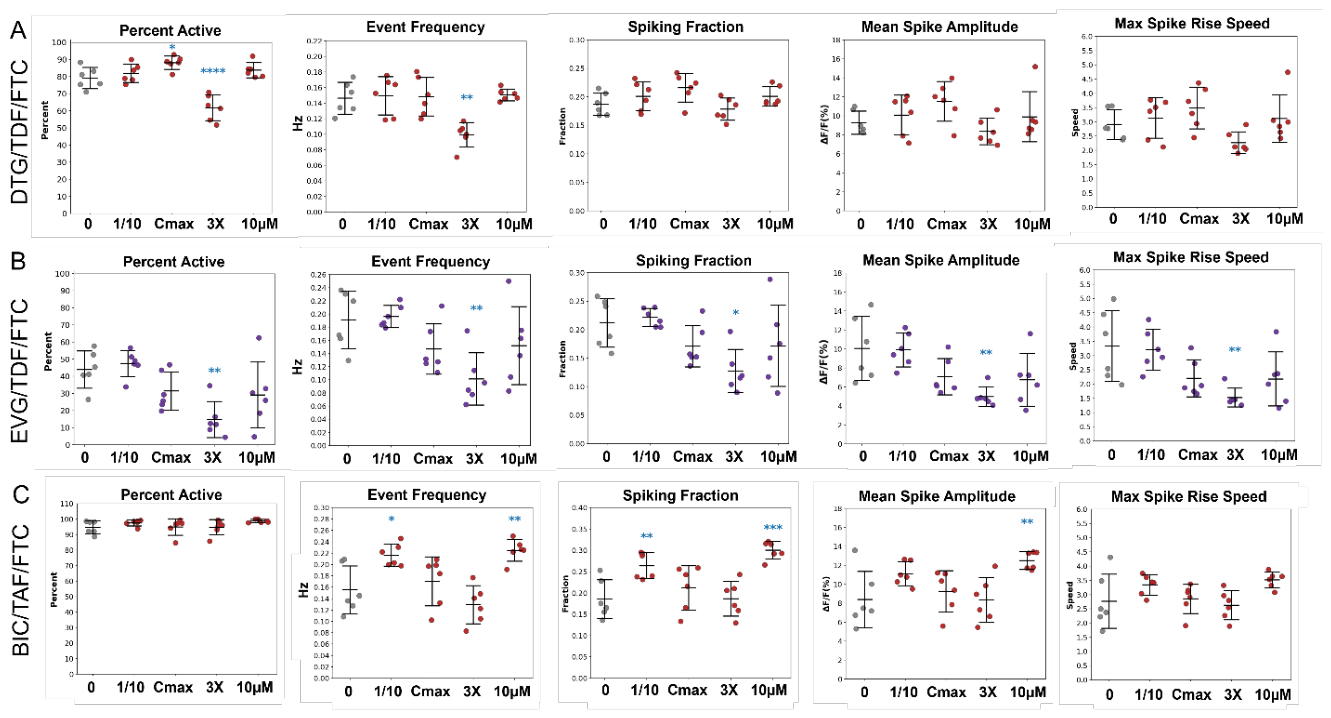
Figure 10.
HIV replication can be detected in the tri-culture and HIV+DTG shortens neuronal spike duration. Experimental timelines is shown in (A) with two treatment timelines (DTG added at DPI 1 and DPI 4). (B) Count of GFP+ microglia was assessed from imaging the plate throughout the experimental time course for each condition. Plotted as mean ± SD of GFP+ count per well from N=6 wells. Statistics were performed between HIV + DMSO and HIV + DTG DPI1 using two-way ANOVA followed by Sidak’s multiple comparisons test. (*p<0.05, **p<0.01, ***p<0.001, ****p<0.0001). (C) Plots of several neuron calcium measurements are shown after microglia were excluded from the analysis. Data are from the cells treated with DTG on DPI 1. Bar plots show average value from each well +SD. N=6. Statical significance was determined using two-way ANOVA followed by Sidak’s multiple comparisons test.
Figure 10.
HIV replication can be detected in the tri-culture and HIV+DTG shortens neuronal spike duration. Experimental timelines is shown in (A) with two treatment timelines (DTG added at DPI 1 and DPI 4). (B) Count of GFP+ microglia was assessed from imaging the plate throughout the experimental time course for each condition. Plotted as mean ± SD of GFP+ count per well from N=6 wells. Statistics were performed between HIV + DMSO and HIV + DTG DPI1 using two-way ANOVA followed by Sidak’s multiple comparisons test. (*p<0.05, **p<0.01, ***p<0.001, ****p<0.0001). (C) Plots of several neuron calcium measurements are shown after microglia were excluded from the analysis. Data are from the cells treated with DTG on DPI 1. Bar plots show average value from each well +SD. N=6. Statical significance was determined using two-way ANOVA followed by Sidak’s multiple comparisons test.
Disclaimer/Publisher’s Note: The statements, opinions and data contained in all publications are solely those of the individual author(s) and contributor(s) and not of MDPI and/or the editor(s). MDPI and/or the editor(s) disclaim responsibility for any injury to people or property resulting from any ideas, methods, instructions or products referred to in the content. |
© 2026 by the authors. Licensee MDPI, Basel, Switzerland. This article is an open access article distributed under the terms and conditions of the Creative Commons Attribution (CC BY) license (http://creativecommons.org/licenses/by/4.0/).
Copyright: This open access article is published under a Creative Commons CC BY 4.0 license, which permit the free download, distribution, and reuse, provided that the author and preprint are cited in any reuse.