

Submitted:
12 August 2026
Posted:
14 August 2026
Read the latest preprint version here
Abstract
Virtual patients need a useful coordinate system before they can model patient-specific dynamics. Most models in AI for science operate at molecular, cellular, or organ-specific scales. However, treatment decisions are made across a whole person and across different forms of intervention. Here, we use drug repurposing as a human-scale testbed for a central virtual-patient question: can a structured representation of biological directions organize intervention-relevant knowledge well enough to prioritize known drug-disease relationships?We introduce SteeraMed Bench, a framework for evaluating module panels built from a 332-module atlas. The atlas combines extended aging hallmarks, traditional Chinese medicine syndrome proxies, nutraceutical targets, and food-as-medicine targets. Rather than assuming that all modules should form one universal model, the framework compares panels as alternative representations for each disease task. Across 1,916 DrugBank small molecules, five chronic disease tasks, and an exploratory extension to 23 disease categories, the panels carried useful within-benchmark ranking signal. The nutraceutical and nutraceutical-extension panel (NUT+NUTX, 117 modules) achieved a mean recall@20 of 0.494 across five diseases, close to 0.524 for the full atlas. The full atlas was the strictly highest observed configuration in only 9 of 23 disease categories. Different panels were most useful for different tasks, including extended aging hallmarks for type 2 diabetes and osteoporosis, food-as-medicine for depression, and nutraceutical modules for the atherosclerosis/hyperlipidemia task.The framework also evaluates newly proposed gene sets for incremental value and redundancy. In an exploratory LLM-assisted workflow, two refined candidates showed nominal positive increments, but neither remained significant after correction for multiple testing. Performance decreased under target-family-separated evaluation and approached chance in leave-one-disease-out evaluation. SteeraMed Bench lays the coordinate and evaluation foundation on which future patient-specific dynamic models and causal intervention simulations can be built.
Keywords:
virtual patients
; drug repurposing
; human-scale representation
; module panel library
; AI for science
; aging
; traditional Chinese medicine
; network medicine
; recall@20
; cross-validation
1. Introduction
Aging is the dominant risk factor for most chronic diseases, but aging-related disease is not a collection of isolated diagnoses. Type 2 diabetes, hypertension, atherosclerosis/hyperlipidemia, osteoporosis, depression and immune dysfunction frequently coexist, interact and reshape one another across the life course. Physiological and psychiatric conditions are therefore not separate modelling problems: they are coupled manifestations of a whole-body state. For AI for science, while network pharmacology [1] established the goal of organizing drug-disease relationships at a network level, the bottleneck is not simply a lack of molecular detail [2,3,4], but the absence of a representation that can organize this complexity at the scale at which interventions are chosen.
Cell models, animal models and emerging virtual-cell systems [5,6] each provide indispensable mechanistic resolution. Yet each operates below the human scale at which clinicians and individuals must decide among drugs, nutrition, lifestyle and combinations of interventions. What is ultimately needed is a virtual patient [7,8]: a measurable representation of whole-body state that can accommodate multimorbidity, connect biological directions to interventions and be tested against real human-scale decisions.
Virtual patients are commonly regarded as distant because complete whole-body dynamics appear intractable. We propose a counterintuitive shortcut. Before building a full simulator, test its essential coordinate layer in a concrete AI-for-science task with curated labels at the same scale as intervention: drug repurposing [7,9,10,11]. Given a large collection of drugs and chronic diseases, can a multi-dimensional module representation, guided by recent advances in AI-driven drug discovery [12,13,14], recover known drug-disease associations and distinguish which organized panels of biological knowledge are most useful for each disease? If it cannot, it is not yet a useful coordinate system for virtual patients. If it can, it provides a measurable foundation for the next layer of modelling.
Existing approaches capture only part of this problem. Network-medicine methods [8,15,16] such as proximity-based min-z scores efficiently summarize the relationship between drug targets and disease-associated genes, but reduce the representation to a scalar [17] and do not provide a set of interpretable directions on which alternative interventions can be compared. Aging-hallmark gene sets provide biologically meaningful structure, but represent only one knowledge tradition [2,3]. Neither approach offers a systematic way to compare, combine and update modules drawn from distinct biological and medical knowledge systems.
We therefore construct a multi-scale, multi-dimensional module atlas that brings aging hallmarks, organ, metabolic and immune axes, traditional-Chinese-medicine-derived syndrome proxies, nutraceutical targets and food-as-medicine targets onto a common computable basis. Here, a module is a curated gene set, a panel is a prespecified collection of modules, and the 332-axis atlas is the library from which such panels are evaluated. The central unit of analysis is a panel: an organized combination of modules whose value can be evaluated against a proximity baseline, compared across diseases and retained, combined or retired as evidence evolves.
A virtual patient is ultimately a world-model problem. A biomedical world model must connect biological directions to candidate actions. Modules may be linked to candidate intervention sources through their curation provenance. However, current target annotations are incomplete and heterogeneous and should not be interpreted as evidence of module-level controllability, intervention coverage, or therapeutic action. The result is not yet a transition model; it is a coordinate system in which state and evidence can be compared.
We bring these elements together in SteeraMed Bench: a virtual-patient and drug-repurposing tool that evaluates module panels using recall@20, fold enrichment, baseline proximity comparison, redundancy analysis and validation across diseases. The bench is designed to evolve. Researchers can add a panel or module emerging from new science, test whether it contributes beyond existing organization and retain or revise it accordingly. We further show that an LLM-assisted agent [18] can participate in this proposal-and-evaluation loop.
2. Results
We provide a unified computable framework that brings four knowledge traditions onto a single basis. The atlas is valuable not because every axis must be used simultaneously, but because it provides a common address space in which multiple biologically organized panels can be compared and extended. We report standard cross-validation as a within-benchmark upper-bound estimate and target-cluster and leave-one-disease-out analyses as progressively stricter tests of generalization. We present panel-level evidence, disease-specific paradigm selection, and mechanistic decomposition, then validation boundaries and agent-driven module evolution.
2.1. A multi-Paradigm Module Atlas as a Panel Library
The atlas has 332 module axes drawn from four knowledge paradigms (Figure 1): extended aging-hallmark panels (72 modules, covering cellular hallmarks plus organ, metabolic, and immune aging), TCM-derived syndrome proxies (38), nutraceutical modules including NUTX extensions (117), and food-as-medicine modules (105; see Methods Section 4.2 for composition details). Each axis is a gene set representing a biological direction (e.g., nutrient sensing, bone remodeling, antioxidant defense).
The atlas is used as a library of candidate representations rather than as a prespecified claim that all axes should be combined in every disease. The central unit of analysis is a panel: an organized subset of modules associated with a coherent knowledge source. For each disease, the drug-module proximity matrix serves as the feature representation: for each drug-module pair, we compute a network proximity z-score (Guney method [17]) on the STRING protein-protein interaction network, which quantifies how close a drug's target proteins are to a module's gene set relative to random expectation, and panels are compared on their ability to recover known drug-disease associations. Some modules retain links to compounds or sources used during curation. These provenance links are not used as evidence of controllability, therapeutic action, or intervention coverage in the present study.
2.2. Organized Module Panels Recover Drug-Disease Associations Beyond Scalar Network Proximity
To test whether the module atlas provides ranking signal beyond what a scalar network-proximity score can deliver, we designed a drug-repurposing benchmark with the following setup. For each of five chronic diseases (type 2 diabetes, hypertension, depression, osteoporosis, atherosclerosis/hyperlipidemia), we defined positive drugs as those with an approved indication for that disease in DrugBank (via ATC codes and indication text), and drugs without a matching indication were treated as unlabeled non-positives for benchmark construction (n ≈ 1,916 drugs total). For each drug, we computed proximity z-scores to all 332 modules on the STRING PPI network (Guney proximity). A Logistic Regression classifier (L2 penalty, C = 0.1) was trained under 5-fold stratified cross-validation (3 seeds) to rank drugs by predicted disease relevance. The primary metric is recall@20: the fraction of true positive drugs recovered in the top 20 of the ranked list. Higher recall@20 means the representation better separates approved drugs from non-indicated drugs for that disease.
We compared five prespecified panels against a column-permutation null (200 iterations per panel) that preserves the z-score distribution but destroys the drug-module correspondence. Table 1. reports the 5-disease average recall@20 for each panel. The column-permutation null confirms that the signal depends on the structured drug-module pairing, not on the marginal distribution of z-scores. A 117-axis nutraceutical panel (including nutraceutical extensions; see Section 4.2) achieves excess gain 0.466 (95% confidence interval (CI): 0.450–0.482) over the permutation null; the full 332-axis atlas achieves 0.491 (0.473–0.510). The modest difference (0.025) is consistent with the panel-selection interpretation: the library's value lies not in indiscriminate stacking but in making it possible to discover which panels to keep for each disease. The excess gain pattern shows diminishing returns as panels grow larger: a compact 6-axis immune panel (A4) already achieves 0.104, while the full atlas reaches 0.491.
The pattern is even more striking at small scale. Six immune axes (A4) recover an excess gain of 0.104 (95% CI: 0.091–0.117); ten axes (A3), 0.212. A compact six-axis immune panel (A4) produced non-zero excess gain, indicating that even very small biologically organized panels carry ranking signal. The fold enrichment pattern (Supplementary S1) is consistent with this: the nutraceutical panel's excess gain (0.466) closely tracks the full atlas (0.491). This pattern is consistent with a selection advantage: constrained feature budgets may expose signal from small panels.
These sensitivity analyses delimit the settings in which the benchmark signal is observed. Performance decreases under target-family-separated evaluation (target-cluster CV recall@20 = 0.256 ± 0.024; Supplementary S5) and does not transfer under leave-one-disease-out evaluation. External validation on repoDB yields moderate AUROC (mean 0.688; atherosclerosis/hyperlipidemia 0.848, AUPR lift = 1.73×; Supplementary S2). Additional robustness checks are reported in Supplementary S4. Standard CV remains the primary setting for comparative panel analyses, and all standard-CV results are interpreted as within-disease representation and candidate-prioritization evidence.
2.3. Different Diseases Select Different Panels
A counterintuitive confirmation comes from the leave-one-paradigm-out ablation. Removing Hallmarks or TCM actually improves performance (Δrecall@20 = +0.031), while removing nutraceutical or food-as-medicine panels decreases it (Δrecall@20 = −0.010 and −0.030, respectively). food-as-medicine and nutraceutical panels provided consistent incremental value in this aggregate configuration; Hallmarks and TCM did not provide consistent incremental value at full dimensionality. This pattern is consistent with the atlas functioning as a panel-selection system: its value lies in enabling researchers to identify which panels contribute, complement, or dilute signal for each disease.
No single knowledge tradition dominated across all disease contexts. Across 23 DrugBank disease categories (n_pos ranging from 24 to 292; Supplementary S3), different panels consistently excelled in different disease types (Figure 2a-e): Hallmarks performed best in cancer (recall@20 = 0.900) and osteoporosis; nutraceuticals in analgesic, antipsychotic, and cardiovascular categories; food-as-medicine in depression and anti-inflammatory; TCM in sedative and antiepileptic categories. The reference union (ALL 332 axes) is the strictly highest observed configuration in only 9 of 23 categories (39%; Supplementary S3). These exploratory rankings are consistent with disease-dependent panel utility; they do not establish a universally optimal panel or a confirmatory advantage over the reference union (Supplementary S3).
Among five chronic aging-related diseases (type 2 diabetes, hypertension, atherosclerosis/hyperlipidemia, osteoporosis, depression), the pattern is consistent: type 2 diabetes → Hallmarks (0.700), hypertension → ALL (0.750), depression → food-as-medicine (0.700), atherosclerosis/hyperlipidemia → nutraceuticals (0.400), osteoporosis → Hallmarks (0.300). nutraceutical panel was the most informative prespecified panel for atherosclerosis/hyperlipidemia in this benchmark. The atlas therefore functions as a panel-selection system: it exposes where a particular biological organization is most useful, rather than requiring one representation to win everywhere.
2.4. Panel Selection and Ablation Reveal Configuration-Dependent Value
The 332-axis registry defines the candidate representation space. For each disease task, the primary estimand is the performance of a compact prespecified panel, not that of the full registry fitted as a universal model. Column permutation destroys the drug-module correspondence and collapses recall to near-random levels (Supplementary S1), confirming that the signal depends on the structured pairing between drugs and module features, not on the marginal distribution of z-scores. Full-registry null comparisons (degree-matched random gene sets) are reported in Supplementary S1 as registry-level robustness, not as a primary result.
Training-fold heuristic panel combination (exploratory). To test whether independently selected panel combinations outperform the best single panel, we implemented a training-fold heuristic selection procedure with inner-CV panel ranking: within each training fold, we selected the best single panel by within-fold recall@20, then applied forward stepwise addition of other panels (up to three), and evaluated the selected combination only on the held-out test fold. In this exploratory evaluation, the nutraceutical-plus-Hallmarks combination showed a positive observed out-of-fold gain for T2D relative to the selected single-panel baseline (best single nutraceutical panel = 0.443 ± 0.069 vs. combination = 0.533 ± 0.051; effect size +0.090, descriptive repeated-CV interval [−0.02, +0.20]). Because the selection and evaluation procedures are repeated and correlated across folds and seeds, we report the effect size and interval estimate rather than treating repeated folds as independent biological replicates. The overall average improvement was +0.026 (single = 0.484, combination = 0.510). The full 332-axis reference union remained comparable (0.528), indicating that the combination advantage is disease-specific rather than universal. The nutraceutical panel was selected as the best single panel in 67 of 75 folds; the most frequent two-panel combination was nutraceutical + Hallmarks (selected in 29 of 75 folds).
Classifier sensitivity analysis. This is a reference-union sensitivity analysis and does not redefine the panel-level primary analysis. The main results use Logistic Regression (C = 0.1) for transparency and reproducibility. We verified that the signal is not an artifact of the classifier choice by comparing five methods on the 332-feature reference union (Table 2. shows cross-method performance; Figure 2d). XGBoost achieves the highest 5-disease average recall@20 (0.66), followed by MLP (0.62), RandomForest (0.50), LogisticRegression (0.49), and GradientBoosting (0.41). The ranking confirms that the module atlas provides informative features regardless of classifier, but also reveals that nonlinear methods — particularly XGBoost — can extract substantially more signal from the same representation (+0.17 recall@20 over the linear baseline). We adopt Logistic Regression as the primary method for interpretability and conservatism; XGBoost achieved a higher within-benchmark score under this protocol; rigorous model-selection comparisons remain outside the primary panel analysis.
2.5. Mechanistic Decomposition Reveals why Module Panels Prioritize Disease-Relevant Drugs
To move beyond aggregate ranking performance, we decomposed held-out predictions from the reference-union Logistic Regression model into the module directions that most contributed to each drug-disease score. This is a reference-union attribution analysis included to make model use auditable; it is not a test of causal disease mechanisms or a redefinition of the selected-panel analysis. For each disease-specific model, we computed standardized Logistic Regression coefficients across 15 cross-validation folds (3 seeds x 5 folds) and measured sign consistency — the fraction of folds in which a module's coefficient retained the same direction. Only modules with high absolute contribution and sign consistency above 0.80 were retained as stable model-supported predictive directions.
The results reveal that different disease-specific models prioritize distinct, biologically interpretable module groups. For type 2 diabetes, the top stable directions include nutrient sensing (A1_nutrient_sensing), chromium metabolism, and extracellular matrix remodeling — all known pathways in glucose homeostasis. For hypertension, kidney-associated Hallmarks modules (A2_kidney) and several food-as-medicine modules dominate, consistent with the role of dietary interventions in blood pressure management. For depression, tyrosine metabolism (dopamine precursor), innate immunity, and CoQ10 emerge as top contributors. For osteoporosis, free radical/oxidative stress, ovarian function (estrogen-related), and calcium modules lead — consistent with previously described disease-relevant biology.
Panel-level aggregation confirms that each disease draws contributions from multiple knowledge traditions: no single panel monopolizes the top stable modules in any disease. This provides an interpretable pattern consistent with disease-specific panel specialization; independent biological validation is still required.
Module tournament. To assess which modules stably contribute across cross-validation folds, we computed selection probability — the fraction of 15 folds in which each module ranked in the top-10 by absolute coefficient. Only a small subset of modules achieved selection probability ≥ 0.80: for type 2 diabetes, nutrient sensing, chromium, and microbiota; for hypertension, kidney, NAD-related, and several food-as-medicine modules; for depression, tyrosine, innate immunity, and leukocyte migration; for osteoporosis, ovarian function, free radical defense, macrophage activation, and calcium. The remaining modules showed low or unstable selection, confirming that the model does not indiscriminately use all 332 axes but converges on a compact, disease-specific set of mechanism directions.
Prediction anatomy. To illustrate how the module representation traces individual drug-disease predictions (Figure 3a-g), we selected two representative held-out positive drugs for waterfall visualization: glipizide for type 2 diabetes and escitalopram for depression. For each drug, the top-5 modules by |w_j × X_dj| were extracted: glipizide's prediction was driven by chromium, microbiota, omega-3 fatty acid, pyridoxine, and yam modules; escitalopram's by tyrosine, ephedra, raspberry, ginseng, and magnesium modules. These case studies demonstrate that the model's predictions can be decomposed into explicit, traceable module-feature contributions; the biological interpretability of these contributions requires independent validation.
2.6. Auditable Prediction-Evidence Maps
Mechanistic decomposition does not convert a ranking model into a causal model. It makes the representation auditable: each prediction can be traced from drug-target neighborhoods through stable module directions to disease-relevant biological processes, generating testable hypotheses for experimental follow-up.
Taken together, the results support a bounded conclusion. Predefined biologically organized panels provide disease-dependent ranking information beyond scalar proximity, and the benchmark makes their comparative value and complementarity measurable. The current contribution is therefore a benchmarked and auditable module-library framework for disease-specific candidate extension and representation evaluation, rather than a complete virtual patient or a validated autonomous drug-discovery system.
Disease prediction mechanism networks. To visualize how drug-target neighborhoods connect to disease-relevant module directions, we constructed disease-specific prediction networks for four chronic diseases (Figure 4). Each network links a representative held-out true-positive drug (glipizide for T2D, escitalopram for depression, tiludronic acid for osteoporosis, atorvastatin for atherosclerosis/hyperlipidemia) through its target genes to the top stable predictive modules, and from modules to predefined disease mechanism programs. The networks reveal visually distinct mechanism profiles: osteoporosis-specific models prioritize bone remodelling, oxidative stress and hormone-related directions; depression models prioritize neurotransmitter, neuroinflammation and metabolic-stress programs; atherosclerosis/hyperlipidemia models prioritize lipid metabolism, vascular/ECM and innate immunity; and T2D models prioritize glucose metabolism, nutrient sensing and insulin signaling. These networks are auditable prediction-evidence maps, not causal mechanism diagrams: they show which stable module directions the model uses, not which biological pathways cause disease.
2.7. An agent Can Propose Candidates for an Evolving Module Library
The atlas is designed to grow, but manual curation is the bottleneck. We tested whether an LLM-based agent (DeepSeek; multi-model architecture supporting user-provided API keys) can automate module proposal and evaluation through a Propose → Score → Reflect → Refine loop (Figure 5). The agent receives a biological concept, generates a gene set, and the gene set is scored on the same bench: incremental recall@20 when added to the 117-axis nutraceutical panel, and Jaccard redundancy against the 332 existing modules. The agent then receives structured feedback and refines its proposal in a second round.
We tested seven frontier aging concepts from 2023–2026 literature: lysosomal membrane permeabilization (LMP) [19], tissue-resident macrophage (TRM) efferocytosis [20], senescent macrophages, ferroptosis defense, NAD+ salvage metabolism, extracellular matrix (ECM) stiffening (proposed 13th hallmark of aging), and clonal hematopoiesis (CHIP).
Most LLM-proposed modules did not improve the atlas. Of 14 proposals (7 concepts × 2 rounds; Figure 5b), 12 (85.7%) produced non-positive incremental recall@20. The per-concept Round 2 results and redundancy metrics are summarized in Table 3.
However, two results illustrate the operational capability of the bench. First, both positive increments appeared in Round 2 (after reflection), not Round 1: tissue-resident macrophage efferocytosis improved from Δrecall@20 = −0.020 to +0.021 (change = +0.041), and ECM stiffening from 0.000 to +0.031. The two round-2 gains are consistent with, but do not establish, the hypothesis that structured feedback can improve complementarity. Second, the mean maximum Jaccard overlap was 0.148, indicating that the agent proposes gene sets with low maximum Jaccard overlap under this metric (13/14 proposals had Jaccard < 0.3), even when those directions do not translate to benchmark gains. The one high-redundancy case (NAD+ salvage, Round 2, Jaccard = 0.444) identified substantial overlap with the existing NUTX:NMN_NR module under the chosen Jaccard metric, demonstrating that the redundancy metric functions as intended.
We state the boundary plainly: this is a proof of concept with a single LLM provider, two rounds, and seven concepts. The agent does not outperform manual curation at this stage. What it demonstrates is operational: the bench can evaluate any gene set from any source — including an LLM — using the same instruments (recall@20, Jaccard redundancy) applied to manually curated modules.
Random gene-set controls and multiple-testing correction. To assess whether the two positive increments (ECM stiffening +0.031, TRM efferocytosis +0.021) exceed chance, we generated 100 size-matched random gene sets from the STRING PPI largest connected component for each proposal and measured their incremental recall@20. Both positive proposals exceeded their respective null distributions: ECM stiffening had an empirical p = 0.010 (Z = 3.57 above the null mean of −0.006 ± 0.010), and TRM efferocytosis had p = 0.020 (null mean −0.005 ± 0.010). However, after Benjamini-Hochberg FDR correction across 7 concepts (q = 0.069 for both), neither remained significant at FDR < 0.05. This is partly a power limitation: with 100 random sets and 7 tests, the minimum achievable q-value is 0.069 regardless of signal strength. The gene-set-size control confirmed that ECM stiffening\'s gain is not explained by its 485-gene size: random 485-gene sets averaged Δrecall@20 = −0.006, with none reaching the observed +0.031. We therefore report these two positive results as preliminary signals requiring independent holdout validation, not as confirmed atlas improvements.
3. Discussion
The main contribution of this study is to establish and empirically test the coordinate layer of a virtual-patient program. By organizing heterogeneous biological and medical knowledge into comparable module panels, the atlas makes a difficult choice explicit: which combinations of state directions and intervention-associated knowledge are useful for a particular disease task? The results indicate that multi-paradigm panels outperform scalar proximity baselines in a disease-dependent manner, with different knowledge traditions showing complementary strengths—nutraceutical panels for atherosclerosis/hyperlipidemia, food-as-medicine panels for depression, and aging-hallmark panels for type 2 diabetes and osteoporosis. This panel-level specialization is an interpretable pattern consistent with disease-specific panel organization; independent biological validation is still required.
Aging requires plural representations. Multimorbidity means that no single pathway, organ system, or knowledge tradition can cover the full problem. Multi-paradigm organization is not decorative; it is a structural response to whole-body complexity. Different diseases select different panels as the highest observed configuration, and no single representation wins everywhere.
Module library value is evolvability. The atlas is designed to grow. New hallmarks, new immune mechanisms, new nutritional evidence, and new traditional medicine knowledge can all be admitted as candidate modules or panels on the same bench. Research progress need not overthrow the existing model; new candidates can be evaluated and incorporated after independent validation. The agent-driven proof of concept (Section 2.7) demonstrates that this bench is operable by autonomous systems: an LLM-based agent can propose modules, receive the same evaluation as manually curated modules, and refine its proposals through a structured feedback loop. The current agent does not outperform manual curation; it demonstrates automated candidate scoring and prioritization, not autonomous atlas maintenance.
Multiple knowledge traditions, one coordinate system. We provide a unified computable framework that places aging hallmarks, traditional Chinese medicine, nutraceutical targets, and food-as-medicine on a single computable basis. The per-disease results provide experimental evidence for why multiple paradigms are needed: different diseases select different paradigms, and the leave-one-paradigm-out analysis reveals that removing Hallmarks or TCM does not degrade — and in some cases improves — performance. This is not a failure of those paradigms; it is evidence that the atlas functions as a selection bench, not merely a feature union.
Intervention provenance (future work). Modules may be linked to candidate intervention sources through their curation provenance — drug targets, nutraceutical targets, or food-derived compound targets annotated during module construction. However, current target annotations are incomplete and heterogeneous (STITCH includes predicted and text-mined interactions), and module construction for nutraceutical and food-as-medicine panels inherently overlaps with target annotation sources, creating a circular dependency. These annotations should not be interpreted as evidence of module-level controllability, intervention coverage, or therapeutic action. Full validation of intervention linkage — including direction, dose, tissue exposure, bioavailability, and off-target effects — is left as future work.
Limitations. (1) At full dimensionality the atlas is not separable from a degree-matched random-gene-set null; the signal is real but local. (2) Leave-one-disease-out performance is at chance; this atlas extends candidate lists for diseases that already have drugs, it does not discover from a cold start. (3) The 23-disease benchmark covers major ATC categories but rare diseases and pediatric conditions are not yet represented. (4) TCM and food-as-medicine modules are operationally defined gene-set proxies constructed from herb–target mapping data, not validated biological entities. (5) Target annotations are incomplete and heterogeneous; nutraceutical and food-as-medicine modules have a circular dependency with annotation sources; annotations do not encode dose, direction, tissue selectivity, or therapeutic action. (6) The module definitions currently come from manual curation; the agent-driven proof of concept (Section 2.7) demonstrates automated module discovery on the bench but does not yet outperform manual curation, and scaling to comprehensive literature monitoring requires further development. (7) The food-as-medicine module set requires pipeline validation: herb-target extraction quality varies across source categories, and affected modules should be re-curated in the next atlas version.
Relation to world models. This paper provides a candidate coordinate and intervention-annotation layer that may support future biomedical world models [21,22,23,24], and it comes with a bench. What it does not supply is the dynamics: the transition function that predicts how the state changes under a given intervention. That function requires longitudinal data that are not currently available at the scale we need. We state the boundary plainly: the atlas is the coordinate system, not the world model. It is the object on which a world model can be built. Concurrent approaches such as STELLA [25] evolve AI agents for biomedical discovery; our contribution is complementary — we evolve the coordinate system itself, making it measurable and openly benchmarkable.
Why not AUROC. In drug repurposing, the class imbalance ratio is approximately 1:70. Under such imbalance, AUROC is dominated by the ranking of true negatives — the part of the ranking no clinician acts on — and can mask large differences in top-k recall [26]. We therefore adopt recall@k as the primary metric throughout.
The registry is intentionally broader than the model used for any one disease. The registry contains 332 candidate axes, but the results do not depend on treating this full set as a universal disease model. For individual diseases, the relevant unit is a compact, prespecified or training-fold-selected panel whose dimensionality is commensurate with the available evidence. The value of the registry is therefore not maximal feature accumulation; it is the ability to compare, select and, where independently supported, combine biologically organized representations for a given task.
This study introduces a benchmarked module-panel framework for drug-repurposing prioritization. Across within-disease evaluation tasks, biologically organized panels showed disease-dependent ranking utility and enabled explicit comparison of alternative representations. However, performance decreased substantially under target-family-separated evaluation and did not generalize to leave-one-disease-out settings. The current atlas should therefore be interpreted as a representation and candidate-prioritization layer for diseases with existing therapeutic knowledge, rather than as a causal intervention model, a cold-start indication-discovery system, or a complete virtual patient. The LLM-assisted experiments further demonstrate a workflow for generating and triaging provisional module candidates, whose incorporation requires independent validation.
4. Methods
4.1. Overview of the Evaluation Pipeline
The evaluation proceeds in five stages: (1) construct 332 module gene sets from four knowledge paradigms (section 4.2); (2) compute drug-module proximity on the STRING PPI network using Guney's network separation method, yielding a 1,916-drug × 332-module z-score matrix (section 4.4); (3) train a per-disease Logistic Regression classifier on this matrix under 5-fold stratified cross-validation with 3 seeds (section 4.5); (4) evaluate with recall@k and fold enrichment against three null models (sections 4.8-4.9); (5) report disease-level paired statistics with Benjamini-Hochberg correction (section 4.10). The same pipeline is applied to every panel (Hallmarks, TCM, NUT, FAM, ALL) and every disease category.
4.2. Module Atlas Construction
The 332 modules come from four knowledge paradigms, each constructed by a distinct pipeline.
Aging-related hallmarks (A series, 72 modules). We extend the classical aging hallmarks framework [2,3] (originally 12 hallmarks) into 72 operationally defined modules using Reactome and MSigDB Hallmark gene sets, curated to 50-800 genes per panel. The A series spans five biological domains: classical cellular hallmarks (A1, 14 modules: autophagy, epigenetic, genomic stability, inflammation, mitochondrial, nutrient sensing, proteostasis, senescence, stem cell, telomere, etc.), organ-specific aging (A2, 36 modules: brain, heart, kidney, liver, bone, thymus, adipose, etc.), metabolic aging (A3, 10 modules: lipid, carbohydrate, purine, free radical, protein synthesis, etc.), immune aging (A4, 6 modules: adaptive immunity, innate immunity, T/B cell activation, macrophage, leukocyte migration), and integrative function (A5, 6 modules: cognition, emotion, hematopoiesis, motor, sensory, sleep). Gene sets are mapped to protein-coding genes in the STRING network.
Traditional Chinese Medicine (T series, 38 modules). TCM syndrome-derived gene-set proxies are constructed via a network-pharmacology mapping chain. TCM functional terms (covering qi, blood, yin, yang, zang-fu organs, and pathological patterns such as phlegm, heat, dampness, and stagnation) are matched to associated herbs using the Chinese Pharmacopoeia functional descriptions and SymMap herb-function annotations. For each matched herb, chemical compounds are retrieved via BATMAN-TCM (herb-to-PubChem-CID mapping), and compound target genes are obtained from STITCH (score >= 200) with ENSP-to-gene-symbol mapping via STRING v12. A TF-IDF filter removes ubiquitous genes appearing in over 80% of TCM terms. The top-ranked genes by TF-IDF score are retained as the gene set for each TCM module. For example, the "tonifying qi" (buqi) module is constructed by: (1) matching 127 herbs whose pharmacopoeia descriptions contain qi-tonifying functional terms (e.g., ginseng, astragalus, licorice); (2) retrieving 2,847 compound-target interactions from STITCH for these herbs; (3) applying TF-IDF filtering to yield 312 genes enriched in immune regulation and energy metabolism pathways. Similarly, the "clearing heat" (qingre) module yields 268 genes enriched in anti-inflammatory and antioxidant pathways. We emphasize that these are operationally defined gene-set proxies derived from herb-target mapping data, not validated biological entities.
Nutraceuticals (NUT, 80 modules). Nutraceutical target genes are compiled from DrugBank nutraceutical entries and supplementary nutraceutical databases. Each nutraceutical compound is mapped to its known protein targets, and targets are aggregated into module-level gene sets based on functional category (vitamins, minerals, amino acids, polyphenols, fatty acids, and related compounds). An additional 37 nutraceutical-extension (NUTX) modules are included, yielding 117 nutraceutical-related axes total.
Food-as-medicine (FAM, 105 modules). Food-derived compounds with known protein targets are mapped through a similar compound-to-target pipeline. Food items are sourced from food composition databases, and their chemical compounds are mapped to target genes via STITCH. The resulting gene sets represent the molecular targets of dietary interventions.
Final atlas. The four panels are merged and deduplicated, yielding 332 unique modules (72 aging hallmarks + 38 TCM + 117 nutraceuticals + 105 food-as-medicine). Gene set sizes range from 839 (A4) to 7,689 (ALL).
4.3. Disease Definitions and Drug-Disease Associations
We use DrugBank (version 5.1.10, downloaded 2026-01-15) with 1,916 unique small molecules. Diseases are defined by ATC (Anatomical Therapeutic Chemical) classification code prefixes and indication text matching: type 2 diabetes (ATC A10), hypertension (C02/C03/C07/C08/C09), depression (N06A), osteoporosis (M05), and atherosclerosis/hyperlipidemia (C10). A drug is labeled positive for a disease if its ATC code or indication text matches; drugs without such a match are treated as unlabeled non-positives for benchmark construction. This operational label should not be interpreted as evidence of biological inactivity. To assess robustness to selected benchmark-construction choices under this positive-unlabeled assumption, we performed three robustness checks: (1) downsampling the negative pool to 25%, 50%, and 75% of full size changed the 5-disease average recall@20 by a coefficient of variation of 7.7%, indicating limited sensitivity; (2) comparing ATC-only vs. indication-text-only label definitions showed an average recall@20 difference of 0.092, with the combined label strategy outperforming either single source; (3) simulating hidden positives by randomly masking 10-30% of known positives reduced the average recall@20 from 0.524 to 0.440 at 30% masking, a bounded degradation consistent with partial label coverage. The class imbalance ratio is approximately 1:70 (positive to negative labels per disease).
4.4. PPI Network and Proximity Scoring
We use STRING v12 with confidence threshold >= 0.7 (combined score >= 400). The largest connected component (LCC, approximately 19,486 nodes) is used throughout. Drug-module proximity is computed using the network separation method of Guney et al. (2016) [17]: for each module, we compute the average shortest path length (ASPL) from each drug's target genes to the nearest module gene via multi-source breadth-first search (BFS). The proximity is then standardized against a degree-preserving null model: each drug's target set is replaced by 30 random gene sets matched on degree (degree binning, bin size = 100), and the z-score is computed as:
where dreal is the ASPL between drug targets and module genes, and μ(dₙull), σ(dₙull) are the mean and standard deviation of ASPL across 30 degree-matched random gene sets. This yields a 332-dimensional proximity vector for each drug, where each element is the standardized proximity of that drug to one module. The min-z baseline is defined as zmin = minm=1M zm across all M = 332 modules for each drug (a single scalar feature), representing the drug's strongest network proximity to any module.
4.5. Supervised Model and Feature Matrix
The feature matrix X is a drug × module matrix (N = 1,916 drugs × M = 332 modules), where each entry Xdm is the z-score proximity of drug d to module m. Missing values are filled with zero. We train a per-disease Logistic Regression classifier:
where xd ∈ ℝ³32 is the feature vector for drug d, w ∈ ℝ³32 are the learned coefficients (C = 0.1, L2 penalty), and b is the intercept. For feature selection experiments, we use L1-penalized Logistic Regression. The classifier is trained per disease (one-vs-rest), with 5-fold stratified cross-validation (3 random seeds: 42, 123, 456). Out-of-fold predictions are aggregated for evaluation. For cross-method comparison (Table 2.), we additionally evaluate XGBoost, RandomForest, GradientBoosting, and MLP under a shared fold structure with method-comparison aggregation (see Table 2 caption).
4.6. State and Intervention Representations
Module axes may be linked to candidate intervention sources (drug targets, nutraceutical targets, food-derived compound targets) through their curation provenance. However, this reflects database coverage — not validated controllability — because (1) target databases (DrugBank, STITCH) are incomplete and include predicted interactions; (2) NUT and FAM modules are constructed from the same target sources used for annotation, creating a circular dependency; and (3) the presence of a named target does not encode therapeutic direction, dose, tissue exposure, bioavailability, efficacy, or safety. We therefore do not use these annotations as a primary result.
4.7. Cross-Validation Schemes
We use four CV schemes. (1) Standard 5-fold CV (three seeds: 42, 123, 456) is reported as the upper-bound estimate (recall@20 = 0.524). (2) Target-cluster CV [27]: drugs sharing a common target family (defined by DrugBank target classifications) are held out together, preventing near-duplicate target-family overlap. This yields recall@20 = 0.256 ± 0.024 (five seeds, mean ± SD). (3) Target-profile cluster split: drugs are grouped by target-profile cosine distance into 100 clusters using KNN-propagated agglomerative clustering (sample 500 drugs, AgglomerativeClustering with average linkage on precomputed cosine distances, then KNN-1 propagate to all drugs), and entire clusters are held out in 5-fold CV (three seeds). This is distinct from target-cluster CV in that it groups by computed target-profile similarity rather than DrugBank family annotations. (4) Leave-one-disease-out (LODO): one disease is held out entirely, testing cross-disease generalization. LODO yields AUROC approximately 0.51–0.53 (at chance); recall@20 under LODO is near the random floor. Additionally, we performed a bibliographic-order sensitivity analysis using PubMed reference IDs as a crude ordering proxy, splitting drugs into an early 70% training set and a late 30% test set.
4.8. Evaluation Metrics
We report recall@k and fold enrichment FE@k. Given a ranked drug list of length N with npos known positives, recall@k at cutoff k is:
Fold enrichment normalizes for class imbalance:
where π = npos / N is the disease prevalence. For fold-wise recall@20, the per-fold random-ranking expectation depends on each test fold's candidate-pool size (Nfold), not the global drug count. The empirical random floor (0.031) reflects this fold-wise computation averaged across diseases, folds, and seeds. recall@20 is computed per test fold: drugs within each held-out fold are ranked by predicted score, and the fraction of true positives in the top 20 is recorded. Fold-level values are averaged across 5 folds and 3 seeds.
4.9. Null Models
We implement three null models. (a) Random ranking: empirical floor 0.031 (fold-wise computation; see Section 4.8). (b) Feature-column permutation: for each module column, its z-scores are independently shuffled across drugs (200 iterations). This destroys the drug-module correspondence while preserving each module's marginal z-score distribution (five-disease mean for the full atlas: 0.032 ± 0.019). (c) Degree-matched random gene sets: each real module is replaced by a random gene set matched on size and PPI connectivity (200 iterations, mean 0.049 ± 0.018). The excess gain for a panel is defined as:
For panel-level analyses, we run 200 iterations per panel and report mean ± SD with 95% confidence intervals.
Module contribution analysis. Within each cross-validation fold, features were standardized to zero mean and unit variance using training-fold statistics (StandardScaler). Feature contributions were then computed as the product of the standardized coefficient wⱼ across 15 cross-validation folds (3 seeds × 5 folds). The contribution of module j to drug d is:
where Xdj is the standardized proximity z-score of drug d to module j. Since the raw Guney proximity z-score is negatively signed (lower z = closer proximity), a positive coefficient wⱼ means that a higher standardized z-score increases the model score. Readers should interpret sign and magnitude relative to the standardized feature, not as direct biological proximity.
Sign consistency was defined as the fraction of folds in which wⱼ retained the same direction. Selection probability was defined as the fraction of folds in which module j ranked in the top-10 by |wⱼ|. Prediction anatomy used held-out test fold predictions only; case drugs were selected as the highest-scoring known positive in each disease's test fold. All contribution analyses used the same train-test splits as performance evaluation.
A secondary null (Supplementary S1) shuffles each drug's z-score vector across modules (within-drug feature shuffle), preserving each drug's z-score multiset but destroying module identity. This is a weaker null and yields a higher baseline (five-disease mean ≈ 0.101); it is reported separately and is not used for excess-gain calculations in Table 1.
4.10. Statistical Tests
We use disease-level paired Wilcoxon signed-rank test (n = 5 diseases) for panel comparisons, bootstrap resampling (1000 samples) for confidence intervals, and permutation distribution quantiles for null model comparisons. We apply Benjamini-Hochberg correction for multiple comparisons where indicated. Per-disease best-panel results are labeled exploratory (not corrected for panel selection).
Training-fold heuristic panel selection and combination evaluation (exploratory). The procedure uses an outer 5-fold CV (three seeds: 42, 123, 456). Within each outer training partition, panel selection was performed using only inner out-of-fold predictions from a 3-fold inner stratified CV within the training partition. We evaluated five prespecified panels (A4, TCM, Hallmarks, NUT, FAM) by inner-CV recall@20, selected the highest-scoring panel with smaller dimensionality as the tie-breaker, and considered forward additions up to three panels. The chosen configuration was refit on the complete outer training partition and evaluated once on the outer test partition. The denominator 75 = 3 seeds x 5 folds x 5 diseases. Repeated outer-fold differences are reported descriptively because resamples share observations; they are not treated as independent biological replicates. We report a descriptive repeated-CV interval rather than a parametric confidence interval.
4.11. Data and Code Availability
DrugBank is available at https://go.drugbank.com. STRING is available at https://string-db.org. The module definitions and disease-drug mappings are provided in Supplementary Materials. Analysis scripts, frozen result CSVs, and module definitions will be made available at GitHub (https://github.com/DeepoMe/SteeraMed-bench) upon acceptance of the manuscript. A live demo is available at https://steeramed.com/bench. Because DrugBank licensing prohibits redistribution, the release will include pre-computed benchmark matrices (not raw DrugBank data), enabling users to test their own module definitions (e.g., a nutraceutical, a food product, or a custom gene set) against the same drug repurposing benchmark. The module discovery agent code (Section 2.7) supports multiple LLM providers via a pluggable adapter architecture; users provide their own API key.
Supplementary Materials
The following supporting information can be downloaded at the website of this paper posted on Preprints.org.
Author Contributions
J.X. conceived the study, designed the framework, constructed the module atlas, performed all experiments and data analysis, and wrote the manuscript. Q.X. contributed to algorithm design. All authors read and approved the final manuscript.
Funding
This research received no external funding.
Acknowledgments
We thank colleagues at DeepoMe Inc. for critical feedback that improved the manuscript.
Conflicts of Interest
J.X. is employed by and holds equity in DeepoMe Inc. Q.X. declares no competing interests.:
References
- Hopkins, A.L. Network pharmacology: the next paradigm in drug discovery. Nat. Chem. Biol. 2008, 4, 682–690. [Google Scholar] [CrossRef] [PubMed]
- López-Otín, C.; Blasco, M.A.; Partridge, L.; Serrano, M.; Kroemer, G. The hallmarks of aging. Cell 2013, 153, 1194–1217. [Google Scholar] [CrossRef] [PubMed]
- López-Otín, C.; Blasco, M.A.; Partridge, L.; Serrano, M.; Kroemer, G. Hallmarks of aging: An expanding universe. Cell 2023, 186, 243–278. [Google Scholar] [CrossRef] [PubMed]
- Kennedy, B.K.; Berger, S.L.; Brunet, A.; et al. Geroscience: linking aging to chronic disease. Cell 2014, 159, 709–713. [Google Scholar] [CrossRef] [PubMed]
- Jumper, J.; Evans, R.; Pritzel, A.; et al. Highly accurate protein structure prediction with AlphaFold. Nature 2021, 596, 583–589. [Google Scholar] [CrossRef] [PubMed]
- Bunne, C.; Roohani, Y.; Rosen, Y.; et al. How to build the virtual cell with artificial intelligence: priorities and opportunities. Cell 2024, 187, 7045–7063. [Google Scholar] [CrossRef] [PubMed]
- Pushpakom, S.; Iorio, F.; Eyers, P.A.; et al. Drug repurposing: progress, challenges and recommendations. Nat. Rev. Drug Discov. 2019, 18, 41–58. [Google Scholar] [CrossRef] [PubMed]
- Barabási, A.-L.; Gulbahce, N.; Loscalzo, J. Network medicine: a network-based approach to human disease. Nat. Rev. Genet 2011, 12, 56–68. [Google Scholar] [CrossRef] [PubMed]
- Santos, R.; Ursu, O.; Gaulton, A.; et al. A comprehensive map of molecular drug targets. Nat. Rev. Drug Discov. 2017, 16, 19–34. [Google Scholar] [CrossRef] [PubMed]
- Stokes, J.M.; Yang, K.; Swanson, K.; et al. A deep learning approach to antibiotic discovery. Cell 2020, 180, 688–702. [Google Scholar] [CrossRef] [PubMed]
- Corsello, S.M.; Nagle, R.T.; Lu, X.; et al. Discovering the anti-cancer potential of non-oncology drugs by systematic viability profiling. Nat. Cancer 2020, 1, 235–248. [Google Scholar] [CrossRef] [PubMed]
- Vamathevan, J.; Clark, D.; Czodrowski, P.; et al. Applications of machine learning in drug discovery and development. Nat. Rev. Drug Discov. 2019, 18, 463–477. [Google Scholar] [CrossRef] [PubMed]
- Schneider, P.; Walters, W.P.; Plowright, A.T.; et al. Rethinking drug design in the artificial intelligence era. Nat. Rev. Drug Discov. 2020, 19, 353–364. [Google Scholar] [CrossRef] [PubMed]
- Zhavoronkov, A.; Ivanenkov, Y.A.; Aliper, A.; et al. Deep learning enables rapid identification of potent DDR1 kinase inhibitors. Nat. Biotechnol. 2019, 37, 1038–1040. [Google Scholar] [CrossRef] [PubMed]
- Yıldırım, M.A.; Goh, K.-I.; Cusick, M.E.; Barabási, A.-L.; Vidal, M. Drug-target network. Nat. Biotechnol. 2007, 25, 1119–1126. [Google Scholar] [CrossRef] [PubMed]
- Menche, J.; Sharma, A.; Kitsak, M.; et al. Uncovering disease-disease relationships through the incomplete interactome. Science 2015, 347, 1257601. [Google Scholar] [CrossRef] [PubMed]
- Guney, E.; Menche, J.; Vidal, M.; Barabási, A.L. Network-based in silico drug efficacy screening. Nat. Commun. 2016, 7, 10331. [Google Scholar] [CrossRef] [PubMed]
- Gross, B.; Ehlert, J.; Gladyshev, V.N.; Loscalzo, J.; Barabási, A.-L. Network-driven discovery of repurposable drugs targeting hallmarks of aging. Nat. Aging 2026. [Google Scholar] [CrossRef] [PubMed]
- Steinhauser, M.L.; Liu, Y.; Sukoff Rizzo, S.J.; et al. Lysosomes and lysosomal dysfunction in ageing biology. Nat. Cell Biol. 2026. [Google Scholar] [CrossRef] [PubMed]
- Tan, Y.J.; Conley, T.E.; Yao, F.; et al. Restored clearance of senescent neutrophils by tissue-resident macrophages limits organ aging. Science 2026, 393, eaea3075. [Google Scholar] [CrossRef] [PubMed]
- Xiong, J. World models for biomedicine: a steerability framework. Preprints 2026. [Google Scholar] [CrossRef]
- Xiong, J. SteeraMed: a biomedical world model for N-of-1 intervention reasoning across chronic diseases and aging. Preprints 2026. [Google Scholar] [CrossRef]
- Chen, Z.; Cong, Z.; Jin, Z.; et al. Medical world models in healthcare: foundations, applications, and challenges for trustworthy clinical translation. arXiv 2026, arXiv:2607.25242. [Google Scholar]
- Wang, G.; Yue, J.; Zhang, S.; et al. Towards world models in biomedical research. arXiv 2026, arXiv:2606.05925. [Google Scholar]
- Jin, R.; Xu, M.; Meng, F.; et al. STELLA: towards a biomedical world model with self-evolving multimodal agents. bioRxiv 2025. [Google Scholar] [CrossRef]
- Saito, T.; Rehmsmeier, M. The precision-recall plot is more informative than the ROC plot when evaluating binary classifiers on imbalanced datasets. PLoS ONE 2015, 10, e0118432. [Google Scholar] [CrossRef] [PubMed]
- Pahikkala, T.; Airola, A.; Pietilä, S.; et al. Toward more realistic drug-target interaction predictions. Brief. Bioinform. 2015, 16, 325–337. [Google Scholar] [CrossRef] [PubMed]
Figure 1.
SteeraMed Bench as a module-panel evaluation workflow. Curated module sources (Aging-related Hallmarks 72, TCM 38, NUT/NUTX 117, FAM 105) are assembled into a 332-axis module library. An LLM-assisted workflow proposes and revises candidate gene sets, which are scored for incremental benchmark value and redundancy. The benchmark evaluates predefined panels and candidate modules against drug-repurposing tasks. Five chronic diseases are primary case studies; 23 disease categories provide exploratory extension. Candidate modules remain provisional until independently validated.
Figure 1.
SteeraMed Bench as a module-panel evaluation workflow. Curated module sources (Aging-related Hallmarks 72, TCM 38, NUT/NUTX 117, FAM 105) are assembled into a 332-axis module library. An LLM-assisted workflow proposes and revises candidate gene sets, which are scored for incremental benchmark value and redundancy. The benchmark evaluates predefined panels and candidate modules against drug-repurposing tasks. Five chronic diseases are primary case studies; 23 disease categories provide exploratory extension. Candidate modules remain provisional until independently validated.
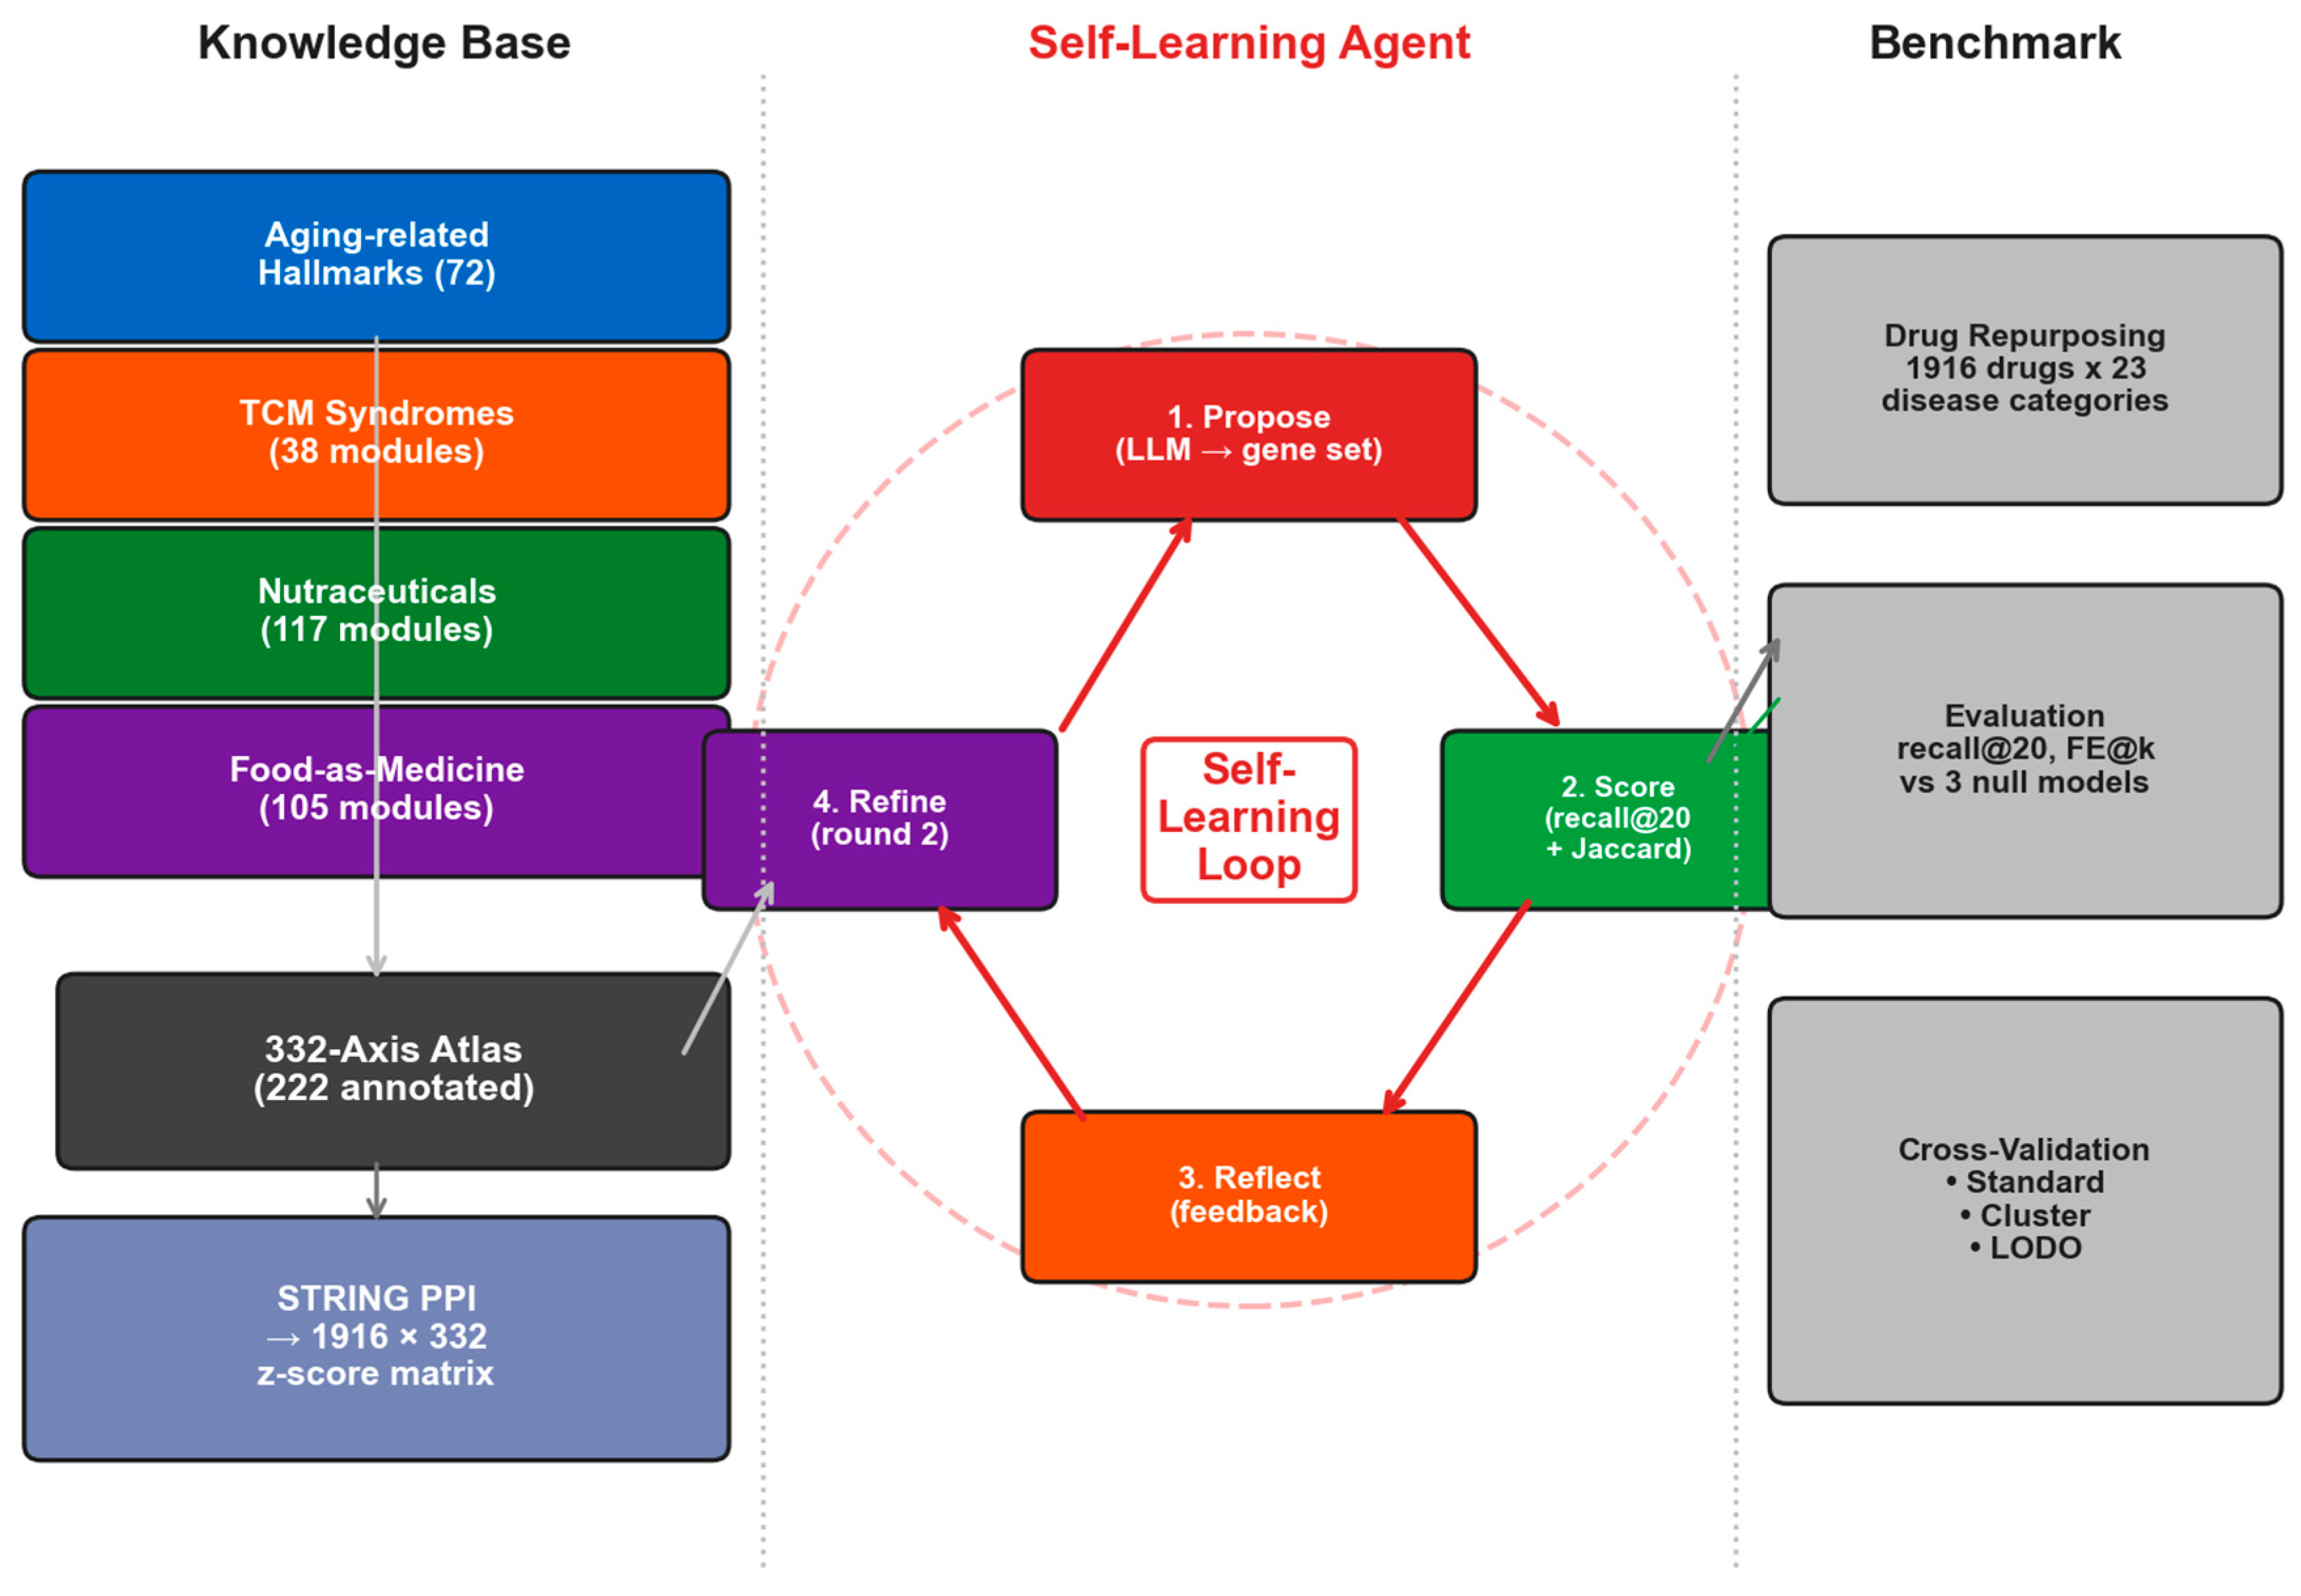
Figure 2.
Panel performance across drug-repurposing tasks. (a) Heatmap of recall@20 for 23 disease categories x 5 panels. No single panel dominates all diseases. (b) Excess gain over column-permutation null by panel (A4=6-axis immunity baseline; d=module dimensions). (c) Reference-union ablation: leave-one-paradigm-out shows removing Hallmarks or TCM does not degrade performance. (d) Cross-method comparison: LogisticRegression, RandomForest, GradientBoosting, MLP, and XGBoost on the reference union. (e) Best panel per disease: ALL is optimal in only 9/23 categories (39%). Per-category winners are exploratory.
Figure 2.
Panel performance across drug-repurposing tasks. (a) Heatmap of recall@20 for 23 disease categories x 5 panels. No single panel dominates all diseases. (b) Excess gain over column-permutation null by panel (A4=6-axis immunity baseline; d=module dimensions). (c) Reference-union ablation: leave-one-paradigm-out shows removing Hallmarks or TCM does not degrade performance. (d) Cross-method comparison: LogisticRegression, RandomForest, GradientBoosting, MLP, and XGBoost on the reference union. (e) Best panel per disease: ALL is optimal in only 9/23 categories (39%). Per-category winners are exploratory.
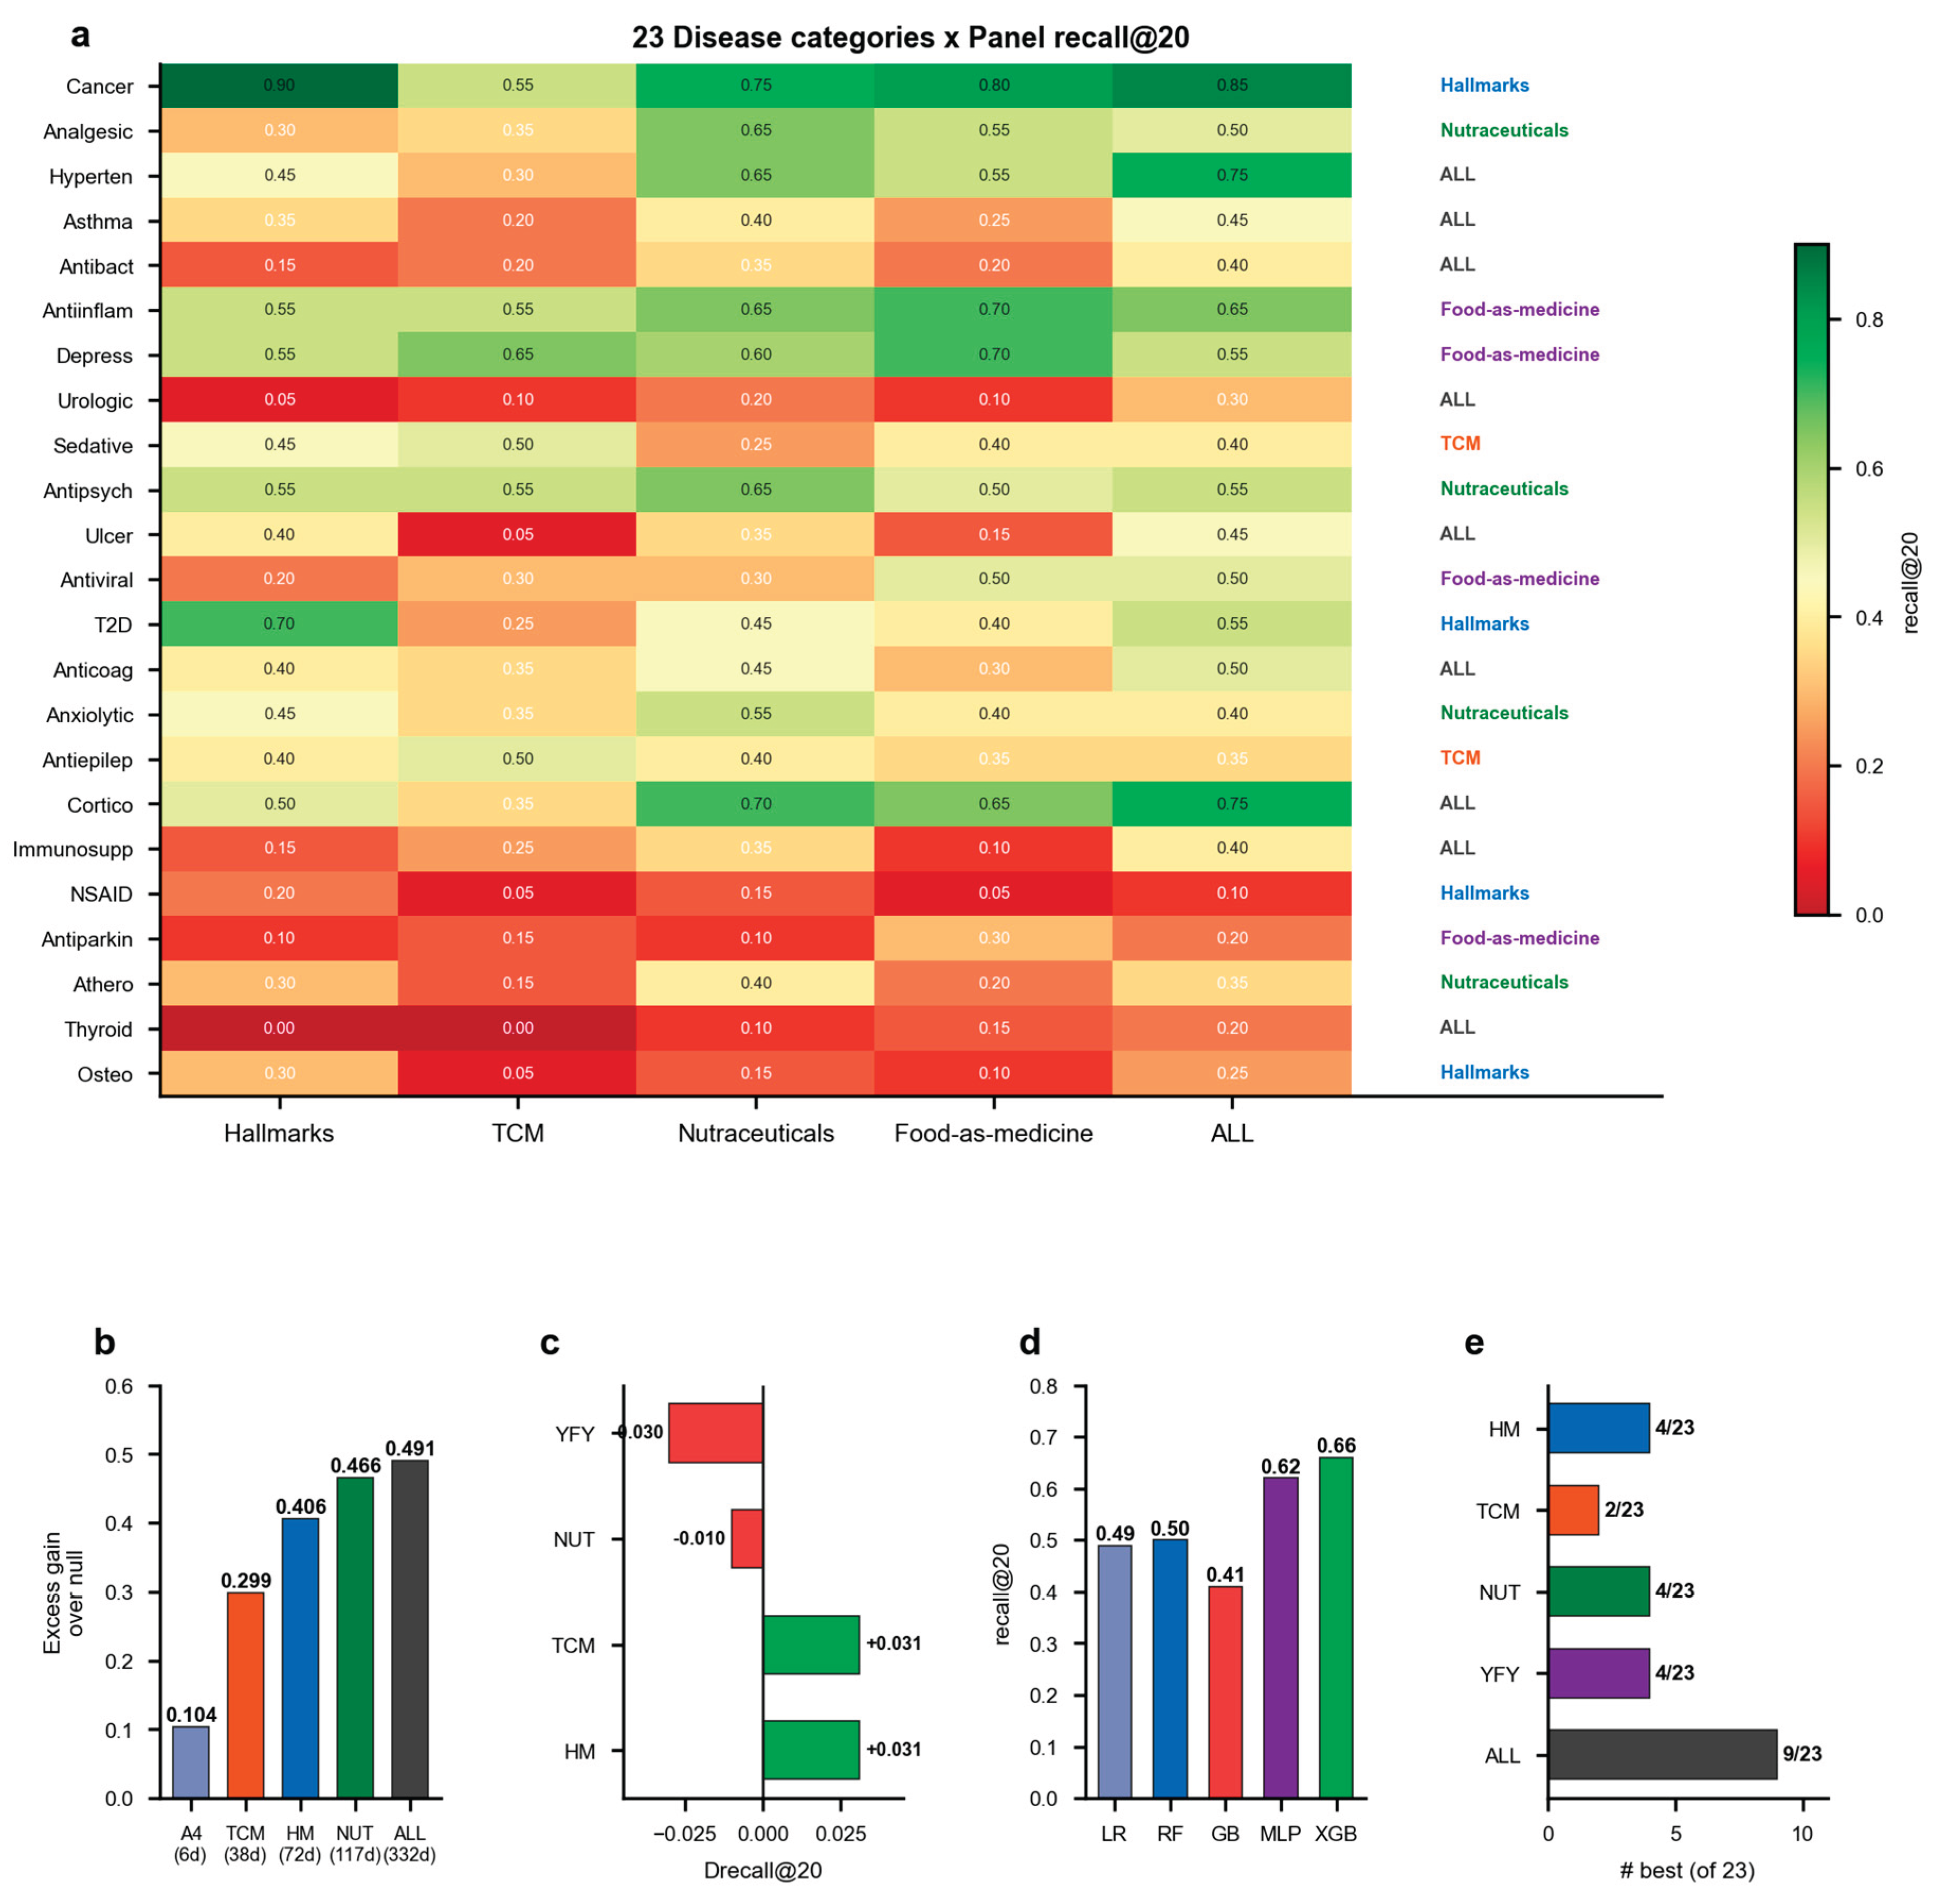
Figure 3.
Mechanistic decomposition from the reference-union Logistic Regression model. (a-d) Top stable modules (sign consistency > 0.80 across 15 CV folds) for each disease. Green bars = positive coefficients; red bars = negative. Coefficient sign denotes conditional model association after standardization, not activation/inhibition or beneficial/harmful biology. (e) Panel-level aggregated |coefficient| heatmap. (f) Prediction anatomy: illustrative held-out examples showing contribution waterfalls for two representative case drugs (g) Module tournament: selection probability per disease across 15 CV folds. This is a reference-union attribution analysis included to make model use auditable; it is not a test of causal disease mechanisms or a redefinition of the selected-panel analysis.
Figure 3.
Mechanistic decomposition from the reference-union Logistic Regression model. (a-d) Top stable modules (sign consistency > 0.80 across 15 CV folds) for each disease. Green bars = positive coefficients; red bars = negative. Coefficient sign denotes conditional model association after standardization, not activation/inhibition or beneficial/harmful biology. (e) Panel-level aggregated |coefficient| heatmap. (f) Prediction anatomy: illustrative held-out examples showing contribution waterfalls for two representative case drugs (g) Module tournament: selection probability per disease across 15 CV folds. This is a reference-union attribution analysis included to make model use auditable; it is not a test of causal disease mechanisms or a redefinition of the selected-panel analysis.
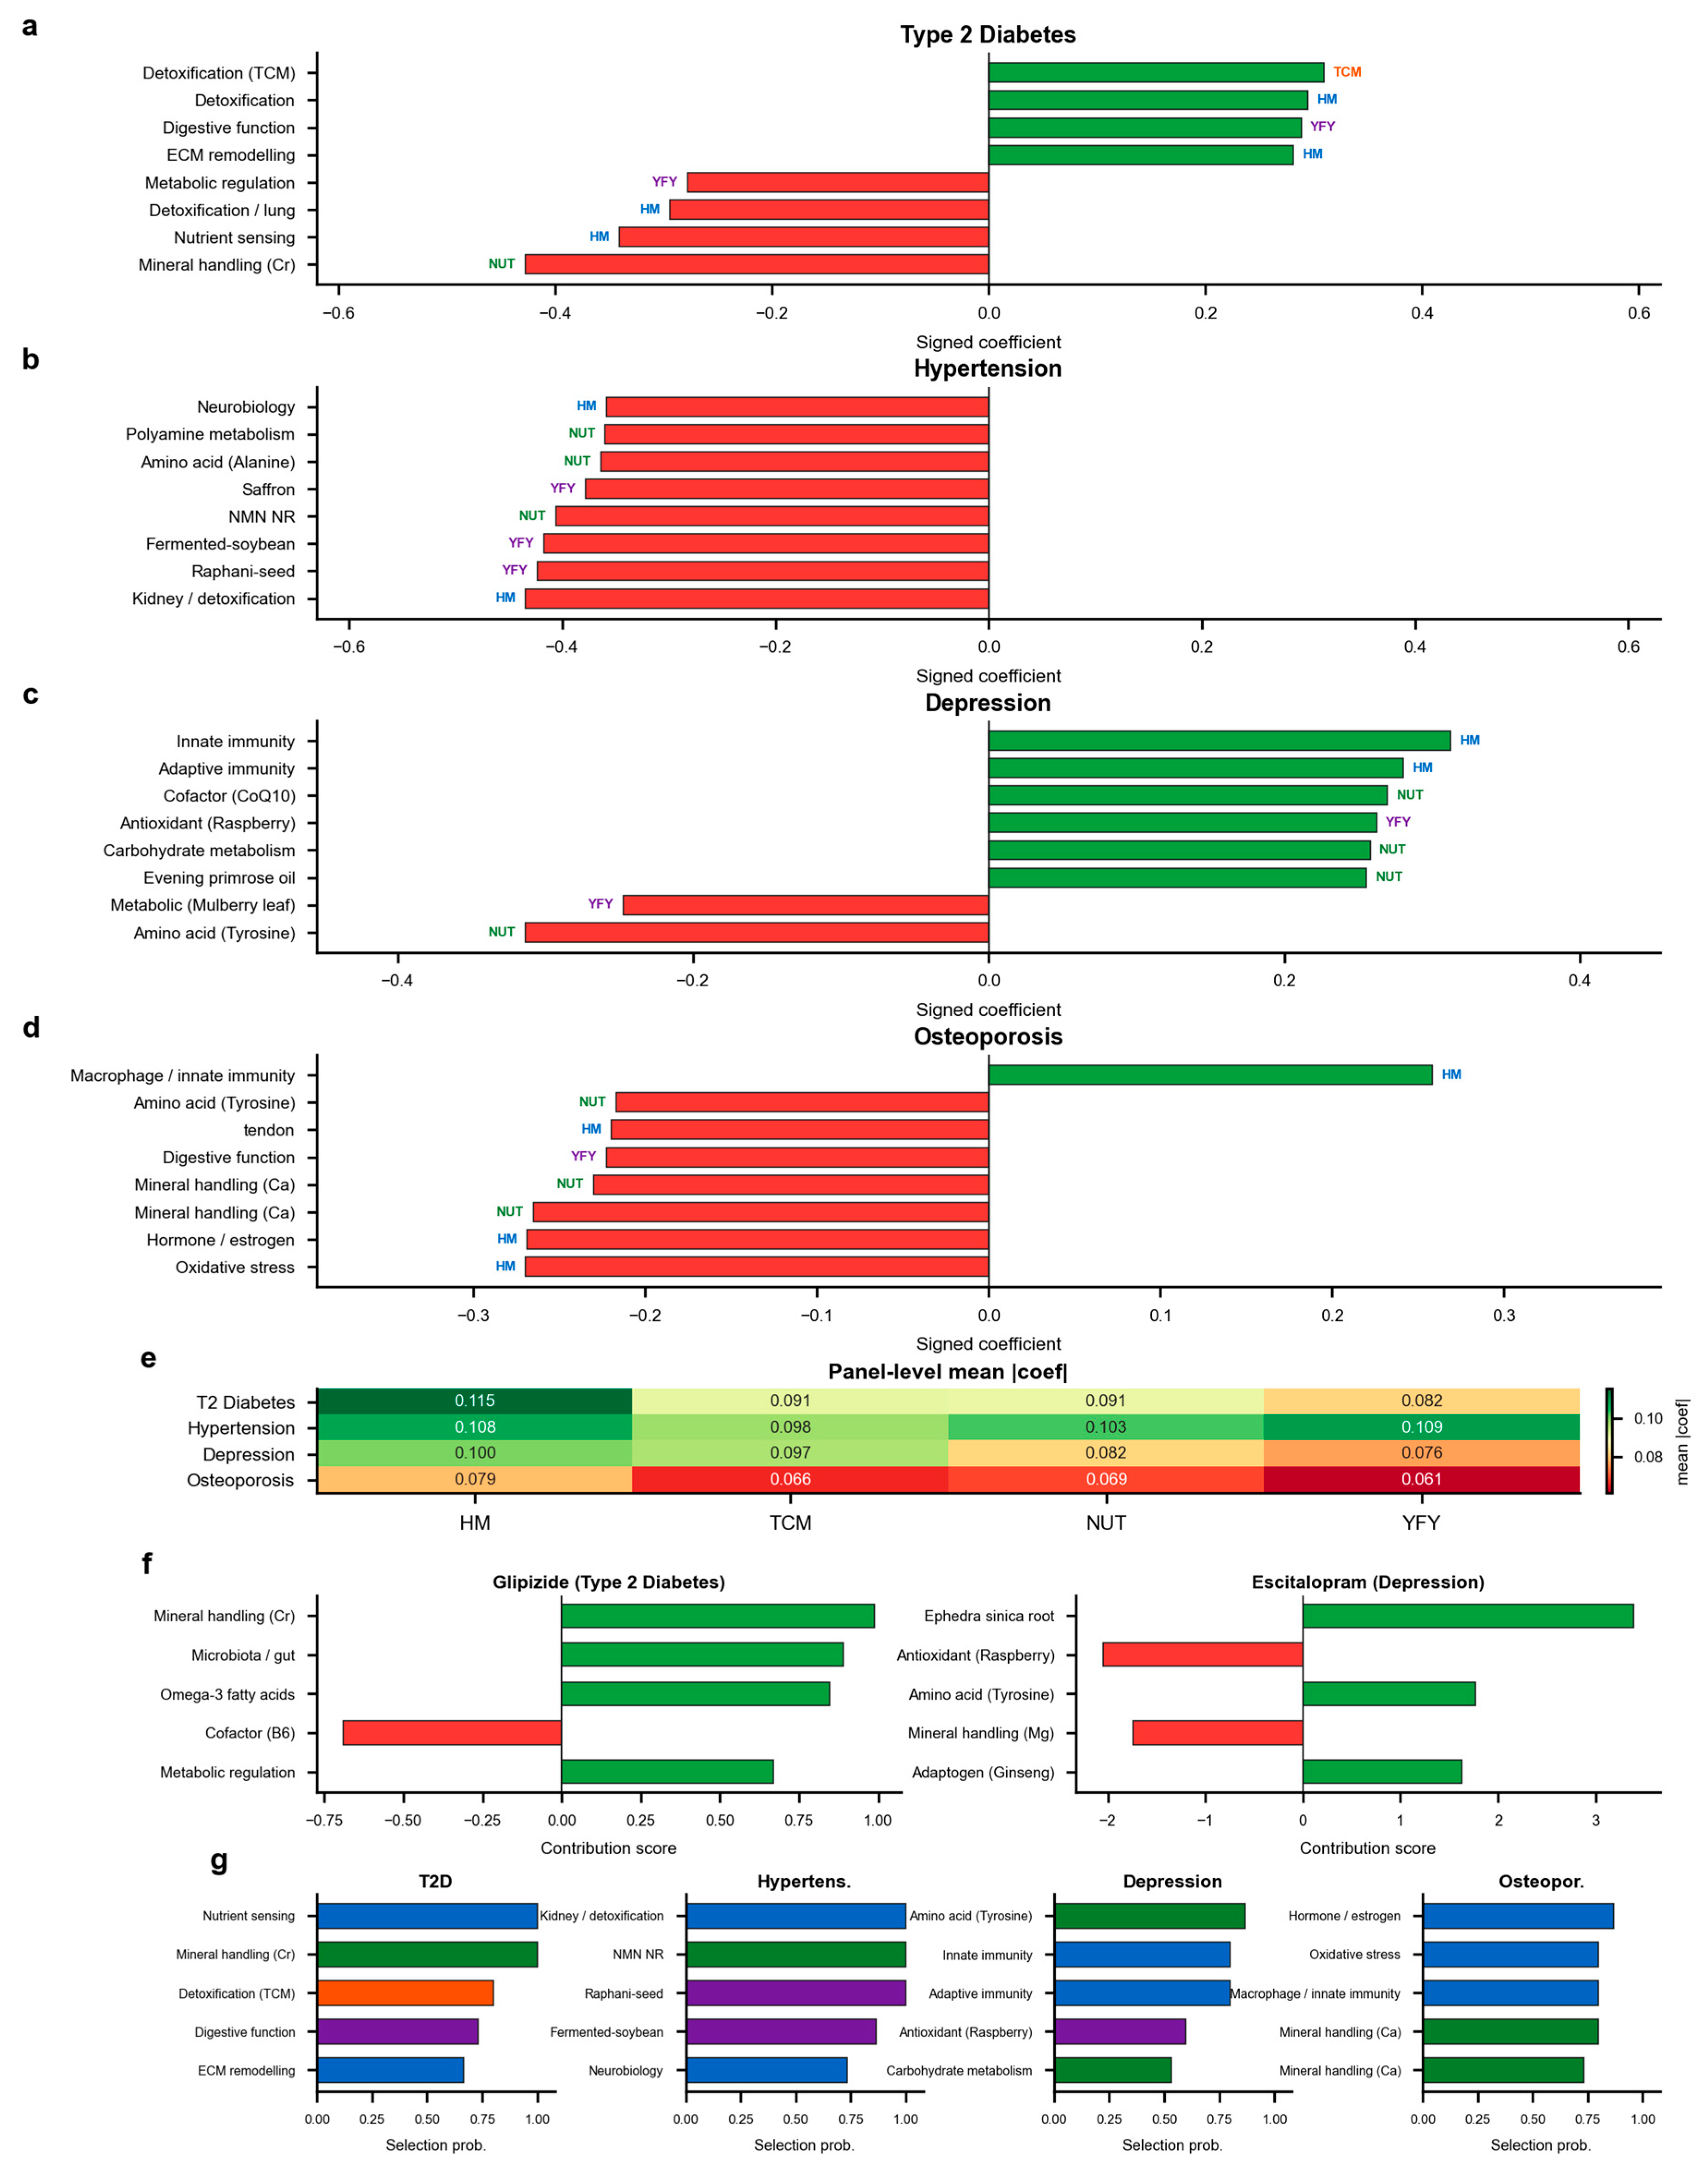
Figure 4.
Prediction-evidence networks link drug-target neighborhoods to stable module directions. Four chronic diseases shown as small multiples with identical three-layer structure: drug + target genes (left; case drugs: glipizide, escitalopram, tiludronic acid, atorvastatin) -> top stable modules (center, colored by panel) -> disease mechanism programs (right). These are auditable prediction-evidence maps for illustrative held-out cases, not causal mechanism diagrams.
Figure 4.
Prediction-evidence networks link drug-target neighborhoods to stable module directions. Four chronic diseases shown as small multiples with identical three-layer structure: drug + target genes (left; case drugs: glipizide, escitalopram, tiludronic acid, atorvastatin) -> top stable modules (center, colored by panel) -> disease mechanism programs (right). These are auditable prediction-evidence maps for illustrative held-out cases, not causal mechanism diagrams.
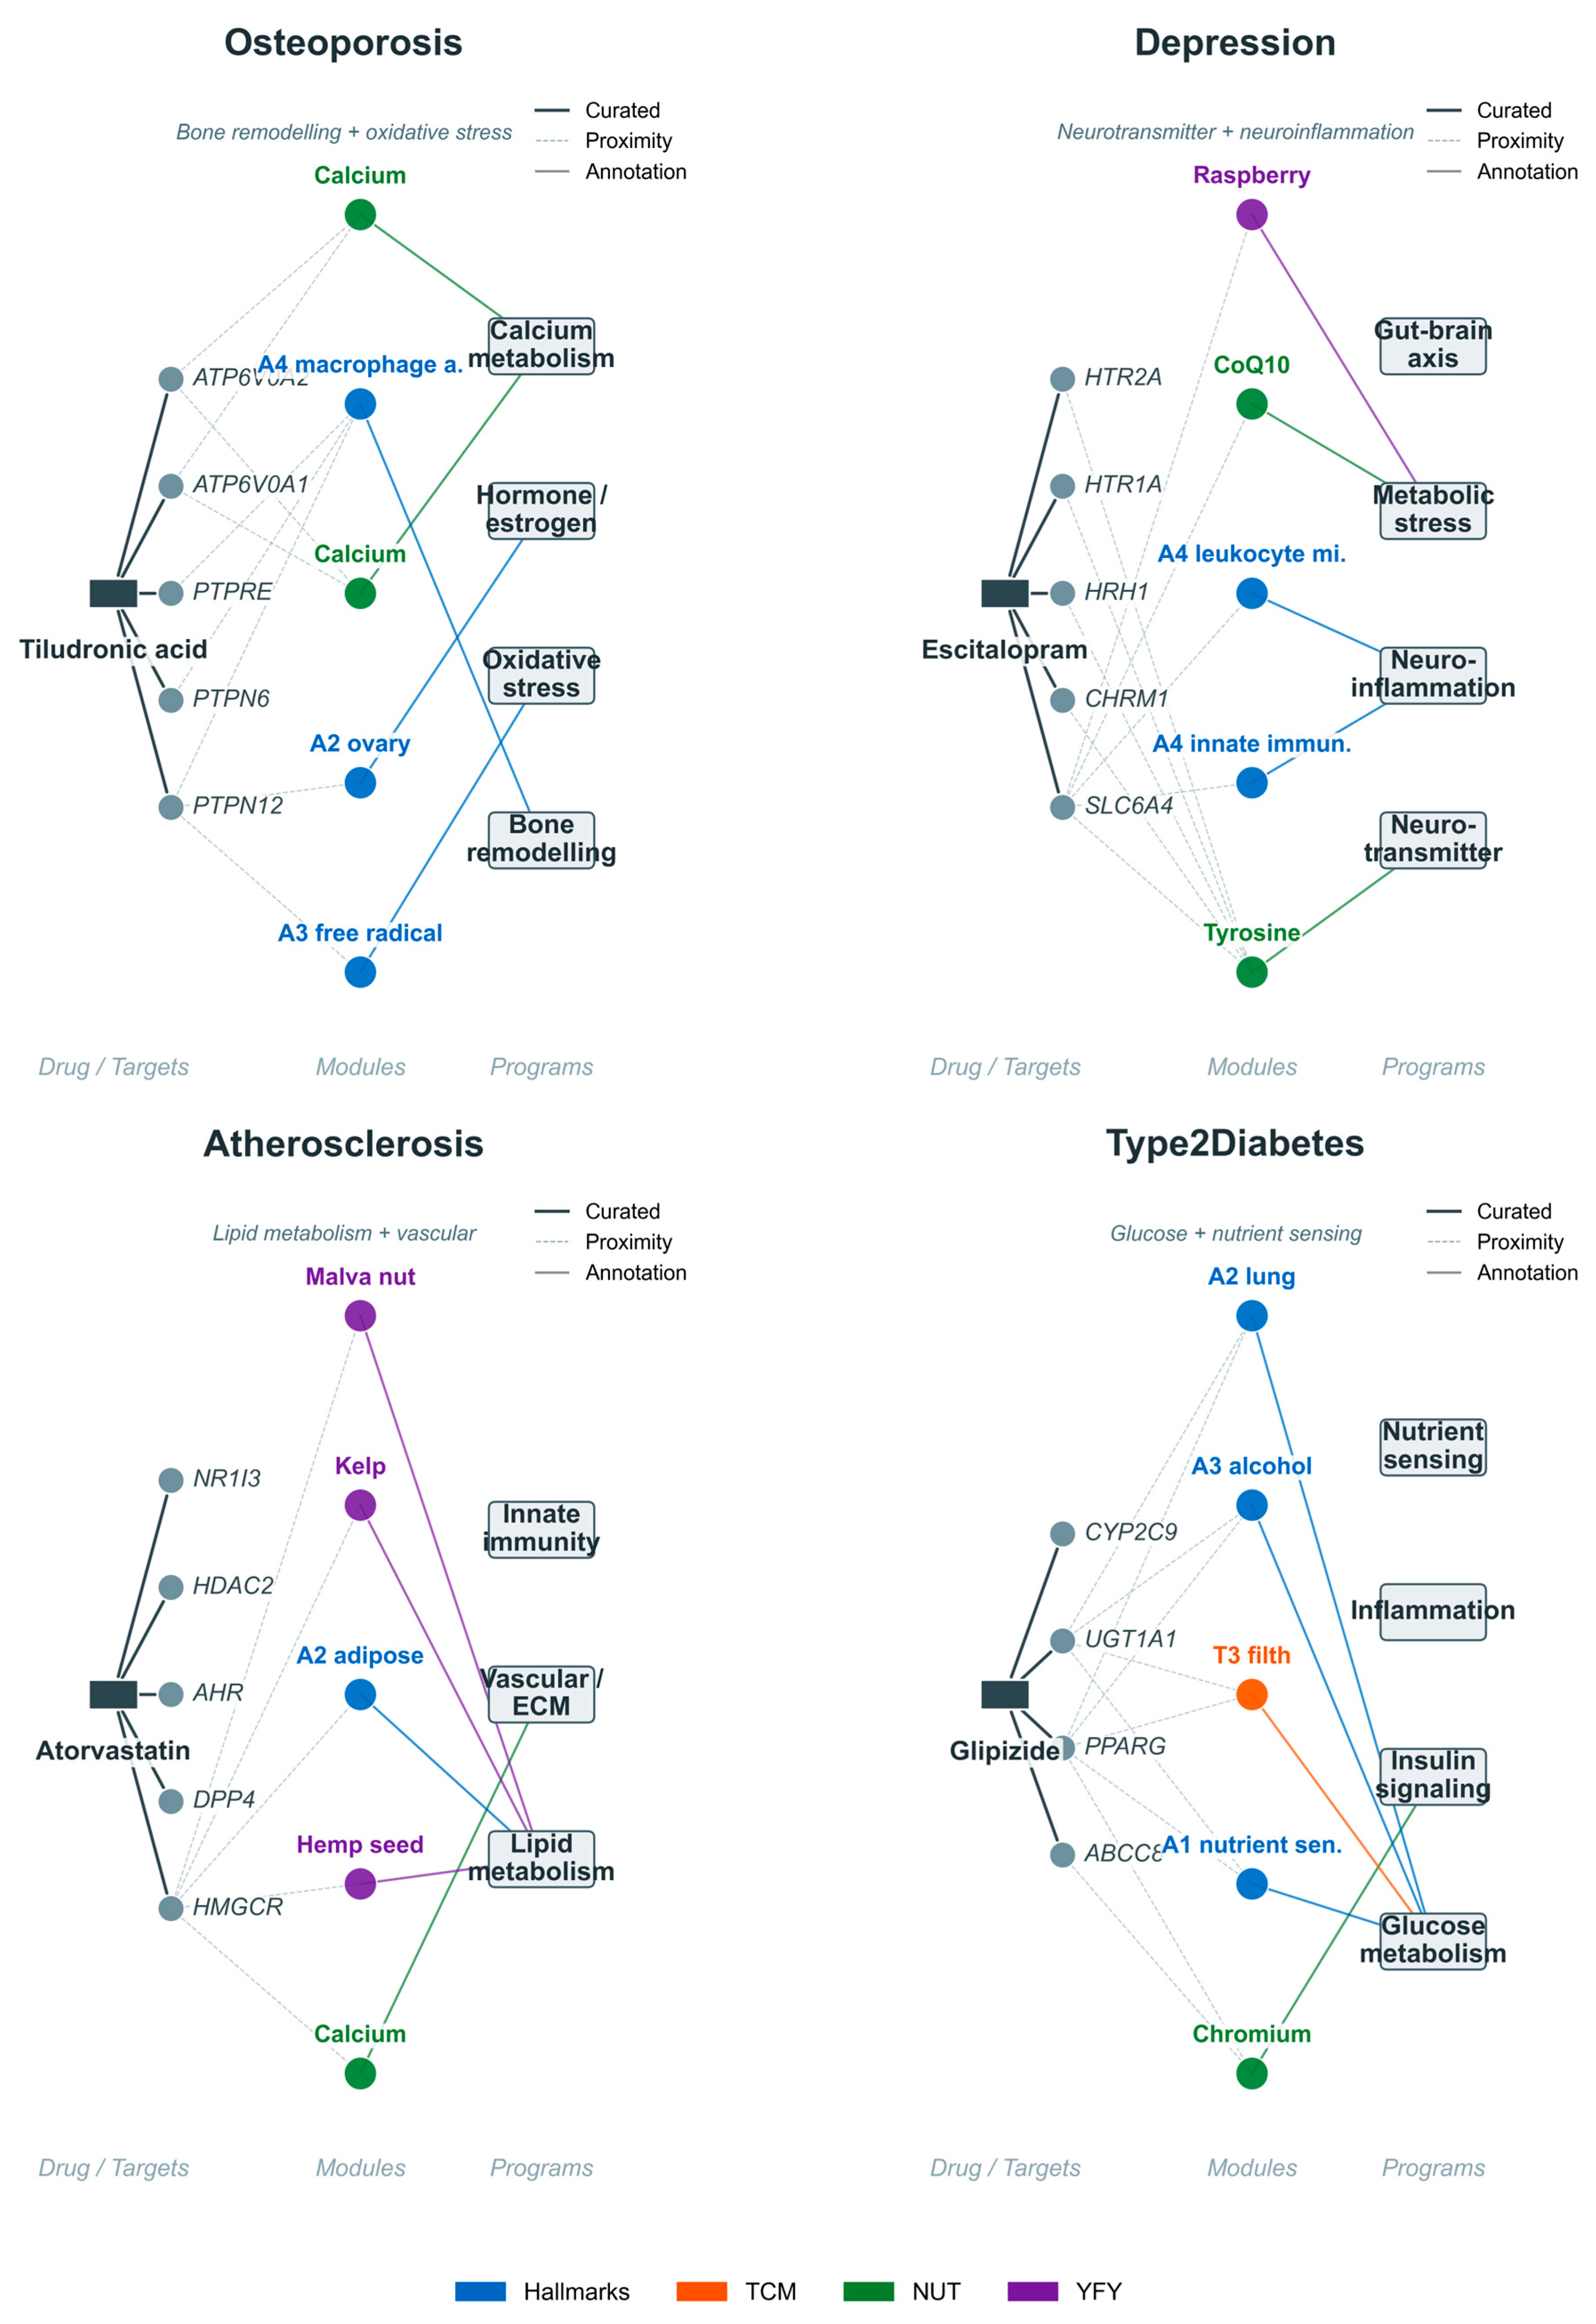
Figure 5.
LLM-assisted candidate-module triage. (a) The Propose–Score–Reflect–Refine workflow. Candidate gene sets are evaluated by their incremental recall@20 when appended to the nutraceutical panel and by maximum Jaccard overlap with the existing atlas. (b) Round-2 incremental recall@20 for seven frontier-aging concepts. Two candidates showed nominally positive increments; neither survived Benjamini–Hochberg correction across seven concepts.
Figure 5.
LLM-assisted candidate-module triage. (a) The Propose–Score–Reflect–Refine workflow. Candidate gene sets are evaluated by their incremental recall@20 when appended to the nutraceutical panel and by maximum Jaccard overlap with the existing atlas. (b) Round-2 incremental recall@20 for seven frontier-aging concepts. Two candidates showed nominally positive increments; neither survived Benjamini–Hochberg correction across seven concepts.
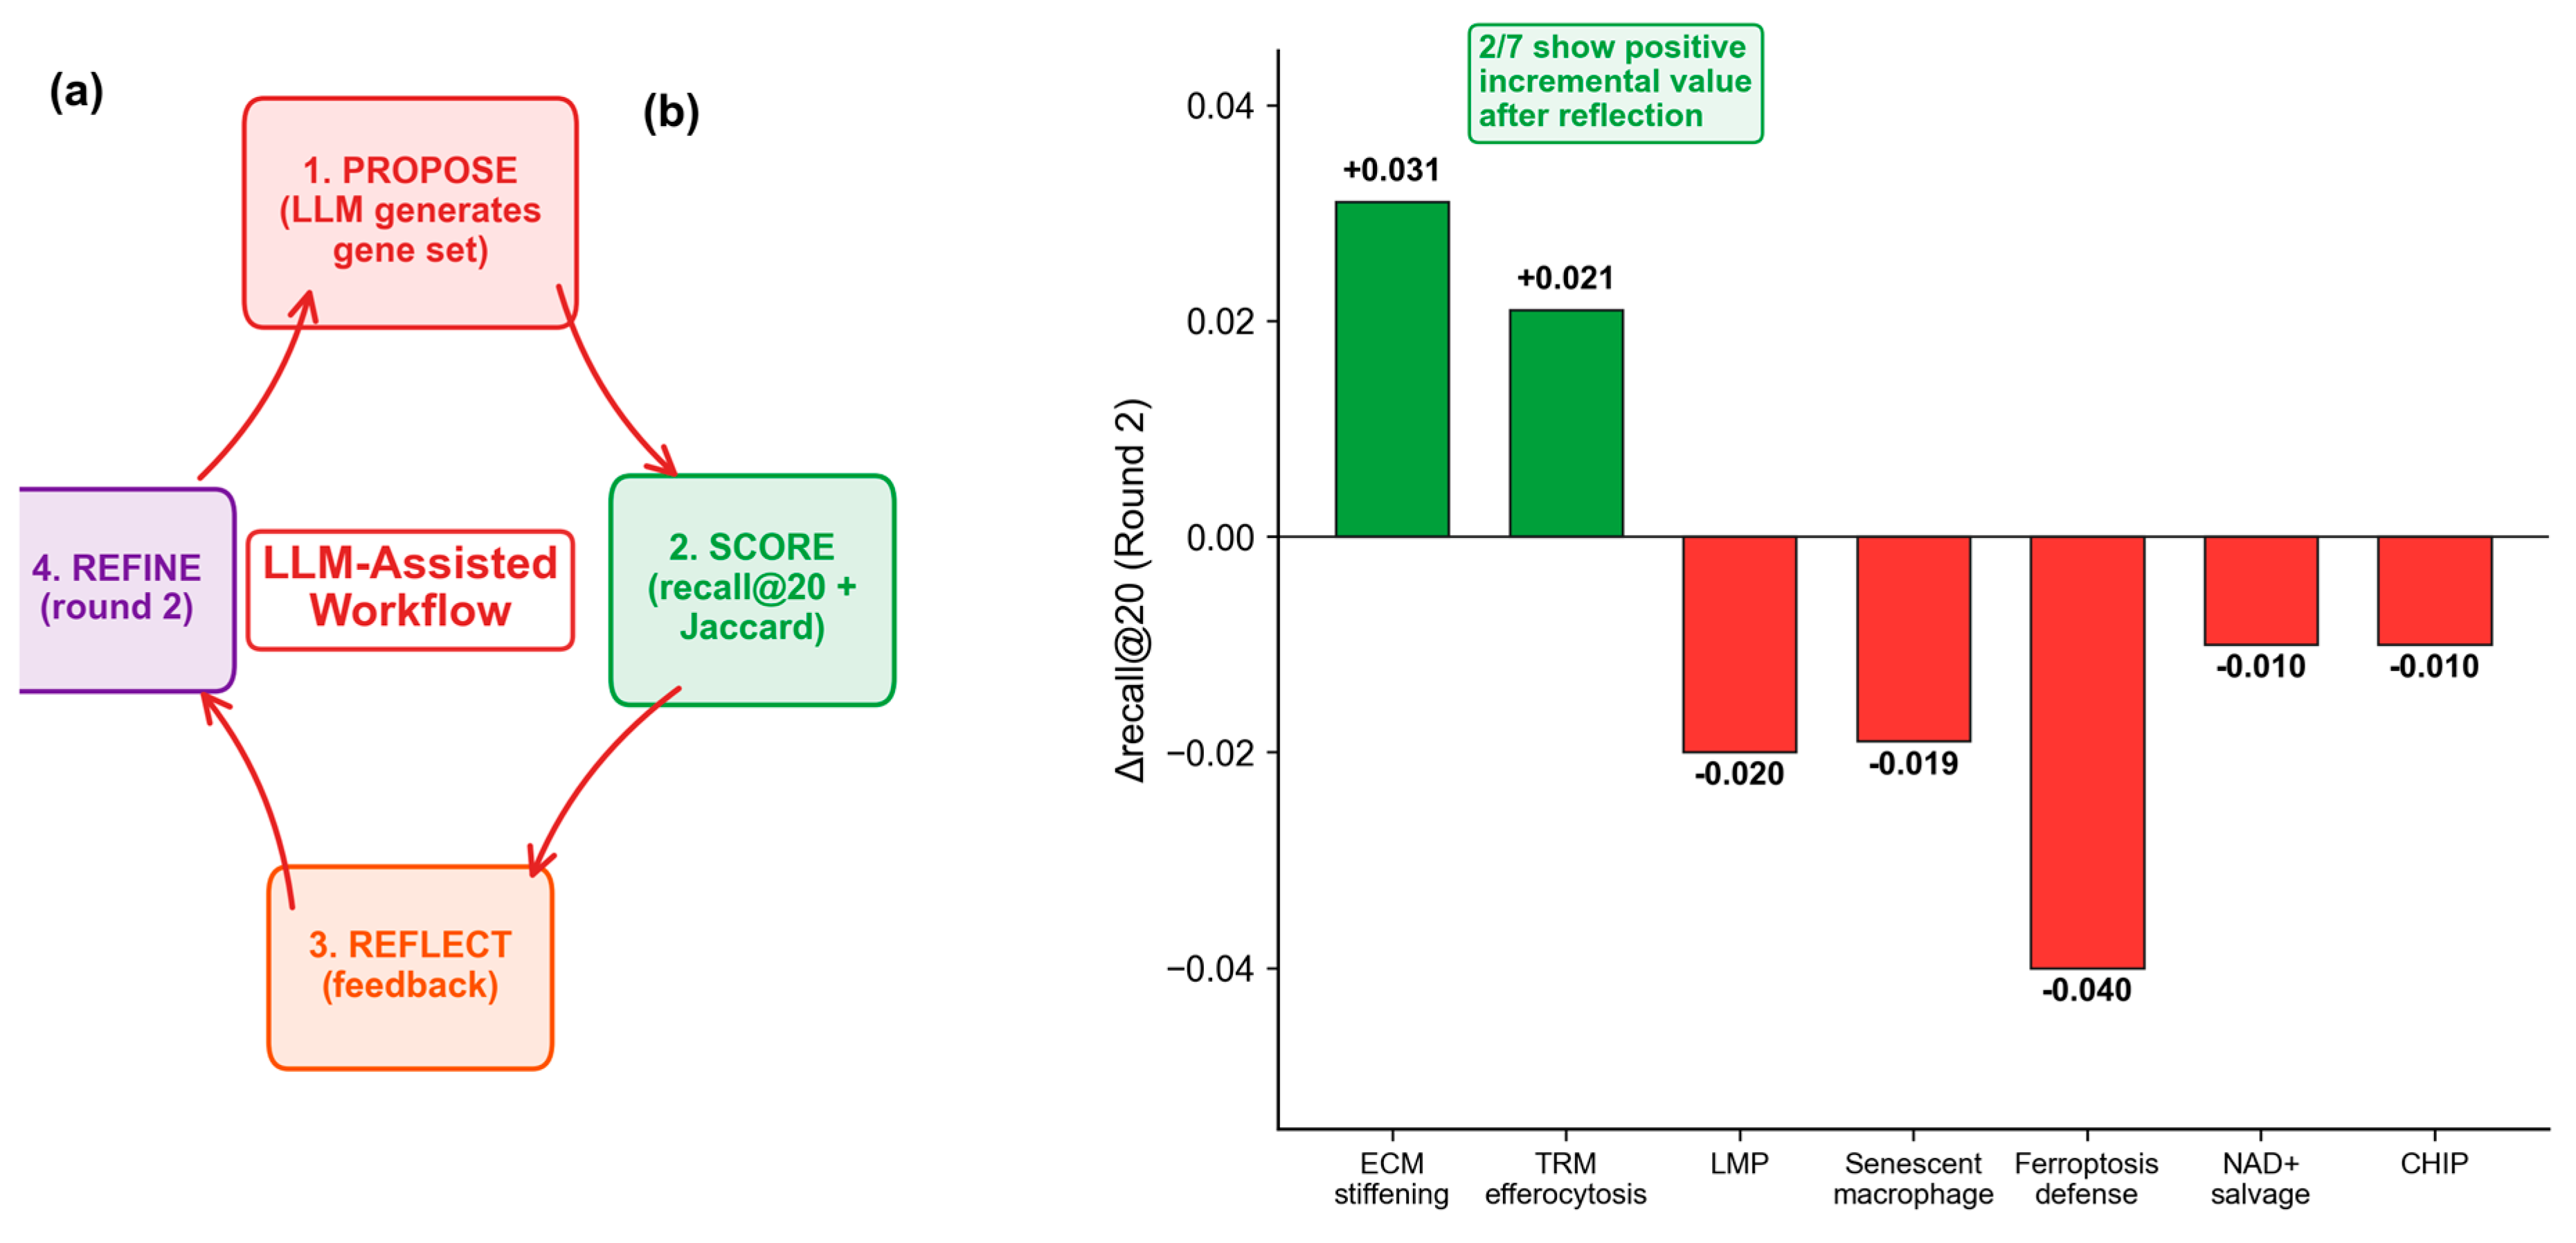

Table 1.
Five-disease average recall@20 by panel (5-fold CV, 3 seeds, 1,916 drugs). Excess gain = recall@20(real) − recall@20(permutation null). 95% CI from 200 permutations.
Table 1.
Five-disease average recall@20 by panel (5-fold CV, 3 seeds, 1,916 drugs). Excess gain = recall@20(real) − recall@20(permutation null). 95% CI from 200 permutations.
| Panel | Dimensions | recall@20 (real) | recall@20 (perm null) | Excess gain | 95% CI |
| A4 immunity (6) | 6 | 0.121 | 0.017 ± 0.013 | 0.104 | 0.091–0.117 |
| TCM proxies (38) | 38 | 0.324 | 0.025 ± 0.017 | 0.299 | 0.282–0.315 |
| Extended aging hallmarks (72) | 72 | 0.433 | 0.027 ± 0.014 | 0.406 | 0.392–0.421 |
| NUT+NUTX (117) | 117 | 0.494 | 0.028 ± 0.016 | 0.466 | 0.450–0.482 |
| Reference union / ALL (332) | 332 | 0.524 | 0.032 ± 0.019 | 0.491 | 0.473–0.510 |
Table 2.
Cross-method comparison: 5-disease average recall@20 on the 332-feature atlas. Values are not directly comparable to the panel-level estimates in Table 1, which uses a different CV aggregation protocol.
Table 2.
Cross-method comparison: 5-disease average recall@20 on the 332-feature atlas. Values are not directly comparable to the panel-level estimates in Table 1, which uses a different CV aggregation protocol.
| Method | T2D | Hypertension | Depression | Osteoporosis | Atherosclerosis | Avg |
| LogisticRegression | 0.55 | 0.75 | 0.55 | 0.25 | 0.35 | 0.49 |
| RandomForest | 0.55 | 0.80 | 0.70 | 0.30 | 0.15 | 0.50 |
| GradientBoosting | 0.45 | 0.75 | 0.65 | 0.10 | 0.10 | 0.41 |
| MLP | 0.75 | 0.95 | 0.70 | 0.30 | 0.40 | 0.62 |
| XGBoost | 0.75 | 0.90 | 0.75 | 0.35 | 0.55 | 0.66 |
Table 3.
Agent-driven module discovery: incremental value and redundancy (Round 2 results shown).
| Concept | Genes (LCC) | Δrecall@20 | Max Jaccard | Top overlap |
| ECM stiffening | 485 | +0.031 | 0.155 | A1_extracellular_matrix |
| TRM efferocytosis | 113 | +0.021 | 0.066 | A4_macrophage_activation |
| LMP | 136 | −0.020 | 0.196 | A1_autophagy |
| Senescent macrophage | 256 | −0.019 | 0.128 | A3_lipid_metabolism |
| Ferroptosis defense | 55 | −0.040 | 0.076 | nutraceutical panel (highest-overlap module name omitted) |
| NAD+ salvage | 15 | −0.010 | 0.444 | nutraceutical panel (highest-overlap module name omitted) |
| CHIP | 24 | −0.010 | 0.100 | food-as-medicine panel (highest-overlap module name omitted) |
Disclaimer/Publisher’s Note: The statements, opinions and data contained in all publications are solely those of the individual author(s) and contributor(s) and not of MDPI and/or the editor(s). MDPI and/or the editor(s) disclaim responsibility for any injury to people or property resulting from any ideas, methods, instructions or products referred to in the content. |
© 2026 by the authors. Licensee MDPI, Basel, Switzerland. This article is an open access article distributed under the terms and conditions of the Creative Commons Attribution (CC BY) license (http://creativecommons.org/licenses/by/4.0/).
Copyright: This open access article is published under a Creative Commons CC BY 4.0 license, which permit the free download, distribution, and reuse, provided that the author and preprint are cited in any reuse.