

Submitted:
13 August 2026
Posted:
14 August 2026
You are already at the latest version
Abstract
Water-loss indicators answer different management questions, yet they are often used as interchangeable rankings. This exploratory study examines the 2024 and 2025 IWA water balances of eleven Greek water service providers documented under a harmonised regulatory framework, together with the twelve Infrastructure Leakage Index (ILI) values that seven of those providers declared in their regulatory reference tables or that could be reproduced from their WB-EasyCalc files. In 2025 non-revenue water (NRW) ranged from 26.7% to 71.1% of system input volume (mean 46.2%). For Fournoi Korseon and Trifylia, billed-unmetered consumption represented 36.6 and 31.6 percentage points of system input, respectively; plausible errors in these estimates therefore transfer directly to NRW. Six of the eleven providers declared an identical NRW in both reference years, and for four providers the leakage level declared in the reference table departs from the real losses in their own water balance by 3.8 to 17.5 percentage points. The declared ILI values span 1.25 to 21.40, but average pressure is stated for only four of the seven ILI cases and measured in none, two systems fall below the 2009 minimum-size expression, and one case (Chios, 2023) operates under a four-hour supply regime. Interpretation therefore depends on data completeness, pressure documentation and supply regime rather than on the indicator value alone. The findings support multi-indicator reporting: NRW as both percentage and volume, billing-meter coverage, real losses per connection and per kilometre when pressurised, and ILI as a supplementary metric accompanied by its inputs and uncertainty. The purposive sample and top-down loss estimates preclude national generalisation or inferential ranking claims.
Keywords:
non-revenue water
; Infrastructure Leakage Index
; UARL
; benchmarking
; data quality
; intermittent supply
; Greece
1. Introduction
Non-revenue water (NRW) remains a major operational and financial concern for water utilities. Global estimates place the annual volume at more than 100 billion m³, while recent European evidence shows large variation among countries and utilities [1,2]. A standard water balance is therefore essential, but the indicator selected from that balance determines what is compared. A percentage of system input volume is readily understood; it is also influenced by consumption, exports and the completeness of billed consumption. A technically focused indicator may reduce those denominator effects while introducing requirements of its own.
The International Water Association (IWA) water balance separates authorised consumption from apparent and real losses and recommends a family of indicators rather than a single score [3,4,5,6]. The Infrastructure Leakage Index (ILI) is the ratio of Current Annual Real Losses (CARL) to Unavoidable Annual Real Losses (UARL). UARL is calculated from mains length, number of service connections, private-pipe length and average pressure [7,8]. In principle, ILI compares current leakage-management performance with a system-specific technical reference. NRW%, by contrast, relates unbilled water to system input and is useful for resource and revenue oversight [9]. The two indicators should not be expected to answer identical questions.
Their interpretation also depends on source data. Top-down water balances are sensitive to bulk-meter error, customer-meter under-registration and estimated consumption [10,11,12]. ILI additionally depends on the completeness of network length, the definition of service connections, meter location and a defensible average pressure. Application guidance has evolved since the original UARL publication. By 2009 the earlier lower limit of 20 connections/km had been removed, and the minimum-size check was expressed as Nc + 20Lm > 3000; connection density remained relevant primarily to the choice of a per-connection or per-kilometre volumetric indicator [13]. More recent guidance recommends a system correction factor (SCF) when size, pressure, burst behaviour or pipe materials make the standard UARL a poor approximation [15,16]. It is therefore inaccurate to treat a fixed density threshold as an automatic test of ILI validity.
Pressure is an intended part of UARL, not a nuisance variable. Leakage varies with pressure and pipe response, and the FAVAD literature shows that the pressure exponent can depart substantially from one [22,23,24,25]. This makes measured, zone-weighted pressure preferable to a single engineering estimate. Intermittent supply adds another layer: CARL, customer-meter error and time-normalised indicators become sensitive to filling, emptying and the time for which the network is pressurised [19,20,21,38,42]. In such systems, indicator values require an explicit supply-regime label.
The regulatory setting is changing. Directive (EU) 2020/2184 requires leakage assessment using ILI or another appropriate method for providers above the Directive's size thresholds [26]. Italy's technical-quality framework reports both percentage and linear losses, with linear losses expressed in m³/km/day, while Ofwat publishes leakage performance in absolute and normalised volumetric forms [27,28]. These examples favour transparent indicator sets over a universal percentage threshold.
Greece now provides a useful, though not nationally representative, setting for examining these issues. Law 5037/2023 extended the remit of the Regulatory Authority for Waste, Energy and Water (RAAEY) to water services, and the managerial-adequacy process introduced common documentation templates [30,31,32,33]. Earlier Greek studies have documented both urban-network performance and the constraints facing small settlements and islands [43,44,45]. The present study uses the dossiers of eleven providers as a purposive multi-provider benchmark. It asks: (i) what do the 2024 and 2025 water balances show descriptively; (ii) how strongly can metering practice affect NRW%; (iii) how should the declared ILI values be interpreted when the denominator inputs are documented to different degrees; and (iv) what reporting scheme is defensible with the information already collected. The study is explicitly exploratory. It does not claim a national test of ranking agreement.
2. Materials and Methods
2.1. Study Design, Data Source and Sample
The source material comprises documentation dossiers prepared for the Greek managerial-adequacy framework [30,31,32,33]. Eleven retained providers had complete water-balance tables for both the 2024 and 2025 cycles and form the benchmark sample. Two data streams were used for leakage. The first is the Table B2 reference table of each dossier, which records the declared non-revenue water of the internal network (field D.1.4), the declared leakage level (field D.2.1) and, for some providers, the ILI itself with its CARL and UARL (field D.2.2), separately for 2024 and 2025. Five providers—Aktio-Vonitsa, Alonnisos, Fournoi Korseon, Leros and Sifnos—declared an ILI for both reference years in that table. The second stream is the WB-EasyCalc file, available with sufficient fields to reproduce an ILI case for Chios (2023) and Souli (2025) [34]. Seven providers and twelve provider-year values therefore enter the ILI analysis, while the remaining four providers—Chios excepted—report leakage only as a percentage or as an annual volume per kilometre of mains. No provider outside this retained set enters either the water-balance benchmark or the ILI analysis. A value from one year was never combined with infrastructure data from another year.
Sampling was purposive and based on dossier availability. The common templates improve definitional consistency, but they do not make the sample representative of all Greek providers and do not guarantee that submitted values were independently measured; this distinction is central to responsible benchmarking [29]. Provider names are retained as requested by the data holders. Administrative population context was cross-checked against the 2021 census [35], although population is not used as an analytical denominator. Table 1 identifies which providers contribute to the balance benchmark and which contribute an ILI case, and with what reference year and source.
2.2. Water-Balance and Volumetric Indicators
The submitted balances follow the IWA structure [3,4]. System Input Volume (SIV) is divided into authorised consumption and water losses; losses are divided into apparent and real losses. NRW was calculated from billed authorised consumption (BAC):
NRW (%) = (SIV − BAC) / SIV × 100
Real losses were also expressed per service connection and per kilometre of mains. For intermittent service, both indicators were normalised to the period for which the system was pressurised:
qRL = CARL × 1000 / [Nc × (T/24)] [L connection⁻¹ day⁻¹, w.s.p.]
qL = CARL / [Lm × (T/24)] [m³ km⁻¹ day⁻¹, w.s.p.]
Here, CARL is the mean daily real-loss volume (m³/day), Nc is the number of service connections, Lm is mains length (km), T is the mean number of hours per day for which the system is pressurised, and w.s.p. means 'when system pressurised'. Equation (3) uses m³/km/day, consistent with the unit used by ARERA [27]. For continuous systems T = 24. Metering coverage of billing was calculated as billed metered consumption divided by the sum of billed metered and billed unmetered consumption. Where the dossier reported real losses only as an annual volume per kilometre of mains, mains length was recovered by dividing CARL by that value; the recovered length is identified as such wherever it is used.
2.3. ILI Calculation and Sensitivity Analysis
The standard UARL and ILI equations were reproduced as follows [7,8,13,14,15,16]:
UARL (L/day) = (18Lm + 0.8Nc + 25Lp)P
ILI = CARL / UARL
Lp is total private-pipe length from the property boundary to the customer meter (km), and P is average operating pressure (m). Private-pipe length is documented in none of the dossiers. Where an average pressure is stated, mean private-pipe length per connection was reconstructed from the declared UARL and the other inputs: this gives 15.0 m/connection for Sifnos and Souli and 15.1 m for Chios, all consistent with the values normally assumed. For Aktio-Vonitsa the same calculation returns only 3.9 m/connection, because the UARL implied by its declared ILI (440 m³/day) is smaller than the standard equation would give for the stated 200 km of mains at 35 m; applying 15 m of private pipe per connection to the same Lm and P raises UARL to 537 m³/day and lowers the 2025 ILI from 21.4 to 17.5, which is the lower bound of the scenario range stated in that dossier. For Leros, Alonnisos and Fournoi Korseon no average pressure is stated, so pressure and private-pipe length cannot be separated and neither was reconstructed. For Chios, the reported UARL of 503 m³/day represents four hours of pressure and corresponds to 3018 m³/day on a 24-hour-equivalent basis (503 × 24/4).
Sensitivity was examined descriptively. For Souli, ILI was recalculated over pressure scenarios of 30–70 m while holding CARL and other inputs fixed. The dossier value of 60 m is treated as an unverified assumption, not as a measured mean pressure. A one-at-a-time ±20% perturbation was also applied to P, Lm, Nc and private-pipe length. These calculations measure numerical dependence on inputs; they do not demonstrate that the ILI is physically incorrect. The connection-density plots likewise illustrate the normalisation built into UARL. Density below 20 connections/km is used only to motivate reporting m³/km/day alongside L/connection/day, not to invalidate ILI [13]. The 2009 minimum-size expression Nc + 20Lm > 3000 was evaluated for every ILI case and is reported with the inputs.
2.4. Data-Quality Assessment and Analytical Scope
No inferential test of ranking agreement was performed. The eleven providers supply a descriptive benchmark rather than a random sample, and the ILI cases differ in the completeness of their denominator documentation; one of them (Chios) is from an earlier reference year and operates under intermittent supply. A rank-correlation coefficient computed on this material would be driven by documentation quality as much as by physical performance. Similarly, Bland–Altman analysis of normalised ranks would not evaluate agreement between measurements on a common scale. Results are therefore reported as ranges, year-on-year comparisons, case contrasts and sensitivity scenarios.
Five data-adequacy domains were screened for each ILI case: network-length completeness, pressure documentation, supply-regime comparability, CARL/calculation consistency and documentation of private-pipe length. The screen records issues evident in the submitted material; it is not an external audit. Aktio-Vonitsa was flagged because its 200 km mains length and its 10,000 connections are both stated as estimates and no separate connection register is kept. Leros and Alonnisos were flagged because no average pressure is stated in the reference table. Fournoi Korseon was flagged because CARL, UARL and ILI are identical in both reference years. Chios was flagged for intermittent supply. Souli was flagged because 60 m has not been independently confirmed and because the CARL in the WB-EasyCalc file is not reconciled with the leakage level declared in the same dossier. Top-down CARL estimates and uniform component allocations were treated as general limitations [10,11,12,19,40,41].
3. Results
3.1. Descriptive 2025 Benchmark
Across the eleven 2025 water balances, NRW ranged from 26.7% for Fournoi Korseon to 71.1% for Aktio-Vonitsa, with an unweighted mean of 46.2% (Table 2; Figure 1a). Real losses ranged from 22.0% to 67.5% of SIV. Apparent losses occupied a narrower reported range of 2.7–7.6%. Because apparent losses were relatively uniform in the submitted balances, the NRW ordering closely followed the reported real-loss shares. This is a property of the sample and its estimation procedures, not evidence that apparent losses are truly uniform among Greek providers.
The six island providers had a mean NRW of 49.1%, compared with 42.7% for the five mainland providers. Within-group ranges were much larger than the difference between means: 26.7–66.5% for islands and 30.6–71.1% for mainland providers. The sample is too small and non-random for an island effect to be inferred; broader studies likewise show that structural conditions explain only part of cross-utility variation [45,46].
3.2. Balance Composition and Metering Exposure
The balance composition shows two distinct billing structures (Figure 2). Fournoi Korseon and Trifylia reported billed-unmetered consumption equal to 36.6% and 31.6% of SIV, or 50.0% and 45.5% of their billed consumption. The remaining providers were almost fully metered in the submitted balance. Billed-unmetered consumption is legitimately classified as revenue water. The comparability issue is evidential: its volume is estimated rather than registered, and any estimation error transfers one-for-one to NRW [12,36,37,38,39].
A 10%, 20% or 30% error in the billed-unmetered estimate would change NRW by 3.7, 7.3 or 11.0 percentage points in Fournoi Korseon and by 3.2, 6.3 or 9.5 points in Trifylia (Table 4; Figure 3). The full 'metered-only' case is therefore used only as maximum structural exposure: it shows how much of reported performance rests on the unmetered estimate, not the likely error. No evidence in the dossiers establishes the direction or magnitude of the actual error.
3.3. The Declared ILI Cases
Table 5 reports the denominator inputs for the seven ILI cases and evaluates the 2009 size expression Nc + 20Lm > 3000 [13]. Five of the seven cases satisfy it; Alonnisos (2,526) and Fournoi Korseon (1,108) do not, which places their standard UARL outside the range for which the equation was calibrated and indicates that a system correction factor should be considered. Low connection density is a different matter: Souli (14.9 connections/km), Chios (17.7) and Sifnos (20.8) sit at or below the conventional threshold, but this governs the choice of volumetric unit rather than the validity of ILI. The material questions are whether the network and connection counts are complete, whether pressure is documented and representative, and whether CARL and time under pressure are comparable. Average pressure is stated for only four of the seven cases, it is a measured, zone-weighted value in none, and for Souli it is expressly an unverified assumption.
The twelve declared values span an ILI of 1.25–21.40, a qRL of approximately 122–942 L/connection/day w.s.p. and a qL of 2.7–47.1 m³/km/day w.s.p. (Table 6; Figure 4). These ranges are descriptive. The apparent association between ILI and qRL is partly mechanical because both contain CARL, and ILI can be written as qRL divided by the per-connection UARL normaliser. It should not be presented as independent evidence that one measure validates or replaces the other. Year-on-year movement is small in every case that reports two years: Aktio-Vonitsa rises from 21.0 to 21.4, Alonnisos from 5.7 to 6.5, Leros falls from 13.4 to 13.0, Sifnos falls from 2.25 to 2.11, and Fournoi Korseon repeats 3.39 unchanged.
Aktio-Vonitsa, Chios and Souli illustrate three different interpretation problems. Aktio-Vonitsa reports the highest values in the sample, an ILI of 21.4 and 942 L/connection/day w.s.p. in 2025, but both its mains length (200 km) and its connection count (10,000) are declared estimates, and the dossier itself gives a scenario range of 17.4–26.8. Chios combines a 2023 ILI of 11.06 with four hours of daily supply, so its time-normalised loss indicators are not directly comparable with continuously supplied systems without an explicit regime label. Souli has a 2025 ILI of 1.25 under an assumed pressure of 60 m; because that pressure has not been confirmed, the value is a scenario result rather than a measurement. The contrast between the highest and the lowest value in the sample therefore reflects documentation quality at least as much as network condition.
3.4. Sensitivity of the ILI Denominator
Normalising UARL per connection gives (18/d + 0.8 + 25λp)P, where d is connection density and λp is private-pipe length per connection in kilometres. Figure 5 shows the expected consequence: a sparse system has more mains per connection and therefore a larger per-connection technical reference. This is the purpose of normalisation, not evidence that ILI 'breaks'. The seven cases span a per-connection normaliser of 36–143 L/connection/day, and their position relative to the reference curves is consistent with the pressures they declare. The practical vulnerability appears when d is wrong because mains length is incomplete or estimated, as in Aktio-Vonitsa and Souli, or when P is a weakly supported system-wide estimate or absent altogether, as in Leros, Alonnisos and Fournoi Korseon.
For Souli, keeping CARL and all non-pressure inputs fixed gives ILI values of 2.14 at 35 m, 1.66 at 45 m and 1.25 at 60 m (Figure 6a). This range does not identify the correct ILI; it shows why the 60 m input must be verified. The one-at-a-time perturbation confirms direct inverse sensitivity to pressure, which alone moves the index by −16.7% and +25.0% for a ±20% change, and smaller, case-specific sensitivity to mains length (−9.2% and +11.3%), connection count (−6.3% and +7.2%) and private-pipe length (−3.0% and +3.2%) (Figure 6b). A defensible interpretation therefore requires a measured or hydraulically weighted average pressure and confidence limits for CARL [13,14,40].
3.5. Data Adequacy and Limits of the Submitted Balances
The data-adequacy screen (Figure 7) replaces a pass/fail matrix based on obsolete fixed thresholds. No case is free of documentation gaps. Sifnos is the closest to complete: its network length, CARL and supply regime raise no evident inconsistency, although its external-network loss remains a 10% assumption and its private-pipe length is reconstructed. Every other case carries at least one issue that materially affects comparison: estimated mains length and connection count in Aktio-Vonitsa, undocumented pressure in Leros, Alonnisos and Fournoi Korseon, values repeated unchanged between reference years in Fournoi Korseon, intermittent operation in Chios, and unverified pressure together with an unreconciled CARL in Souli. Private-pipe length is documented in none of the seven cases and was reconstructed throughout. These flags call for verification or scenario reporting; they do not prove that the underlying networks perform well or poorly.
Two further patterns limit the register's analytical resolution. The first concerns internal consistency. For seven of the eleven providers the leakage level declared in field D.2.1 of the reference table matches the real losses in the submitted water balance to within 0.1 percentage points, but for four it does not: the gap is 17.5 points for Limnos, 9.6 for Souli, 9.0 for Chios and 3.8 for Korinthos (Table 3; Figure 8a). In Souli the same divergence appears in absolute terms, because the WB-EasyCalc CARL of 1249 m³/day implies 455,885 m³/year, or 35.4% of system input, against the 25.0% declared in the reference table. Two fields of the same dossier therefore describe different quantities of leakage, and a benchmark assembled from either field alone would rank these providers differently. The second concerns the composition of the loss estimate: nine of the eleven 2025 balances used the same 72.2/5.6/22.2 split of real losses among mains, storage and service connections (Figure 8b). That fixed allocation is a bookkeeping assumption, not evidence about where leakage occurs. Intervention design would require district metering, minimum-night-flow analysis or other field evidence [40,41].
3.6. Proposed Reporting Scheme
Table 7 translates the findings into a tiered reporting scheme. Tier 1 retains NRW as both percentage and annual volume and adds billing-meter coverage. Tier 2 reports real losses in both L/connection/day and m³/km/day when system pressurised; the preferred comparator can then be selected according to network density and management purpose. Tier 3 reports ILI only with the UARL inputs, supply regime, calculation year and an account of data quality. The incremental reporting burden is low because most inputs already exist in the dossier, but reliable pressure may require new monitoring: in the present sample it was stated for four of seven ILI cases and measured in none.
4. Discussion
4.1. Indicator Disagreement Should Not Be Overstated
This analysis does not support the claim that NRW and ILI produce an almost inverted ranking. The two indicators are documented to different depths in the same dossiers, and the cases with the most extreme ILI values are also the cases with the weakest denominator evidence. What the data do support is narrower and more useful: NRW%, volumetric losses and ILI encode different denominators; their values can diverge for understandable reasons; and data quality can dominate interpretation in a small benchmark. This framing is consistent with the IWA indicator-family approach and with recent critiques of using any single loss indicator for asset-management targets [3,9,17].
NRW% is informative about the share of input volume that does not generate revenue, but it does not isolate infrastructure condition. High consumption can reduce the percentage for an unchanged loss volume, while low consumption can increase it. ILI normalises CARL to asset exposure and pressure, but its interpretability depends on the credibility of those inputs. The per-connection and per-kilometre indicators are transparent volumetric measures, yet they also answer different questions and are influenced by density. No single metric is denominator-free. The reconciliation gaps documented here add a further caution: before indicators are compared at all, the fields from which they are read must be shown to describe the same quantity.
4.2. Metering Coverage Is Part of Indicator Quality
The strongest empirical finding concerns billed-unmetered consumption. For two providers, a large share of apparent performance depends on an estimated revenue-water component. The ±10–30% scenarios avoid presenting the full metered-only counterfactual as a statistical uncertainty band. They show that even moderate proportional error could shift NRW by several percentage points. The correct regulatory response is not to reclassify lawful billed-unmetered consumption as loss, but to publish billing-meter coverage and the estimation method alongside NRW [5,12,36,37,38,39].
This requirement would also improve international comparability. ARERA's technical-quality framework conditions its loss indicator on process and customer-meter coverage, illustrating that an indicator can be paired with data-quality prerequisites [27]. For the Greek framework, the necessary first step is a reproducible audit trail: source volume, estimation rule, population or connection basis, and uncertainty range. Full volumetric metering may be a long-term objective, but the present data do not establish its economic feasibility for every small provider.
4.3. ILI in Small and Intermittently Supplied Systems
A rule-based interpretation can treat 3000 connections, 20 connections/km, a 25–100 m pressure range and continuous supply as four universal applicability criteria. That interpretation is not supported by the updated history of UARL guidance. The density restriction was removed, the size criterion evolved, and SCF methods were developed for small systems and pressure/pipe combinations where the standard equation may misestimate the technical reference [13,15,16]. Evidence from small supplies nevertheless shows why input quality and uncertainty remain important [18]. The present sample makes the distinction concrete. Souli, Chios and Sifnos fall at or below 20 connections/km yet satisfy the size expression comfortably, so their ILI can be computed and reported provided the volumetric indicators accompany it. Alonnisos and Fournoi Korseon are the opposite case: their densities are high, but Nc + 20Lm is 2,526 and 1,108, below the threshold at which the standard UARL was calibrated. For those two systems an SCF-adjusted reference, or reporting restricted to the volumetric indicators, is the more defensible option.
Intermittent supply requires separate treatment. Chios's four-hour regime changes both qRL and qL by a factor of six relative to a calendar-day expression and reduces UARL in proportion to time under pressure. Repeated filling and transient flows also affect water-balance and customer-meter error [19,20,21,38,42]. The numerical ILI can be reported, but comparisons must retain the w.s.p. basis, supply duration and method used to estimate CARL. A continuously supplied utility should not be compared with Chios through an unlabelled single number.
4.4. Regulatory Implications
The proposed hierarchy is compatible with Directive (EU) 2020/2184 because the Directive permits ILI or another appropriate method [26]. It also follows current practice in which regulators publish complementary measures rather than a single percentage [27,28]. Percentage NRW remains useful for communication and resource accounting; absolute NRW links performance to water and financial consequences; qRL and qL provide transparent physical normalisations; and ILI adds a technical reference when inputs are auditable. Reporting annual volumes also supports the resource-efficiency and cost-recovery context of the Water Framework Directive [48].
Target setting should occur within comparable system types and should consider the economic level of leakage, service standards, scarcity and intervention cost [47]. A low ILI does not prove that further reduction is uneconomic, and a high NRW percentage does not by itself identify the most cost-effective project. The dossier can support screening, but funding decisions require verified measurements, pressure information and an intervention appraisal. The companion carbon analysis addresses a separate consequence of the same losses and should be disclosed to the editor as a related manuscript [49].
4.5. Limitations
Five limitations bound the results. First, the benchmark contains eleven purposively selected providers and is not representative of the Greek sector. Second, the ILI analysis covers seven of those eleven providers; five contribute both reference years from the regulatory reference table, while Chios contributes a 2023 case and Souli a 2025 case from WB-EasyCalc, so the twelve values are not a balanced panel. Third, CARL is based on top-down balances rather than independent minimum-night-flow estimates. Fourth, several infrastructure inputs are estimates or were recovered from derived quantities, and private-pipe length was reconstructed rather than read from an independently verified source table. Fifth, the metering analysis evaluates sensitivity to assumed error; it does not estimate actual billed-unmetered consumption error. These limitations preclude causal inference, national prevalence estimates and provider league tables.
5. Conclusions
The 2025 benchmark sample reported NRW between 26.7% and 71.1% of system input volume, with a mean of 46.2%. That range is a useful descriptive signal, but its interpretation depends on how billed consumption and apparent losses were estimated. In Fournoi Korseon and Trifylia, billed-unmetered consumption created substantial structural exposure: a 20% error in that estimate would change NRW by 7.3 and 6.3 percentage points, respectively. Adding the second reference year shows how little of the register moves: six of the eleven providers declare an identical NRW in 2024 and 2025, and only Korinthos changes by more than three percentage points.
The twelve declared ILI values, spanning 1.25 to 21.40, should be read as documented cases rather than as a ranking. Average pressure is stated for four of the seven providers and measured for none; mains length is an estimate in Aktio-Vonitsa and the CARL is unreconciled in Souli; private-pipe length is documented nowhere; Fournoi Korseon repeats its inputs unchanged between years; and Chios operates four hours a day. Two systems, Alonnisos and Fournoi Korseon, fall below the 2009 minimum-size expression and would be better served by an SCF-adjusted reference or by volumetric indicators alone. Conversely, the standard UARL equation should not be rejected merely because density is below 20 connections/km; current guidance treats density primarily as a unit-selection issue. A separate finding concerns internal consistency: in four of the eleven dossiers the declared leakage level and the real losses in the same provider's water balance differ by between 3.8 and 17.5 percentage points, so the field from which an indicator is read must itself be specified.
A defensible regulatory output is a transparent indicator set: NRW in percentage and volume, billing-meter coverage, real losses per connection and per kilometre when pressurised, and ILI with all denominator inputs, year, supply regime and uncertainty. This approach does not eliminate judgment. It makes the basis for that judgment visible and identifies where new measurement is required before targets or investment priorities are set.
Author Contributions
Conceptualisation, A.C.; methodology, A.C. and P.T.N.; software, A.C.; formal analysis, A.C.; investigation, A.C.; resources, A.C.; data curation, A.C.; writing—original draft preparation, A.C.; writing—review and editing, A.C., D.P. and P.T.N.; visualisation, A.C.; supervision, P.T.N. and D.P. All authors have read and agreed to the published version of the manuscript.
Funding
This research received support from WEST Consulting P.C. through the employment of A.C. WEST Consulting P.C. also prepared part of the source documentation described in the Conflicts of Interest statement. No external grant was received.
Data Availability Statement
The primary data derive from managerial-adequacy documentation dossiers submitted to RAAEY by the named providers, principally the Table B2 reference tables and the accompanying water balance and leakage reports. The derived numerical values used in this analysis are reproduced in Table 2, Table 3, Table 4, Table 5 and Table 6. Source dossiers contain provider operational information and are available from the corresponding author subject to provider authorisation. The underlying submissions were not independently audited for this study.
Acknowledgments
The authors thank the technical services of the participating providers for access to the documentation dossiers and for operational clarifications. During the preparation and revision of this manuscript, the authors used AI tools to support English-language editing, stylistic refinement, structural organization, consistency checks across the text, tables, and figures, and the preparation of selected visualizations and supplementary tables. The tool was not used to generate primary data, determine the study results, or make final methodological or interpretive decisions. All AI-assisted output was critically reviewed, verified against the underlying data and cited sources, and revised by the authors, who take full responsibility for the accuracy, integrity, and final content of the manuscript.
Conflicts of Interest
Author Angelos Chasiotis was employed by the company WEST Consulting P.C. The authors declare that this study received funding from WEST Consulting P.C. The funder had the following involvement with the study: prepared a subset of the documentation dossiers used as source material. This source-data dependence is disclosed, and no claim of independent verification of provider submissions is made.
References
- Liemberger, R.; Wyatt, A. Quantifying the Global Non-Revenue Water Problem. Water Supply 2019, 19, 831–837. [Google Scholar] [CrossRef]
- van Thienen, P.; Steffelbauer, D.B.; Vertommen, I. Water Loss Management in Europe: Perceptions, Drivers, Responses/Strategies, and Results. Water Pract. Technol. 2025, 20, 1921–1938. [Google Scholar] [CrossRef]
- Alegre, H.; Baptista, J.M.; Cabrera, E., Jr.; Cubillo, F.; Duarte, P.; Hirner, W.; Merkel, W.; Parena, R. Performance Indicators for Water Supply Services, 3rd ed.; IWA Publishing: London, UK, 2016. [Google Scholar] [CrossRef]
- Lambert, A.O.; Hirner, W. Losses from Water Supply Systems: Standard Terminology and Recommended Performance Measures; IWA Blue Pages: London, UK; International Water Association, 2000. [Google Scholar]
- American Water Works Association. M36 Water Audits and Loss Control Programs, 4th ed.; AWWA: Denver, CO, USA, 2016; ISBN 9781625761002. [Google Scholar]
- Lambert, A.O. International Report: Water Losses Management and Techniques. Water Sci. Technol. Water Supply 2002, 2, 1–20. [Google Scholar] [CrossRef]
- Lambert, A.O.; Brown, T.G.; Takizawa, M.; Weimer, D. A Review of Performance Indicators for Real Losses from Water Supply Systems. J. Water Supply Res. Technol. 1999, 48, 227–237. [Google Scholar] [CrossRef]
- Lambert, A.O. A Realistic Basis for International Comparison of Real Losses from Public Water-Supply Systems. Water Environ. J. 2000, 14, 186–192. [Google Scholar] [CrossRef]
- Kanakoudis, V.; Tsitsifli, S. Water Volume vs. Revenue Oriented Water Balance and Water Losses Assessment. Desalin. Water Treat. 2015, 54, 2170–2181. [Google Scholar] [CrossRef]
- AL-Washali, T.; Sharma, S.; Kennedy, M. Methods of Assessment of Water Losses in Water Supply Systems: A Review. Water Resour. Manag. 2016, 30, 4985–5001. [Google Scholar] [CrossRef]
- AL-Washali, T.M.; Elkhider, M.E.; Sharma, S.K.; Kennedy, M.D. A Review of Nonrevenue Water Assessment Software Tools. WIREs Water 2020, 7, e1413. [Google Scholar] [CrossRef] [PubMed]
- Vermersch, M.; Carteado, F.; Rizzo, A.; Johnson, E.; Arregui, F.; Lambert, A. Guidance Notes on Apparent Losses and Water Loss Reduction Planning; IWA Water Loss Specialist Group: London, UK, 2016. [Google Scholar]
- Lambert, A.O. Ten Years Experience in Using the UARL Formula to Calculate Infrastructure Leakage Index. In Proceedings of the IWA Water Loss 2009 Conference, Cape Town, South Africa, 28–30 April 2009; Available online: https://www.leakssuitelibrary.com/wp-content/uploads/2020/12/2009_LambertWaterlossCapetown-Update-8Dec.pdf (accessed on 10 August 2026).
- Lambert, A.O.; McKenzie, R.D. Practical Experience in Using the Infrastructure Leakage Index. In Proceedings of the IWA Conference ‘Leakage Management: A Practical Approach’, Lemesos, Cyprus, November 2002. [Google Scholar]
- LEAKSSuite Library. UARL and ILI. Available online: https://www.leakssuitelibrary.com/uarl-and-ili/ (accessed on 10 August 2026).
- LEAKSSuite Library. Low ILIs and Small Systems. Available online: https://www.leakssuitelibrary.com/low-ilis-and-small-systems/ (accessed on 10 August 2026).
- Giustolisi, O.; Ciliberti, F.G.; Mazzolani, G.; Laforgia, D. Effectiveness of Water Loss Performance Indicators for Asset Management. Digit. Water 2024, 2, 1–31. [Google Scholar] [CrossRef]
- Kłosok-Bazan, I.; Boguniewicz-Zabłocka, J.; Suda, A.; Łukasiewicz, E.; Anders, D. Assessment of Leakage Management in Small Water Supplies Using Performance Indicators. Environ. Sci. Pollut. Res. 2021, 28, 41181–41190. [Google Scholar] [CrossRef] [PubMed]
- AL-Washali, T.; Sharma, S.; Lupoja, R.; AL-Nozaily, F.; Haidera, M.; Kennedy, M. Assessment of Water Losses in Distribution Networks: Methods, Applications, Uncertainties, and Implications in Intermittent Supply. Resour. Conserv. Recycl. 2020, 152, 104515. [Google Scholar] [CrossRef]
- AL-Washali, T.; Sharma, S.; AL-Nozaily, F.; Haidera, M.; Kennedy, M. Monitoring Nonrevenue Water Performance in Intermittent Supply. Water 2019, 11, 1220. [Google Scholar] [CrossRef]
- Charalambous, B.; Laspidou, C. Dealing with the Complex Interrelation of Intermittent Supply and Water Losses; IWA Publishing: London, UK, 2017. [Google Scholar] [CrossRef]
- May, J. Pressure Dependent Leakage. World Water Environ. Eng. 1994, 17, 10. [Google Scholar]
- Greyvenstein, B.; van Zyl, J.E. An Experimental Investigation into the Pressure-Leakage Relationship of Some Failed Water Pipes. J. Water Supply Res. Technol. 2007, 56, 117–124. [Google Scholar] [CrossRef]
- van Zyl, J.E.; Cassa, A.M. Modeling Elastically Deforming Leaks in Water Distribution Pipes. J. Hydraul. Eng. 2014, 140, 182–189. [Google Scholar] [CrossRef]
- Marzola, I.; Alvisi, S.; Franchini, M. Analysis of MNF and FAVAD Model for Leakage Characterization by Exploiting Smart-Metering Data: The Case of the Gorino Ferrarese Water Distribution Network. Appl. Sci. 2021, 11, 1758. [Google Scholar] [CrossRef]
- European Parliament and Council. Directive (EU) 2020/2184 of 16 December 2020 on the Quality of Water Intended for Human Consumption (Recast). Off. J. Eur. Union 2020, L 435, 1–62. Available online: https://eur-lex.europa.eu/eli/dir/2020/2184/oj.
- ARERA. Deliberazione 917/2017/R/idr—Regolazione della Qualità Tecnica del Servizio Idrico Integrato (RQTI); ARERA: Milan, Italy, 2017; Available online: https://www.arera.it/fileadmin/allegati/docs/17/917-17all.pdf (accessed on 10 August 2026).
- Ofwat. Leakage Dataset—June 2025; Ofwat: Birmingham, UK, 2025; Available online: https://www.ofwat.gov.uk/publication/leakage-dataset-june-2025/ (accessed on 10 August 2026).
- Berg, S.; Marques, R.C. Quantitative Studies of Water and Sanitation Utilities: A Benchmarking Literature Survey. Water Policy 2011, 13, 591–606. [Google Scholar] [CrossRef]
- Hellenic Republic. Law 5037/2023 (Government Gazette A 78/28.03.2023): Extension of the Regulatory Authority's Scope to Water Services and Urban Waste Management. Available online: https://www.e-nomothesia.gr/index.php/n-5037-2023.html (accessed on 10 August 2026).
- Hellenic Republic. Joint Ministerial Decision YPEN/DSDYY/53924/460/2023 (Government Gazette B 3309/18.05.2023): Criteria for the Assessment of the Managerial Capacity of Water Service Providers. Available online: https://www.e-nomothesia.gr/kat-periballon/apobleta/kya-upen-dsduu-53924-460-2023.html (accessed on 10 August 2026).
- Regulatory Authority for Waste; Energy and Water (RAAEY); Water Sector. Guide for the Preparation of the Managerial Adequacy Documentation Dossier of Water Service Providers, 2026. Available online: https://www.raaey.gr/ydata/anartisi-odigou-gia-tin-katartisi-fakelou-tekmiriosis-diacheiristikis-eparkeias-parochon-ypiresion-ydatos/ (accessed on 10 August 2026).
- Regulatory Authority for Waste, Energy and Water (RAAEY), Water Sector. Water Service Providers. Available online: https://www.raaey.gr/ydata/en/water-service-providers/ (accessed on 10 August 2026).
- Liemberger; Partners. WB-EasyCalc—Free Water Balance Software, Version 6.17; Liemberger & Partners: Pressbaum, Austria, 2021; Available online: https://www.liemberger.cc/ (accessed on 10 August 2026).
- Hellenic Statistical Authority (ELSTAT). 2021 Population–Housing Census: Resident Population; ELSTAT: Piraeus, Greece, 2023. Available online: https://www.statistics.gr/en/2021-census-res-pop-results (accessed on 10 August 2026).
- Mutikanga, H.E.; Sharma, S.K.; Vairavamoorthy, K. Assessment of Apparent Losses in Urban Water Systems. Water Environ. J. 2011, 25, 327–335. [Google Scholar] [CrossRef]
- Karadirek, I.E. An Experimental Analysis on Accuracy of Customer Water Meters under Various Flow Rates and Water Pressures. J. Water Supply Res. Technol. 2020, 69, 18–27. [Google Scholar] [CrossRef]
- Criminisi, A.; Fontanazza, C.M.; Freni, G.; La Loggia, G. Evaluation of the Apparent Losses Caused by Water Meter Under-Registration in Intermittent Water Supply. Water Sci. Technol. 2009, 60, 2373–2382. [Google Scholar] [CrossRef] [PubMed]
- Cobacho, R.; Arregui, F.; Soriano, J.; Cabrera, E., Jr. Including the Effects of Meter Ageing and Metering Errors in Water Balance Calculations. Water Sci. Technol. Water Supply 2015, 15, 1077–1084. [Google Scholar] [CrossRef]
- Morrison, J.; Tooms, S.; Rogers, D. District Metered Areas: Guidance Notes; IWA Water Loss Task Force: London, UK, 2007. [Google Scholar]
- Alkasseh, J.M.A.; Adlan, M.N.; Abustan, I.; Aziz, H.A.; Hanif, A.B.M. Applying Minimum Night Flow to Estimate Water Loss Using Statistical Modeling: A Case Study in Kinta Valley, Malaysia. Water Resour. Manag. 2013, 27, 1439–1455. [Google Scholar] [CrossRef]
- Kumpel, E.; Nelson, K.L. Intermittent Water Supply: Prevalence, Practice, and Microbial Water Quality. Environ. Sci. Technol. 2016, 50, 542–553. [Google Scholar] [CrossRef] [PubMed]
- Kanakoudis, V.; Tsitsifli, S. Results of an Urban Water Distribution Network Performance Evaluation Attempt in Greece. Urban Water J. 2010, 7, 267–285. [Google Scholar] [CrossRef]
- Galiatsatou, P.; Ganoulis, P.; Malamataris, D.; Prinos, P. Estimating and Reducing Leakages in the Water Distribution Networks of Small Settlements: The Case of Agios Germanos in the Prespes Municipality. Water 2024, 16, 2127. [Google Scholar] [CrossRef]
- Kourtis, I.M.; Kotsifakis, K.G.; Feloni, E.G.; Baltas, E.A. Sustainable Water Resources Management in Small Greek Islands under Changing Climate. Water 2019, 11, 1694. [Google Scholar] [CrossRef]
- Meireles, I.; Sousa, V.; Matos, J.P.; Cruz, C.O. Determinants of Water Loss in Portuguese Utilities. Util. Policy 2023, 83, 101603. [Google Scholar] [CrossRef]
- Ahopelto, S.; Vahala, R. Cost–Benefit Analysis of Leakage Reduction Methods in Water Supply Networks. Water 2020, 12, 195. [Google Scholar] [CrossRef]
- European Parliament and Council. Directive 2000/60/EC Establishing a Framework for Community Action in the Field of Water Policy. Off. J. Eur. Communities 2000, L 327, 1–73. Available online: https://eur-lex.europa.eu/eli/dir/2000/60/oj.
- Chasiotis, A.; Piromalis, D.; Nastos, P.T. The Carbon Cost of Leakage: Attributing Electricity-Related Greenhouse Gas Emissions to Real Water Losses in Greek Utilities. Manuscript under review. 2026. [Google Scholar] [CrossRef]
Figure 1.
(a) NRW and real losses as percentages of system input volume for the eleven-provider benchmark, reference year 2025; colours distinguish island and mainland providers and the dashed line is the unweighted mean NRW (46.2%). (b) Non-revenue water of the internal network declared in the Table B2 reference table for 2024 and 2025, with the change in percentage points above each pair.
Figure 1.
(a) NRW and real losses as percentages of system input volume for the eleven-provider benchmark, reference year 2025; colours distinguish island and mainland providers and the dashed line is the unweighted mean NRW (46.2%). (b) Non-revenue water of the internal network declared in the Table B2 reference table for 2024 and 2025, with the change in percentage points above each pair.
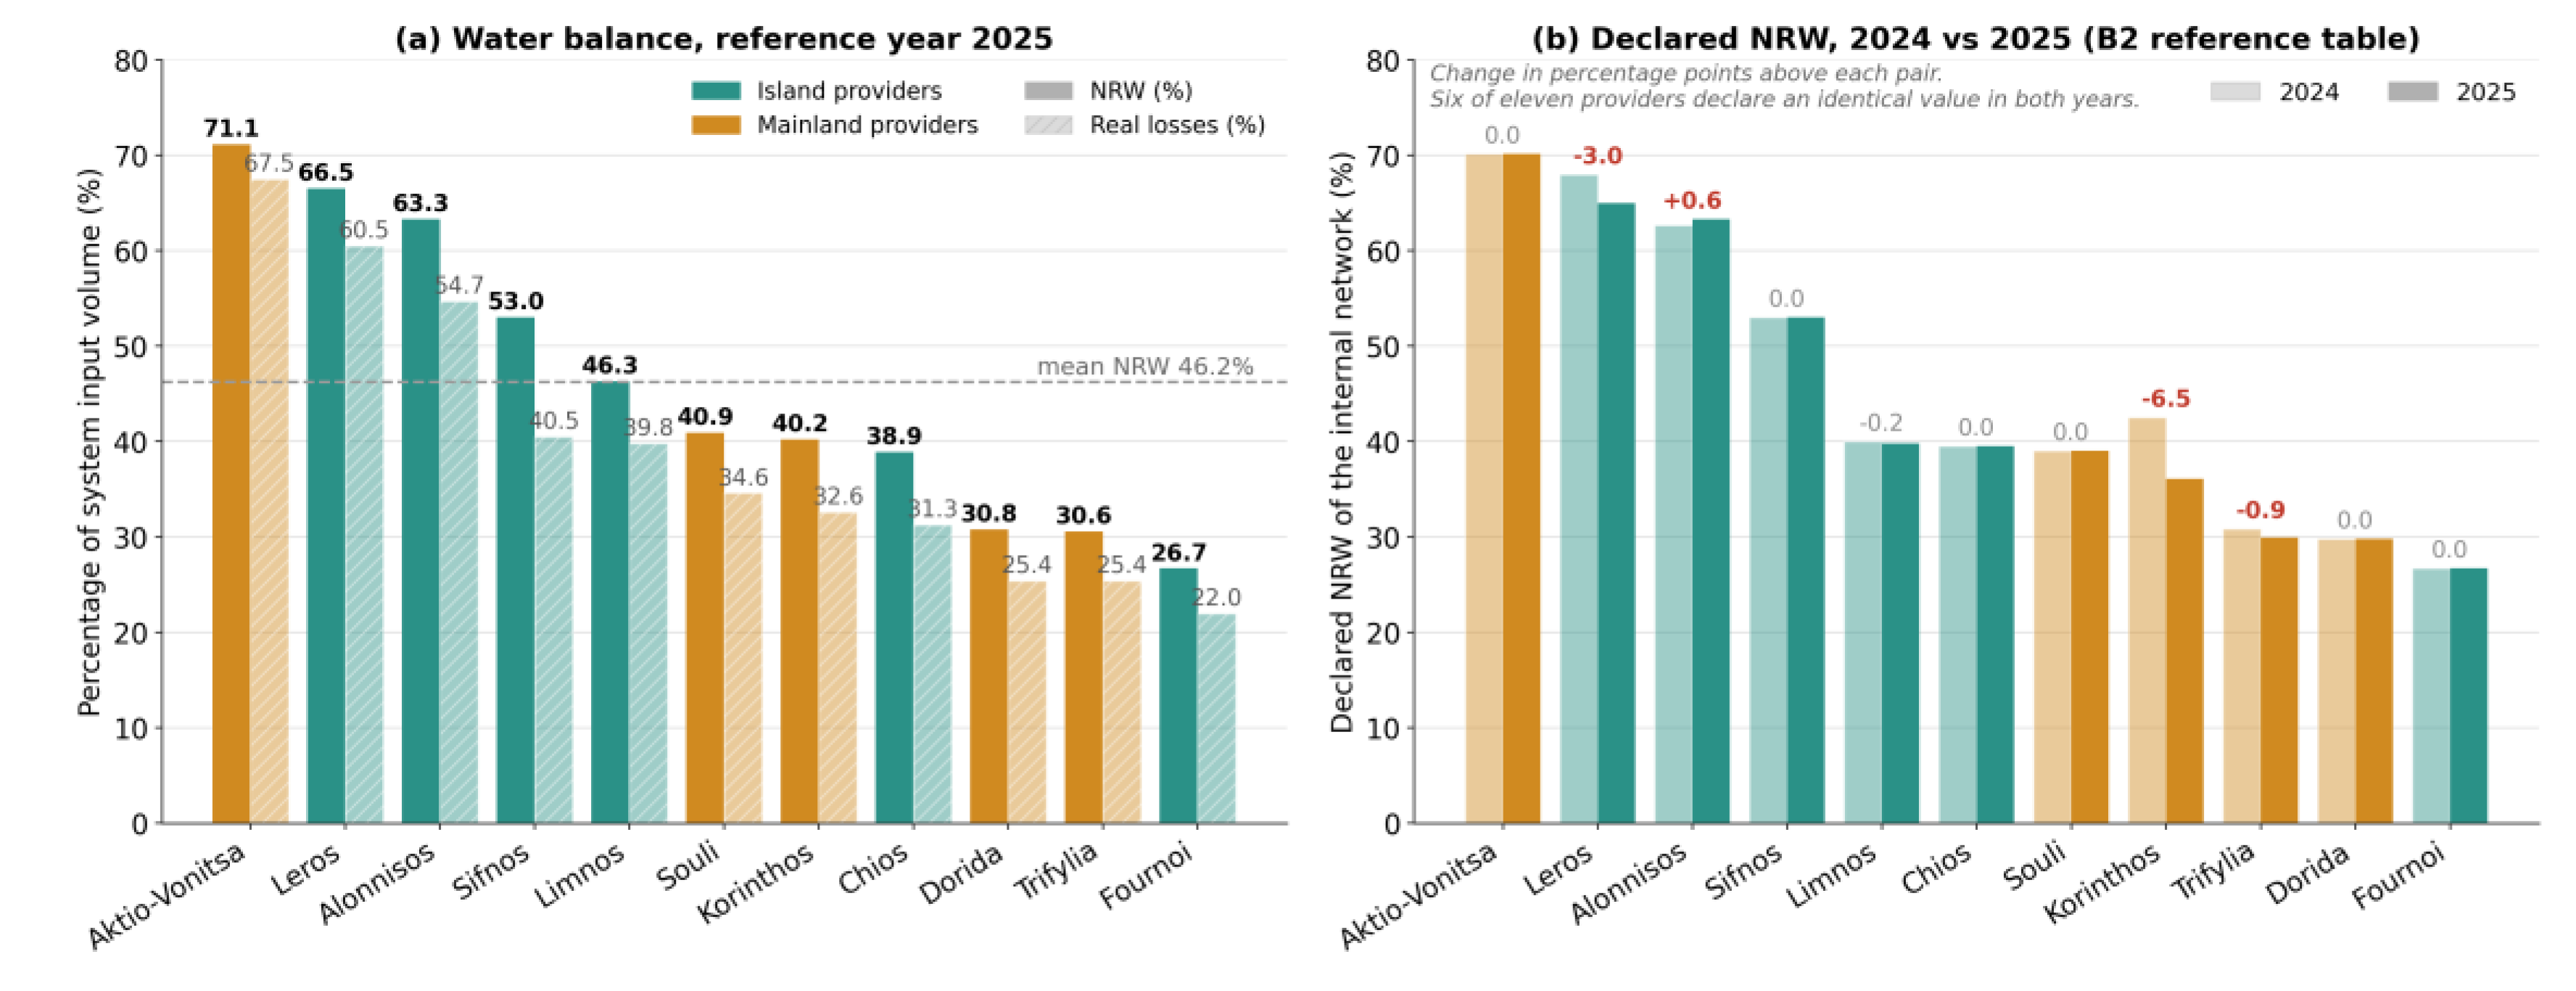
Figure 2.
Composition of the submitted IWA water balances for 2025. The first three components form authorised consumption. The labelled segments identify the large billed-unmetered shares in Trifylia and Fournoi Korseon.
Figure 2.
Composition of the submitted IWA water balances for 2025. The first three components form authorised consumption. The labelled segments identify the large billed-unmetered shares in Trifylia and Fournoi Korseon.
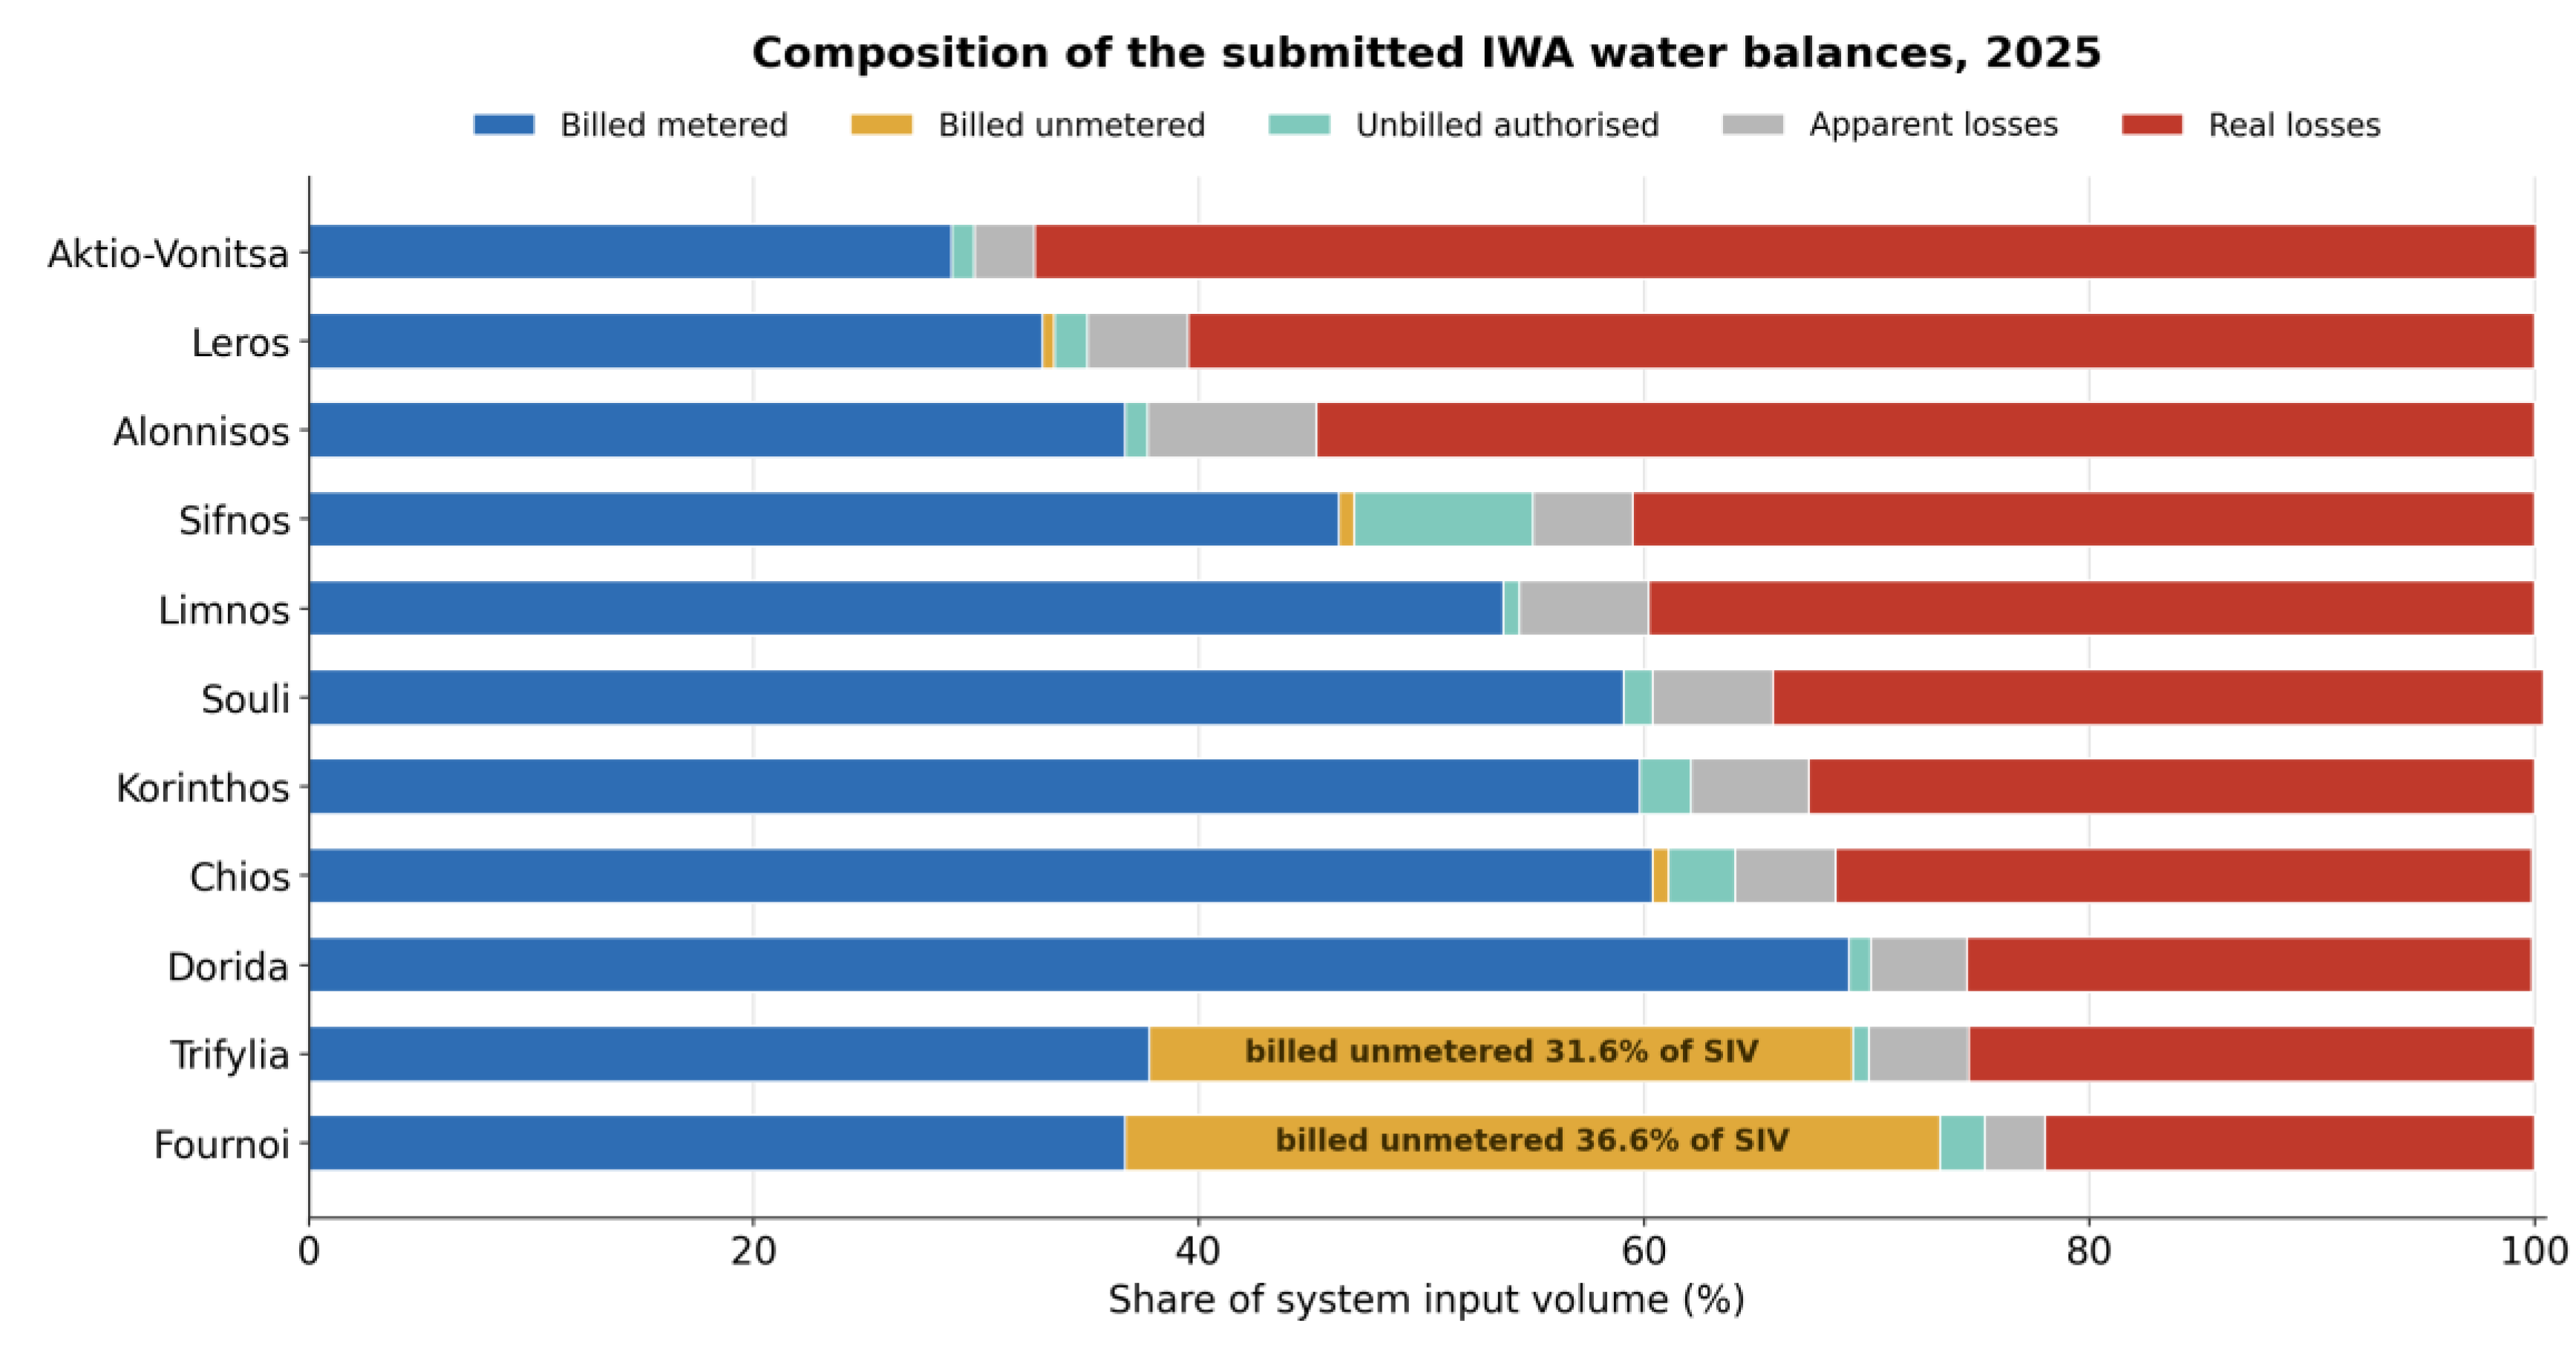
Figure 3.
Sensitivity of NRW to ±10%, ±20% and ±30% errors in billed-unmetered consumption for the two most exposed providers. The maximum structural exposure labels show the full billed-unmetered share and should not be interpreted as uncertainty bounds.
Figure 3.
Sensitivity of NRW to ±10%, ±20% and ±30% errors in billed-unmetered consumption for the two most exposed providers. The maximum structural exposure labels show the full billed-unmetered share and should not be interpreted as uncertainty bounds.
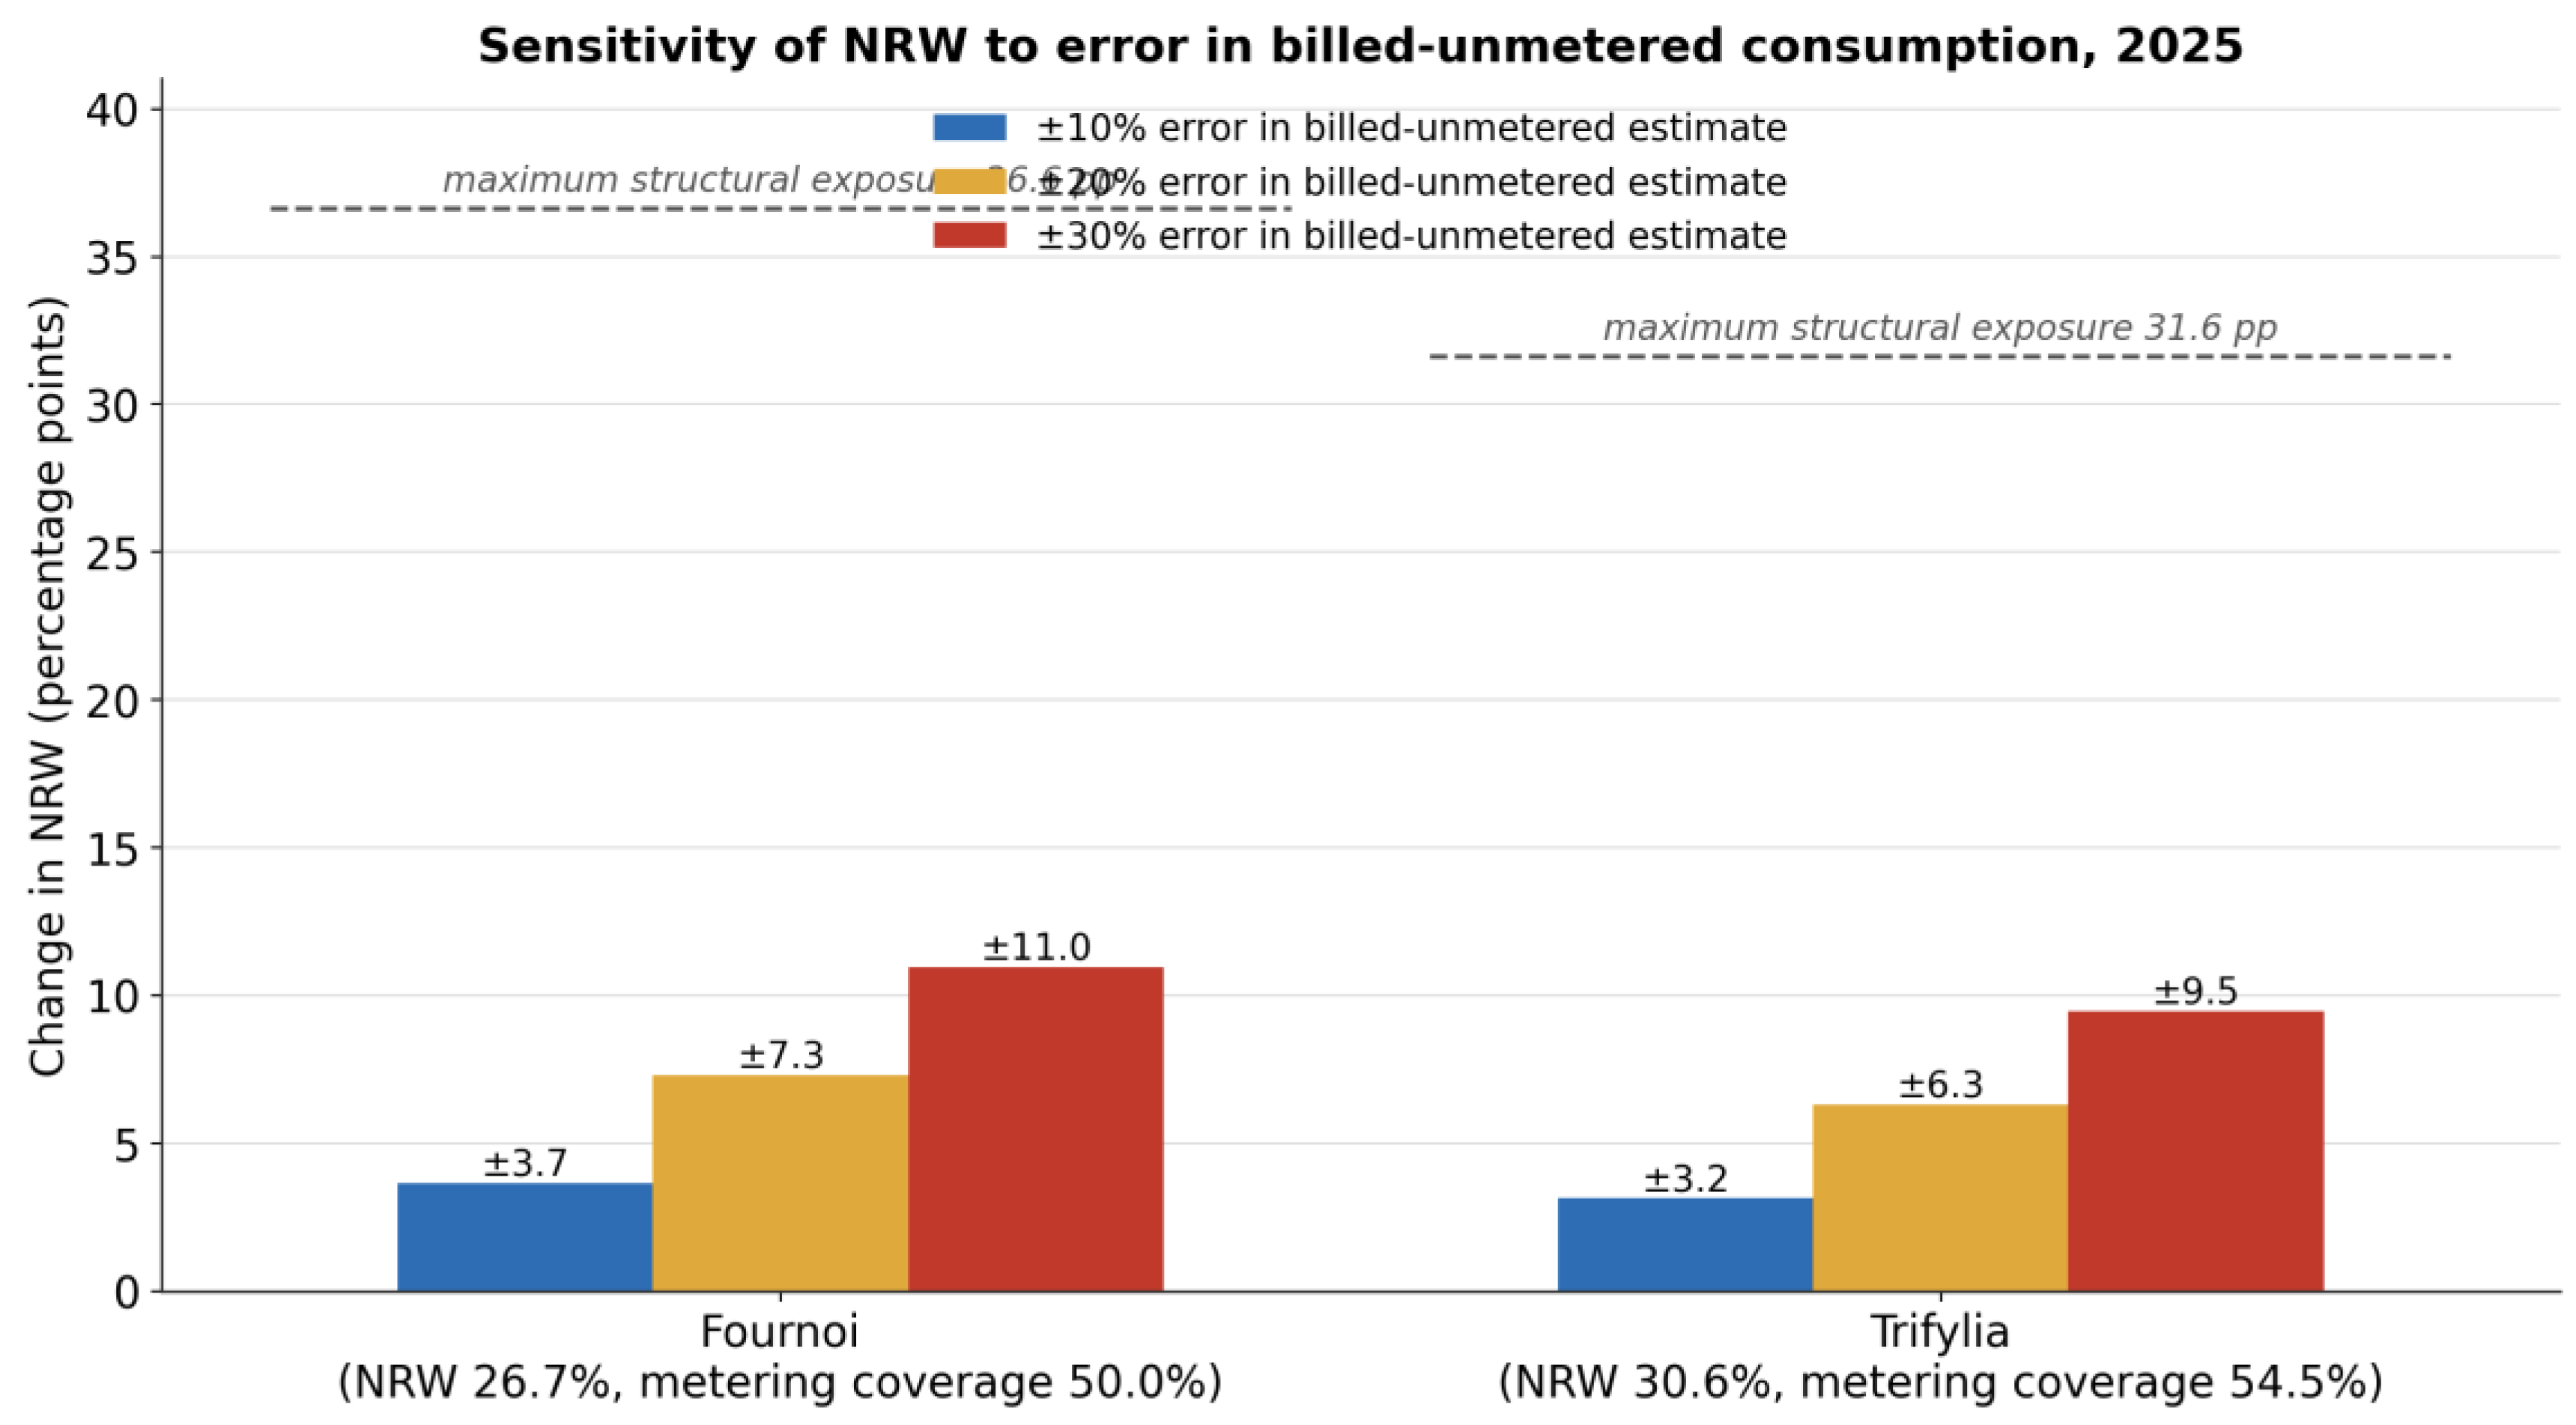
Figure 4.
Declared ILI plotted against recalculated real losses per connection for the seven ILI cases. Arrows join the 2024 and 2025 values of the five cases declared in the Table B2 reference table; Chios (2023) and Souli (2025) are single-year cases reproduced from WB-EasyCalc. The plot is descriptive; ILI and qRL share CARL and are algebraically related.
Figure 4.
Declared ILI plotted against recalculated real losses per connection for the seven ILI cases. Arrows join the 2024 and 2025 values of the five cases declared in the Table B2 reference table; Chios (2023) and Souli (2025) are single-year cases reproduced from WB-EasyCalc. The plot is descriptive; ILI and qRL share CARL and are algebraically related.
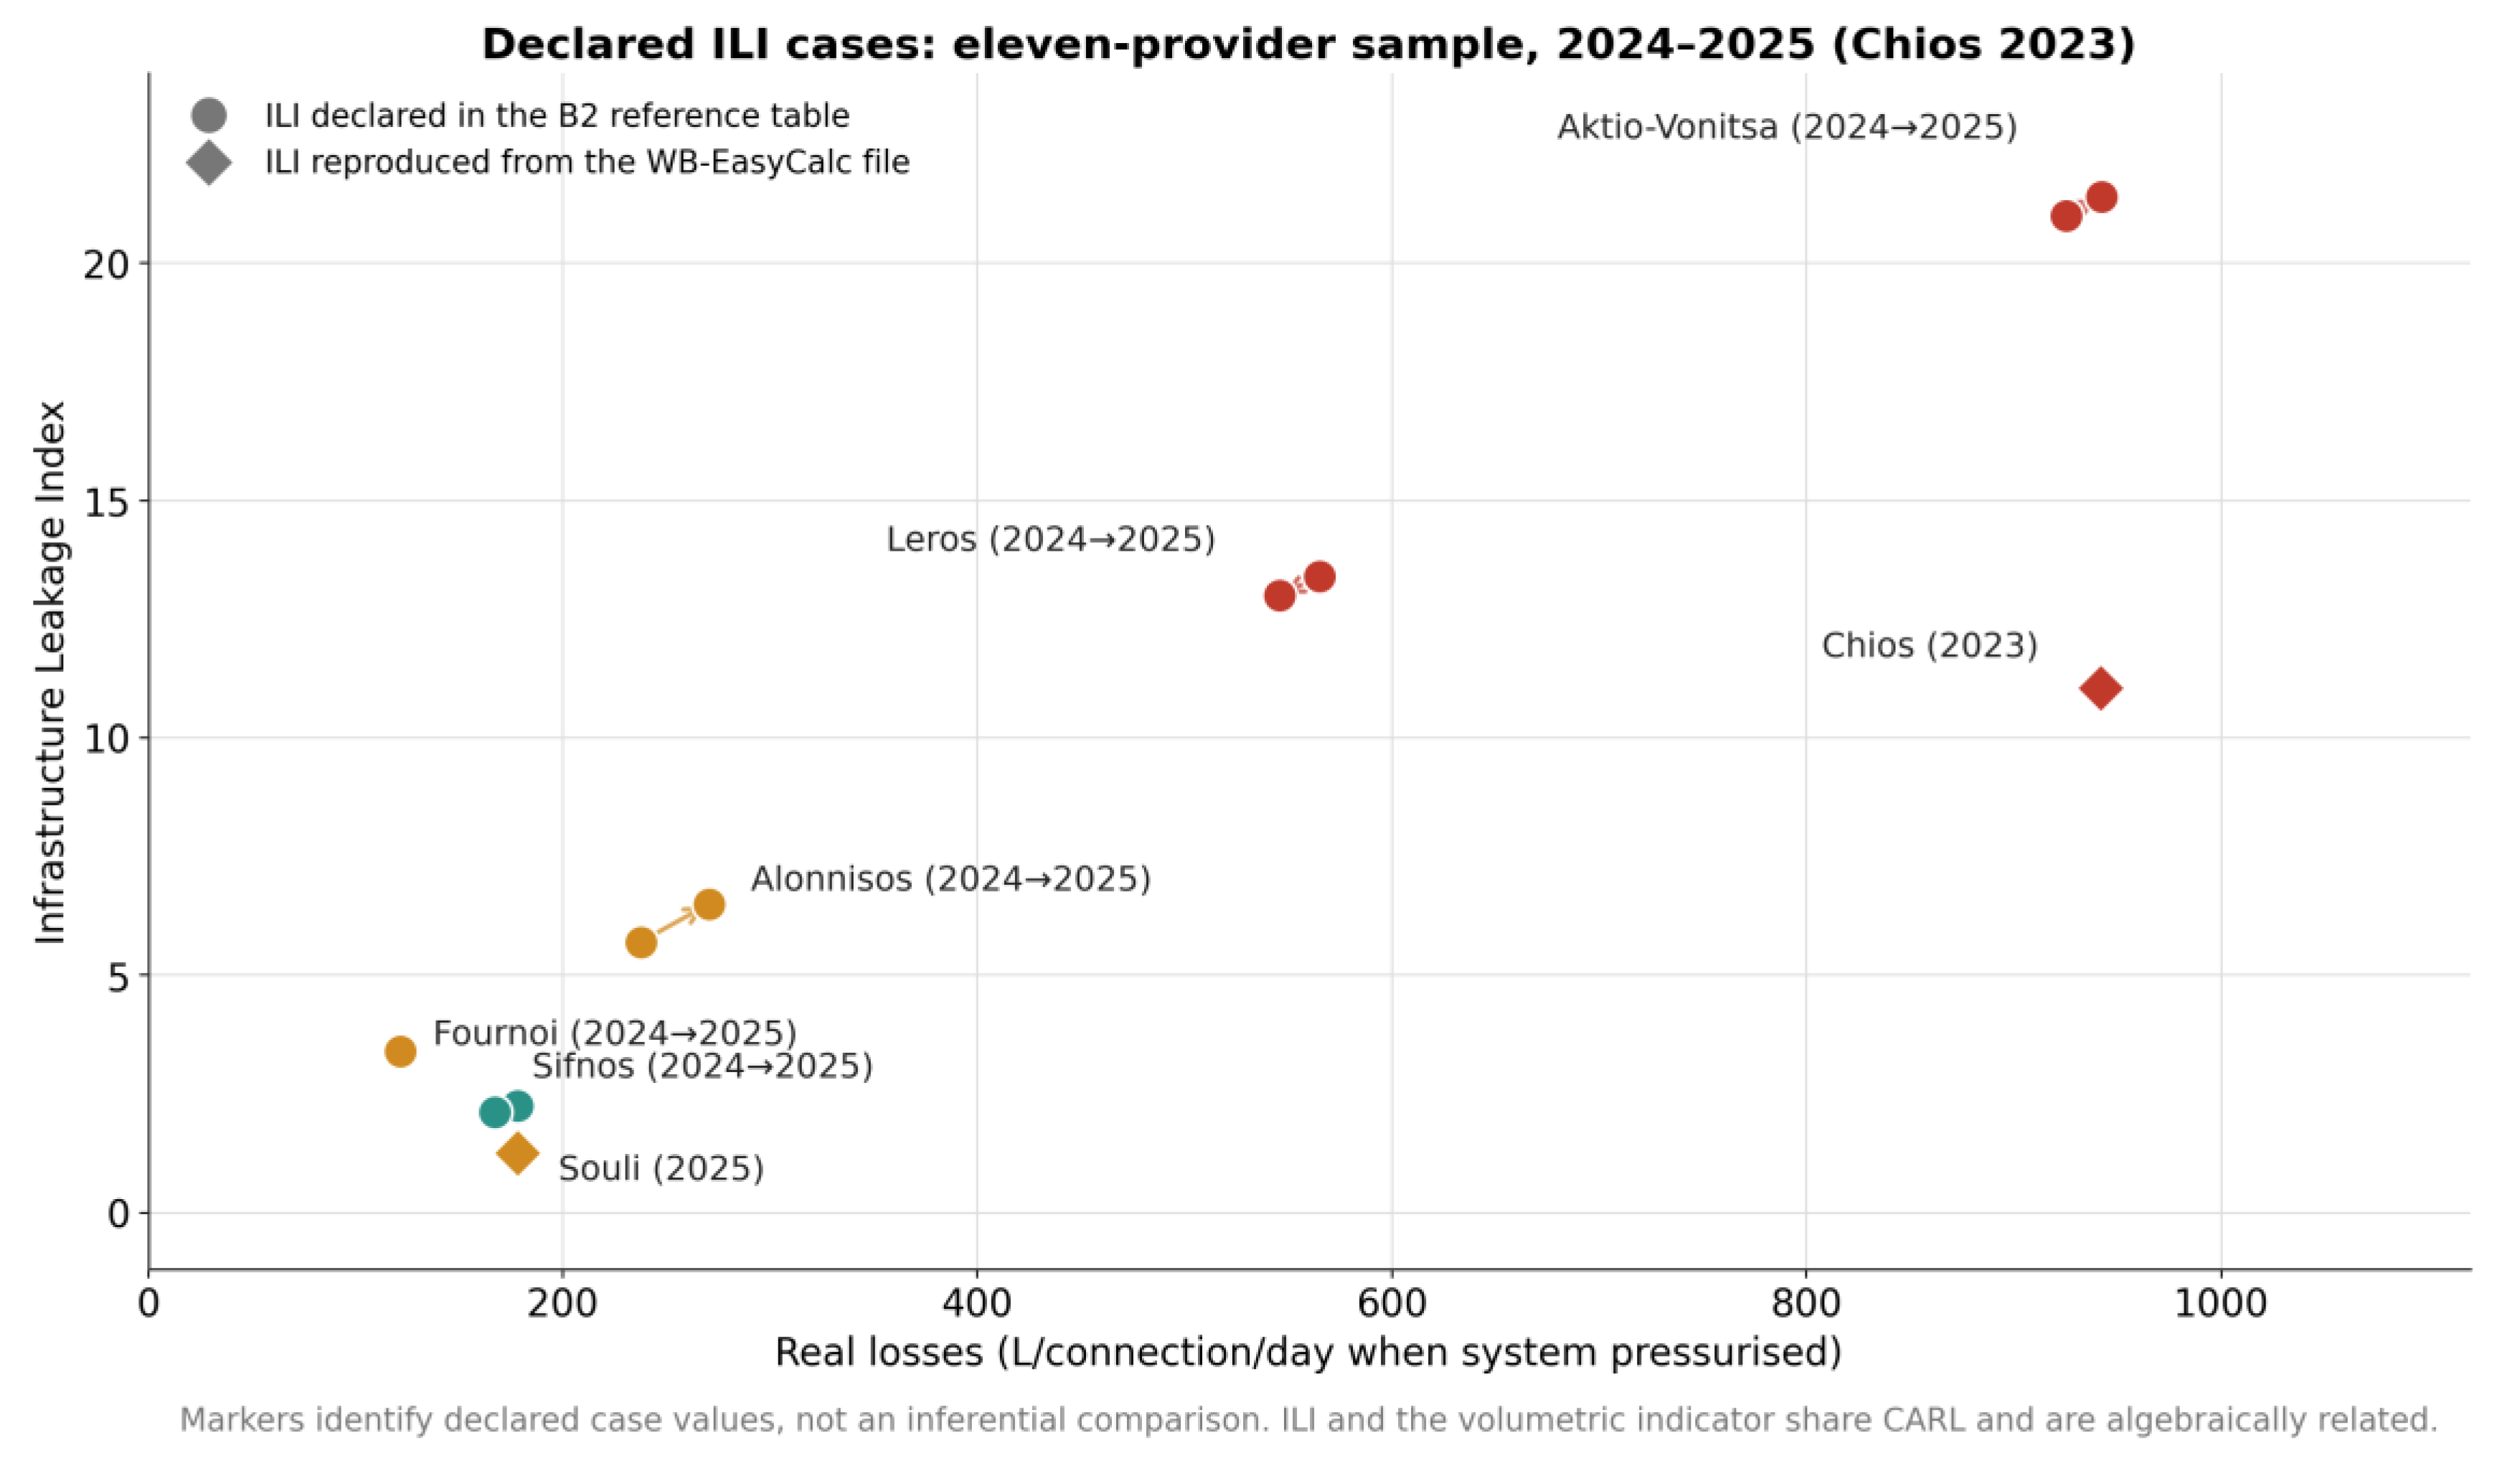
Figure 5.
Per-connection UARL normaliser as a function of connection density and pressure, using 15 m of private pipe per connection. Case markers use each case's 24-hour-equivalent UARL divided by its connection count. The 20-connections/km line indicates the conventional change in preferred volumetric reporting unit; it is not an automatic ILI-validity threshold.
Figure 5.
Per-connection UARL normaliser as a function of connection density and pressure, using 15 m of private pipe per connection. Case markers use each case's 24-hour-equivalent UARL divided by its connection count. The 20-connections/km line indicates the conventional change in preferred volumetric reporting unit; it is not an automatic ILI-validity threshold.
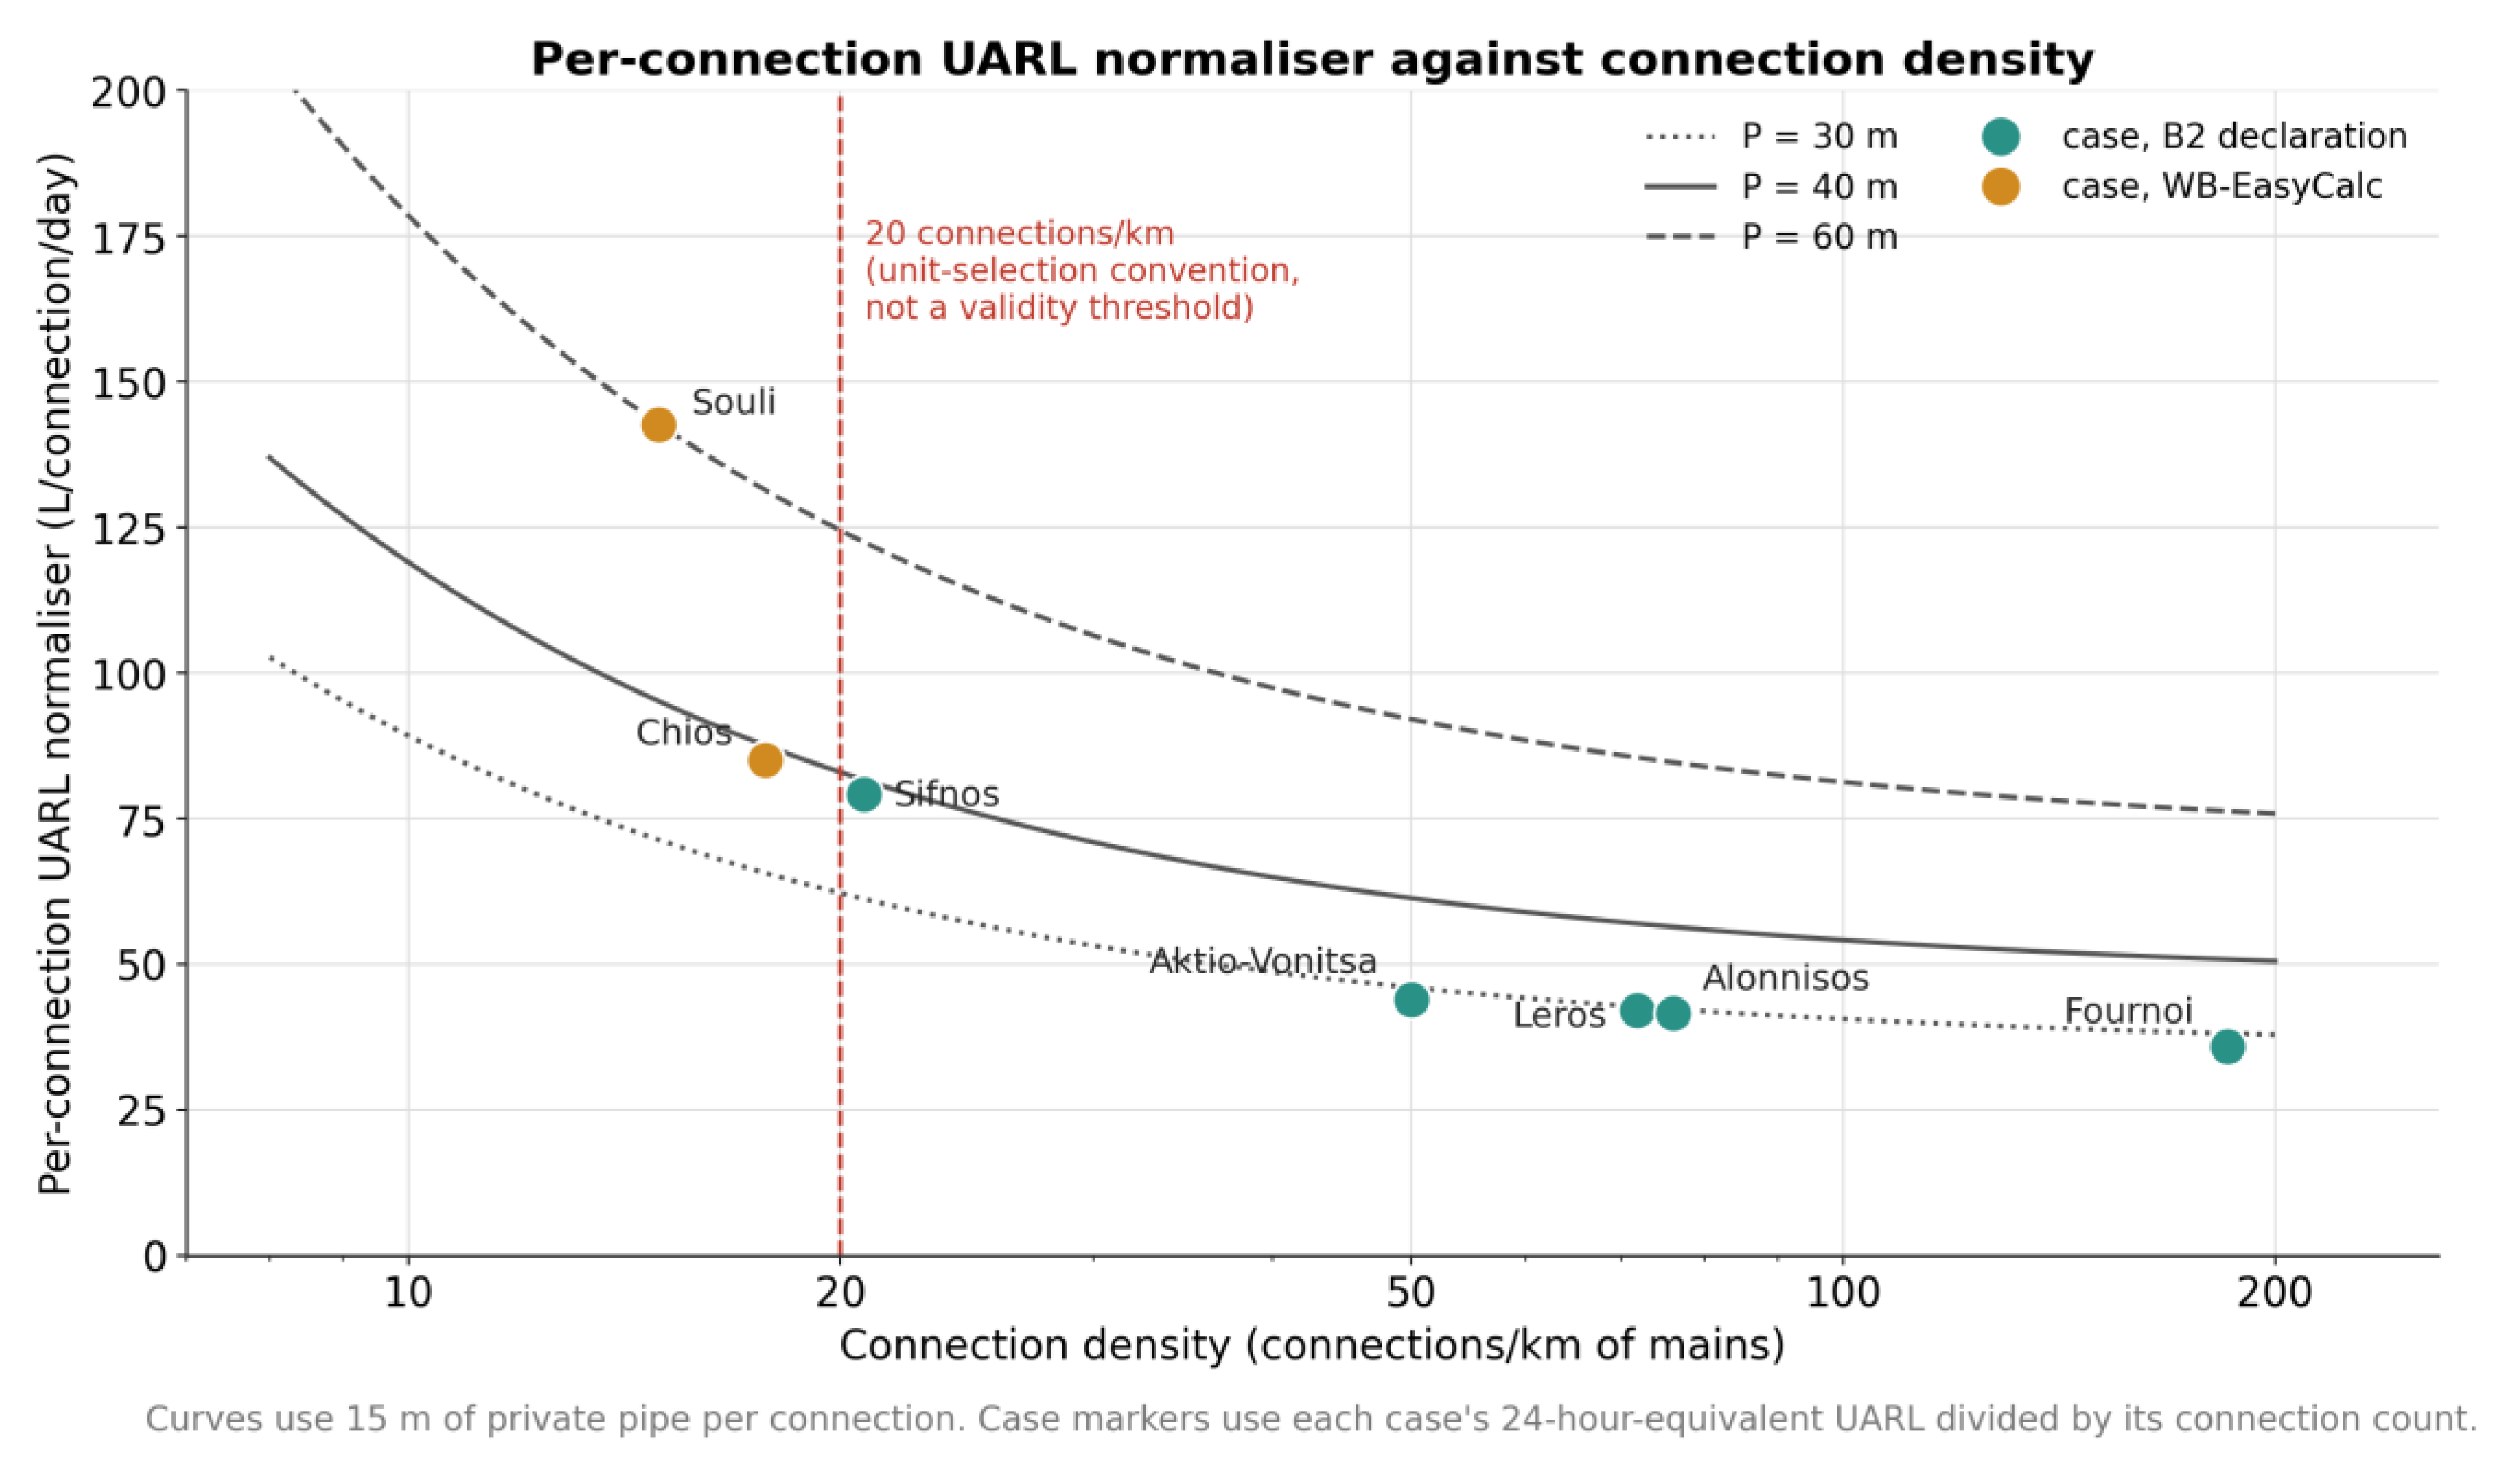
Figure 6.
Sensitivity of the Souli ILI. (a) Pressure scenarios, with the submitted 60 m treated as an unverified assumption. (b) One-at-a-time ±20% perturbation of UARL inputs while CARL is held fixed. The analysis quantifies numerical sensitivity and does not determine which input value is true.
Figure 6.
Sensitivity of the Souli ILI. (a) Pressure scenarios, with the submitted 60 m treated as an unverified assumption. (b) One-at-a-time ±20% perturbation of UARL inputs while CARL is held fixed. The analysis quantifies numerical sensitivity and does not determine which input value is true.
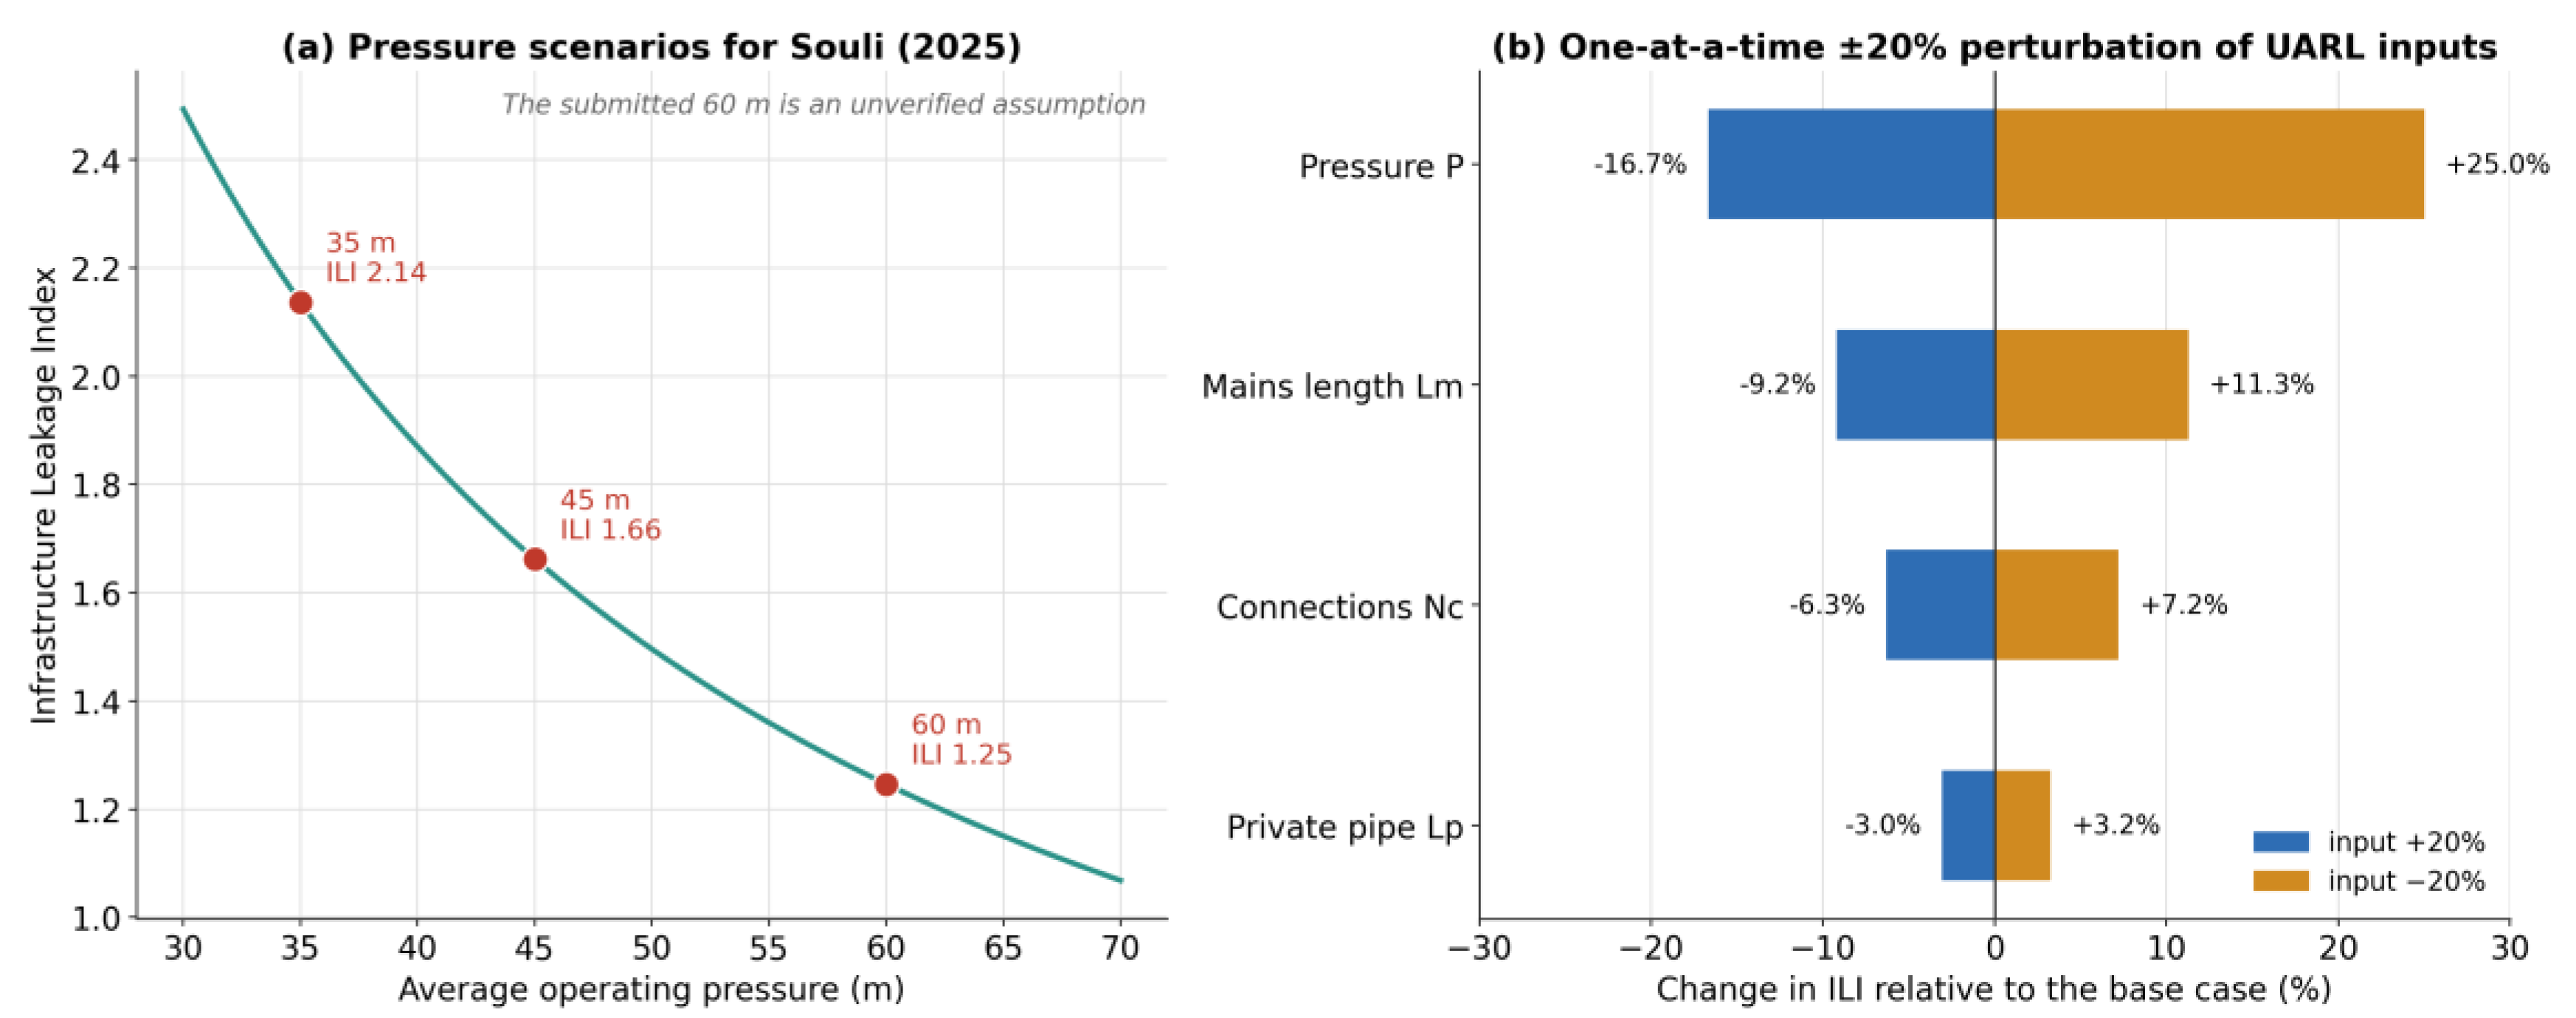
Figure 7.
Data-adequacy screen for the seven ILI cases. 'No issue evident' means only that the displayed submission did not reveal a material problem; it is not independent validation. Amber cells require documentation or checking, and red cells identify caveats that materially affect comparison.
Figure 7.
Data-adequacy screen for the seven ILI cases. 'No issue evident' means only that the displayed submission did not reveal a material problem; it is not independent validation. Amber cells require documentation or checking, and red cells identify caveats that materially affect comparison.
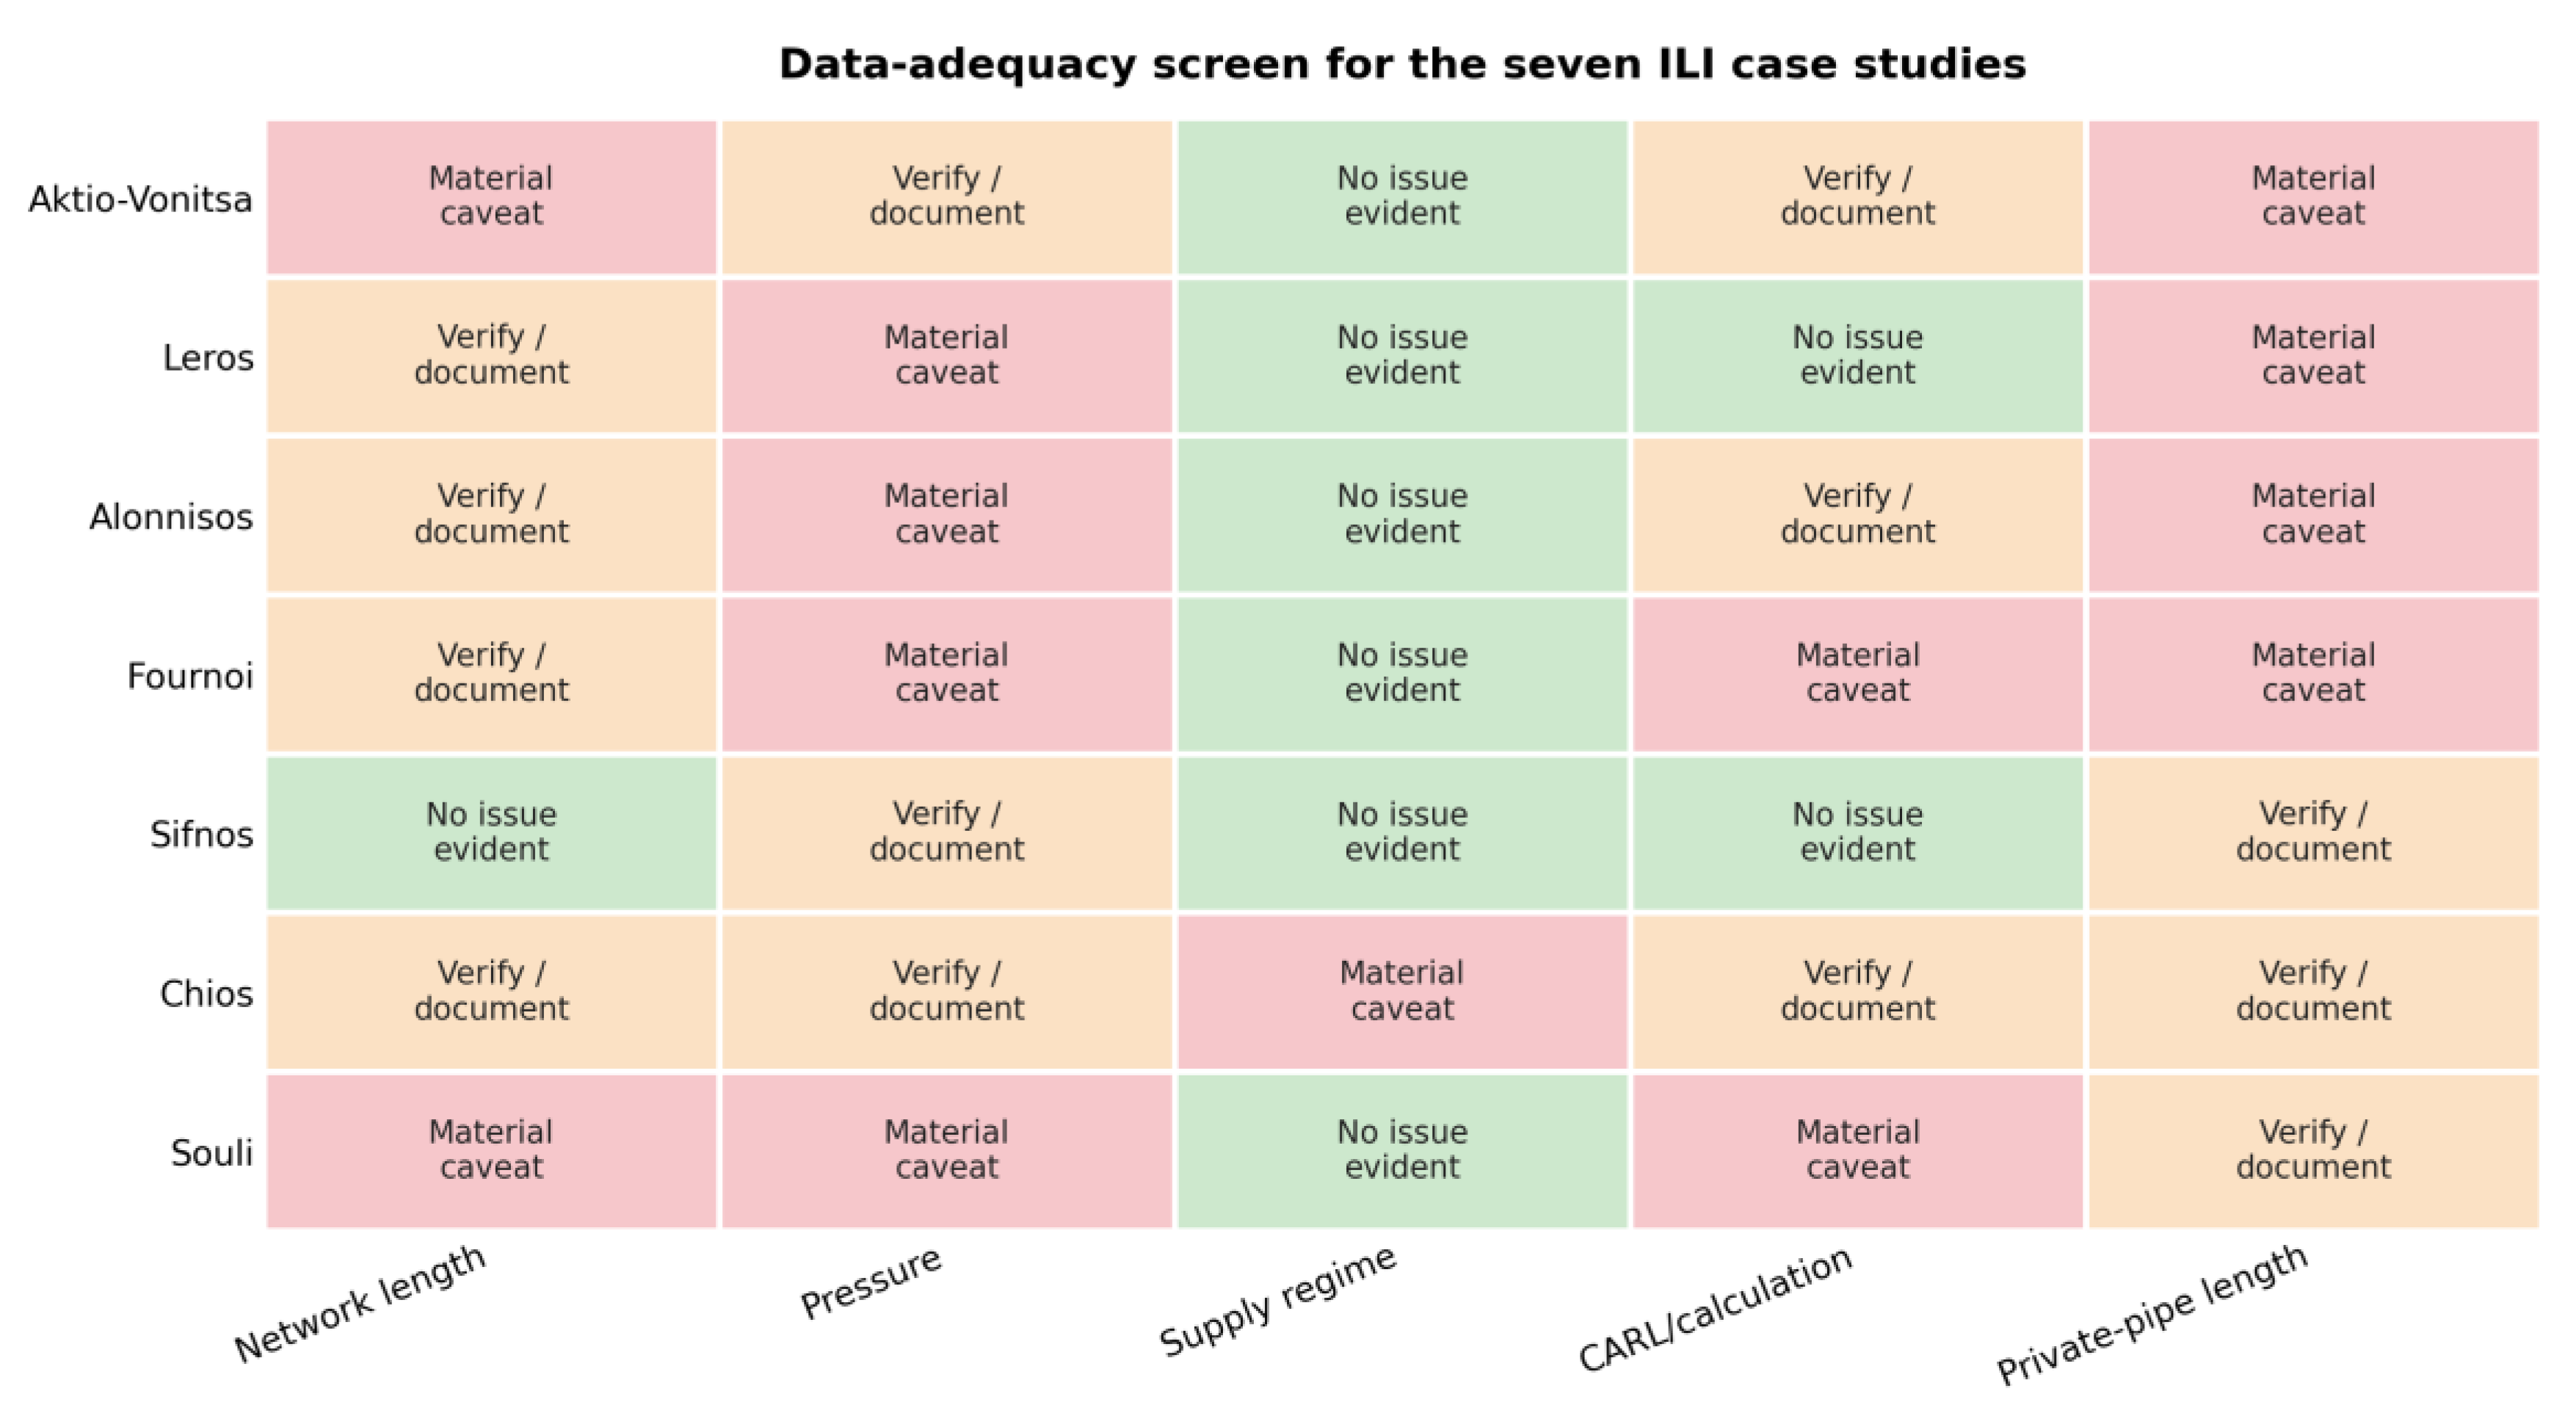
Figure 8.
Information limits in the submitted balances. (a) Leakage level declared in field D.2.1 of the Table B2 reference table against the real losses derived from the same provider's 2025 water balance; the two markers coincide where the sources agree. (b) Submitted allocation of real losses by type; dashed lines identify the common 72.2/5.6/22.2 allocation used by nine providers.
Figure 8.
Information limits in the submitted balances. (a) Leakage level declared in field D.2.1 of the Table B2 reference table against the real losses derived from the same provider's 2025 water balance; the two markers coincide where the sources agree. (b) Submitted allocation of real losses by type; dashed lines identify the common 72.2/5.6/22.2 allocation used by nine providers.
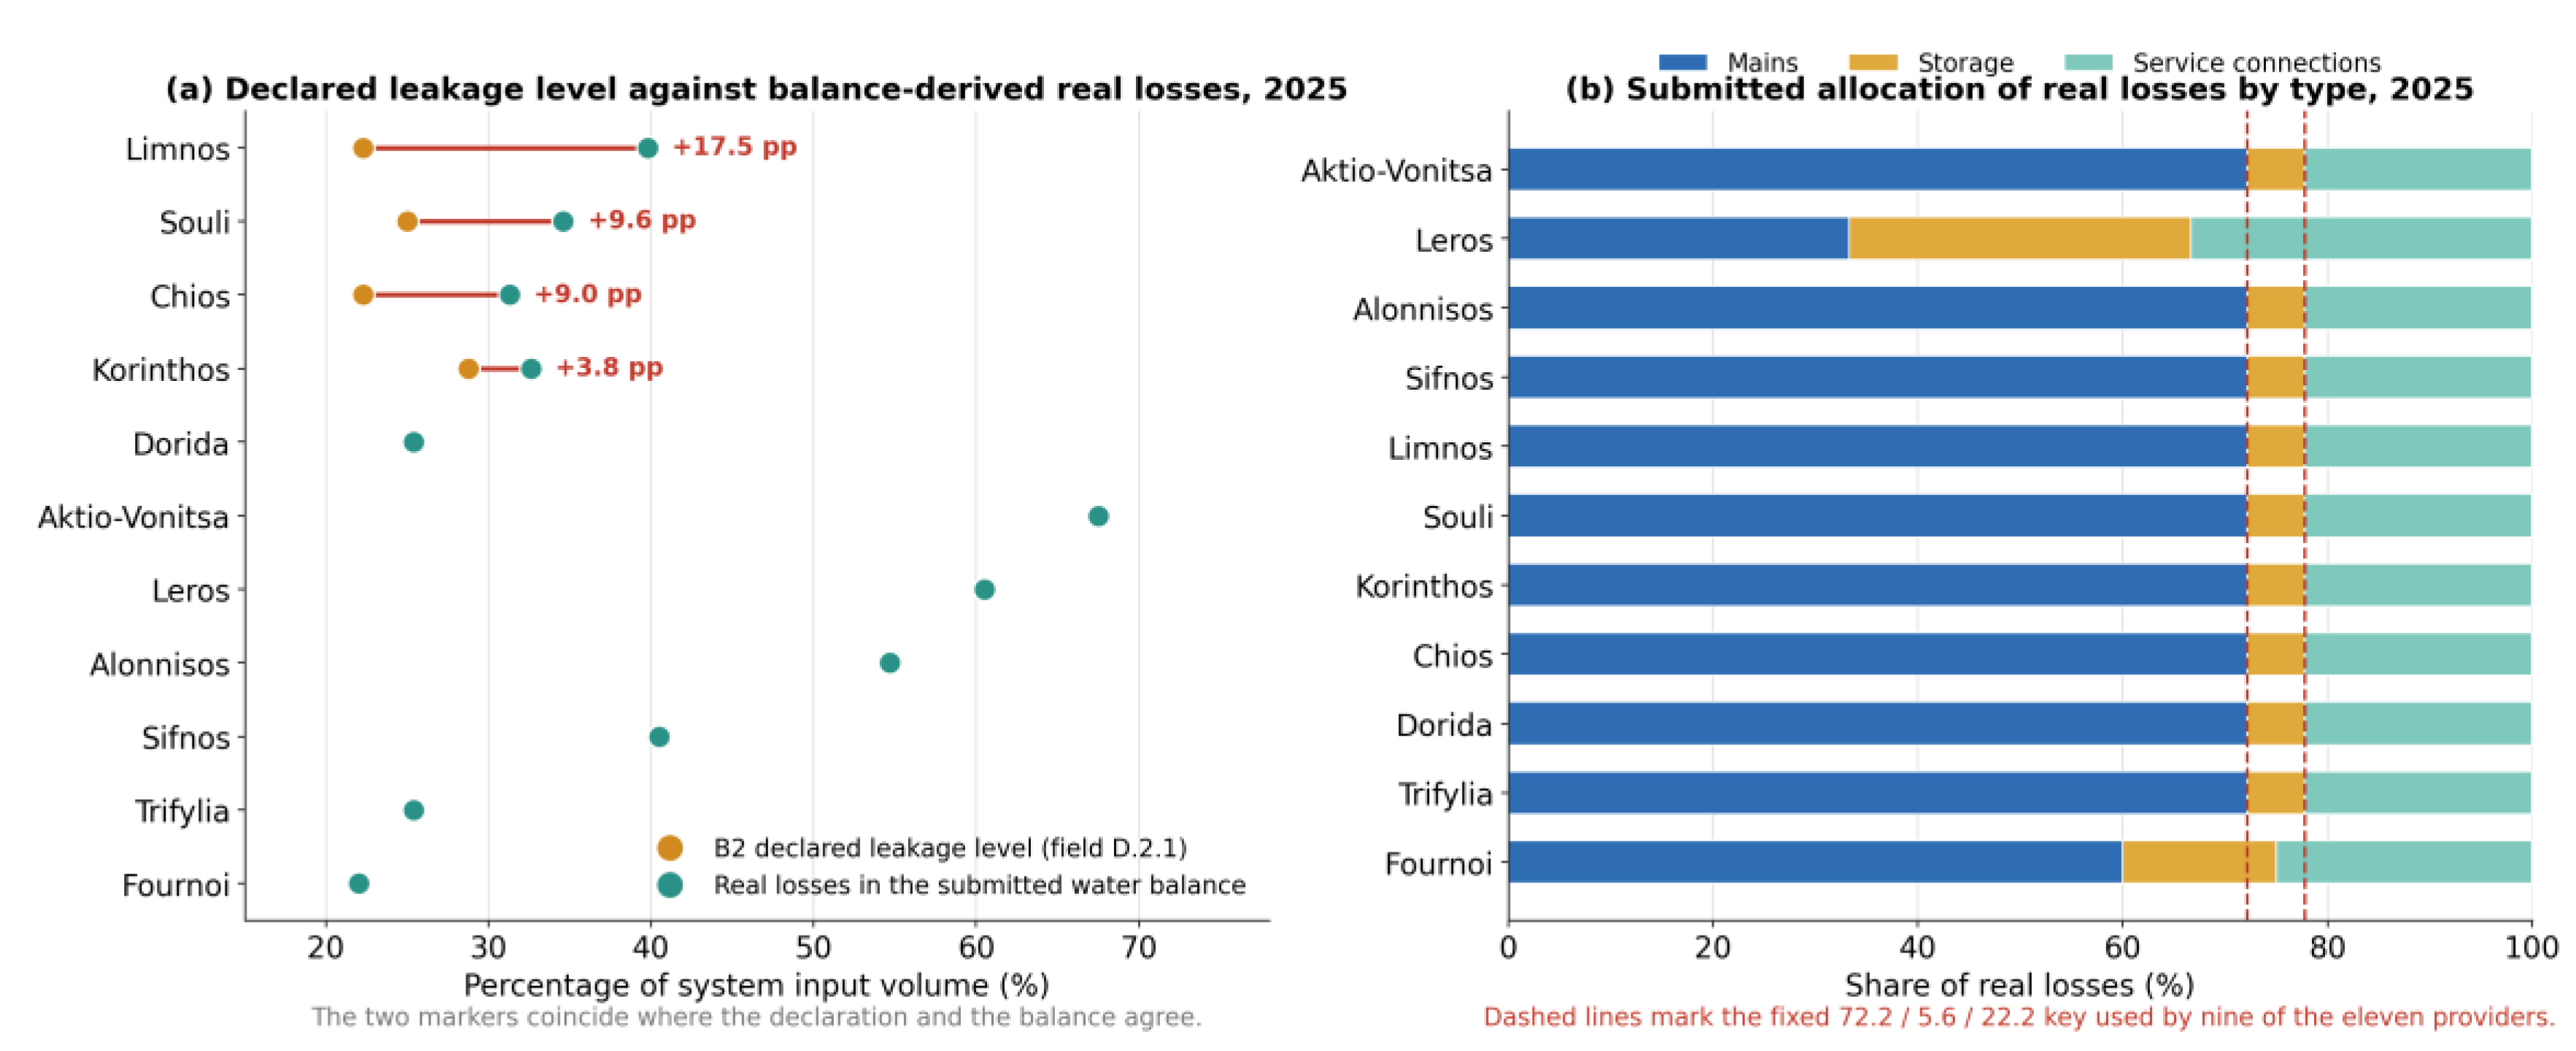

Table 1.
Analytical samples and reference years.
| Provider | Provider type | Setting | 2024–2025 balance benchmark | ILI case (year, source) |
|---|---|---|---|---|
| Aktio-Vonitsa | Municipality | Mainland, lowland/coastal | Yes | 2024, 2025 (B2) |
| Alonnisos | Municipality | Island | Yes | 2024, 2025 (B2) |
| Chios | DEYA | Island | Yes | 2023 (WB-EasyCalc) |
| Dorida | Municipality | Mainland, mountainous | Yes | — |
| Fournoi Korseon | Municipality | Island | Yes | 2024, 2025 (B2) |
| Korinthos | DEYA | Mainland, lowland/coastal | Yes | — |
| Leros | Municipality | Island | Yes | 2024, 2025 (B2) |
| Limnos | Municipality | Island | Yes | — |
| Sifnos | Municipality | Island | Yes | 2024, 2025 (B2) |
| Souli | Municipality | Mainland, semi-mountainous | Yes | 2025 (WB-EasyCalc) |
| Trifylia | DEYA | Mainland, semi-mountainous | Yes | — |
Note: DEYA = Municipal Water Supply and Sewerage Enterprise. B2 = ILI declared in the Table B2 regulatory reference table; WB-EasyCalc = ILI reproduced from the provider's WB-EasyCalc file. An em dash indicates that the provider contributes no ILI case.
Table 2.
Water-balance indicators for the 2025 benchmark sample, ordered by NRW.
| Provider | SIV (m³/year) | NRW (%) | Real losses (%) | Apparent losses (%) | Authorised consumption (%) |
|---|---|---|---|---|---|
| Aktio-Vonitsa | 5,096,115 | 71.1 | 67.5 | 2.7 | 29.9 |
| Leros | 1,419,650 | 66.5 | 60.5 | 4.5 | 35.0 |
| Alonnisos | 361,018 | 63.3 | 54.7 | 7.6 | 37.7 |
| Sifnos | 553,500 | 53.0 | 40.5 | 4.5 | 55.0 |
| Limnos | 1,827,900 | 46.3 | 39.8 | 5.8 | 54.4 |
| Souli | 1,287,740 | 40.9 | 34.6 | 5.4 | 60.4 |
| Korinthos | 5,906,214 | 40.2 | 32.6 | 5.3 | 62.1 |
| Chios | 4,229,898 | 38.9 | 31.3 | 4.5 | 64.1 |
| Dorida | 1,207,440 | 30.8 | 25.4 | 4.3 | 70.2 |
| Trifylia | 3,222,224 | 30.6 | 25.4 | 4.5 | 70.1 |
| Fournoi Korseon | 201,610 | 26.7 | 22.0 | 2.7 | 75.3 |
| Mean (n = 11) | — | 46.2 | 39.5 | 4.7 | 55.8 |
Note: Percentages are those reported or derived from the provider water balances. Totals may not sum to exactly 100 because of rounding and balance components not shown separately.
Table 3.
Declared non-revenue water and leakage level for 2024 and 2025, from the Table B2 regulatory reference tables.
Table 3.
Declared non-revenue water and leakage level for 2024 and 2025, from the Table B2 regulatory reference tables.
| Provider | NRW 2024 (%) | NRW 2025 (%) | Change (pp) | Declared leakage 2024 (%) | Declared leakage 2025 (%) | Change (pp) | Balance real losses minus declared leakage, 2025 (pp) |
|---|---|---|---|---|---|---|---|
| Aktio-Vonitsa | 70.1 | 70.1 | 0.0 | 67.5 | 67.5 | 0.0 | 0.0 |
| Leros | 68.0 | 65.0 | -3.0 | 62.9 | 60.5 | -2.4 | 0.0 |
| Alonnisos | 62.7 | 63.3 | +0.6 | 54.2 | 54.7 | +0.6 | 0.0 |
| Sifnos | 53.0 | 53.0 | 0.0 | 40.5 | 40.5 | 0.0 | 0.0 |
| Limnos | 40.0 | 39.8 | -0.2 | 22.0 | 22.3 | +0.3 | +17.5 |
| Chios | 39.5 | 39.5 | 0.0 | 22.0 | 22.3 | +0.3 | +9.0 |
| Souli | 39.0 | 39.0 | 0.0 | 24.9 | 25.0 | +0.1 | +9.6 |
| Korinthos | 42.5 | 36.1 | -6.5 | 34.8 | 28.8 | -6.0 | +3.8 |
| Trifylia | 30.8 | 29.9 | -0.9 | 26.2 | 25.4 | -0.8 | 0.0 |
| Dorida | 29.8 | 29.8 | 0.0 | 25.4 | 25.4 | 0.0 | -0.1 |
| Fournoi Korseon | 26.7 | 26.7 | 0.0 | 22.0 | 22.0 | 0.0 | 0.0 |
Note: NRW is field D.1.4 (non-revenue water of the internal distribution network) and declared leakage is field D.2.1 of each provider's Table B2. The final column is the difference between the real losses derived from the 2025 water balance (Table 2) and the leakage level declared for the same year; a positive value means the balance reports more real losses than the reference table declares.
Table 4.
Metering coverage and sensitivity of NRW to error in billed-unmetered consumption.
| Provider | Billed unmetered (% SIV) | Metering coverage of billing (%) | Reported NRW (%) | 10% error (pp) | 20% error (pp) | 30% error (pp) | Maximum exposure (pp) |
|---|---|---|---|---|---|---|---|
| Fournoi Korseon | 36.6 | 50.0 | 26.7 | ±3.7 | ±7.3 | ±11.0 | 36.6 |
| Trifylia | 31.6 | 54.5 | 30.6 | ±3.2 | ±6.3 | ±9.5 | 31.6 |
| Chios | 0.7 | 98.9 | 38.9 | ±0.1 | ±0.1 | ±0.2 | 0.7 |
| Sifnos | 0.7 | 98.5 | 53.0 | ±0.1 | ±0.1 | ±0.2 | 0.7 |
| Leros | 0.5 | 98.5 | 66.5 | ±0.1 | ±0.1 | ±0.1 | 0.5 |
| Other six providers | 0.0 | 100.0 | 30.8–71.1 | 0.0 | 0.0 | 0.0 | 0.0 |
Note: The 10–30% columns are symmetric scenarios for error in the billed-unmetered estimate. Maximum exposure is the full billed-unmetered share and is a one-sided structural counterfactual, not a confidence interval.
Table 5.
Infrastructure and UARL inputs for the seven ILI cases.
| Provider | Year (source) | Lm (km) | Nc | P (m) | T (h/day) | Density (conn./km) | Nc + 20Lm |
|---|---|---|---|---|---|---|---|
| Aktio-Vonitsa | 2024, 2025 (B2) | 200.0 | 10,000 | 35.0 | 24 | 50.0 | 14,000 |
| Leros | 2024, 2025 (B2) | 60.1 | 4,313 | nd | 24 | 71.8 | 5,515 |
| Alonnisos | 2024, 2025 (B2) | 26.3 | 2,000 | nd | 24 | 76.0 | 2,526 |
| Fournoi Korseon | 2024, 2025 (B2) | 5.4 | 1,000 | nd | 24 | 185.2 | 1,108 |
| Sifnos | 2024, 2025 (B2) | 177.0 | 3,675 | 38.8 | 24 | 20.8 | 7,215 |
| Chios | 2023 (WB-EasyCalc) | 2,000.0 | 35,456 | 38.8 | 4 | 17.7 | 75,456 |
| Souli | 2025 (WB-EasyCalc) | 470.0 | 7,019 | 60.0 | 24 | 14.9 | 16,419 |
Note: Inputs are those declared in the Table B2 reference table or contained in the WB-EasyCalc file. For Leros and Alonnisos, mains length was recovered from the declared annual real losses per kilometre. 'nd' means that no average pressure is stated in the source material. The final column evaluates the 2009 minimum-size expression Nc + 20Lm > 3000; values below 3000 are shown in the note to Table 6.
Table 6.
Declared and derived leakage indicators for each ILI case-year.
| Provider | Year | CARL (m³/day) | UARL (m³/day) | ILI | qRL (L/conn./day w.s.p.) | qL (m³/km/day w.s.p.) | Principal caveat |
|---|---|---|---|---|---|---|---|
| Aktio-Vonitsa | 2024 | 9,252 | 441 | 21.00 | 925 | 46.26 | mains length and connections estimated |
| Aktio-Vonitsa | 2025 | 9,422 | 440 | 21.40 | 942 | 47.11 | mains length and connections estimated |
| Leros | 2024 | 2,436 | 182 | 13.40 | 565 | 40.53 | pressure not stated; Lm back-calculated |
| Leros | 2025 | 2,353 | 181 | 13.00 | 546 | 39.15 | pressure not stated; Lm back-calculated |
| Alonnisos | 2024 | 475 | 83 | 5.70 | 238 | 18.06 | below size expression; Nc assumed |
| Alonnisos | 2025 | 541 | 83 | 6.50 | 271 | 20.58 | below size expression; Nc assumed |
| Fournoi Korseon | 2024 | 122 | 36 | 3.39 | 122 | 22.50 | below size expression; values carried forward |
| Fournoi Korseon | 2025 | 122 | 36 | 3.39 | 122 | 22.50 | below size expression; values carried forward |
| Sifnos | 2024 | 655 | 291 | 2.25 | 178 | 3.70 | none evident in the B2 submission |
| Sifnos | 2025 | 614 | 291 | 2.11 | 167 | 3.47 | none evident in the B2 submission |
| Chios | 2023 | 5,567 | 503 (3018 at 24 h) | 11.06 | 942 | 16.70 | intermittent supply (4 h/day) |
| Souli | 2025 | 1,249 | 1,002 | 1.25 | 178 | 2.66 | pressure unverified; CARL not reconciled |
Note: qRL and qL are recalculated from the displayed CARL, Nc, Lm and T; for Aktio-Vonitsa and Sifnos they reproduce the values printed in the dossiers (925 and 942 L/connection/day, and 178.3 and 167.1 L/connection/day, respectively). UARL is CARL divided by the declared ILI for the Table B2 cases. Chios's UARL of 503 m³/day applies to four hours of pressure and corresponds to 3018 m³/day on a 24-hour-equivalent basis. Alonnisos and Fournoi Korseon fall below the 2009 minimum-size expression (2,526 and 1,108 against a threshold of 3000).
Table 7.
Proposed tiered reporting scheme for small and medium water systems.
| Tier | Indicators | Minimum documentation | Primary use |
|---|---|---|---|
| 1. Water balance | NRW (% SIV and m³/year); real and apparent losses; billing-meter coverage | Validated balance; a single stated source field per indicator; uncertainty notes | Resource, revenue and supervisory overview |
| 2. Volumetric backbone | Real losses in L/connection/day and m³/km/day, both w.s.p. | Connections, complete mains length, hours pressurised | Benchmarking by system type; operational targets |
| 3. Supplementary ILI | ILI plus CARL, Lm, Nc, Lp, P, T and calculation year | Audited inputs; documented pressure and supply regime; size expression Nc + 20Lm evaluated; SCF considered where appropriate | Technical interpretation and diagnostic comparison |
Note: w.s.p. = when system pressurised. The scheme does not prescribe one universal ranking; the indicator should match the regulatory question.
Disclaimer/Publisher’s Note: The statements, opinions and data contained in all publications are solely those of the individual author(s) and contributor(s) and not of MDPI and/or the editor(s). MDPI and/or the editor(s) disclaim responsibility for any injury to people or property resulting from any ideas, methods, instructions or products referred to in the content. |
© 2026 by the authors. Licensee MDPI, Basel, Switzerland. This article is an open access article distributed under the terms and conditions of the Creative Commons Attribution (CC BY) license (http://creativecommons.org/licenses/by/4.0/).
Copyright: This open access article is published under a Creative Commons CC BY 4.0 license, which permit the free download, distribution, and reuse, provided that the author and preprint are cited in any reuse.