

Submitted:
12 August 2026
Posted:
13 August 2026
You are already at the latest version
Abstract
Sustainable investing has moved environmental, social, and governance (ESG) criteria toward the center of cross-border capital decisions, yet the country-level evidence on whether these criteria attract foreign direct investment (FDI) rests almost entirely on static models and rarely accounts for the quality of a country’s accounting and reporting environment. This study estimates a dynamic model of FDI for 265 economies observed from 2006 to 2020, combining the three ESG pillars with four accounting and tax variables: mandatory adoption of International Financial Reporting Standards (IFRS), the strength of auditing standards, the extent of business disclosure, and the corporate tax burden. A fixed-effects estimator and a two-step system generalized method of moments (GMM) estimator address persistence and the reverse causality between FDI and national conditions, and a panel smooth transition regression tests whether the relationship is nonlinear. Accounting transparency attracts FDI: audit quality and disclosure carry large positive and significant coefficients under fixed effects and across income groups, while the aggregate governance index enters negatively. The corporate tax burden deters FDI with no evidence of an optimal-tax turning point. The relationship is nonlinear in governance rather than income: a panel smooth transition regression locates a governance threshold near 0.97 on the standardized scale, above which the negative association between IFRS and FDI disappears and the effects of disclosure and sustainability reporting strengthen. The results reframe the ESG–FDI question around the reporting and assurance environment through which investors read a country’s ESG credentials, and around the governance quality that makes that environment credible.
Keywords:
ESG
; foreign direct investment
; accounting transparency
; IFRS
; audit quality
; disclosure
; system GMM
; panel smooth transition regression
1. Introduction
Direct investment that crosses borders commits capital, technology, and employment to a location for years, so the criteria behind it shape where productive capacity accumulates. Over the past decade those criteria have widened beyond market size and factor costs to include environmental exposure, social conditions, and the quality of institutions in the destination country. The question this study addresses is narrower and, so far, largely unexamined at the country level: does the accounting and reporting environment through which investors read a country’s ESG credentials shape where FDI goes, once the persistence of FDI and the two-way relationship between FDI and national conditions are taken into account?
The question matters because ESG information reaches a cross-border investor through accounting and assurance. A sustainability claim carries weight only if the reporting behind it is credible, and credibility depends on audit quality, disclosure requirements, and the comparability that common standards such as IFRS provide. Gordon, Loeb and Zhu [1] show that IFRS adoption raises FDI inflows and that the effect concentrates in developing economies, which connects the accounting literature to the FDI-determinants literature. Bushman and Smith [2] and Leuz, Nanda and Wysocki [3] establish that financial reporting quality and investor protection shape the cost and allocation of capital. Yet the multi-country work on ESG and FDI, including the study by Chipalkatti, Le and Rishi [4] that motivates this paper, treats reporting only through a single indicator for sustainability-reporting requirements and omits audit quality, disclosure, and IFRS from the specification.
Two further gaps follow from prior designs. Country-level ESG–FDI studies estimate the relationship with a fixed-effects model that includes a lagged dependent variable, which is biased in panels with a moderate time dimension and cannot address the reverse causality between FDI and ESG conditions, because a country that receives more FDI has more resources to improve governance and the environment. The evidence also treats each determinant as linear, which hides the possibility, central to the institutional-complementarity literature, that an effect changes across the range of a variable or depends on the level of another.
This study addresses these gaps in three steps. It adds four accounting and tax variables to the ESG–FDI specification and estimates them jointly. It pairs a fixed-effects estimator with a two-step system GMM estimator to check the relationships under persistence and endogeneity, and it reports the diagnostics that determine whether the GMM is valid. It then estimates a panel smooth transition regression to locate any regime structure directly. The sample runs from 2006 to 2020, the period over which the accounting and business-environment indicators are available.
2. Theoretical Background and Hypotheses
2.1. ESG Conditions and the Location of FDI
Three theoretical channels connect national ESG conditions to the location of direct investment. Stakeholder theory holds that firms account for the interests of all stakeholders, including the environment, so a destination that performs poorly on social or environmental conditions raises the expected cost of operating there. Legitimacy theory treats ESG performance and its disclosure as part of the social contract between business and society. Dunning’s location component of the eclectic paradigm frames the same point as location advantage: environmental risk, social instability, and weak institutions reduce expected returns and deter investment [5].
The environmental pillar carries two competing predictions. The pollution haven hypothesis predicts that firms facing stricter regulation at home relocate polluting production to countries with weaker regulation, so a higher-emission environment can attract certain FDI. The pollution halo argument predicts the reverse, because multinationals bring cleaner technology and favor destinations with stronger environmental performance. Spatareanu [6] finds no consistent haven pattern, and the wider evidence remains mixed. On the social pillar, human-capital theory predicts that education, health, and living standards raise host-country productivity and attract FDI, subject to a minimum threshold [7]; yet Iamsiraroj [8] reports a negative schooling–FDI correlation across 124 countries, consistent with a low-cost-labor channel. On the governance pillar, political stability, rule of law, and control of corruption are established pull factors, and Bailey [9], in a meta-analysis, confirms institutional quality as a robust determinant.
2.2. Accounting Transparency and Cross-Border Investment
A separate literature links the accounting environment to the allocation of capital. Bushman and Smith [2] show that financial reporting reduces information asymmetry and lowers the cost of capital. Leuz, Nanda and Wysocki [3] document that stronger investor protection is associated with less earnings management and clearer reporting. For cross-border flows specifically, Gordon, Loeb and Zhu [1] find that IFRS adoption raises FDI, and DeFond, Hu, Hung and Li [10] find that mandatory IFRS adoption raises foreign ownership where it improves comparability. The mechanism is common to these studies: comparable, audited, and disclosed financial information lowers the cost of processing information for a foreign investor and reduces the risk premium demanded of an unfamiliar destination. This literature has developed largely in parallel to the ESG–FDI work, and the present study joins them by placing IFRS adoption, audit quality, and disclosure alongside the three ESG pillars in one country-level model.
2.3. Hypotheses
FDI is persistent: past inflows predict future inflows through agglomeration and sunk commitments, which makes a lagged dependent variable necessary and a static within estimator biased. ESG and accounting conditions are also plausibly endogenous to FDI, because inward investment funds the institutions that produce them. The system GMM estimator of Arellano and Bover [11] and Blundell and Bond [12] addresses both problems. Building on this evidence, the study fixes six hypotheses in advance of the results.
The governance–FDI link is among the best-documented findings in the location literature. Globerman and Shapiro [13] show that governance infrastructure raises both the probability and the volume of inward investment, Buchanan, Le and Rishi [14] find that institutional quality is positively associated with FDI after macroeconomic controls, and Bailey [9] confirms in a meta-analysis that political stability, democracy, and the rule of law pull FDI while corruption deters it. H1: national governance quality is positively associated with FDI, after persistence and endogeneity are accounted for.
Bushman and Smith [2] argue that financial reporting reduces information asymmetry and lowers the cost of capital, and La Porta, Lopez-de-Silanes, Shleifer and Vishny [15] show that stronger legal protection and disclosure are associated with deeper capital markets. For cross-border investment, Gordon, Loeb and Zhu [1] and DeFond, Hu, Hung and Li [10] show that IFRS and comparable reporting raise foreign investment. H2: accounting transparency is positively associated with FDI, so audit quality, disclosure, and IFRS adoption each carry a positive coefficient.
Djankov, Ganser, McLiesh, Ramalho and Shleifer [16], using a cross-country measure of the effective corporate tax burden, find that higher taxes reduce aggregate investment and entry. H3: the corporate tax burden is negatively associated with FDI.
Cheng and Kwan [17] show that existing FDI stock is among the strongest predictors of subsequent inflows. H4: FDI inflows are persistent, so the lagged inflow carries a positive coefficient.
Daske, Hail, Leuz and Verdi [18] find that the market benefits of IFRS adoption accrue mainly in countries with strong enforcement and governance, and Ball [19] argues that uniform standards deliver comparable information only where local enforcement is credible. H5: the effect of accounting transparency on FDI is stronger in a strong-governance regime than in a weak-governance regime, so the ESG–FDI relationship is nonlinear in governance.
Very high taxes deter FDI, but very low taxes can signal weak public finance and an inability to fund the infrastructure that investment requires, so an interior optimum is plausible. H6: the tax burden has an interior optimum, so a quadratic specification yields a positive linear term and a negative quadratic term.
3. Materials and Methods
3.1. Data and Variables
The sample is a country-year panel of 265 economies from 2006 to 2020, the window over which the accounting and business-environment indicators are available. The dependent variable and the economic controls come from the World Development Indicators, governance from the Worldwide Governance Indicators, human development from the United Nations Development Programme, climate risk from Germanwatch, and the accounting and tax measures from World Bank business-environment indicators supplemented by IFRS Foundation jurisdiction profiles. The dependent variable is FDI net inflows as a share of GDP.
The three ESG pillars enter as follows. The environmental pillar is measured by per-capita carbon emissions, by the Global Climate Risk Index, and by an indicator for a sustainability-reporting requirement. The social pillar is the Human Development Index. The governance pillar is an additive index of the six Worldwide Governance Indicators, following the aggregation used by Kaufmann, Kraay and Mastruzzi [20]. The four accounting and tax variables are an indicator for mandatory IFRS adoption for domestic listed companies, the strength of auditing and reporting standards on a one-to-seven scale, the business extent-of-disclosure index on a zero-to-ten scale, and the total tax and contribution rate as a share of profit. The economic controls are gross capital formation, GDP-per-capita growth, and trade openness, each as a share of GDP, together with an indicator for the financial crisis of 2008 and 2009 and the lagged dependent variable. Table 1 reports the descriptive statistics.
3.2. Econometric Strategy
The baseline relates FDI to its own lag, the ESG pillars, the accounting and tax variables, and the economic controls, with country fixed effects:
FDIi,t = β0 + ρ·FDIi,t−1 + Σβk·ESGk,i,t + Σγm·ACCm,i,t + Σδn·CONTROLn,i,t + μi + εi,t.
The fixed-effects estimator, with standard errors clustered by country, is the workhorse. Because the lagged dependent variable correlates with the country effect and several regressors are plausibly endogenous, a two-step system GMM estimator [11,12] serves as a check. It instruments the lagged dependent variable and the endogenous ESG regressors with suitable lags of their own levels and differences, treats the accounting, tax, and macro variables as instruments in the levels equation, collapses the instrument set to limit proliferation following Roodman [21], and uses the Windmeijer [22] correction for the two-step standard errors. The GMM is judged against three diagnostics stated in advance: the Arellano–Bond test should reject first-order but not second-order serial correlation, the Hansen test should not reject instrument validity, and the instrument count should stay well below the number of countries.
Three further specifications test the conditional hypotheses. An interaction between sustainability reporting and audit quality and an interaction between IFRS and governance test whether the accounting effects are conditional, and a quadratic term in the tax burden tests H6. To let the data locate a regime structure rather than assume one, a panel smooth transition regression follows González, Teräsvirta and van Dijk [23]. The model, estimated on country-demeaned data, is FDI = θ0·X + θ1·X·g(q; γ, c) + error, where X is the vector of ESG, accounting, and control variables, q is a transition variable, and g is a logistic function that moves from zero to one as q passes the location parameter c at a speed governed by γ. Income per capita and the governance index serve as candidate transition variables; γ and c are estimated by a grid search, and a Lagrange-multiplier test of linearity based on a Taylor expansion of g determines whether a regime structure is present.
4. Results
4.1. Baseline Estimates
Table 2 reports the fixed-effects and system-GMM estimates. Under fixed effects, accounting transparency is the clearest result: audit quality and disclosure carry large positive and significant coefficients, a one-point rise in audit quality is associated with a 0.83-point rise in FDI relative to GDP and a one-point rise in disclosure with a 0.53-point rise, both at the 1 percent level. Sustainability reporting is positive and significant, the tax burden is negative and significant, which supports H3, and the lagged inflow is positive and significant, which supports H4. Two results run against the stated hypotheses and are reported as such: the governance index is negative and significant, so H1 is not supported, and IFRS is negative and significant, so H2 holds for audit quality and disclosure but not for IFRS on its own. The strong correlation between the governance index and the two accounting-transparency measures offers one reading: audit quality and disclosure absorb the transparency content that the aggregate governance index would otherwise carry.
The GMM column passes its diagnostics: the Arellano–Bond test rejects first-order autocorrelation but not second-order autocorrelation (p = 0.98), the Hansen test does not reject instrument validity (p = 0.98), and the 30 instruments sit well below the 265 countries. Under GMM the climate-risk index and human development remain negative and significant, while the accounting-transparency coefficients lose significance. The very high Hansen p-value signals that the instruments are weak in this sample, so the GMM is read as a check on the direction of persistence and endogeneity rather than as the primary source of point estimates. Figure 1 plots the fixed-effects coefficients with their confidence intervals, and Figure 2 compares the two estimators.
4.2. Income Subgroups
Splitting the sample by income group leaves the accounting-transparency result intact. Audit quality and disclosure remain positive and significant for both lower-middle-income and upper-middle-income economies, and the tax burden remains negative and significant in both. The governance coefficient is more negative in the lower-middle-income group (−1.79) than in the upper-middle-income group (−1.21). Per-capita emissions are positive and significant for upper-middle-income economies (0.08) but not for lower-middle-income economies, a trace of the pollution-haven pattern in the middle of the income range rather than at the bottom. Table 3 reports the subgroup estimates and Figure 3 displays the accounting and tax coefficients across the three samples.
4.3. Linear Conditional and Nonlinear Specifications
The interaction and quadratic tests, which impose a single linear form, do not detect the conditional effects. The interaction between sustainability reporting and audit quality is negative but not significant (−0.13, p = 0.19), the interaction between IFRS and governance is positive but not significant (0.14, p = 0.11), and the quadratic tax specification yields insignificant linear and quadratic terms, so H6 is not supported. Table 4 collects these results. The absence of a significant linear interaction does not rule out a regime structure, which the next section tests directly.
4.4. Regime Structure: Panel Smooth Transition Regression
The panel smooth transition regression relaxes the linear form and lets the data locate the regime. With income per capita as the transition variable, the linearity test does not reject a linear model (p = 0.44), so the relationship is not income-dependent once the accounting variables enter. With the governance index as the transition variable, the linearity test rejects strongly (F(36, 3927) = 2.70, p < 0.001), and the estimated location parameter places the threshold near 0.97 on the standardized governance scale. Figure 4 plots the transition, and Figure 5 compares the regime-specific effects.
The regime structure supports the complementarity hypothesis that the linear interaction missed. Table 5 reports the regime coefficients. In the weak-governance regime, IFRS carries a large negative coefficient (−0.53); in the strong-governance regime that penalty disappears (0.03). The effects that attract FDI strengthen as governance improves: disclosure rises from 0.48 to 0.78, audit quality from 0.84 to 0.87, and sustainability reporting from 0.81 to 0.98. Per-capita emissions carry a positive and significant coefficient in the weak-governance regime (0.05) and a negative one in the strong-governance regime (−0.04), a governance-conditional version of the halo pattern. Accounting standards and disclosure deliver their FDI reward mainly where governance is strong enough to enforce them, which is the complementarity that H5 predicted.
5. Discussion
The results point to the reporting and assurance environment, rather than the aggregate governance score, as the accounting margin on which countries compete for FDI. Audit quality and disclosure attract FDI in the fixed-effects estimates, across income groups, and in the lower governance regime of the smooth transition model, while the composite governance index enters negatively once these variables are present. A foreign investor responds to concrete, verifiable features of the reporting environment, and the broad governance index captures the same content less precisely. This extends the accounting-and-FDI results of [1] and [10] to a specification that holds the three ESG pillars constant.
The regime structure is the sharpest finding. The negative coefficient on IFRS in the pooled and weak-governance estimates is not evidence that common standards deter FDI; it reflects that IFRS adoption without the institutions to enforce it carries no reward, and the smooth transition model shows the penalty disappearing once governance passes its threshold, while the disclosure and reporting effects grow. This is consistent with the enforcement-dependent benefits documented by Daske, Hail, Leuz and Verdi [18] and with the developing-economy concentration reported by Gordon, Loeb and Zhu [1]. The two-step GMM, whose weak instruments identify only climate risk and human development in this sample, does not contradict the pattern; it simply cannot resolve the accounting coefficients with precision. The negative human-development coefficient echoes the finding of Chipalkatti, Le and Rishi [4] and is consistent with a low-cost-labor channel.
For a country seeking to attract FDI through its ESG and reporting credentials, investment in audit quality and disclosure carries a measurable return, and that return is larger where governance is strong enough to make the reporting credible. Adopting IFRS in isolation, without the enforcement capacity that governance provides, does not attract FDI on its own. Reductions in the corporate tax burden are associated with more FDI throughout the observed range, with no evidence that countries have pushed rates below an interior optimum.
6. Conclusions
This study places national accounting transparency alongside the three ESG pillars in a dynamic model of FDI for 265 economies from 2006 to 2020, estimated by fixed effects, system GMM, and a panel smooth transition regression. Audit quality and disclosure attract FDI; the corporate tax burden deters it; the aggregate governance index and IFRS on their own do not carry independent positive effects once transparency is measured directly. The relationship is nonlinear in governance rather than income: a governance threshold near 0.97 separates a regime in which IFRS carries a penalty and disclosure a smaller reward from a regime in which the penalty disappears and the reward grows, which is direct evidence that accounting standards attract FDI mainly where governance can enforce them.
Three limitations bound the design. The FDI series is aggregate, so it cannot separate green from other investment. The two-step GMM is weakly identified in this sample, so the accounting coefficients rest on the fixed-effects and transition estimates. The panel smooth transition regression is estimated on country-demeaned data without a lagged dependent variable, so it identifies the regime structure rather than the dynamic relationship, and the upper-regime coefficients are estimated from fewer high-governance observations and should be read as less precise. Future work that pairs disaggregated green-FDI data with the governance-regime design would sharpen the environmental interpretation.
Author Contributions
Conceptualization, N.T.P. and H.L.T.T.; methodology, H.L.T.T.; software, H.L.T.T.; validation, N.T.P.; formal analysis, H.L.T.T.; data curation, H.L.T.T.; writing—original draft preparation, H.L.T.T.; writing—review and editing, N.T.P.; supervision, N.T.P. All authors have read and agreed to the published version of the manuscript.
Funding
This research received no external funding.
Institutional Review Board Statement
Not applicable.
Informed Consent Statement
Not applicable.
Data Availability Statement
The study uses publicly available country-level data from the World Development Indicators, the Worldwide Governance Indicators, the United Nations Human Development Index, the Global Climate Risk Index (Germanwatch), and IFRS Foundation jurisdiction profiles. The assembled panel is available from the corresponding author on reasonable request.
Conflicts of Interest
The authors declare no conflicts of interest.
References
- Gordon, L.A.; Loeb, M.P.; Zhu, W. The impact of IFRS adoption on foreign direct investment. J. Account. Public Policy 2012, 31, 374–398.
- Bushman, R.M.; Smith, A.J. Financial accounting information and corporate governance. J. Account. Econ. 2001, 32, 237–333.
- Leuz, C.; Nanda, D.; Wysocki, P.D. Earnings management and investor protection: An international comparison. J. Financ. Econ. 2003, 69, 505–527.
- Chipalkatti, N.; Le, Q.V.; Rishi, M. Sustainability and society: Do environmental, social, and governance factors matter for foreign direct investment? Energies 2021, 14, 6039.
- Dunning, J.H. Location and the multinational enterprise: A neglected factor? J. Int. Bus. Stud. 1998, 29, 45–66.
- Spatareanu, M. Searching for pollution havens: The impact of environmental regulations on foreign direct investment. J. Environ. Dev. 2007, 16, 161–182.
- Borensztein, E.; De Gregorio, J.; Lee, J.-W. How does foreign direct investment affect economic growth? J. Int. Econ. 1998, 45, 115–135.
- Iamsiraroj, S. The foreign direct investment–economic growth nexus. Int. Rev. Econ. Financ. 2016, 42, 116–133.
- Bailey, N. Exploring the relationship between institutional factors and FDI attractiveness: A meta-analytic review. Int. Bus. Rev. 2018, 27, 139–148.
- DeFond, M.; Hu, X.; Hung, M.; Li, S. The impact of mandatory IFRS adoption on foreign mutual fund ownership: The role of comparability. J. Account. Econ. 2011, 51, 240–258.
- Arellano, M.; Bover, O. Another look at the instrumental variable estimation of error-components models. J. Econom. 1995, 68, 29–51.
- Blundell, R.; Bond, S. Initial conditions and moment restrictions in dynamic panel data models. J. Econom. 1998, 87, 115–143.
- Globerman, S.; Shapiro, D. Global foreign direct investment flows: The role of governance infrastructure. World Dev. 2002, 30, 1899–1919.
- Buchanan, B.G.; Le, Q.V.; Rishi, M. Foreign direct investment and institutional quality: Some empirical evidence. Int. Rev. Financ. Anal. 2012, 21, 81–89.
- La Porta, R.; Lopez-de-Silanes, F.; Shleifer, A.; Vishny, R.W. Law and finance. J. Political Econ. 1998, 106, 1113–1155.
- Djankov, S.; Ganser, T.; McLiesh, C.; Ramalho, R.; Shleifer, A. The effect of corporate taxes on investment and entrepreneurship. Am. Econ. J. Macroecon. 2010, 2, 31–64.
- Cheng, L.K.; Kwan, Y.K. What are the determinants of the location of foreign direct investment? The Chinese experience. J. Int. Econ. 2000, 51, 379–400.
- Daske, H.; Hail, L.; Leuz, C.; Verdi, R. Mandatory IFRS reporting around the world: Early evidence on the economic consequences. J. Account. Res. 2008, 46, 1085–1142.
- Ball, R. International Financial Reporting Standards (IFRS): Pros and cons for investors. Account. Bus. Res. 2006, 36, 5–27.
- Kaufmann, D.; Kraay, A.; Mastruzzi, M. The Worldwide Governance Indicators: Methodology and analytical issues. Hague J. Rule Law 2011, 3, 220–246.
- Roodman, D. How to do xtabond2: An introduction to difference and system GMM in Stata. Stata J. 2009, 9, 86–136.
- Windmeijer, F. A finite sample correction for the variance of linear efficient two-step GMM estimators. J. Econom. 2005, 126, 25–51.
- González, A.; Teräsvirta, T.; van Dijk, D. Panel Smooth Transition Regression Models; Research Paper 165; Quantitative Finance Research Centre, University of Technology Sydney: Sydney, Australia, 2005.
Figure 1.
Baseline determinants of FDI, 2006–2020 (HDI omitted for scale).
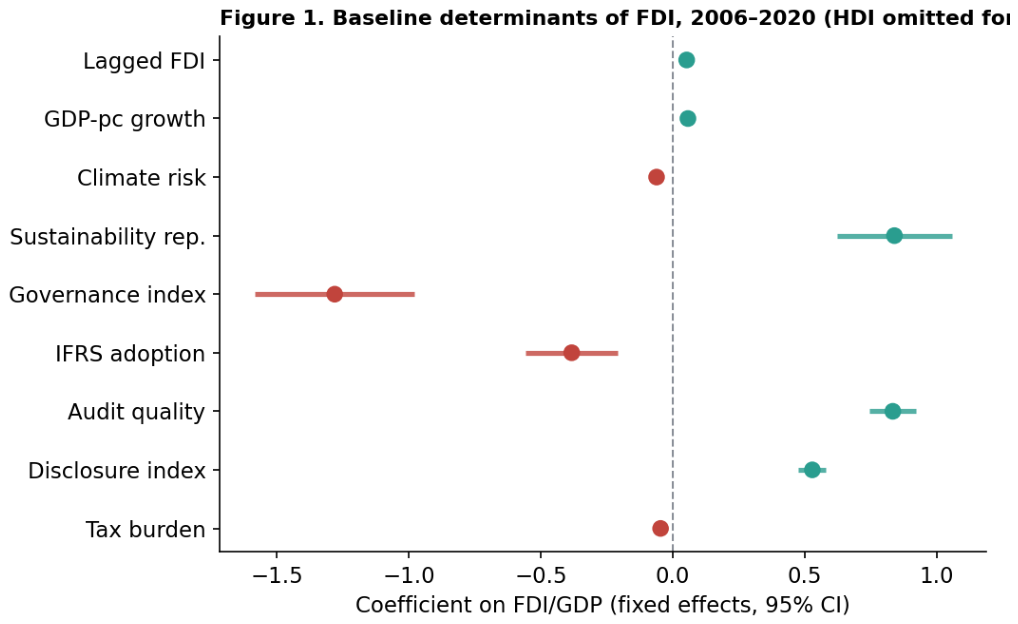
Figure 2.
Fixed-effects versus system-GMM estimates.
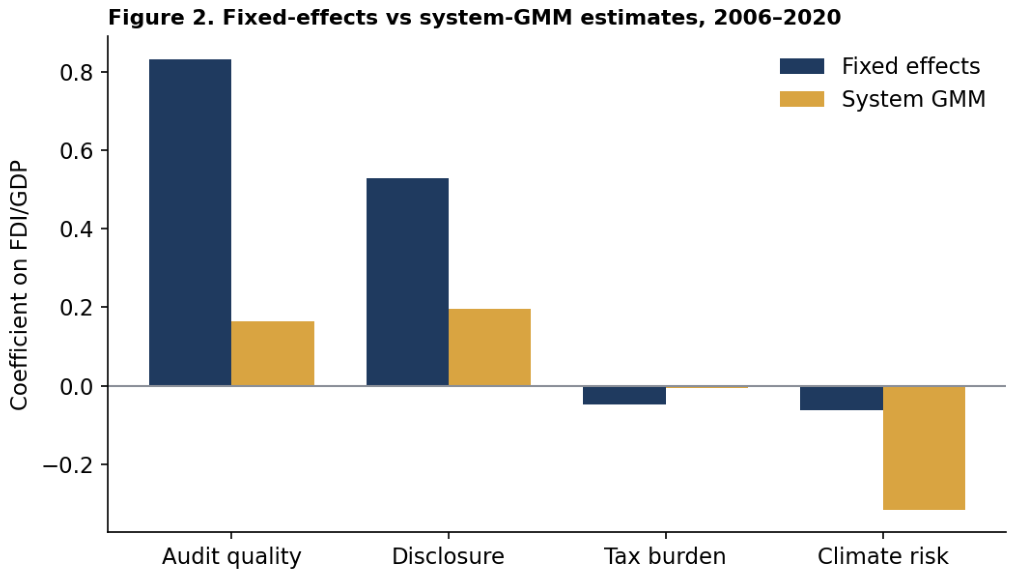
Figure 3.
Accounting and tax effects by income group, 2006–2020.
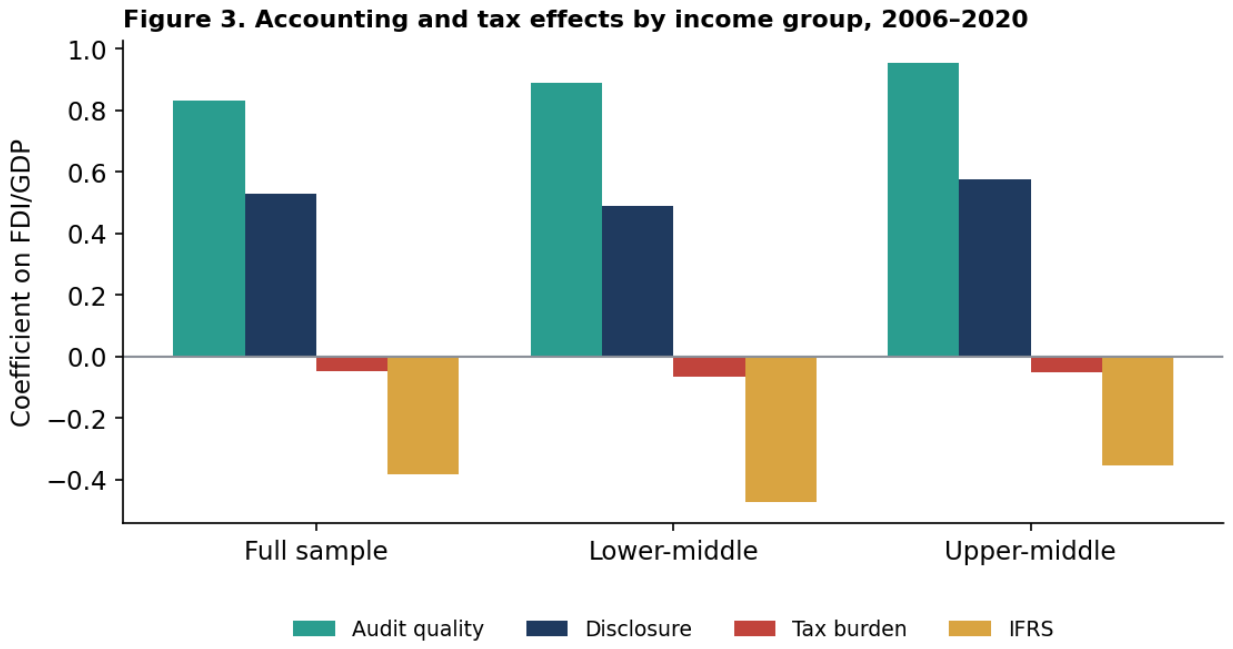
Figure 4.
PSTR transition across the governance range, 2006–2020.
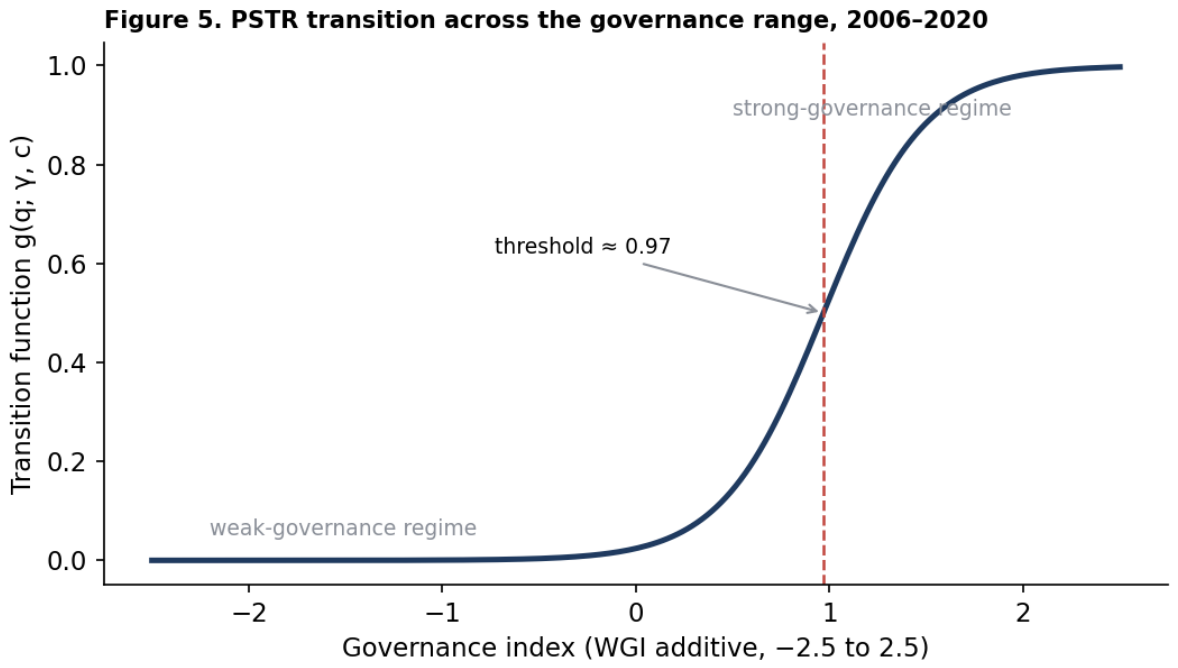
Figure 5.
Regime-specific effects by governance quality (PSTR), 2006–2020.
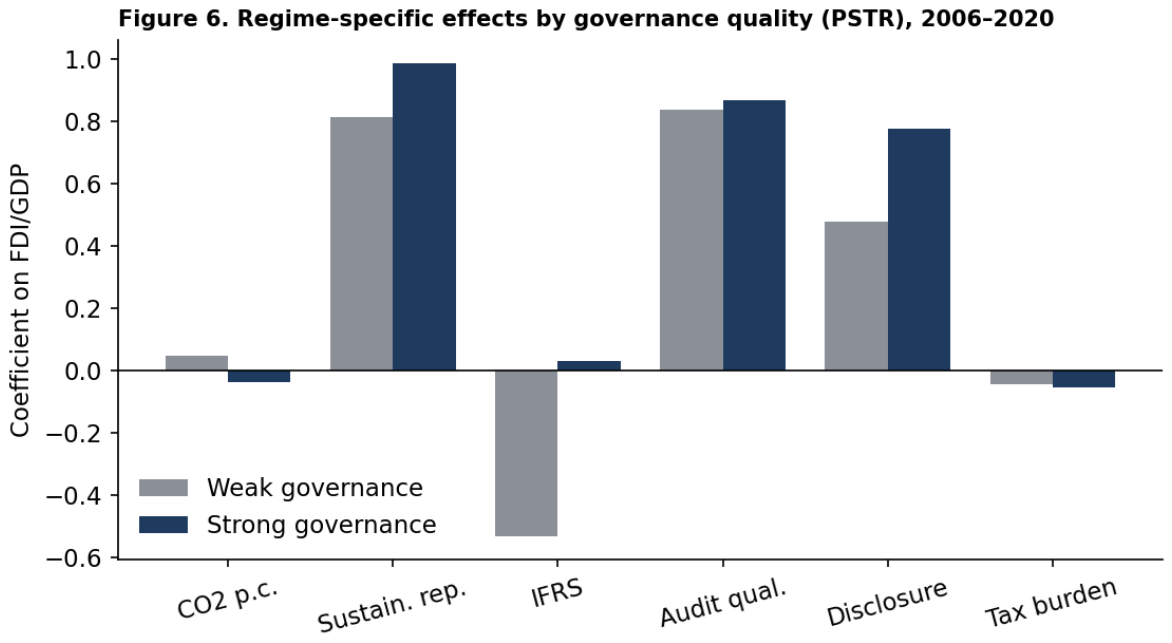

Table 1.
Descriptive statistics, 2006–2020.
| Variable | Mean | Std. Dev. | Min | Max |
| FDI/GDP | 3.12 | 3.98 | −9.36 | 15.36 |
| Gross capital formation | 25.03 | 6.99 | 5.00 | 46.63 |
| GDP-per-capita growth | 1.82 | 4.01 | −10.36 | 14.36 |
| Trade openness | 85.79 | 38.74 | 10.00 | 208.61 |
| CO2 per capita | 4.98 | 4.25 | 0.01 | 19.95 |
| Governance index | 0.00 | 0.92 | −2.50 | 2.50 |
| Climate risk index | 70.31 | 11.59 | 33.61 | 100.00 |
| Human Development Index | 0.68 | 0.14 | 0.24 | 0.98 |
| Sustainability reporting | 0.14 | 0.35 | 0 | 1 |
| IFRS adoption | 0.56 | 0.50 | 0 | 1 |
| Audit quality | 4.00 | 1.24 | 1 | 7 |
| Disclosure index | 4.64 | 1.80 | 0 | 10 |
| Tax burden | 37.42 | 8.69 | 10.00 | 67.89 |
Notes: 3,975 country-year observations, 265 economies. The governance index correlates near 0.59 with both audit quality and disclosure.
Table 2.
Baseline estimates, dependent variable FDI/GDP, 2006–2020.
| Regressor | Fixed Effects | System GMM |
| Lagged FDI/GDP | 0.052 *** | −0.004 |
| Gross capital formation | 0.011 | 0.032 |
| GDP-per-capita growth | 0.057 *** | −0.068 |
| Trade openness | 0.001 | −0.005 * |
| Climate risk index | −0.062 *** | −0.316 *** |
| CO2 per capita | 0.011 | 0.130 |
| Sustainability reporting | 0.839 *** | −0.517 |
| Governance index | −1.281 *** | 2.463 |
| Human Development Index | −25.48 *** | −52.46 *** |
| IFRS adoption | −0.383 *** | 0.809 |
| Audit quality | 0.833 *** | 0.163 |
| Disclosure index | 0.528 *** | 0.195 |
| Tax burden | −0.047 *** | −0.007 |
| Observations | 3,975 | 3,445 |
| Countries | 265 | 265 |
| Instruments | — | 30 |
| AR(2) p-value | — | 0.977 |
| Hansen p-value | — | 0.977 |
Notes: *** p < 0.01, * p < 0.10. Cluster-robust standard errors for fixed effects; Windmeijer-corrected two-step standard errors for GMM.
Table 3.
Fixed-effects estimates by income group, dependent variable FDI/GDP, 2006–2020.
| Regressor | Full Sample | Lower-Middle | Upper-Middle |
| Climate risk index | −0.062 *** | −0.067 *** | −0.062 *** |
| CO2 per capita | 0.011 | −0.107 | 0.081 ** |
| Sustainability reporting | 0.839 *** | 0.801 *** | 0.742 *** |
| Governance index | −1.281 *** | −1.794 *** | −1.213 *** |
| Human Development Index | −25.48 *** | −23.18 *** | −25.74 *** |
| IFRS adoption | −0.383 *** | −0.472 ** | −0.353 * |
| Audit quality | 0.833 *** | 0.891 *** | 0.955 *** |
| Disclosure index | 0.528 *** | 0.490 *** | 0.575 *** |
| Tax burden | −0.047 *** | −0.066 *** | −0.050 *** |
| Lagged FDI/GDP | 0.052 *** | 0.048 | 0.022 |
| Observations | 3,975 | 705 | 885 |
| Within R2 | 0.629 | 0.655 | 0.643 |
Notes: *** p < 0.01, ** p < 0.05, * p < 0.10. Cluster-robust standard errors.
Table 4.
Linear conditional and nonlinear specifications, dependent variable FDI/GDP.
| Term | Reporting × Audit | IFRS × Governance | Tax Quadratic |
| Sustainability reporting | 1.395 *** | 0.834 *** | 0.838 *** |
| Audit quality | 0.849 *** | 0.832 *** | 0.833 *** |
| Reporting × audit quality | −0.130 | ||
| IFRS adoption | −0.382 *** | −0.365 *** | −0.382 *** |
| Governance index | −1.280 *** | −1.362 *** | −1.281 *** |
| IFRS × governance | 0.142 | ||
| Tax burden | −0.047 *** | −0.047 *** | −0.031 |
| Tax burden squared | −0.0002 | ||
| Observations | 3,975 | 3,975 | 3,975 |
Notes: *** p < 0.01. Cluster-robust standard errors. Controls and the lagged dependent variable are included but omitted from the table.
Table 5.
Panel smooth transition regression, transition variable governance index, 2006–2020.
| Regressor | Weak-Governance Regime | Strong-Governance Regime |
| CO2 per capita | 0.048 ** | −0.038 |
| Sustainability reporting | 0.813 *** | 0.984 |
| Governance index | −1.325 *** | −1.351 |
| Human Development Index | −23.83 *** | −32.57 |
| IFRS adoption | −0.532 *** | 0.029 |
| Audit quality | 0.836 *** | 0.868 |
| Disclosure index | 0.477 *** | 0.775 |
| Tax burden | −0.044 *** | −0.054 |
| Transition speed γ | 3.5 | |
| Threshold c (governance) | 0.97 | |
| Linearity test p-value | < 0.001 |
Notes: *** p < 0.01, ** p < 0.05 for the lower-regime coefficients. Upper-regime values are the sums of the lower-regime and transition coefficients and are estimated from fewer high-governance observations, so they are less precise.
Disclaimer/Publisher’s Note: The statements, opinions and data contained in all publications are solely those of the individual author(s) and contributor(s) and not of MDPI and/or the editor(s). MDPI and/or the editor(s) disclaim responsibility for any injury to people or property resulting from any ideas, methods, instructions or products referred to in the content. |
© 2026 by the authors. Licensee MDPI, Basel, Switzerland. This article is an open access article distributed under the terms and conditions of the Creative Commons Attribution (CC BY) license (http://creativecommons.org/licenses/by/4.0/).
Copyright: This open access article is published under a Creative Commons CC BY 4.0 license, which permit the free download, distribution, and reuse, provided that the author and preprint are cited in any reuse.