

Submitted:
12 August 2026
Posted:
13 August 2026
You are already at the latest version
Abstract
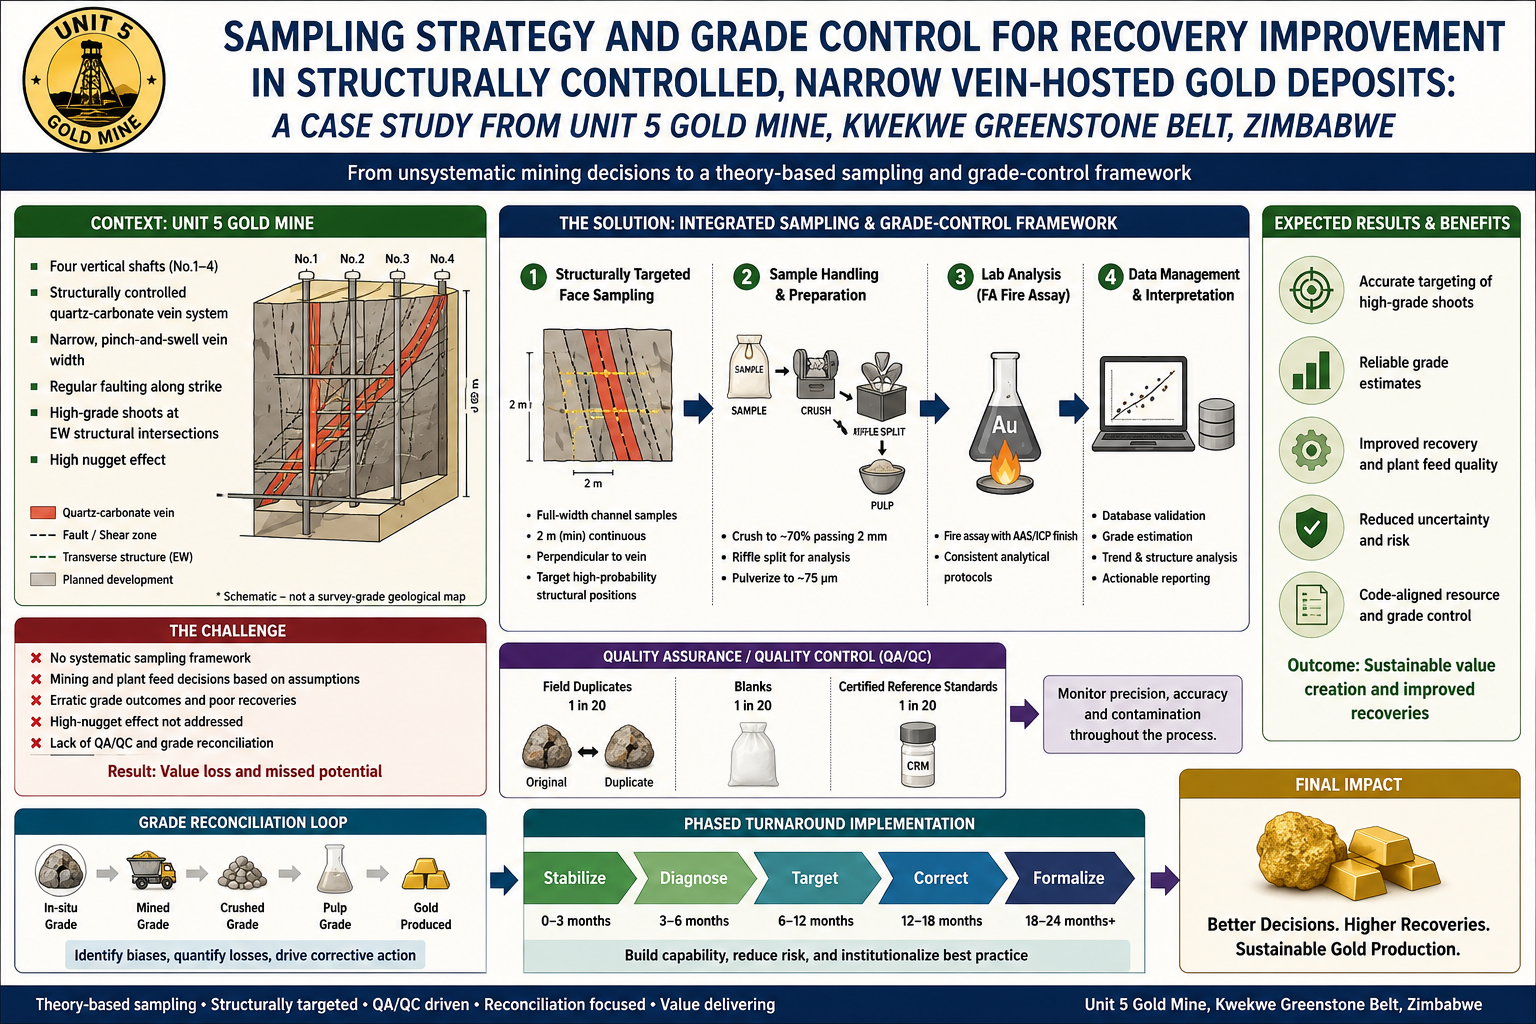
Small-scale gold operations hosted in structurally controlled, narrow quartz-carbonate vein systems commonly report disappointing recoveries and erratic grade outcomes despite reasonable metallurgical practice. This paper argues that the root cause in many such cases is not metallurgical but originates upstream, in the absence of a systematic, theory-based sampling and grade-control framework. Using Unit 5 gold mine in the Kwekwe Greenstone Belt of Zimbabwe as a case study — a four-shaft, structurally controlled vein system with narrow, pinch-and-swell vein width and characteristics typical of high-nugget-effect gold deposits — established sampling theory and the narrow-vein gold sampling literature are applied to design a face-sampling, quality assurance and quality control, and grade-reconciliation methodology fitted to the deposit's actual geometry. A phased turnaround action plan is presented, moving the operation from unsystematic mining decisions toward a defensible, code-aligned resource and grade-control base. The approach is transferable to comparable small-scale, structurally controlled vein gold operations elsewhere in the region.
Keywords:
sampling theory
; nugget effect
; narrow vein gold
; channel sampling
; grade control
; mineral resource reporting
1. Introduction
Unit 5 gold mine is currently mined without a systematic sampling framework. Decisions on where to mine, what grade is being sent to the plant, and what recovery to expect are being made without representative data, and the result is disappointing grade outcomes and poor recoveries relative to the mine’s known geological potential. The deposit is a structurally controlled, quartz-carbonate vein system with historical references to high-grade shoots that remain unverified. This paper sets out a sampling methodology matched to the actual reef geometry at Unit 5, grounded in established sampling theory, followed by a turnaround action plan covering sampling, grade control, and metallurgical recovery.
2. Theoretical Framework
2.1. Sampling Theory and the Fundamental Sampling Error
The Theory of Sampling developed by Gy (1979) and elaborated by Pitard (1993) establishes that any particulate material—ore, pulp, or broken rock—is intrinsically heterogeneous, and that this heterogeneity has two components: constitution heterogeneity, the variation in the physical and chemical composition of individual fragments, and distribution heterogeneity, the spatial arrangement of those fragments within the lot. A sample can only be considered representative if it is correct, meaning every fragment in the lot has an equal, non-zero probability of being selected, and of adequate mass relative to the fundamental sampling error implied by the material’s heterogeneity (Gy, 1995; Minnitt, Rice, and Spangenberg, 2007). Grab sampling and visual ore or waste selection, common in small-scale operations, violate the correctness principle directly and are a primary source of grade misclassification.
2.2. The Nugget Effect in Narrow-Vein Gold Systems
Vein-hosted, structurally controlled gold deposits, the class to which Unit 5 belongs, are well documented to exhibit a high to extreme nugget effect, driven by the erratic, localized distribution of coarse, often visible gold within a narrow vein structure (Dominy et al., 2000; Dominy, 2003; Dominy and Xie, 2016). Under a high nugget effect, sample-to-sample grade variance can remain large even at short spacing, meaning conventional, low-density or opportunistic sampling systematically fails to characterize the true grade distribution. The practical response established in this literature is not to abandon sampling but to increase sample density and mass at the specific structural positions where ore shoots are geologically expected, and to use full-width, continuous channel sampling rather than point or grab methods (Dominy et al., 2001; Dominy, 2003).
2.3. Geological Continuity and Structural Control
Dominy (2003) demonstrates that narrow, structurally controlled veins are frequently discontinuous at the scale of conventional drill spacing; a vein can pinch, swell, or step across a fault and be entirely missed or misrepresented by widely spaced sampling. This is directly analogous to the mapped condition at Unit 5: a north-south reef with narrow, pinch-and-swell width, cut by regular faulting along strike, with high-grade shoots controlled by intersection with east-west transverse structures. Sampling protocols for such deposits must therefore be structurally targeted rather than evenly distributed, concentrating density at mapped or inferred intersection zones (Dominy et al., 1997; Dominy, 2003).
2.4. Reporting and Classification Standards
Public and investor-facing reporting of exploration results, mineral resources, and ore reserves in the jurisdictions most relevant to international mining finance is governed by CRIRSCO-aligned codes, principally the JORC Code (Joint Ore Reserves Committee, 2012) and the South African SAMREC Code (South African Mineral Resource Committee, 2016), both of which require sampling, quality assurance and quality control, and data verification procedures to be explicitly disclosed by a Competent Person before a resource can be classified and reported. Progressing the Unit 5 data from historical, unverified records toward a compliant resource estimate requires the sampling and quality control framework set out below as a prerequisite, not an optional refinement.
3. Site Background
Unit 5 gold mine is located approximately 25 kilometres west of Kwekwe on the Silobela road, Midlands Province, within the Kwekwe Greenstone Belt of the Zimbabwe Craton. It is a structurally controlled, quartz-carbonate vein-hosted gold project with four active shafts targeting mineralization at north-south reef and east-west transverse structure intersections. The host rock is arkose and greywacke, with an oxidation profile to approximately 20 metres depth and transition to sulphide facies by approximately 100 metres. The main reef trends north-south, dips approximately 45 degrees east, has a strike length of approximately 600 metres, and a vein width of 0.5 to 2 metres displaying pinch-and-swell character. Faulting recurs approximately every 20 metres along strike, with three distinct joint sets mapped and an average fracture frequency of approximately 3 metres. Historical, unverified records reference a 40 metre wide mineralized zone at a grade of 19 grams per tonne at the main shaft, and historical production figures up to 600 grams per tonne; both are classified as pending verification and do not currently constitute a compliant mineral resource.
4. Materials and Methods
4.1. Reasons for Poor Current Performance
- Without face or channel sampling, ore and waste are separated by eye—at Unit 5’s narrow, pinch-and-swell vein width, visual judgement alone routinely mixes barren wall rock into the ore stream and dilutes grade, consistent with the correctness violations described in the Theory of Sampling.
- Without systematic sampling at the mapped north-south and east-west structural intersections, high-grade shoots are found by chance rather than targeted, and low-grade reef sections consume the same development effort as bonanza zones.
- Without a sample database, there is no basis for short-interval grade control, no way to reconcile mill-head grade against what was actually broken, and no way to determine whether a recovery shortfall is a mining problem, such as dilution or ore sent incorrectly to the plant, or a metallurgical problem, such as locked gold or reagent starvation.
4.2. Proposed Sampling Methodology
4.2.1. Face and Channel Sampling
Channel sampling is the standard method for narrow, structurally controlled veins of this type, as it captures the full vein width in one continuous cut rather than a biased grab of the richest-looking material, directly addressing the correctness requirement of the Theory of Sampling.
- Cut a continuous channel perpendicular to the vein, full width, including 10 to 15 centimetres of hanging wall and footwall contact on each side, which is critical at Unit 5 given the pinch-and-swell geometry.
- Sample every face advance at each of the four active shafts, rather than on a fixed calendar interval, so that grade data ties directly to the muck pile it describes.
- At the mapped structural intersections, increase sample density, cutting channels at 1 to 2 metre spacing through the intersection zone.
- Log and photograph each channel location against the mine’s structural map before sampling, so that results can be tied back to fault position and joint set orientation.
4.2.2. Chip and Grab Sampling
- Use only where channel sampling is impractical; take multiple chips systematically across the face rather than a single grab, and do not rely on grab sampling alone for grade-control decisions.
4.2.3. Diamond Core Drilling
- Prioritize the structural intersections at all four shafts to verify or refute the historical high-grade references, which remain unusable for planning until confirmed.
- Drill on section lines spaced to intersect the main reef at multiple depths per shaft, capturing the transition from oxidized to sulphide facies.
- Log core for rock mass rating alongside assay, tying ground stability data to grade data on the same drill hole.
4.2.4. Sample Interval and Quality Control
Table 1 sets out the quality assurance and quality control requirements recommended for the programme.
Quality control failure, rather than laboratory error, is one of the most common causes of a mine’s reconciled grade drifting from its sampled grade (Minnitt, Rice, and Spangenberg, 2007).
4.3. Grade Control
- Build a face-sample database recording date, shaft, level, face location, channel width, assay grade, and proximity to the nearest mapped structural intersection.
- Use the database to make ore and waste calls at the face before blasting, rather than after.
- Reconcile mill-head grade against the weighted average of the face samples that fed that shift’s ore; a persistent gap is the clearest signal of a mining-side problem rather than a metallurgical one.
4.4. Metallurgical Recovery
- Run bottle-roll leach tests on samples from each shaft and level combination, since recovery behaviour is likely to vary with the oxide to sulphide transition.
- Track recovery against reagent and pH parameters already in use in the leach programme, cross-referencing underperforming batches against the shaft and level of origin.
- Where recoveries remain poor despite adequate reagent dosing, request a mineralogical study to establish whether gold is refractory rather than assuming reagent starvation.
5. Results: A Phased Turnaround Action Plan
Table 2 sets out a phased turnaround action plan derived from the methodology above.
6. Discussion
The methodology proposed here is not novel in the international narrow-vein gold literature; channel sampling, structurally targeted density, and rigorous quality control are well established responses to the high-nugget-effect problem documented across comparable deposits (Dominy et al., 2000; Dominy, 2003; Dominy and Xie, 2016). The contribution of this paper is the direct application of that framework to a specific, active small-scale operation where it has, to date, not been applied, and a practical, phased path from the current unsystematic state to a code-aligned resource base. The approach is transferable to the wider population of small-scale, structurally controlled vein gold operations in the Kwekwe district and similar greenstone belt settings, where the same combination of narrow, discontinuous veins and unsystematic sampling practice is common.
7. Conclusions
Poor recoveries and disappointing grade outcomes at Unit 5 are, on the evidence available, more plausibly explained by the absence of a representative sampling and grade-control framework than by an intrinsically poor ore body. Applying established sampling theory, full-width channel sampling matched to actual vein geometry, structurally targeted density at mapped intersections, and disciplined quality control, combined with a mill-head to face-sample reconciliation process, gives the operation both a diagnostic tool to separate mining losses from metallurgical losses and a verified data foundation on which a compliant mineral resource can eventually be built.
Supplementary Materials
The following supporting information can be downloaded at the website of this paper posted on Preprints.org.
Author Contributions
Conceptualization, methodology, investigation, writing—original draft preparation, and writing—review and editing were all carried out by the sole author, C.S.
Funding
This research received no external funding.
Data Availability Statement
The geological and structural data underlying this study are held in the mine’s internal geology and structural evaluation records and are available from the author on reasonable request.
Conflicts of Interest
The author declares no conflict of interest. The author is an officer of Sishonya Vanguard Mining, the operator of the case-study site.
References
- Dominy, S.C.; Annels, A.E.; Camm, G.S.; Cuffley, B.W.; Hodkinson, I.P. Geology in the resource and reserve estimation of narrow vein deposits. Explor. Min. Geol. 1997, vol. 6(no. 4), 31–33. [Google Scholar]
- Dominy, S.C.; Johansen, G.F.; Cuffley, B.W.; Platten, I.M.; Annels, A.E. Estimation and reporting of mineral resources for coarse gold-bearing veins. Explor. Min. Geol. 2000, vol. 9(no. 1), 13–42. [Google Scholar] [CrossRef]
- Dominy, S.C.; Johansen, G.F.; Annels, A.E. Bulk sampling as a tool for the grade evaluation of gold-quartz reefs. Appl. Earth Sci. 2001, vol. 110(no. 3), 176–191. [Google Scholar] [CrossRef]
- Dominy, S.C. Grade and geological continuity in high-nugget effect gold-quartz reefs: implications for resource estimation and reporting. Appl. Earth Sci. 2003, vol. 112(no. 3), B239–B259. [Google Scholar] [CrossRef]
- Dominy, S.C.; Xie, Y. Optimising sampling protocols via the heterogeneity test: challenges in coarse gold mineralisation. Appl. Earth Sci. 2016, vol. 125(no. 1), 24–37. [Google Scholar]
- Gy, P.M. Sampling of Particulate Materials: Theory and Practice; Elsevier: Amsterdam, 1979. [Google Scholar]
- Gy, P.M. Introduction to the theory of sampling. Part 1: Heterogeneity of a population of uncorrelated units. Trends Anal. Chem. 1995, vol. 14(no. 2), 67–76. [Google Scholar] [CrossRef]
- Joint Ore Reserves Committee. Australasian Code for Reporting of Exploration Results, Mineral Resources and Ore Reserves (the JORC Code), 2012 edition; The Joint Ore Reserves Committee of the Australasian Institute of Mining and Metallurgy, Australian Institute of Geoscientists, and Minerals Council of Australia: Melbourne, 2012. [Google Scholar]
- Minnitt, R.C.A.; Rice, P.M.; Spangenberg, C. Part 1: understanding the components of the fundamental sampling error—a key to good sampling practice. J. South. Afr. Inst. Min. Metall. 2007, vol. 107(no. 8), 505–511. [Google Scholar]
- Pitard, F.F. Pierre Gy’s Sampling Theory and Sampling Practice: Heterogeneity, Sampling Correctness, and Statistical Process Control, 2nd edn; CRC Press: Boca Raton, 1993. [Google Scholar]
- South African Mineral Resource Committee. The South African Code for the Reporting of Exploration Results, Mineral Resources and Mineral Reserves (the SAMREC Code), 2016 edition; Southern African Institute of Mining and Metallurgy: Johannesburg, 2016. [Google Scholar]

Table 1.
Quality assurance and quality control requirements.
| Control | Requirement |
|---|---|
| Sample length | Channel: full vein width plus contacts; core: 1 metre runs typical, halved at high-grade contacts |
| Duplicates | One in every 20 samples, same interval re-cut or re-split |
| Blanks | One in every 20 samples, inserted at point of sampling |
| Certified reference standards | One in every 20 samples |
| Chain of custody | Sealed, numbered sample bags, logged before leaving site |
Table 2.
Phased turnaround action plan.
| Phase | Actions | Timeframe |
|---|---|---|
| Stabilize | Introduce face and channel sampling at all four shafts; build the sample database; begin quality control | Immediate to month 1 |
| Diagnose | Reconcile mill-head grade against face-sample grade; run bottle-roll tests by shaft and level | Month 1 to 2 |
| Target | Increase sample density at mapped structural intersections; prioritize verification drilling | Month 2 to 4 |
| Correct | Implement face-based ore and waste calls; adjust reagent regime by shaft and level; retrain sampling crew | Month 3 to 5 |
| Formalize | Progress toward a maiden mineral resource estimate using the verified sample and drilling database | Month 6 onward |
Disclaimer/Publisher’s Note: The statements, opinions and data contained in all publications are solely those of the individual author(s) and contributor(s) and not of MDPI and/or the editor(s). MDPI and/or the editor(s) disclaim responsibility for any injury to people or property resulting from any ideas, methods, instructions or products referred to in the content. |
© 2026 by the authors. Licensee MDPI, Basel, Switzerland. This article is an open access article distributed under the terms and conditions of the Creative Commons Attribution (CC BY) license (http://creativecommons.org/licenses/by/4.0/).
Copyright: This open access article is published under a Creative Commons CC BY 4.0 license, which permit the free download, distribution, and reuse, provided that the author and preprint are cited in any reuse.