

Submitted:
08 August 2026
Posted:
13 August 2026
You are already at the latest version
Abstract
Coagulopathy is a frequent complication after traumatic brain injury (TBI), yet few studies directly compare fibrin degradation products (FDP) and D-dimer as independent predictors of discharge functional impairment evaluated by modified Rankin Scale (mRS) in mild-to-moderate closed TBI. This single-center retrospective cohort enrolled 140 consecutive closed TBI inpatients to compare the independent prognostic value of admission FDP and D-dimer for discharge mRS. Ordinal logistic regression with three adjustment schemes and restricted cubic spline (RCS) modeling was adopted to assess predictive effects and nonlinear relationships, while negative binomial regression analyzed their correlation with hospital length of stay (LOS). After full confounder adjustment, admission FDP independently predicted poor functional outcome (OR = 1.749, 95% CI 1.019–3.002, P = 0.042) with an evident nonlinear threshold effect, whereas D-dimer lost statistical significance (P = 0.075); neither marker was associated with LOS (all P > 0.05). These findings indicate that admission FDP is a superior, specific independent biomarker for predicting discharge functional disability in closed TBI compared with D-dimer, and can support early clinical risk stratification.
Keywords:
traumatic brain injury
; fibrin degradation products
; D-dimer
; coagulation function
; functional outcome
; modified Rankin Scale
1. Introduction
Traumatic brain injury (TBI) is a global leading cause of death and disability. The 2021 Global Burden of Disease study recorded 20.84 million new and 37.93 million prevalent TBI cases worldwide, leading to 5.48 million years lived with disability [1]. Maas et al. reported TBI carries the highest incidence among neurological illnesses and brings both acute damage and long-term chronic sequelae [2]. Closed TBI, mostly induced by traffic crashes and falls, causes diverse clinical outcomes; many patients recover rapidly, yet a large proportion sustain persistent functional deficits that damage life quality and social productivity [3]. Thus early screening for high-risk TBI patients is vital for personalized clinical management.
Coagulopathy is a unique acute TBI complication. Damaged brain tissue secretes tissue factor-rich microvesicles into blood, activating extrinsic coagulation and secondary hyperfibrinolysis to break hemostatic balance [4]. Zhang et al. clarified this pathological cascade: local brain injury triggers systemic coagulation disorders, mixing hypercoagulability and hyperfibrinolysis to worsen intracranial and systemic hemorrhage [5]. Clinical data indicate coagulopathy occurs in 10–97% of TBI patients, raising mortality risk 9-fold and adverse outcome odds 30-fold [6].
D-dimer (DD) and fibrin degradation products (FDP) are sensitive fibrinolytic markers. DD peaks within 3 hours post-TBI then declines gradually [7]. Hayakawa et al. verified hyperfibrinolysis after TBI correlates with hematoma expansion, with DD and FDP reflecting this dynamic process [8]. Multiple cohorts have validated DD’s prognostic value for death: a 1,338-patient multicenter trial found elevated admission DD independently predicted in-hospital complications and long-term mortality [9]; a Japanese national trauma database also linked high DD to chronic neurological dysfunction [10]. In contrast, clinical evidence supporting FDP as a prognostic marker remains limited. Kaufman et al. first identified an inverse correlation between admission FDP and GOS in severe closed TBI, with predictive performance comparable to GCS [11], while a 204-patient cohort further confirmed FDP independently predicts poor prognosis among mild TBI individuals [12].
Four critical research gaps remain unaddressed in existing literature. First, most prior studies adopted mortality or GOS as primary endpoints rather than discharge mRS, a scale enabling finer grading of post-discharge functional impairment. Second, relevant evidence predominantly focuses on severe mixed TBI populations, with few data specific to mild-to-moderate isolated closed TBI. Third, head-to-head comparisons of the independent predictive capacity of DD and FDP within identical cohorts are scarce. Fourth, the association between the two fibrinolytic markers and hospital length of stay (LOS) has rarely been explored, restricting understanding of their outcome-specific predictive roles.
Against this background, the present single-center retrospective cohort study analyzed five routine admission coagulation indicators (PT, TT, FBG, FDP, DD) and their independent associations with discharge mRS among closed TBI patients. We adopted three sequentially adjusted regression models, restricted cubic spline (RCS) and subgroup analyses to systematically compare the prognostic performance of DD and FDP, and further explored their correlation with LOS to distinguish their predictive specificity for different clinical outcomes. Briefly, our work intends to supply clinical evidence supporting early risk stratification using routine fibrinolytic markers. Notably, our analysis reveals that admission FDP acts as a more robust independent predictor of post-discharge functional disability than D-dimer, with a detectable nonlinear threshold effect, while neither marker correlates with hospitalization duration—findings that fill the abovementioned research gaps through direct comparative assessment of the two biomarkers in mild-to-moderate closed TBI.
2. Materials and Methods
2.1. Study Design and Participants
This single-center retrospective cohort enrolled consecutive closed TBI inpatients admitted to the 941st Hospital between September 2023 and December 2025. Inclusion criteria: 1) clinical and imaging-confirmed mild/moderate/severe closed TBI or closed epidural hematoma; 2) complete admission coagulation tests; 3) pre-injury and discharge mRS records. Exclusion criteria: 1) unidentifiable patient ID; 2) over 30 missing core variables; 3) uncorrectable admission data errors.
2.2. Data Collection
All data were extracted from electronic medical records, including:
Demographics: age, sex, BMI, blood type, smoking and drinking duration/volume.
Injury data: injury mechanisms, admission time, primary diagnosis, binary comorbidities (scalp injury, fracture, intracranial hemorrhage, concussion, etc.).
Admission vital signs: temperature, pulse, respiratory rate, SBP, DBP.
Laboratory tests: blood routine, five coagulation indicators, liver/kidney function, serum electrolytes.
Medical history: hypertension, coronary heart disease, diabetes and disease course; pre-injury and discharge mRS.
2.3. Outcome Definitions
Primary outcome: discharge mRS, which was categorized into investigator-defined ordinal three tiers (0 asymptomatic, 1 mild dysfunction, ≥2 obvious disability) as well as standard binary grouping (mRS≥2 = poor outcome, mRS<2 = good outcome). Secondary outcome: continuous LOS value.
2.4. Exposure Variables
PT, TT, FBG, FDP, DD were core exposures. Log1p transformation was applied to FDP and DD to correct right-skewed distribution before regression.
2.5. Statistical Analysis
Continuous data: median (IQR), Kruskal–Wallis test for intergroup comparison. Categorical data: count (percentage), Fisher’s exact test. All comparisons stratified by discharge mRS tiers.
Spearman correlation was used to assess associations between lab indices, LOS and mRS, visualized via heatmaps (*P<0.05, **P<0.01, ***P<0.001).
Ordinal proportional odds regression matched 3-tier mRS. The proportional odds assumption was tested using the Brant test, and no significant violation was detected (all P > 0.05), supporting the use of the proportional odds model. Binary logistic regression matched dichotomized mRS. Three adjustment schemes: Model 1 crude; Model 2 adjusted for age + sex; Model 3 further adjusted for primary diagnosis and baseline mRS. Results shown as OR with 95% CI.
RCS with four knots assessed nonlinear dose-response of DD/FDP, output overall and nonlinear P values via Wald test.
Subgroup stratification: age (<65/≥65), sex, hypertension history, injury mechanisms, TBI severity. Firth penalized logistic regression solved small-sample separation bias; interaction P calculated via likelihood ratio test.
Negative binomial regression analyzed DD/FDP and LOS (adjusted for age, sex, injury mechanisms, hemorrhage, fracture), reported as incidence rate ratios (IRRs) with 95%CI.
All analyses used R 4.4.2, two-sided α=0.05.
2.6. Ethical Approval
This study was conducted in accordance with the Declaration of Helsinki and approved by the Institutional Review Board of The 941st Hospital of the Joint Logistics Support Force of the Chinese People's Liberation Army (approval number: 941-IRB-2026005). Informed consent was waived because of the retrospective study design and use of anonymized clinical data.
No generative artificial intelligence tools were used in the design, execution, data analysis, figure generation, or writing of this manuscript.
Restrictions apply to the availability of these clinical patient-level data. Individual electronic medical record data cannot be publicly shared owing to hospital data-protection regulations; aggregated analytical datasets may be available upon reasonable request to the corresponding author with formal ethical approval.
3. Results
3.1. Baseline Characteristics
A total of 140 patients with closed TBI were stratified by discharge mRS into three groups (Table 1).
Patients with poorer functional outcomes were significantly older (P = 0.018) and more likely to be male (P = 0.016). Pulse rate (P = 0.021) and respiratory rate (P = 0.001) increased progressively with worsening outcomes, while blood pressure showed no significant difference (P > 0.05).
Among coagulation markers, D-dimer and FDP showed the most significant differences across groups and increased progressively with worsening outcomes (both P < 0.001); prothrombin time and fibrinogen also showed significant differences (P = 0.026 and P = 0.029, respectively). In the mRS ≥2 group, white blood cell count (P = 0.011) and neutrophil count (P = 0.003) were elevated, while lymphocyte count (P = 0.024) was decreased. Blood urea nitrogen levels increased with rising mRS scores (P = 0.037), whereas other biochemical indicators were comparable across groups (all P > 0.05).
Regarding clinical characteristics, there were significant differences between groups in the distribution of initial diagnoses (P < 0.001) and smoking history (P = 0.045), while there were no significant differences in injury mechanisms, length of hospital stay, comorbidities, or other clinical variables (all P > 0.05).
3.2. Correlation Analysis of Laboratory Parameters and Functional Outcome
Spearman rank correlation analysis (Figure 1A) revealed that D-dimer (rₛ = 0.40, P < 0.001) and FDP (rs = 0.38, P < 0.001) showed the stronger correlations with discharge mRS score among all laboratory parameters, with a moderate positive correlation between the two markers themselves (rs = 0.57, P < 0.001).
Neutrophil count (rs = 0.29, P < 0.01), white blood cell count (rs = 0.25, P < 0.01), blood urea nitrogen (rs = 0.23, P < 0.05), fibrinogen (rs = 0.20, P < 0.05), monocyte count (rs = 0.20, P < 0.05), and prothrombin time (rs = 0.14, P < 0.05) were also significantly and positively correlated with discharge mRS score, whereas lymphocyte count was inversely correlated (rs = -0.24, P < 0.05). Other biochemical indices and LOS showed no significant correlation with discharge mRS. Within coagulation parameters, FDP was positively correlated with white blood cell count (rs = 0.19, P < 0.05) and neutrophil count (rs = 0.27, P < 0.001), and inversely correlated with lymphocyte count (rs = -0.32, P < 0.001), suggesting a potential link between coagulation activation and systemic inflammation.
These patterns were further corroborated by violin plots of log1p-transformed coagulation parameters (Figure 1B), in which D-dimer and FDP displayed a clear stepwise elevation across mRS groups, reaching substantially higher levels in the mRS ≥ 2 group compared with both the mRS = 0 and mRS = 1 groups (both P < 0.001). PT and FBG followed a similar directional trend, though with comparatively smaller effect sizes.
3.3. Ordinal Logistic Regression: Coagulation Parameters and Functional Outcome
To evaluate the independent predictive value of each coagulation parameter for discharge functional outcome, we fitted three progressively adjusted proportional odds models with discharge mRS (0 / 1 / ≥2) as the ordinal outcome (Table 2).
In the unadjusted model (Model 1), D-dimer (OR = 5.611, 95% CI: 2.690–11.706, P < 0.001), FDP (OR = 2.538, 95% CI: 1.700–3.789, P < 0.001), and fibrinogen (OR = 6.390, 95% CI: 1.209–33.764, P = 0.029) were significantly associated with higher discharge mRS. PT and TT were not significant in Model 1 (both P > 0.05). After adjustment for age and sex (Model 2), D-dimer (OR = 5.067, 95% CI: 2.383–10.774, P < 0.001) and FDP (OR = 2.370, 95% CI: 1.569–3.579, P < 0.001) retained strong significance, while the association for fibrinogen was attenuated to non-significance (OR = 4.655, 95% CI: 0.839–25.828, P = 0.078). In the fully adjusted model (Model 3, additionally adjusted for primary diagnosis, systolic blood pressure, and pre-injury mRS), FDP remained the only coagulation parameter with a statistically significant independent association with functional outcome (OR = 1.749, 95% CI: 1.019–3.002, P = 0.042). The effect of D-dimer was markedly attenuated and lost significance (OR = 2.373, 95% CI: 0.916–6.145, P = 0.075), indicating that its prognostic contribution was substantially explained by injury severity and baseline functional status. PT, TT, and FBG were not significant in any model. These results identify FDP as the most robust independent predictor of functional outcome at discharge among all coagulation parameters examined.
3.4. Dose–Response Relationships: Restricted Cubic Spline Analysis
To explore potential non-linear dose–response relationships, RCS analyses with four knots were conducted for D-dimer and FDP (Figure 2).
For D-dimer (Figure 2A), both the unadjusted and age- and sex-adjusted models revealed significant positive monotonic associations with discharge mRS (P overall < 0.001 for both), with no evidence of non-linearity (P non-linear = 0.552 and 0.632, respectively), suggesting an approximately log-linear relationship. In the fully adjusted model, however, the association was substantially attenuated and no longer statistically significant (P overall = 0.236), accompanied by a flattened OR curve and markedly widened confidence intervals.
For FDP (Figure 2B), significant positive associations were similarly observed in the unadjusted and minimally adjusted models (P overall < 0.001 for both). Of note, Model 2 revealed significant non-linearity (P non-linear = 0.029), with the OR rising gradually at lower FDP values before accelerating at moderate-to-high concentrations — a pattern consistent with a threshold effect. As with D-dimer, the association was attenuated in the fully adjusted model (P overall = 0.197).
Taken together, both markers demonstrated clear positive dose–response relationships with functional outcome in the unadjusted and minimally adjusted models. The non-linear pattern observed for FDP raises the possibility of a threshold beyond which its association with poor outcome becomes more pronounced.
3.5. Binary Logistic Regression and Subgroup Analyses
Binary logistic regression analyses of the association between coagulation parameters and unfavorable functional outcome (mRS ≥2) are presented in Table 3.
Consistent with ordinal regression findings, D-dimer and FDP were significantly associated with poor outcome in Models 1 and 2 (D-dimer: Model 1 OR = 4.280, 95% CI: 1.783–10.271, P = 0.001; Model 2 OR = 4.510, 95% CI: 1.670–12.182, P = 0.002; FDP: Model 1 OR = 2.334, 95% CI: 1.488–3.661, P < 0.001; Model 2 OR = 2.246, 95% CI: 1.357–3.716, P = 0.001). In the fully adjusted model, both associations were attenuated to non-significance (D-dimer: OR = 1.550, 95% CI: 0.387–6.210, P = 0.536; FDP: OR = 1.483, 95% CI: 0.804–2.738, P = 0.207). FBG, TT, and PT were non-significant in all models. Binary and ordinal regression results were concordant in Models 1 and 2 but diverged in Model 3, where FDP retained significance in the ordinal model but not in the binary model. This divergence likely reflects the reduced statistical power of binary logistic regression when the unfavorable-outcome group is small, as binary categorization discards within-group ordering information that the proportional odds model exploits. The ordinal model is therefore designated as our primary analysis. Subgroup analyses are presented in Figure 3.
For D-dimer (Figure 3A), the overall OR was 4.10 (95% CI: 1.79–10.06, P < 0.001), with significant associations observed in male patients, the <65-year age group, patients without hypertension, and those with falls as the injury mechanisms (all P < 0.05). For FDP (Figure 3B), the overall OR was 2.29 (95% CI: 1.49–3.62, P < 0.001), with significant associations across both age groups, in males, patients without hypertension, and those with falls, road traffic accidents, and mild TBI (all P < 0.05). Interaction tests for both markers were non-significant across all subgroups (all P for interaction > 0.05), indicating consistent predictive effects irrespective of patient characteristics.
3.6. Coagulation Parameters and Length of Stay
Results of negative binomial regression analyses for LOS are presented in Table 4.
After adjustment for age, sex, injury mechanisms, primary diagnosis, intracranial hemorrhage, and fracture, neither D-dimer (IRR = 1.08, 95% CI: 0.904–1.300, P = 0.385) nor FDP (IRR = 1.04, 95% CI: 0.941–1.150, P = 0.452) was significantly associated with LOS. These findings stand in contrast to the primary outcome analyses and suggest that the predictive utility of D-dimer and FDP is outcome-specific, reflecting functional recovery status rather than overall disease severity as expressed through hospitalization duration.
Covariate effects were highly consistent across both models. Injury mechanisms were the predominant determinant of LOS: compared with road traffic accident, falls on the same level (DD model IRR = 0.756, 95% CI: 0.611–0.935, P = 0.010; FDP model IRR = 0.754, 95% CI: 0.608–0.935, P = 0.010) and assault injuries (DD model IRR = 0.628, 95% CI: 0.481–0.819, P < 0.001; FDP model IRR = 0.624, 95% CI: 0.477–0.816, P < 0.001) were associated with significantly shorter hospital stays, likely reflecting the greater injury complexity and medico-legal considerations associated with road traffic accidents. Age, sex, injury severity, intracranial hemorrhage, and fracture did not reach statistical significance in either model (all P > 0.05).
4. Discussion
This cohort of 140 closed TBI patients confirmed admission FDP as the only independent coagulation marker for discharge mRS after full confounder adjustment. DD’s predictive value vanished after controlling baseline function and diagnosis. FDP showed a nonlinear threshold effect in minimally adjusted models, while neither marker correlated with hospital stay, indicating outcome-specific predictive capacity.
Intergroup comparison demonstrated that DD/FDP levels rose alongside functional disability, consistent with fibrinolysis activation aggravating neurological damage [5,13]. Ordinal regression confirmed FDP’s stable independent predictive ability across three adjustment schemes, while DD’s effect was explained by underlying injury severity. RCS first identified FDP’s threshold risk growth in mild-to-moderate TBI.
Existing literature mainly focused on DD’s link to hemorrhage and death [14,15,16,17,18,19,20], while FDP’s prognostic evidence was limited [17,21,22,23,24,25,26]. Few head-to-head cohort comparisons of DD and FDP used mRS as primary endpoint. Nakae et al. also found fibrinolytic markers differentiated prognosis better than routine coagulation tests [7]; our study further confirmed FDP’s superior robustness after comprehensive correction.
Although both are fibrinolytic products, FDP and DD differ in pathophysiological significance: FDP reflects degradation of both fibrinogen and fibrin (primary and secondary fibrinolysis) [27], whereas DD specifically marks cross-linked fibrin breakdown (secondary fibrinolysis) [28]. Thus FDP provides a more comprehensive assessment of fibrinolytic activation and stronger predictive power. In acute TBI, damaged brain releases TF, activating extrinsic coagulation and generating fibrin [29]; TF may also enter circulation via disrupted blood-brain barrier, causing consumptive coagulopathy [29]. Concurrently, hypoperfusion and endothelial injury release t-PA, inducing hyperfibrinolysis [17,25,26,30,31]. Both markers rise, but FDP captures the entire cascade from fibrinogen consumption to cross-linked fibrin lysis, while DD reflects downstream events after thrombin generation and correlates more with “injury severity” [32]. After adjustment for diagnosis and baseline mRS, DD’s effect attenuates, suggesting DD mediates severity; FDP retains independent predictive power due to comprehensive fibrinolytic assessment.
Injury mechanisms were the predominant determinants of LOS, rather than fibrinolytic markers. LOS is disturbed by non-clinical administrative factors, while DD/FDP specifically reflect brain tissue damage. Subgroup tests validated stable predictive value across demographic and injury subgroups, and FDP effectively stratifies risk even for mild TBI patients. The nonlinear threshold of FDP requires large multicenter verification before clinical application.
FDP testing is cheap and routine in all hospitals. Clinicians should monitor admission FDP for closed TBI patients; high FDP values warrant frequent neuroimaging and serial coagulation tests, even with normal GCS and vital signs. FDP cannot replace GCS and imaging for standalone judgment.
Strengths: strict closed TBI inclusion reduced extracranial injury confounding; dual ordinal/binary mRS endpoints; progressive adjustment + RCS nonlinear modeling; direct comparison of five coagulation indices.
Limitations: Several limitations should be acknowledged. First, the single-center retrospective design may introduce selection bias and limit generalizability. Second, the relatively small sample size—particularly in the mRS ≥2 group—reduced statistical power for subgroup analyses and precluded propensity score matching. Third, only a single admission measurement of coagulation parameters was available; serial monitoring over time would have better captured the dynamic evolution of fibrinolytic dysfunction and its relationship to neurological recovery. Fourth, follow-up was restricted to discharge mRS, without 3- or 6-month functional assessments, preventing evaluation of the markers' longer-term prognostic utility. Future multicenter prospective studies with longitudinal sampling and extended follow-up are warranted to validate our findings.
5. Conclusions
This study confirms that, in patients with closed TBI, admission FDP levels independently predict poorer discharge mRS, outperforming D-dimer and other coagulation markers after comprehensive adjustment for age, sex, diagnostic classification, systolic blood pressure, and baseline functional status. A significant nonlinear dose–response relationship was observed in the age- and sex-adjusted model, suggesting a potential predictive threshold, though external validation in a larger cohort is required. Neither FDP nor D-dimer was significantly associated with length of stay, indicating that their predictive role is outcome-specific and points to neurological impairment rather than general disease complexity.
From a clinical translational perspective, FDP is a routine, cost-effective, and rapidly measurable laboratory parameter widely available in most emergency settings. Its integration into the initial emergency workup of closed TBI patients could serve as an adjunctive screening tool to identify individuals at heightened risk of poor functional recovery—even when GCS appears preserved—thereby facilitating earlier neurological surveillance and more individualized treatment planning. However, FDP should be interpreted in conjunction with GCS, neuroimaging, and other clinical findings rather than as a standalone decision-making criterion. These findings support the use of admission FDP as an adjunctive biomarker for early functional prognostication in closed TBI; multicenter prospective studies with longitudinal sampling and extended follow-up are warranted to further validate its clinical utility.
Author Contributions
Conceptualization, W.W. and J.Q.; methodology, W.W. and J.Q.; software, W.W.; validation, J.Q.; formal analysis, W.W.; investigation, W.W.; resources, L.L. and S.X.; data curation, L.L. and S.X.; writing - original draft preparation, W.W.; writing - review and editing, W.W., J.Q., L.L. and S.X.; visualization, W.W.; supervision, J.Q.; project administration, J.Q. All authors have read and agreed to the published version of the manuscript.All authors have read and agreed to the published version of the manuscript.
Funding
The authors received no financial support for the research, authorship, and/or publication of this article.
Institutional Review Board Statement
The study was conducted in accordance with the Declaration of Helsinki, and approved by the Institutional Review Board of The 941st Hospital of the Joint Logistics Support Force of the Chinese People's Liberation Army (approval number: 941-IRB-2026005).
Informed Consent Statement
Informed consent for participation was waived by the Institutional Review Board because this retrospective study only utilized fully anonymized historical clinical data, and no identifiable personal information was included in the analyses.
Data Availability Statement
The datasets generated and/or analyzed during the current study are not publicly available due to ethical, legal, and military privacy restrictions, but are available from the corresponding author upon reasonable request. The raw data include individual-level sensitive information of military personnel and cannot be publicly released in accordance with national and military confidentiality regulations. Strict anonymization and security protocols were adopted throughout the research period. Any request for data access must undergo ethical and confidentiality review before approval.
Acknowledgments
We would like to express our sincere gratitude to all the participants for their contributions to this study.
Conflicts of Interest
The authors declare that they have no known competing financial interests or personal relationships that could have appeared to influence the work reported in this paper.
Abbreviations
The following abbreviations are used in this manuscript:
| TBI | Traumatic Brain Injury |
| mRS | modified Rankin Scale |
| LOS | Length of Hospital Stay |
| PT | Prothrombin Time |
| TT | Thrombin Time |
| FBG | Fibrinogen |
| FDP | Fibrin Degradation Products |
| DD/D-Dimer | D-dimer |
| BMI | Body Mass Index |
| SBP | Systolic Blood Pressure |
| DBP | Diastolic Blood Pressure |
| IQR | Interquartile Range |
| OR | Odds Ratio |
| CI | Confidence Interval |
| RCS | Restricted Cubic Spline |
| IRR | Incidence Rate Ratio |
References
- Liu, J.; Xu, A.; Zhao, Z.; Fang, D.; Lv, W.; Li, Y.; Wang, P.; Wang, Y.; Dai, Y.; Zheng, X.; et al. The burden of traumatic brain injury, its causes, and future trend predictions in 204 countries and territories (1990-2021): results from the Global Burden of Disease Study 2021. Neuroepidemiology 2026, 60, 1–15. [Google Scholar] [CrossRef] [PubMed]
- Maas, A.I.R.; Menon, D.K.; Manley, G.T.; Abrams, M.; Åkerlund, C.; Andelic, N.; Aries, M.; Bashford, T.; Bell, M.J.; Bodien, Y.G.; et al. Traumatic brain injury: progress and challenges in prevention, clinical care, and research. Lancet Neurol. 2022, 21, 1004–1060. [Google Scholar] [CrossRef] [PubMed]
- GBD 2016 Traumatic Brain Injury and Spinal Cord Injury Collaborators. Global, regional, and national burden of traumatic brain injury, 1990-2016: a systematic analysis for the Global Burden of Disease Study 2016. Lancet Neurol. 2019, 18, 56–87. [CrossRef] [PubMed]
- Zhang, J.; Zhang, F.; Dong, J.F. Coagulopathy induced by traumatic brain injury: systemic manifestation of a localized injury. Blood 2018, 131, 2001–2006. [Google Scholar] [CrossRef] [PubMed]
- Maegele, M.; Schöchl, H.; Menovsky, T.; Maréchal, H.; Marklund, N.; Buki, A.; Stanworth, S. Coagulopathy and haemorrhagic progression in traumatic brain injury: advances in mechanisms, diagnosis, and management. Lancet Neurol. 2017, 16, 630–647. [Google Scholar] [CrossRef] [PubMed]
- Greuters, S.; van den Berg, A.; Franschman, G.; Viersen, V.A.; Beishuizen, A.; Peerdeman, S.M.; Boer, C.; ALARM-BLEEDING Investigators. Acute and delayed mild coagulopathy are related to outcome in patients with isolated traumatic brain injury. Crit. Care 2011, 15, R2. [Google Scholar] [CrossRef] [PubMed]
- Nakae, R.; Takayama, Y.; Kuwamoto, K.; Naoe, Y.; Sato, H.; Yokota, H. Time course of coagulation and fibrinolytic parameters in patients with traumatic brain injury. J. Neurotrauma 2016, 33, 688–695. [Google Scholar] [CrossRef] [PubMed]
- Hayakawa, M.; Maekawa, K.; Kushimoto, S.; Kato, H.; Sasaki, J.; Ogura, H.; Hagiwara, A.; Uejima, T.; Morimura, N.; Ishikura, H.; et al. High D-dimer levels predict a poor outcome in patients with severe trauma, even with high fibrinogen levels on arrival: a multicenter retrospective study. Shock 2016, 45, 308–314. [Google Scholar] [CrossRef] [PubMed]
- Chen, X.; Wang, X.; Liu, Y.; Guo, X.; Wu, F.; Yang, Y.; He, W.; Zhen, F.; He, H. Plasma D-dimer levels are a biomarker for in-hospital complications and long-term mortality in patients with traumatic brain injury. Front. Mol. Neurosci. 2023, 16, 1276726. [Google Scholar] [CrossRef] [PubMed]
- Fujiwara, G.; Okada, Y.; Sakakibara, T.; Yamaki, T.; Hashimoto, N. The association between D-dimer levels and long-term neurological outcomes of patients with traumatic brain injury: an analysis of a nationwide observational neurotrauma database in Japan. Neurocrit. Care 2022, 36, 483–491. [Google Scholar] [CrossRef] [PubMed]
- Kaufman, H.H.; Moake, J.L.; Olson, J.D.; Miner, M.E.; duCret, R.P.; Pruessner, J.L.; Gildenberg, P.L. Delayed and recurrent intracranial hematomas related to disseminated intravascular clotting and fibrinolysis in head injury. Neurosurgery 1980, 7, 445–449. [Google Scholar] [CrossRef] [PubMed]
- Selladurai, B.M.; Vickneswaran, M.; Duraisamy, S.; Atan, M. Coagulopathy in acute head injury—a study of its role as a prognostic indicator. Br. J. Neurosurg. 1997, 11, 398–404. [Google Scholar] [CrossRef] [PubMed]
- Yuan, Q.; Sun, Y.-R.; Wu, X.; Yu, J.; Li, Z.-Q.; Du, Z.-Y.; Wu, X.-H.; Zhou, L.-F.; Hu, J. Coagulopathy in traumatic brain injury and its correlation with progressive hemorrhagic injury: a systematic review and meta-analysis. J. Neurotrauma 2016, 33, 1279–1291. [Google Scholar] [CrossRef] [PubMed]
- Tzikos, G.; Alexiou, I.; Tsagkaropoulos, S.; Menni, A.E.; Chatziantoniou, G.; Doutsini, S.; Papavramidis, T.; Grosomanidis, V.; Stavrou, G.; Kotzampassi, K. Neutrophil-to-lymphocyte ratio and platelet-to-lymphocyte ratio as predictive factors for mortality and length of hospital stay after cardiac surgery. J. Pers. Med. 2023, 13, 473. [Google Scholar] [CrossRef] [PubMed]
- Zhang, D.; Gong, S.; Jin, H.; Wang, J.; Sheng, P.; Zou, W.; Dong, Y.; Hou, L. Coagulation parameters and risk of progressive hemorrhagic injury after traumatic brain injury: a systematic review and meta-analysis. Biomed. Res. Int. 2015, 2015, 261825. [Google Scholar] [CrossRef] [PubMed]
- Suehiro, E.; Koizumi, H.; Fujiyama, Y.; Yoneda, H.; Suzuki, M. Predictors of deterioration indicating a requirement for surgery in mild to moderate traumatic brain injury. Clin. Neurol. Neurosurg. 2014, 127, 97–100. [Google Scholar] [CrossRef] [PubMed]
- Suehiro, E.; Fujiyama, Y.; Kiyohira, M.; Motoki, Y.; Nojima, J.; Suzuki, M. Probability of soluble tissue factor release lead to the elevation of D-dimer as a biomarker for traumatic brain injury. Neurol. Med. Chir. 2019, 59, 63–67. [Google Scholar] [CrossRef] [PubMed]
- Sugimoto, K.; Suehiro, E.; Shinoyama, M.; Sadahiro, H.; Haji, K.; Fujiyama, Y.; Kawano, R.; Nishioka, M.; Suzuki, M. D-dimer elevation as a blood biomarker for detection of structural disorder in mild traumatic brain injury. J. Neurotrauma 2017, 34, 3245–3248. [Google Scholar] [CrossRef] [PubMed]
- Fair, K.A.; Farrell, D.H.; McCully, B.H.; Rick, E.A.; Dewey, E.N.; Hilliard, C.; Dean, R.; Lin, A.; Hinson, H.; Barbosa, R.; et al. Fibrinolytic activation in patients with progressive intracranial hemorrhage after traumatic brain injury. J. Neurotrauma 2021, 38, 960–966. [Google Scholar] [CrossRef] [PubMed]
- Yuan, Q.; Yu, J.; Wu, X.; Sun, Y.-R.; Li, Z.-Q.; Du, Z.-Y.; Wu, X.-H.; Hu, J. Prognostic value of coagulation tests for in-hospital mortality in patients with traumatic brain injury. Scand. J. Trauma Resusc. Emerg. Med. 2018, 26, 3. [Google Scholar] [CrossRef] [PubMed]
- Oshiro, A.; Yanagida, Y.; Gando, S.; Henzan, N.; Takahashi, I.; Makise, H. Hemostasis during the early stages of trauma: comparison with disseminated intravascular coagulation. Crit. Care 2014, 18, R61. [Google Scholar] [CrossRef] [PubMed]
- Hayakawa, M.; Sawamura, A.; Gando, S.; Kubota, N.; Uegaki, S.; Shimojima, H.; Sugano, M.; Ieko, M. Disseminated intravascular coagulation at an early phase of trauma is associated with consumption coagulopathy and excessive fibrinolysis both by plasmin and neutrophil elastase. Surgery 2011, 149, 221–230. [Google Scholar] [CrossRef] [PubMed]
- Sawamura, A.; Hayakawa, M.; Gando, S.; Kubota, N.; Sugano, M.; Wada, T.; Katabami, K.-i. Disseminated intravascular coagulation with a fibrinolytic phenotype at an early phase of trauma predicts mortality. Thromb. Res. 2009, 124, 608–613. [Google Scholar] [CrossRef] [PubMed]
- Kushimoto, S.; Yamamoto, Y.; Shibata, Y.; Sato, H.; Koido, Y. Implications of excessive fibrinolysis and alpha(2)-plasmin inhibitor deficiency in patients with severe head injury. Neurosurgery 2001, 49, 1084-1089; discussion 1089-1090. [Google Scholar] [CrossRef] [PubMed]
- Anderson, T.N.; Farrell, D.H.; Rowell, S.E. Fibrinolysis in traumatic brain injury: diagnosis, management, and clinical considerations. Semin. Thromb. Hemost. 2021, 47, 527–537. [Google Scholar] [CrossRef] [PubMed]
- Tsuchida, T.; Wada, T.; Nakae, R.; Fujiki, Y.; Kanaya, T.; Takayama, Y.; Suzuki, G.; Naoe, Y.; Yokobori, S. Gender-related differences in the coagulofibrinolytic responses and long-term outcomes in patients with isolated traumatic brain injury: a 2-center retrospective study. Medicine 2023, 102, e32850. [Google Scholar] [CrossRef] [PubMed]
- Güven, B.; Can, M. Fibrinogen: structure, abnormalities and laboratory assays. Adv. Clin. Chem. 2024, 120, 117–143. [Google Scholar] [CrossRef] [PubMed]
- Dekker, S.E.; Nikolian, V.C.; Sillesen, M.; Bambakidis, T.; Schober, P.; Alam, H.B. Relationship between tissue perfusion and coagulopathy in traumatic brain injury. J. Surg. Res. 2016, 205, 147–154. [Google Scholar] [CrossRef] [PubMed]
- Hubbard, W.B.; Sim, M.M.S.; Saatman, K.E.; Sullivan, P.G.; Wood, J.P. Tissue factor release following traumatic brain injury drives thrombin generation. Res. Pract. Thromb. Haemost. 2022, 6, e12734. [Google Scholar] [CrossRef] [PubMed]
- Nakae, R.; Murai, Y.; Morita, A.; Yokobori, S. Coagulopathy and traumatic brain injury: overview of new diagnostic and therapeutic strategies. Neurol. Med. Chir. 2022, 62, 261–269. [Google Scholar] [CrossRef] [PubMed]
- Esnault, P.; Mathais, Q.; D'Aranda, E.; Montcriol, A.; Cardinale, M.; Cungi, P.-J.; Goutorbe, P.; Joubert, C.; Dagain, A.; Meaudre, E. Ability of fibrin monomers to predict progressive hemorrhagic injury in patients with severe traumatic brain injury. Neurocrit. Care 2020, 33, 182–195. [Google Scholar] [CrossRef] [PubMed]
- Xu, D.X.; Du, W.T.; Li, X.; Wu, Z.X.; Yu, G.F. D-dimer/fibrinogen ratio for the prediction of progressive hemorrhagic injury after traumatic brain injury. Clin. Chim. Acta 2020, 507, 143–148. [Google Scholar] [CrossRef] [PubMed]
Figure 1.
Correlation analysis of laboratory parameters and functional outcome. (A) Spearman rank correlation matrix of coagulation parameters, hematological and biochemical indices, length of stay (LOS), and discharge modified Rankin Scale (mRS) score. The lower triangle displays correlation coefficients, and the upper triangle indicates statistical significance (*P < 0.05, **P < 0.01, ***P < 0.001). Color intensity reflects the magnitude and direction of correlations (red, positive; blue, negative). (B) Violin plots with overlaid box plots depicting the distribution of log1p-transformed prothrombin time (PT), fibrinogen (FBG), fibrin degradation products (FDP), and D-dimer (DD) across the three discharge mRS groups (0, 1, and ≥2). P-values were derived from Kruskal–Wallis rank-sum tests.
Figure 1.
Correlation analysis of laboratory parameters and functional outcome. (A) Spearman rank correlation matrix of coagulation parameters, hematological and biochemical indices, length of stay (LOS), and discharge modified Rankin Scale (mRS) score. The lower triangle displays correlation coefficients, and the upper triangle indicates statistical significance (*P < 0.05, **P < 0.01, ***P < 0.001). Color intensity reflects the magnitude and direction of correlations (red, positive; blue, negative). (B) Violin plots with overlaid box plots depicting the distribution of log1p-transformed prothrombin time (PT), fibrinogen (FBG), fibrin degradation products (FDP), and D-dimer (DD) across the three discharge mRS groups (0, 1, and ≥2). P-values were derived from Kruskal–Wallis rank-sum tests.
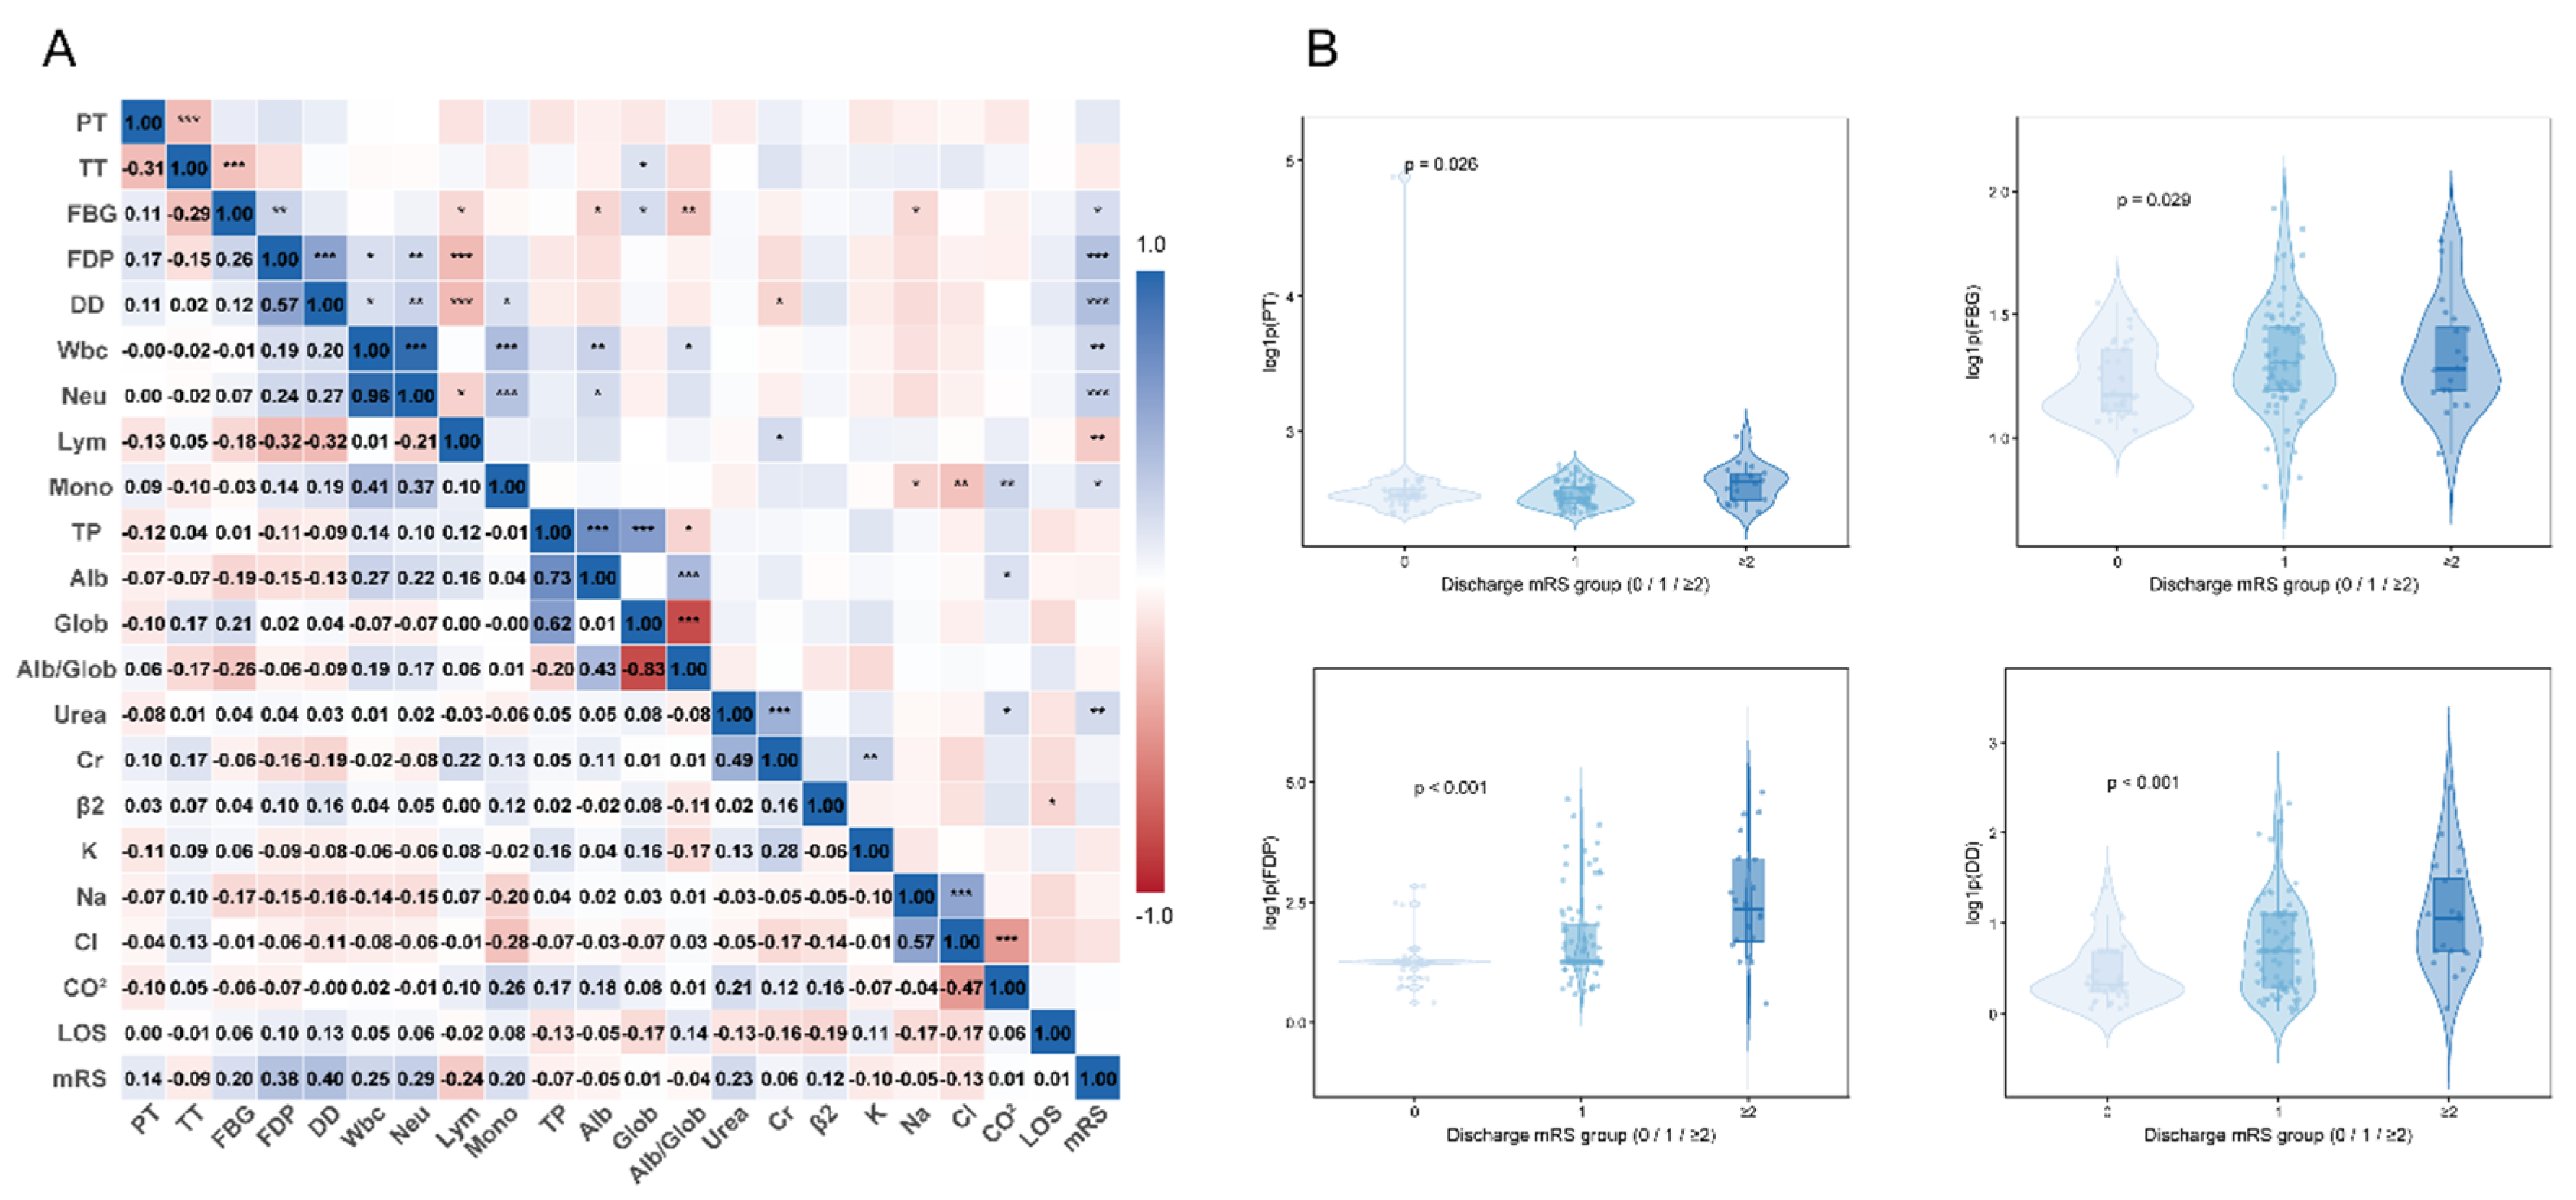
Figure 2.
Restricted cubic spline analysis of the dose–response relationship between D-dimer, FDP, and functional outcome in patients with closed traumatic brain injury. RCS curves (4 knots) depicting the association between (A) log1p(D-dimer) and (B) log1p(FDP) with the odds of a higher discharge mRS category, based on proportional odds ordinal logistic regression. From left to right: Model 1 (unadjusted), Model 2 (adjusted for age and sex), and Model 3 (fully adjusted). The solid red line represents the estimated OR; the pink shaded area indicates the 95% CI. The horizontal dashed line denotes OR = 1. The median served as the reference value. P overall: Wald test for overall association; P non-linear: test for the non-linear spline component.
Figure 2.
Restricted cubic spline analysis of the dose–response relationship between D-dimer, FDP, and functional outcome in patients with closed traumatic brain injury. RCS curves (4 knots) depicting the association between (A) log1p(D-dimer) and (B) log1p(FDP) with the odds of a higher discharge mRS category, based on proportional odds ordinal logistic regression. From left to right: Model 1 (unadjusted), Model 2 (adjusted for age and sex), and Model 3 (fully adjusted). The solid red line represents the estimated OR; the pink shaded area indicates the 95% CI. The horizontal dashed line denotes OR = 1. The median served as the reference value. P overall: Wald test for overall association; P non-linear: test for the non-linear spline component.
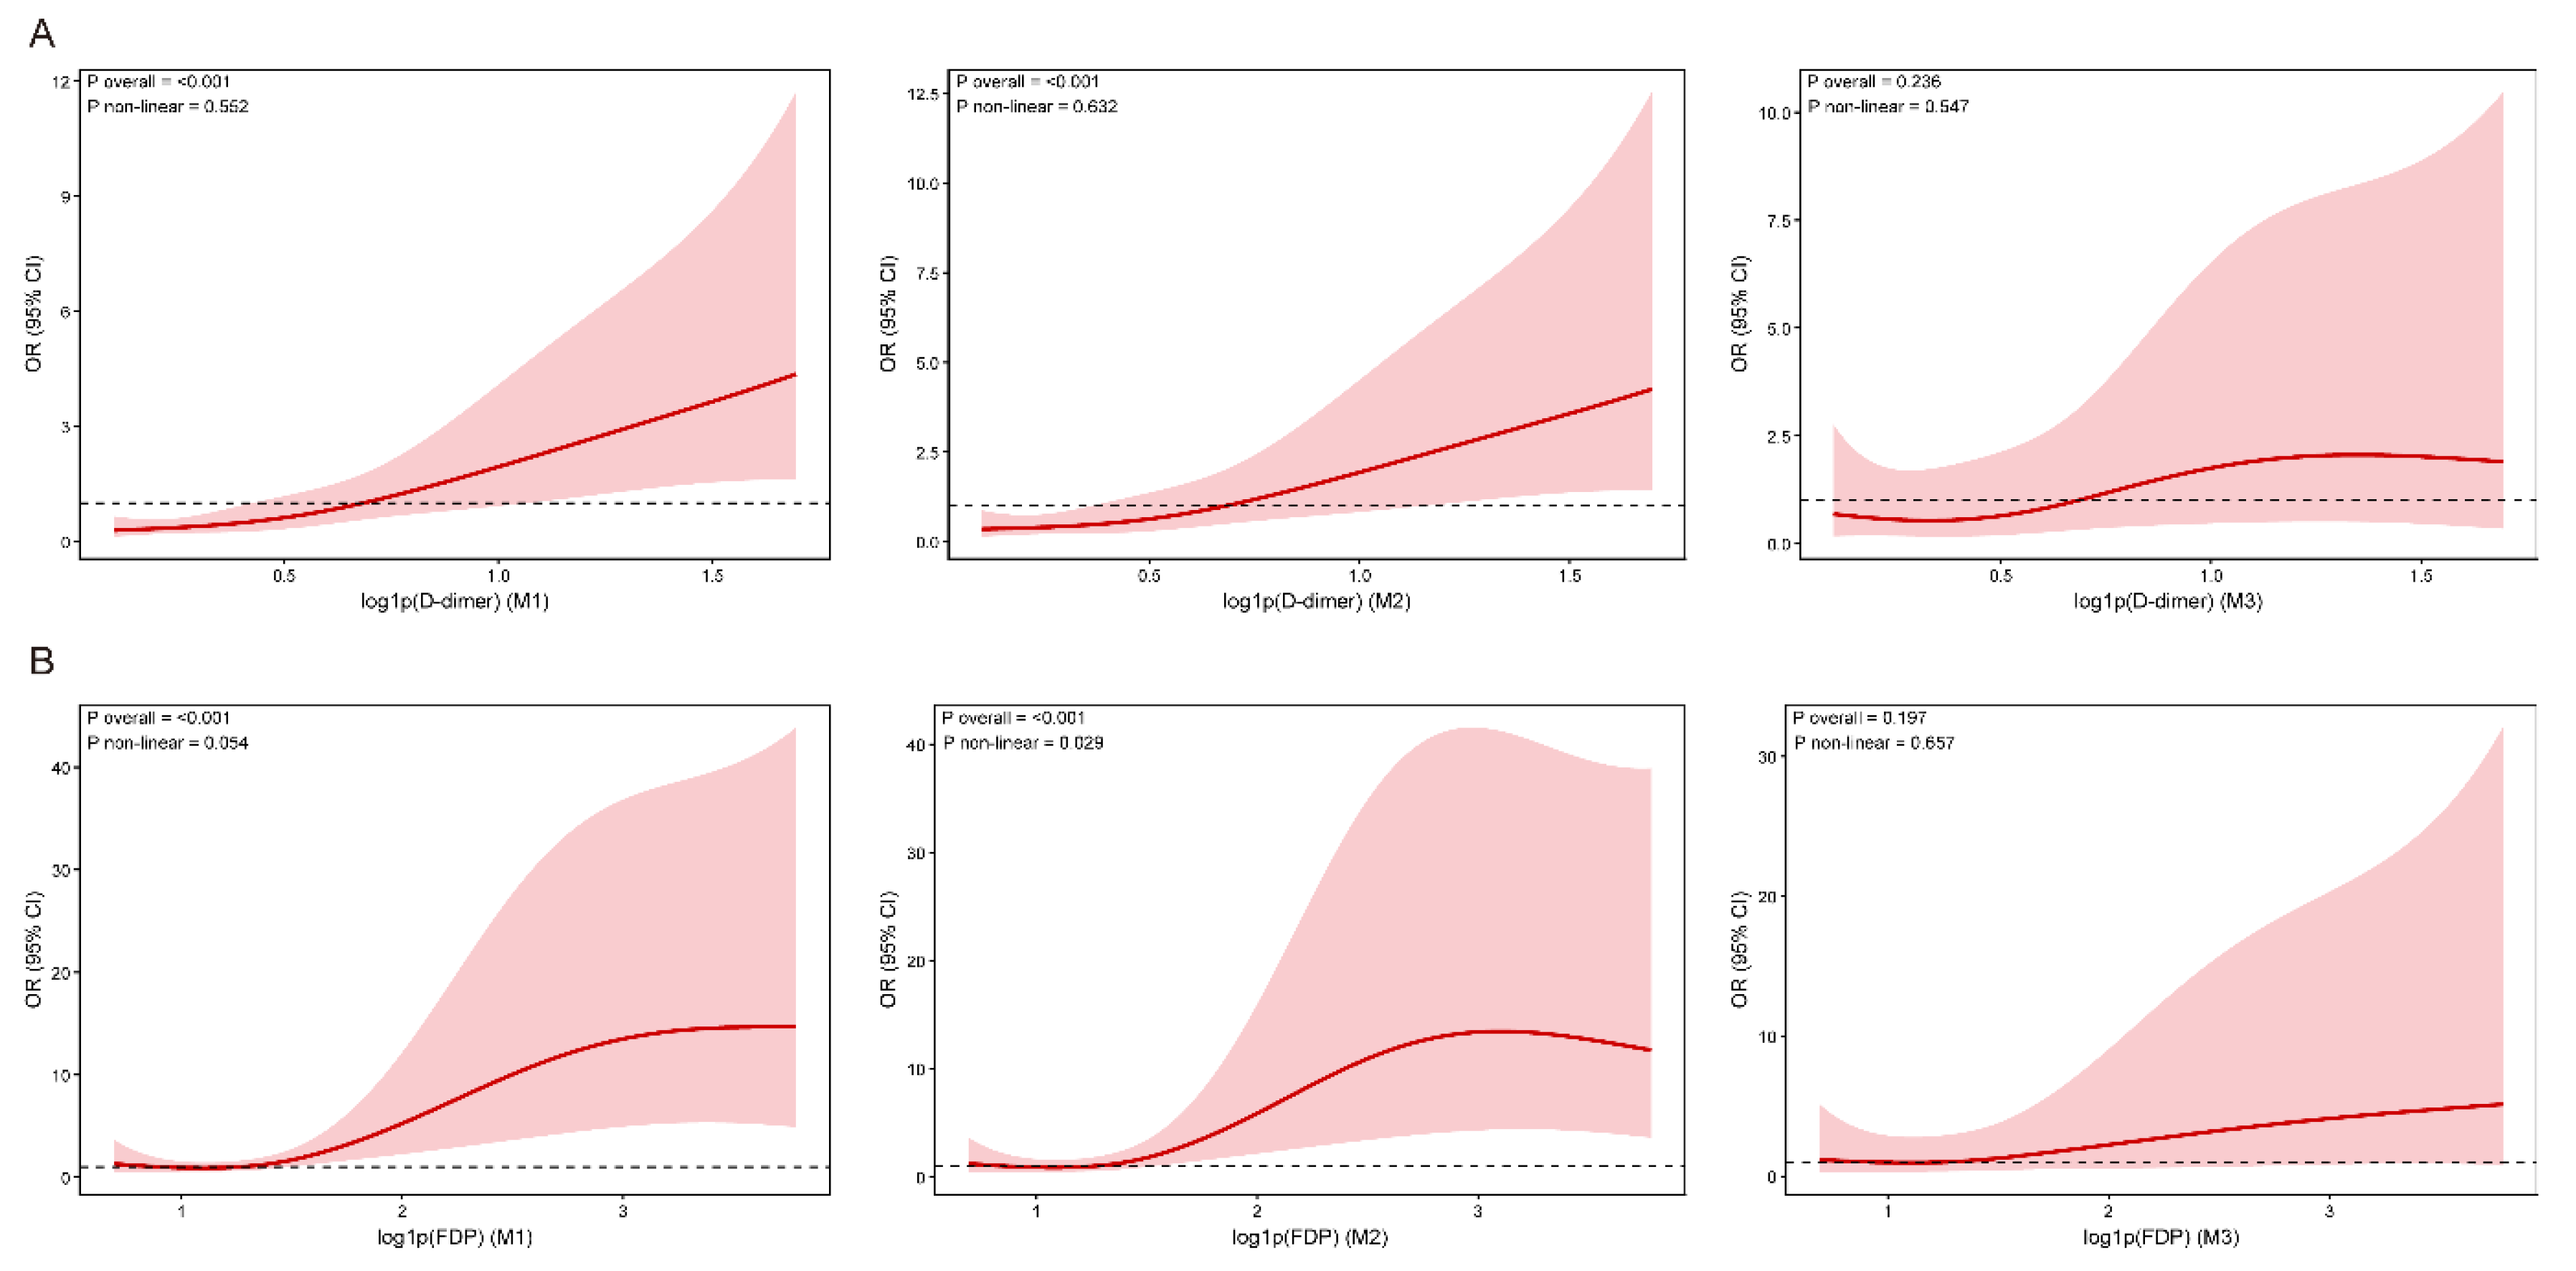
Figure 3.
Subgroup analysis of the association between D-dimer, FDP and unfavorable functional outcome (mRS ≥2) at discharge. Forest plots showing ORs and 95% CIs for the association of (A) log1p(D-dimer) and (B) log1p(FDP) with mRS ≥2 across subgroups defined by age, sex, hypertension, injury mechanisms, and primary diagnosis. ORs were estimated using Firth penalized-likelihood binary logistic regression adjusted for age and sex. The red dashed line indicates OR = 1. P for interaction assesses effect heterogeneity across subgroups.
Figure 3.
Subgroup analysis of the association between D-dimer, FDP and unfavorable functional outcome (mRS ≥2) at discharge. Forest plots showing ORs and 95% CIs for the association of (A) log1p(D-dimer) and (B) log1p(FDP) with mRS ≥2 across subgroups defined by age, sex, hypertension, injury mechanisms, and primary diagnosis. ORs were estimated using Firth penalized-likelihood binary logistic regression adjusted for age and sex. The red dashed line indicates OR = 1. P for interaction assesses effect heterogeneity across subgroups.
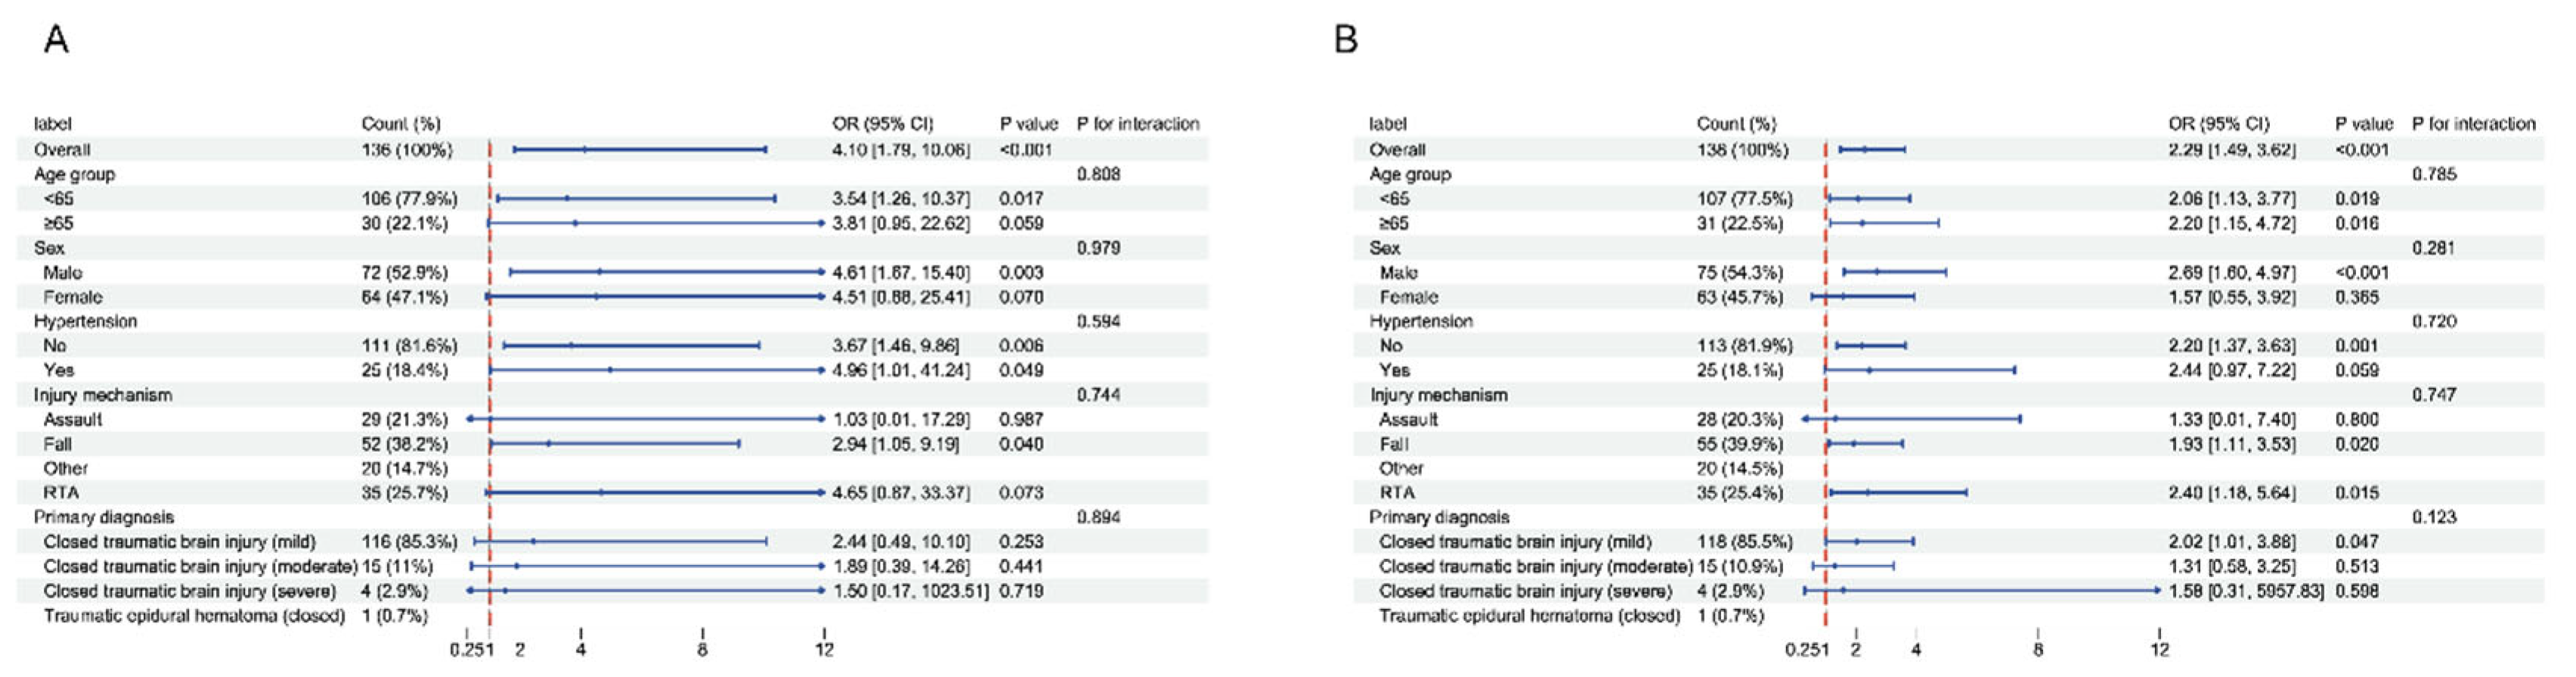

Table 1.
Baseline demographic, clinical, and laboratory characteristics of patients with closed traumatic brain injury stratified by functional outcome at discharge.
Table 1.
Baseline demographic, clinical, and laboratory characteristics of patients with closed traumatic brain injury stratified by functional outcome at discharge.
| Variable | mRS =0 N = 371 |
mRS =1 N = 831 |
mRS ≥2 N = 201 |
P-value2 |
|---|---|---|---|---|
| Age (year) | 45 (26, 54) | 53 (35, 64) | 57 (39, 69) | 0.018 |
| BMI | 23.0 (20.4, 25.0) | 23.3 (21.2, 25.0) | 23.5 (22.1, 25.2) | 0.800 |
| LOS (days) | 8.0 (6.0, 11.0) | 8.0 (5.0, 10.0) | 9.5 (5.0, 15.0) | 0.400 |
| Temp (℃) | 36.40 (36.20, 36.50) | 36.40 (36.20, 36.70) | 36.50 (36.20, 36.80) | 0.300 |
| Pulse (bpm) | 77 (68, 80) | 82 (74, 90) | 88 (74, 91) | 0.021 |
| Resp (rpm) | 18.00 (18.00, 20.00) | 19.00 (18.00, 20.00) | 20.50 (19.00, 22.00) | 0.001 |
| SBP (mmHg) | 120 (109, 130) | 124 (112, 144) | 123 (111, 149) | 0.300 |
| DBP (mmHg) | 79 (73, 87) | 81 (71, 92) | 79 (72, 88) | 0.800 |
| Wbc (109/L) | 5.99 (4.86, 7.58) | 6.91 (5.58, 8.26) | 8.52 (6.15, 13.26) | 0.011 |
| Neu (109/L) | 3.84 (2.84, 4.96) | 4.75 (3.54, 6.18) | 5.68 (4.29, 11.19) | 0.003 |
| Lym (109/L) | 1.73 (1.41, 2.01) | 1.44 (1.08, 1.83) | 1.32 (0.97, 1.71) | 0.024 |
| Mono(109/L) | 0.31 (0.26, 0.36) | 0.32 (0.26, 0.41) | 0.42 (0.28, 0.60) | 0.065 |
| PT (s) | 11.50 (11.20, 12.20) | 11.30 (10.70, 12.40) | 12.90 (11.15, 13.70) | 0.026 |
| TT (s) | 18.30 (17.40, 19.10) | 18.20 (17.30, 19.00) | 17.65 (15.95, 19.05) | 0.600 |
| FBG | 2.23 (2.04, 2.90) | 2.69 (2.30, 3.26) | 2.60 (2.29, 3.31) | 0.029 |
| FDP | 3 (2, 3) | 3 (3, 7) | 9 (4, 29) | <0.001 |
| DD | 0.39 (0.25, 0.98) | 1.00 (0.33, 2.00) | 1.86 (0.98, 3.60) | <0.001 |
| TP (g/L) | 67 (63, 74) | 67 (62, 72) | 66 (64, 70) | 0.800 |
| Alb (g/L) | 43.8 (40.0, 47.2) | 42.6 (39.4, 45.2) | 43.8 (40.6, 45.9) | 0.300 |
| Glob (g/L) | 23.1 (20.4, 27.4) | 25.2 (21.9, 27.8) | 22.6 (21.3, 25.0) | 0.150 |
| Alb/ Glob | 1.84 (1.53, 2.20) | 1.70 (1.53, 1.87) | 1.79 (1.58, 2.15) | 0.130 |
| Urea (mmol/L) | 4.80 (3.47, 6.11) | 5.29 (4.22, 6.31) | 5.89 (5.02, 7.17) | 0.037 |
| Cr (μmol/L) | 63 (56, 71) | 59 (50, 75) | 65 (58, 76) | 0.200 |
| β2 (mg/L) | 1.66 (1.27, 2.04) | 1.78 (1.43, 2.24) | 1.90 (1.51, 2.94) | 0.200 |
| K(mmol/L) | 3.98 (3.77, 4.18) | 3.95 (3.66, 4.22) | 3.69 (3.41, 4.16) | 0.400 |
| Na(mmol/L) | 140.99 (140.15, 142.15) | 141.27 (139.75, 143.08) | 140.80 (139.47, 142.91) | 0.700 |
| Cl(mmol/L) | 103.2 (101.1, 105.2) | 102.7 (100.8, 105.1) | 101.8 (98.6, 103.4) | 0.200 |
| CO2(mmol/L) | 23.37 (22.17, 25.31) | 23.82 (21.52, 25.11) | 25.19 (21.55, 26.31) | 0.600 |
| sex | 0.016 | |||
| Male | 22 (59%) | 38 (46%) | 16 (80%) | |
| Female | 15 (41%) | 45 (54%) | 4 (20%) | |
| Injury mechanisms | 0.080 | |||
| Road traffic accident | 4 (11%) | 25 (30%) | 6 (30%) | |
| Fall (same level) | 13 (35%) | 28 (34%) | 10 (50%) | |
| Fall from height | 1 (2.7%) | 2 (2.4%) | 2 (10%) | |
| Struck by object / crush | 1 (2.7%) | 4 (4.8%) | 0 (0%) | |
| Assault | 12 (32%) | 15 (18%) | 2 (10%) | |
| Other | 6 (16%) | 9 (11%) | 0 (0%) | |
| Primary dx | <0.001 | |||
| Closed traumatic brain injury (mild) | 37 (100%) | 77 (93%) | 6 (30%) | |
| Closed traumatic brain injury (moderate) | 0 (0%) | 5 (6.0%) | 10 (50%) | |
| Closed traumatic brain injury (severe) | 0 (0%) | 1 (1.2%) | 3 (15%) | |
| Traumatic epidural hematoma (closed) | 0 (0%) | 0 (0%) | 1 (5.0%) | |
| Blood type | 0.500 | |||
| A+ | 8 (22%) | 26 (31%) | 4 (20%) | |
| AB+ | 4 (11%) | 2 (2.4%) | 2 (10%) | |
| B+ | 14 (38%) | 30 (36%) | 7 (35%) | |
| O+ | 11 (30%) | 23 (28%) | 7 (35%) | |
| Hypertension | 5 (14%) | 17 (20%) | 3 (15%) | 0.700 |
| CHD | 1 (2.7%) | 5 (6.0%) | 0 (0%) | 0.600 |
| Diabetes | 1 (2.7%) | 6 (7.3%) | 1 (5.3%) | 0.800 |
| Smoke | 13 (35%) | 16 (19%) | 8 (42%) | 0.045 |
| Drink | 4 (11%) | 5 (6.1%) | 2 (11%) | 0.600 |
Table 2.
Ordinal logistic regression analysis of the association between coagulation parameters and functional outcome (discharge mRS) in patients with closed traumatic brain injury.
Table 2.
Ordinal logistic regression analysis of the association between coagulation parameters and functional outcome (discharge mRS) in patients with closed traumatic brain injury.
| Model 1 | Model 2 | Model 3 | ||||
|---|---|---|---|---|---|---|
| log1p | OR (95%CI) | P-value | OR (95%CI) | P-value | OR (95%CI) | P-value |
| DD | 5.611 (2.69–11.706) | <0.001 | 5.067 (2.383–10.774) | <0.001 | 2.373 (0.916–6.145) | 0.075 |
| FDP | 2.538 (1.7–3.789) | <0.001 | 2.37 (1.569–3.579) | <0.001 | 1.749 (1.019–3.002) | 0.042 |
| FBG | 6.39 (1.209–33.764) | 0.029 | 4.655 (0.839–25.828) | 0.078 | 1.806 (0.175–18.609) | 0.619 |
| TT | 0.143 (0.007–3.036) | 0.212 | 0.053 (0.002–1.257) | 0.069 | 0.186 (0.004–9.092) | 0.397 |
| PT | 0.862 (0.176–4.21) | 0.854 | 0.845 (0.178–4.006) | 0.832 | 0.68 (0.021–22.32) | 0.829 |
Table 3.
Binary logistic regression analysis of the association between coagulation markers and unfavorable functional outcome at discharge.
Table 3.
Binary logistic regression analysis of the association between coagulation markers and unfavorable functional outcome at discharge.
| Model 1 | Model 2 | Model 3 | ||||
| log1p | OR (95%CI) | P-value | OR (95%CI) | P-value | OR (95%CI) | P-value |
| DD | 4.28 (1.783–10.271) | 0.001 | 4.51 (1.670–12.182) | 0.002 | 1.55 (0.387–6.21) | 0.536 |
| FDP | 2.334 (1.488–3.661) | <0.001 | 2.246 (1.357–3.716) | 0.001 | 1.483 (0.804–2.738) | 0.207 |
| FBG | 2.412 (0.237–24.578) | 0.457 | 2.589 (0.223–30.046) | 0.447 | 0.158 (0.003–7.403) | 0.347 |
| TT | 0.113 (0.002–7.543) | 0.309 | 0.052 (0.001–4.172) | 0.186 | 1.205 (0.001–58.217) | 0.960 |
| PT | 2.363 (0.475–11.748) | 0.293 | 3.234 (0.609–17.183) | 0.168 | 3.069 (0.010–21.062) | 0.700 |
Table 4.
Negative binomial regression analysis of factors associated with length of stay (secondary outcome) in patients with closed traumatic brain injury.
Table 4.
Negative binomial regression analysis of factors associated with length of stay (secondary outcome) in patients with closed traumatic brain injury.
| DD | FDP | |||||
| IRR | 95% CI | P-value | IRR | 95% CI | P-value | |
| DD | 1.08 | 0.904, 1.30 | 0.385 | |||
| FDP | 1.04 | 0.941, 1.15 | 0.452 | |||
| Age | 0.998 | 0.994, 1.00 | 0.419 | 0.998 | 0.994, 1.00 | 0.422 |
| sex | ||||||
| Male | ||||||
| Female | 0.857 | 0.716, 1.02 | 0.090 | 0.871 | 0.728, 1.04 | 0.130 |
| Injury mechanisms | ||||||
| Road traffic accident | ||||||
| Fall (same level) | 0.756 | 0.611, 0.935 | 0.010 | 0.754 | 0.608, 0.935 | 0.010 |
| Fall from height | 0.664 | 0.408, 1.08 | 0.099 | 0.646 | 0.395, 1.05 | 0.080 |
| Struck by object / crush | 0.749 | 0.464, 1.20 | 0.232 | 0.748 | 0.463, 1.20 | 0.232 |
| Assault | 0.628 | 0.481, 0.819 | <0.001 | 0.624 | 0.477, 0.816 | <0.001 |
| Other | 0.984 | 0.738, 1.31 | 0.912 | 0.984 | 0.738, 1.31 | 0.912 |
| Primary dx | ||||||
| Closed traumatic brain injury (mild) | ||||||
| Closed traumatic brain injury (moderate) | 0.845 | 0.613, 1.16 | 0.297 | 0.854 | 0.622, 1.17 | 0.325 |
| Closed traumatic brain injury (severe) | 1.16 | 0.724, 1.89 | 0.533 | 1.18 | 0.733, 1.91 | 0.504 |
| Traumatic epidural hematoma (closed) | 1.91 | 0.868, 4.53 | 0.121 | 2.01 | 0.914, 4.78 | 0.095 |
| Dx intracranial bleed | ||||||
| No | ||||||
| Yes | 1.21 | 0.951, 1.53 | 0.114 | 1.22 | 0.969, 1.54 | 0.082 |
| Dx fracture any | ||||||
| No | ||||||
| Yes | 1.17 | 0.960, 1.43 | 0.117 | 1.17 | 0.953, 1.44 | 0.131 |
Disclaimer/Publisher’s Note: The statements, opinions and data contained in all publications are solely those of the individual author(s) and contributor(s) and not of MDPI and/or the editor(s). MDPI and/or the editor(s) disclaim responsibility for any injury to people or property resulting from any ideas, methods, instructions or products referred to in the content. |
© 2026 by the authors. Licensee MDPI, Basel, Switzerland. This article is an open access article distributed under the terms and conditions of the Creative Commons Attribution (CC BY) license (http://creativecommons.org/licenses/by/4.0/).
Copyright: This open access article is published under a Creative Commons CC BY 4.0 license, which permit the free download, distribution, and reuse, provided that the author and preprint are cited in any reuse.