
Submitted:
12 August 2026
Posted:
13 August 2026
You are already at the latest version
Abstract
Despite growing attention to ESG activities, the mechanisms through which they translate into financial performance remain underexplored, particularly in emerging markets. This study unpacks the black box of the ESG–CFP relationship by examining the parallel mediating roles of brand value and green innovation. Drawing on stakeholder theory, legitimacy theory, and the resource-based view, we propose that ESG commitments enhance financial outcomes through both external reputational (brand value) and internal capability-based (green innovation) pathways. Using survey data from 504 employees across 217 Chinese firms, aggregated at the organizational level, and objective financial indicators from the CSMAR database, we conducted mediation analyses via PROCESS Macro with bootstrapping. Results show that ESG activities are positively associated with financial performance, and this relationship is significantly mediated by both brand value (indirect effect = 0.261) and green innovation (indirect effect = 0.213), with brand value exhibiting a slightly stronger pathway. These findings suggest that ESG investments generate value through dual, complementary mechanisms—stakeholder trust and innovation capability—rather than a single channel. Our study advances ESG literature by integrating fragmented theoretical perspectives and providing empirical evidence from China’s state-driven sustainability context, offering practical insights for managers and policymakers seeking to leverage ESG for competitive advantage.
Keywords:
ESG activities
; financial performance
; brand value
; green innovation
; mediating effect
; stakeholder theory
; resource-based view
; Chinese enterprises
1. Introduction
Discussions focused on the sustainable development of enterprises have developed from a only Corporate Social Responsibility (CSR) measure to an integrated Environmental, Social, and Governance (ESG) framework. Although ESG is increasingly regarded as a compound concept that can reflects an enterprise’s overall sustainable development situation, the debate of admitting the dimension about ESG still exists (Ghardallou, & Wafa, 2022). Based on signal theory, we consider that stakeholders regard ESG as a unified signal of an enterprise value, and thus some weakness in one dimension may weaken its credibility in other dimensions (Gilchrist,et al., 2021; Zhou, et al., 2023; Tang, et al., 2025). We model ESG as a high-level construct to verify this systemic signaling effect, and also focus on the unique mechanism containing in each pillar system.
Understanding how ESG translates into financial performance (CFP) remains a critical scholarly endeavor. Although meta-analyses confirm a predominantly positive ESG-CFP link, the underlying mechanisms—or the "black box"—require further elucidation. Prior research has identified direct effects such as risk management and operational efficiency, as well as intangible assets like reputation (Gutiérrez, et al., 2022; Wang, et al., 2023; Zhu, et al., 2024). As for the research gap, we move beyond these established pathways to integrate two parallel mediators: brand value and green innovation.
Drawing upon a multi-theoretical framework, we argue that ESG activities foster competitive advantage through both relational and resource-based pathways. Considering theoretical integration, we synthesize Stakeholder theory, legitimacy theory, and the resource-based View (RBV). Stakeholder and legitimacy theories explain how ESG builds trust and social acceptance, enhancing brand equity (Zhu, et al., 2024). Simultaneously, the RBV and Porter Hypothesis suggest that ESG commitments drive green innovation by incentivizing resource-efficient technologies. Regarding construct overlap, we strictly define ESG as a set of managerial inputs and commitments, distinct from the innovative outputs measured by our green innovation construct.
This study relies on perceptual survey data; thus, we interpret our findings as associations rather than deterministic causal effects, treating data as reflecting brand value, green innovation, and financial performance perceived. By constructing a parallel mediation model within the context of Chinese enterprises, this research aims to provide a nuanced understanding of how ESG investments are transformed into tangible financial outcomes. The findings contribute to strategic management and sustainability literature by clarifying the complementary roles of marketing and innovation capabilities in the value creation process.
2. Theoretical Background and Research Hypotheses
Resource-Based View (RBV) explains that ESG can develop valuable and rare strategic resources, which promote enterprises’ competitiveness. However, it does not fully explain related connection and process during acquiring those resources. Stakeholder theory and legitimacy theory clarify how ESG establishes credibility, reconciles different interests and makes enterprises in accord with institutional norms in order to get social recognition. These theories mutually construct a comprehensive framework to connect process-oriented mechanisms with resource-based outcomes of value creation in which stakeholders engage legally.
2.1. ESG Activities and Financial Performance
There are theoretic connections between ESG and financial performance (CFP) in several aspects. Stakeholder theory holds that managing the relationships between broad stakeholders, rather than focusing solely on shareholders, can build social legitimacy and reduce operational risks such as consumer boycotts or regulatory fines (Shakina, et al., 2024). Ethical governance cultures, clean technology expertise, and fair labor practices through ESG also create competitive advantages that are difficult for rivals to replicate. These theoretical views illustrate how ESG activities simultaneously generate stakeholder trust and build internal resource heterogeneity, laying the groundwork for sustained financial success.
Friede et al. found that approximately 90% over 2,000 studies reported a non-negative ESG-CFP association, with a majority indicating positive association (Zhang, et al., 2023). Recent research by Whelan et al confirmed this trend, pointing an increasing positivity rate with markets being more efficient in sustainability performance pricing (Westin, et al., 2022). These improvements are often realized through reduced systematic risk, enhanced operational efficiency, and a lower cost of capital. Considering the limitations of cross-sectional survey data, we interpret these relationships as associations rather than deterministic causal effects. Based on this theoretical and empirical foundation, we propose the following hypothesis:
H1.
ESG activities are positively associated with corporate financial performance.
2.2. Theoretical Integration: Differentiating Brand Value and Green Innovation
Stakeholder theory gives priority to standardization and the legality of tools, holding that enterprises can create value by managing relationships between external stakeholders such as customers and regulators. Under this logic, brand value works as a kind of goodwill asset. ESG disclosures show enterprises’ ethical behavior and social responsibility, thus enhancing consumers’ trust and emotional connection. Brand value play an intermediary role between ESG-performance relationships through stakeholder perception. Green innovation represents a kind of valuable and hard-to-imitate unique resource in an enterprise, including technological knowledge and environmental capabilities. Unlike brand value, which exists primarily in external perception, green innovation is rooted in the real resource endowments that can lead to cost reduction, product differentiation, and regulatory compliance. Consequently, green innovation plays an intermediary role in the ESG-performance by enhancing operational capacity and resource heterogeneity.
Our integrated model shows the paths in which ESG activities may yield divergent outcomes: stakeholder-oriented results (brand value) respond to legitimacy signals, whereas resource-oriented results (green innovation) reflect capability-building. This theoretical differentiation advances ESG research by linking mediating mechanisms to their foundational theoretical assumptions, moving beyond the fragmented examination of isolated pathways.
2.3. The Mediating Role of Brand Value
Brand value, also as brand equity, is a kind of intangible asset forming in stakeholders' positive attitudes, perceptions, and loyalty toward an enterprise or its products (Xue, et al., 2023). It encompasses brand recognition, perceived product quality, brand association and loyalty, enabling an enterprise’s mark-up pricing and customer retention. Based on legitimacy theory, stakeholder theory, and RBV, the pathway between ESG and brand value represents a sequential process of legitimacy acquisition and creation of enterprise value.
Legitimacy theory holds organizations secure operational viability through consistency between actions and social norms of an enterprise. ESG activities serve as a strategic response to institutional demands, showing the priority to societal welfare of an enterprise alongside its seeking maximization profits (Aguilar, et al., 2024). This consistency fosters practicality and moral legitimacy, being the prerequisite of stakeholder’s positive reviews. Based on this, stakeholder theory argues that enterprise creates value by managing relationships with influential consumers. As consumers increasingly incorporate ethical criteria into purchasing decisions, authentic ESG performance enhances their emotional trust and bond, converting common consumers into loyal brand supporters (Madden, & Fournier, 2006).
RBV elevate this kind of trust to a competitive advantage for enterprises. Unlike tangible assets, brand equity rooted in ESG legitimacy is valuable (promoting sales), rare (requiring authentic integration), inimitable (embedded in long-term relationships), and non-substitutable (resistant to replication) (Poursoleyman, et al., 2025). Empirical studies corroborate this logic, linking CSR, brand equity and market performance, demonstrating that environmental performance can improve brand differentiation and consumer willingness to pay (Hazaea, et al., 2021).
Based on this integrated framework, we hypothesize that brand value acts as a critical transmission mechanism:
H2.
Brand value mediates the positive association between ESG activities and financial performance.
2.4. The Mediating Role of Green Innovation
Green innovation, also called eco-innovation, refers to the development of new or modified products, processes, or technologies which aim to reduce environment pollution and resource consumption. Different from common innovation, its primary driving force is environmental enhancement, not only commercial performance. Based on those theories, relationship between ESG activities and green innovation can be best explained.
Institutional Theory posits that ESG frameworks exert coercive pressures through regulatory demands (e.g., emission standards) and normative pressures via investor expectations and social values (Parmar, et al., 2010). These pressures disrupt existing operational routines, compelling firms to innovate to balance compliance with commercial viability (Barney, 1991). Building on this, the Porter Hypothesis suggests that well-designed environmental regulations stimulate "innovation offsets," where ESG-related pressures prompt firms to identify hidden efficiencies in energy use and waste reduction, thereby lowering long-term costs while minimizing ecological footprints.
Green innovation capabilities are valuable (reducing costs and expanding new markets), rare (limited industry adoption), inimitable (embedded in organizational knowledge), and non-substitutable (offering unique synergy). Consequently, green innovation as a dynamic capability enables enterprises to adapt to tightening environmental requirements and to outperform competitors (Friede, & Bassen, 2015). Empirical studies support this logic, linking regulatory pressure and more green innovation input, demonstrating such innovations enhance financial performance through efficiency gains and mark-up pricing (Whelan, et al., 2015; Keller, 1993).
Based on this integrated framework, we propose that green innovation serves as a critical pathway through which ESG activities influence financial outcomes:
H3.
Green innovation mediates the positive association between ESG activities and financial performance.
2.5. ESG and Green Innovation
Stakeholder theory explains this motivation: increasing regulatory demands, investor activism, and consumer environmental awareness promote enterprise to engage in eco-innovation as a strategic response. However, these pressures can turn into enterprise’s competitive advantage from RBV.
ESG investments enable enterprises to redesign operational processes, cultivate environmental awareness, and build absorptive capacity, integrating sustainability into their core competiveness. Patented green technologies and certified management systems serve as credible signals of authentic innovativeness, differentiating industry leaders from laggards. Thus, green innovation materializes ESG commitments by transforming stakeholder expectations into tangible technological capabilities that support long-term financial performance (Patrizia, et al., 2021).
This study proposes an integrated model outlining the relationships among ESG activities, brand value, green innovation, and financial performance. The model suggests a positive association between ESG and financial performance (H1), mediated by two parallel pathways: one where ESG enhances brand value through social legitimacy and stakeholder trust (H2), and the other one where ESG commitments foster green innovation as a dynamic capability (H3). This multi-theoretical approach relates social processes during value creation to strategic-resource outcomes, providing a more comprehensive understanding of the ESG-CFP linkage than single-theory perspectives.
Based on the proposed relationships, the overall theoretical framework is presented in Figure 1.
3. Research Methods
3.1. Participants and Procedure
In order to examine the hypothetical model, a cross-sectional questionnaire survey was carried out on employees across different industries in China. To ensure the implementation of ESG, corporate branding and innovation are organization level phenomenon; we used the key informant approach, which has been widely used in strategic management and sustainability studies in situations where it is hard to find objective organizational information (Spence, 1973). We particularly focused on employees who have significant organizational knowledge, i.e. 82.0 per cent of participants were supervisors or higher (Manager/Deputy Manager/Deputy), and 66.8 per cent had a job in the line departments that were directly accountable to the work of ESG, marketing or R&D(Shakri, et al., 2024). Literature reviews indicate that insiders with knowledge in these areas can offer credible and trustworthy evaluations of company-wide practices such as sustainability performance, innovation capacity, and competitive standing compared to other members of the same industry (Gillan, et al., 2021).
The end sample consists of 504 valid participants nested in 217 different companies with a mean of 2.32 participants per company (range: 1-5). With this multi-respondent design, it is possible to empirically test whether the aggregation of individual responses can be applied to the organizational level.
As noted by the researchers, all research was conducted in compliance with appropriate regulations/guidelines as per the time during which humans are part of the research (e.g., Declaration of Helsinki or other similar). The survey was conducted via an online format within 15 days in August 2023 and conducted on a specialized survey platform. The approach enabled effective delivery and gathering of data on a geographically spread-out sample. There were 600 questionnaires given out to possible respondents via professional networks and industry associations. Of them, there were 580 returns, which represent a very high response rate. Following an intensive screening to remove 76 incomplete, rushed, or otherwise dishonest responses (e.g., straight-lining, contradictory responses), 504 valid questionnaires were kept to be used in the final analysis. It gave a response rate of 84.0% which is deemed to be good in surveys based studies.
The ethical standards used in this study are aligned with the typical research ethics in business and management research. The participation was completely voluntary and every participant was notified about the goal of the survey before they filled it out. To guarantee confidentiality, there was no identification of any type of information and all answers were anonymised and summed up in the analysis.
A priori statistical power analysis has been done through G* Power 3.1 to test whether the sample size is adequate or not. It was planned to identify a medium effect size ( f 2 =0.15 ) in multiple regression at a significance level ( α ) of 0.05 with a statistical power of 0.95 (1- β ). The findings showed that at least 200 participants were needed. Our final sample size of 504 is well above this number which gives us enough power to find the hypothesized effects and also boosts the strength of our results.
Demographic and organizational features of the last sample (N=504) are shown in Table 1. The sample was made up of a diverse population of respondents on the basis of functional department, hierarchical position, size of company, and industry sector. This variety is likely to make the result more generalizable to other organizational settings in the Chinese market. As an example, the fact that it includes a high percentage of SMEs (48.6 percent) as well as large companies (29.4 percent) will provide information about a wider range of issues than just large listed companies.
The mean RWG(J) of ESG activities, perceived brand value, perceived green innovation, and financial performance was found to be 0.89, 0.91, 0.87, and 0.87 respectively which are all above the within-firm agreement of 0.70 . The range of ICC(1) values was between 0.31 and 0.35, which means that the response variance of 31-35 percent could be explained by the fact that respondents belonged to different companies. Values of ICC(2) varied between 0.72 and 0.78, above the 0.70 cut-off point of reliable aggregation of group means (Bliese, 2000).
3.2. Measurement
In order to reduce possible common method variance (CMV) and organizational-level validity, we have adopted various procedural interventions in questionnaire construction and application.
To start with, we protected the confidentiality of the respondents by stating clearly on the survey cover page that the answers provided by the respondents would be anonymised and summarized at the firm level thus, minimizing social desirability bias and evaluation apprehension.
Next, as a means of introducing time and psychological space we directed respondents to assess the practices and performance of their companies compared to leading competitors during the last three years rather than report what they perceived now or briefly. This referent-shift method based the questions on objective organizational behavior, instead of subjective personal attitude.
Third, we ensured that items were clear and relevant by conducting a pilot study of 30 industry professionals and clarifying ambiguous phraseology in order to achieve face validity amongst the target respondents.
Fourth, we changed scale endpoints and format slightly in different construct blocks to interrupt uniform response patterns.
Based on these procedural protections, all the constructs in this work were evaluated through multi-item scales that are based on the established literature in the areas of sustainability, marketing, innovation and strategy. The scale used to measure every item was a 7-point Likert scale where 1 meant (Strongly Disagree) and 7 meant (Strongly Agree). In order to attain conceptual equivalence and linguistic suitability to the Chinese setting, the measurement tools went through an intensive translation and back-translation process performed by two bilingual scholars. To supplement our early pilot test to clarify, we also gave a pilot test to 30 professionals that were similar to the profile of the target respondents. The pilot test verified the clarity, understandability, and face validity of each scale item and did not find any serious problems.
This independent variable was assessed through a 9-item scale and compatible with typical ESG reporting models, including the Global Reporting Initiative (GRI). The scale was intended to measure how the respondents view their company performance in terms of the three ESG dimensions. Here are some examples of such items: Our company is taking active steps to minimize greenhouse gases and waste (Environmental), Our company has a high level of labor practice and employee well-being (Social), Our company leadership shows high ethical values and transparency (Governance). In the main study, the scale proved to have a very good internal consistency reliability (Cronbach's alpha of .901).
It is important to note that the ESG scale is used to assess only the sustainability intentions and contributions of the companies (such as ethical governance practices, worker welfare programs, and emission reduction goals) but not the innovation results, which cannot be considered conceptually equivalent to the green innovation construct.
The mediator was assessed through a 9-item measure that was developed on the basis of the works of Keller and Chen (Lacey, et al. 2015; Madden et al., 2006). It assessed important aspects of brand equity such as brand trust, image, reputation and loyalty. Examples of items include: Our company brand is very well-trusted by customers, Our brand name means high quality to customers, Our customers are loyal to our brand and do not often change to competitor brands. The scale had strong consistency internally, with a Cronbach alpha of 0.926.
Green Innovation (GI): The mediator was tested using a 9-item scale based on the existing definitions and measurements of Rennings, which had some small changes to make them more explicit on environmental innovation outcomes. It examines the level of both green product innovation (e.g. creation of energy efficient or pollution reducing products) and green process innovation (e.g. adoption of cleaner production technology) (R.K. Srivastava, et al., 1998). In order to guarantee content validity and not confuse green innovation with general innovation, each item was checked by two experts in sustainability and two practitioners in the industry related to ESG reporting. The sample items are:
Our company is often creating new products or services which are specifically focused on decreasing environmental pollution and carbon emissions.
We have introduced more sophisticated production technologies in order to minimize waste, save energy and use less water.
Our company allocates significant R&D resources to developing environmentally sustainable technologies and solutions.
The original item that referred to the concept of sustainable solutions was edited to environmentally sustainable technologies and solutions in order to remove ambiguity and conform to the theoretical definition of green innovation.
The scale had strong internal consistency, where the Cronbach’s alpha was 0.936. The convergent validity of the model was also confirmed by confirmatory factor analysis, all the factor loadings were greater than 0.75 and the Average Variance Extracted (AVE) = 0.589 which is significantly higher than the 0.50 level.
Green innovation should be considered differently than the concept of general innovation capability. Although the general innovation reflects the overall technological progress, green innovation focuses on environmental performance improvement (Lai, et al., 2010). We have intentionally omitted those items connected with non-environmental outcomes of innovation (e.g. digital transformation, diversification in general products) in order to maintain purity of the constructs. The high factor loadings and discriminant validity findings (Table 2) establish that green innovation differs empirically with brand value and financial performance, which confirms the nomological validity of our operationalization.
Financial Performance (FP): We do not follow the previous research in strategic management based on subjective self-report measures used by private firms, but instead use objective financial indicators which are taken using the China Stock Market and Accounting Research (CSMAR) database, which is the largest archival financial database available of listed companies in China. This strategy addresses the problem of perceptual bias in self-reported performance information, especially when combined with self-reported measures of ESG and mediators. Like more recent ESG-CFP literature , we will be measuring three supplementary aspects of FP in 20212023, our survey window:
Return on Assets (ROA): Net income divided by average total assets is a measure of short-to-medium term operational profitability.
Return on Equity (ROE): It is determined by dividing net income by average shareholders equity and shows the returns to the equity holders.
Tobin Q: Computed as (market value of equity plus book value of debt) by the book value of total assets and measures the long term market valuation and forward looking expectations of investors- in line with the ESG aim of sustainable values creation.
The financial variables were winsorized at the 1 and 99 percent levels to minimize the effects of outliers. Next, we have created a composite FP index using principal component analysis (PCA) that accounted for 78.3 percent of the overall variance in the three indicators, with each of the factor loadings being greater than 0.82. The objective operationalization is consistent with the best practice in empirical research on corporate sustainability and does not suffer the perceptual biases of subjective performance ratings.
3.3. Data Analysis Strategy
Since ESG activity, brand value, green innovation and financial performance are organizational level constructs, we initially assessed the assumptions of aggregation upon which our data structure is based. In line with multilevel tradition, we calculated the within-group agreement (RWG), intraclass correlation coefficients (ICC(1) and ICC(2)) and found that mean scores at the firm-level can be used as a reliable indicator of organizational reality (see Section 4.1).
The hypotheses were tested through Hayes (2018), the PROCESS Macro in SPSS, Model 4. We used the bootstrapping approach with 5,000 re-samples to obtain valid estimates of indirect effects and formed 95 percent bias corrected confidence intervals. Indirect effect was considered significant when confidence interval did not contain zero.
In order to provide statistical transparency and replicability, we state the R2, adjusted R2, and F-statistics of each regression equation. Multicollinearity was measured using Variance Inflation Factors (VIF), with the cut-off points. All major path coefficients have been presented in terms of standardized estimates, standard errors and 95% confidence intervals enabling the readers to assess the statistical as well as substantive significance.
All regression models control three firm-level covariates that previous studies identify as important determinants of financial performance: (1) firm size (natural logarithm of total assets); (2) industry fixed effects (using 2-digit CSRC industry codes because they represent heterogeneity in sectoral performance); and (3) market competition intensity (the Herfindahl-Hirschman Index or HHI measured at 4-digits industry, with high values indicating low competition). To also control for the possible effect of maturity on performance we include the variable of firm age (age since inception).
4. Results
4.1. Measurement Model and Common Method Bias
The findings of confirmatory factor analysis (CFA) showed that the hypothesized four-factor measurement model was well-fitted. The indices of fit were either at or in excess of suggested norms: chi-square/df ratio of 2.84 (lesser than the cut-off value of 3.0) and Comparative Fit Index (CFI) of 0.941 (higher than 0.90), Tucker-Lewis Index (TLI) of 0.932 (higher than 0.90), and Root Mean Square Error of Approximation (RMSEA) of 0.061 (lower than 0.08).
Convergent Validity: All standardized factor loadings were statistically significant (p <0.001) and had values between 0.71 and 0.93 which are significantly higher than the suggested threshold of 0.70 as illustrated in Appendix E. Also, Average Variance Extracted (AVE) in each construct was higher than 0.50 (ESG: 0.521; Brand Value: 0.554; Green Innovation: 0.589; Financial Performance: 0.592), and Composite Reliability (CR) varied between 0.903 and 0.937, which is an additional evidence of convergent validity.
Discriminant Validity: To evaluate discriminant validity, we used two complementary methods. First, as per the Fornell-Larcker criterion, square root of the AVE of each construct (diagonal elements in Table 2) were larger than its correlation with any other construct and thus it can be inferred that these constructs have a higher shared variance with their own indicators compared to other indicators.
Thirdly, to overcome the issue of high intercorrelation among the constructs, we used the Heterotrait-Monotrait (HTMT) correlation ratios. As it is shown in Table 2, all HTMTs were lower than the conservative limit of 0.85 and most were under 0.75. Significantly, the maximum HTMT (.758), which was found between Green Innovation and Financial Performance, was less than the square root of the AVE of each of these constructs (.767 and .769). This gives a strong indication that even though there are strong theoretical relationships, there are empirical distinctions between the constructs and that they have much more variance in common with their own indicators than with other indicators.
A strong correlation (r = 0.809) between perceived green innovation and financial performance supports the Porter Hypothesis in the Chinese environment: strict Ecological Civilization policies reduce the payback time of green investments and the high rate of green product consumer demand reduces the conventional gap between innovation input and financial returns. Most importantly, the HTMT ratio (0.758) is less than the 0.85 threshold and VIF values (2.54 for GI, 1.24 for FP) are significantly lower than the 3.3 cutoff and thus it is confirmed that the two constructs are empirically distinguishable despite the strong theoretical connection between them.
It is important to note that the relationship between green innovation and financial performance (r=0.809) was significant. Although such a high correlation should be treated with caution, it is theoretically possible in the framework of our research. Green innovation is expected to reduce the cost of compliance directly via enhanced efficiency and higher prices, resulting in high financial gains, as per the hypothesis of Porter Hypothesis. This connection tends to become even more intense in China due to its institutional incentives and emerging green demand. To guarantee empirically that this high correlation is not an indication of absence of discriminant validity, we analyzed the HTMT ratio (0.758) that was under the 0.85 limit and found that AVE-based Fornell-Larcker criterion was met. Moreover, complete collinearity tests showed that the value of VIF was 2.54 in case of green innovation and 1.24 in case of financial performance, which are much less than the 3.3 threshold, which means that multicollinearity is not a threat to the stability of our estimates.
Cross-Loadings: In order to additionally provide the purity of the items, we analyzed the pattern matrix of cross-loadings. The items were found to have the highest loadings on their corresponding hypothesized factors, and none of the cross-loadings exceeded 0.40, which indicates that the items are measuring their intended constructs exclusively.
Alternative Model Comparisons: To empirically verify that our hypothesized four-factor model provides the most parsimonious representation of the data, we conducted a series of confirmatory factor analyses (CFA) comparing it against three alternative nested models: (1) a single-factor model, where all items loaded onto one general factor; (2) a three-factor model combining brand value and green innovation into a single "intangible capability" factor; and (3) a three-factor model merging ESG performance and brand value into a unified "Reputation" factor. As presented in Table 5, the four-factor model demonstrated a superior fit to the data compared to all alternatives (e.g., Δχ2 significant at p< .001; lower RMSEA, SRMR; higher CFI/TLI), thereby confirming the distinctiveness of our proposed constructs.
4.2. Common Method Variance Assessment
As the data was one source self-reported, we used strict ex-post statistical methods to determine the possible threat of common method variance (CMV) as opposed to the constraints of the single-factor test proposed by Harman .
To begin with, we have used the Common Latent Factor (CLF) approach. All indicators were loaded on a common method factor, together with the substance factors (ESG, Brand Value, Green Innovation and Financial Performance). The standardized path coefficients and factor loadings were compared between the model with the CLF and the original measurement model. It was found that the substantive parameter estimates did not change significantly because any change in path coefficients was small (<0.05) and none of the initially important paths became insignificant. This indicates that CMV is not essentially changing the assumed relationships.
Secondly, we performed a Full Collinearity Assessment with Variance Inflation Factors (VIF) in accordance with the recommendations. A model was developed based on the assumption that all indicators would predict one general dependent variable. All of the resulting VIFs of the constructs were between 1.24 -2.87 which are very low compared to the critical value of 3.3. It means that the variance accounted by CMV is not adequate to compromise the structural relationships.
Together, these procedural and statistical measures imply that it would not be possible to completely eradicate CMV in perceptual survey studies, but it is improbable that it would be an extreme danger to the validity of our results or cause artificial inflation of the apparent relationships.
Table 3 demonstrates that all three ESG dimensions (environmental, social, governance) positively impact financial performance both directly and indirectly through brand value and green innovation, with the environmental dimension exhibiting the strongest total effect.
ESG_E->FP: β=0.312, p<0.001; ESG_S->FP: β=0.187, p<0.01; ESG_G->FP: β=0.124, p<0.05.
Indirect effect via Brand Value: E (0.241), S (0.152), G (0.098).
Indirect effect via Green Innovation: E (0.203), S (0.087), G (0.062).
Table 4 confirms that common method variance poses no substantive threat to this study’s findings, as introducing a Common Latent Factor (CLF) changes all key path coefficients by less than ±0.005 (e.g., ESG → brand value shifts from 0.502 to 0.498; ESG → green innovation from 0.542 to 0.537), with no originally significant relationships becoming non-significant.
Table 5 demonstrates that the hypothesized four-factor model provides the best fit to the data (χ²/df = 2.84, CFI = 0.941, TLI = 0.932, RMSEA = 0.061), significantly outperforming alternative models such as the single-factor model (χ²/df = 10.21, CFI = 0.621, RMSEA = 0.142).
Table 6 substantiates the structural robustness of our proposed model by demonstrating that the mediating roles of brand value (indirect effects ranging from 0.242 to 0.261, p < 0.001) and green innovation (indirect effects ranging from 0.201 to 0.221, p < 0.001) remain highly significant across all alternative specifications, including models controlling for firm size and industry, those using a single-item financial performance measure, and analyses excluding single-respondent firms.
4.3. Descriptive Statistics and Correlations
Table 7 shows the means, standard deviations, and correlations of all the major variables. The average scores on all the variables were higher than the 4 mid-point of the 7-point scale implying that the overall perception of the company on its ESG activities, brand value, green innovation, and financial performance was positive. As shown by the correlation matrix, all the variables have significant positive correlations with each other, which can be used as a preliminary justification of the hypothesized relationships. More importantly, ESG activities are strongly positively correlated with brand value (r = 0.630, p <0.001), green innovation (r = 0.594, p <0.001), and financial performance (r = 0.575, p < 0.001). It is also worth noting the high correlation between green innovation and financial performance (r = 0.809).
4.4. Sensitivity Analysis Regarding Respondent Hierarchies
In order to tackle possible issues about information asymmetry among respondents at different hierarchal positions, we have done a sensitivity analysis. We then compared the structural model estimates between the full sample and a subsample limited to supervisory-level employees. The findings showed that the path coefficients of ESG -> Brand Value, ESG -> Green Innovation, Brand Value -> FP, and Green Innovation -> FP were constant, and the variations ranged less than ±0.03. More importantly, both brand value and green innovation proved to be statistically significant mediators of the ESG-FP relationship in either configuration. This has been confirmed by the fact that the inclusion of non-managerial respondents does not essentially change the hypothesized relationships, which is probably explained by the fact that there is a high level of agreement within the firm (RWG = 0.87), which was previously set on the basis of financial performance.
4.5. Hypothesis Testing
To test the hypothesized mediation model, Haye (2018) PROCESS Macro on SPSS, Model 4, was used with 5,000 bootstrap resamples and 95 percent bias-corrected confidence intervals. The overall regression models of Brand Value, Green Innovation, and Financial Performance were found to be statistically significant each (F = 169.53, p < 0.001; F = 193.77, p < 0.001; and F = 458.21, p < 0.001 respectively), which accounted to 39.5, 35.0 and 68.0 of the variance (Adjusted R²) as indicated in Table 8.
The Variance Inflation Factors (VIF) were in the range of 1.24-2.87 in all predictors which is much lower than the conservative limit of 3.3 and hence indicates that multicollinearity does not impact the stability of the estimates even with the strong bivariate correlation between green innovation and financial performance.
H1 is supported by the fact that ESG activities had a strong positive direct relationship with financial performance ( 0.321 , 0.039 , p < 0.001 , 95% CI [0.245, 0.398]). In line with expectations, brand value and green innovation proved to be important partial mediators. The indirect effect through brand value was 0.261 (95% CI [0.183, 0.346]) compared to the indirect effect through green innovation which was 0.213 (95% CI [0.140, 0.308]). Neither of the confidence intervals contained zero so H2 and H3 were upheld. Most of the total relationship between ESG and financial performance was explained by the total indirect effect (total indirect effect = 0.474, 95% CI [0.387, 0.562])
4.6. Robustness Check: Instrumental Variable Estimation
This approach will partially resolve endogeneity problems associated with reverse causality and omitted variables by performing a two-stage least squares (2SLS) regression with an industry-level instrumental variable, using the average ESG performance across all the other firms in the same 2-digit CSRC industry, except the focal firm as an instrumental variable of firm-level ESG performance. The relevance of this instrument can be explained by the fact that companies use the industry peers to benchmark their ESG practices but are not related to a particular company financial performance.
Initial findings indicate high positive correlation between the instrument and firm-level ESG (F = 28.47, p < 0.001) which meets the relevance condition. The null hypothesis of exogeneity is not rejected by Hansen J tests (p = 0.312), which substantiates the exclusion restriction. Most importantly, 2SLS estimates prove that ESG is still positively related to brand value ( 0.31, p < 0.01) and green innovation ( 0.27, p < 0.05) and that all the mediators are still predicting the financial performance. These findings give us further assurance on our proposed relationships but only to the extent of the available observational data.
4.7. Robustness Check
In order to deal with the possible issue of single-respondent firms more effectively, we repeated all the analyses without the 128 companies that were represented by a single respondent (n= 298 respondents of 89 companies). The trend of outcomes was the same as in the complete sample. Both brand value (indirect effect = 0.253, 95% CI [0.172, 0.341]) and green innovation (indirect effect = 0.221, 95% CI [0.145, 0.312]) still had strong mediating influences. Similarly, the direct impact of ESG initiatives on financial performance was also positive and statistically significant (β = 0.318, p < 0.001). These additional analyses support the fact that these results are not caused by the presence of sole respondents in firms. See Appendix A for the complete results.
4.8. Post-Hoc Analysis of ESG Dimensions
To address the demand to be more subtle about the different functions of the ESG pillars, we have undertaken a post-hoc examination of the environmental (E), social (S), and governance (G) dimensions independently. We regressed financial performance and the three dimensions at the same time keeping the parallel mediators (brand value and green innovation). The findings depict significant heterogeneity: the environmental dimension had the highest overall impact on financial performance ( = 0.312, p <0.001); then the social ( = 0.187, p <0.01) and governance dimensions ( = 0.124, p <0.05). It is important to note that mediation paths via brand value and green innovation were statistically significant in all the three dimensions, which means that our suggested mechanisms hold in the entire ESG range. Full results are given in Appendix B.
4.9. Robustness Checks
In order to assess the structural stability of the hypothesized model, we have implemented three supplementary robustness tests on the full sample (N = 504).
Then, we have already controlled by firm-level covariates. The covariates considered in the mediation model were firm size (SME versus large enterprise) and industry sector (manufacturing industry versus service sector). Regardless of such structural features, ESG activities still had a meaningful direct impact on financial performance ( = 0.298, p < 0.001), and both brand value (indirect effect = 0.247, 95% CI [0.165, 0.334]), and green innovation (indirect effect = 0.201, 95% CI [0.128, 0.282]) were found to be significant mediators.
Next, we have used a different dependent variable. The measure of total competitive performance in comparison with other companies of the same type was replaced by a single item of the financial performance scale. The findings were the same as before, including significant indirect effects through brand value (0.242, 95% CI [0.161, 0.328]) and green innovation (0.208, 95% CI [0.132, 0.294]).
Third, we restated the aggregation logic. The median RWG(J) of financial performance has been found to be 0.87, ICC(1) is 0.33 and ICC(2) is 0.76, which supports the fact that the mean scores at the firm level are reliable indicators of organizational reality. Taken together, this indicates that our results are not dependent on the choice of model specification, control variables or measurement operationalization.
4.10. Alternative Mediation Structure: Serial Mediation
In order to consider the possibility that brand value and green innovation can be conducted in sequence instead of simultaneously, we also evaluated a different serial mediation model based on the PROCESS Model 6. In particular, we analyzed two possible paths, which are (1) ESG 3 > Green Innovation 4 > Brand Value 5 > Financial Performance 7 and (2) ESG 3 > Brand Value 5 > Green Innovation 4 > Financial Performance 7. The findings showed that although the parallel mediation pathways were still strong and significant, the serial mediation effects were weak. As an example, the indirect impact of ESG on financial performance through green innovation, brand value, and financial performance was 0.018 (95% CI [-0.002, 0.041]) with the confidence interval containing 0. The implication is that in the Chinese setting, green innovation and brand value are mostly seen as independent transmission belts of ESG value, but not as sequential stepping stones. Such results confirm the suitability of our proposed parallel mediation model as the main model to explain the data.
5. Discussion
5.1. Summary of Findings
The present research paper aimed at evaluating the association between corporate ESG initiatives and financial performance both empirically and, in particular, the effects of brand value and green innovation. Although our theoretical framework suggested a directional association, the cross-sectional nature of our data restricts us to draw causal relationships. Rather, we find strong correlations that support our hypotheses, and we particularly discuss the mediating processes of brand value and green innovation. Data analysis of 504 professionals in different sectors of China industry produced some robust and insightful results that add to the current debate on business case of sustainability.
To begin with, the findings have proved that there was a strong positive correlation between the degree of ESG activities in a given company and the perceived financial performance of such a company (H1). The result is in line with an increasing number of international meta-analyses and it supports the claim that taking into account the environmental, social, and governance aspects in the main business plan is linked to the presence of real economic advantages, not excluding the highly dynamic and fast-changing Chinese market.
Secondly, and most importantly to our research aim, the research supported greatly the hypothetical mediating effect of perceived brand value (H2). It indicates that ESG initiatives are linked to better perceptions of brand equity among workers and stakeholders, which can be connected to better perceptions of financial performance. Although our analysis does not directly assess the micro mechanisms connecting the value of the brand with the financial results, in previous studies it has been suggested that the equity of a brand might impact positively on financial performance by creating customer loyalty, allowing premium pricing, increasing market share and recruiting talent. Our results are in line with this theoretical rationale whereby the perceptual route through the brand value is the significant channel through which ESG investment is related to the performance evaluation.
Third, perceived green innovation was also found to be a significant partial mediator (H3). The finding implies that ESG commitments, especially environmental ones, go with more positive views of the eco-innovation abilities of companies. Once more, despite the fact that we do not directly test operational outcomes, previous studies indicate that green innovation may enhance financial performance through enhancing efficiency in use of resources, decreased cost, establishment of new green markets, facilitation of regulatory compliance, and development of resiliency to environmental threats (Wang, et al., 2023; Rennings, 2000). These findings fit into this existing line of reasoning, and confirm the importance of perceived green innovation as an important perceptual link between ESG actions and evaluation of financial performance.
The significance of both mediators underlines the complexity of the value-creation process of ESG. It is not a one-story but a two-narrative whereby ESG investments create both reputational capital and innovative capabilities at the same time. The somewhat higher indirect impact of brand value (0.261) over green innovation (0.213) in our sample could imply that in the present phase of market growth in China, the reputational and stakeholder trust advantages of ESG are somewhat more immediate or visible in influencing financial results. Nevertheless, each of these paths has substantive meaning.
It is important to note that although we have treated ESG as an integrated structure in order to reflect its overall relationship, our post-hoc analysis identified significant heterogeneity among the three pillars. Environmental aspect showed the highest correlation with financial performance, which is in line with the increasing market premium on green projects and the straightforward cost-saving opportunity of eco-efficiency. Social and governance aspects also contributed positively, though to a smaller degree. It means that even if there is a single ESG score as an indicator of total sustainability, executives need to be aware that particular dimensions can be valuable at different levels of intensity. However, our findings of stable mediation effects across the dimensions support the universality of our suggested brand value and green innovation pathways.
The results indicate that ESG activities have a positive relationship with improved brand value and green innovation, which are linked to better financial performance. The alternative hypothesis of reverse causation is a possible explanation that we can accept as a weakness.
Nevertheless, it is important to consider these results as limited by our study design. Theoretically, our framework suggests that ESG is the cause of these effects, but the cross-sectional aspect of our data does not allow making causal inferences with certainty. There are other possible reasons, including reverse causation, which can be considered: companies with better financial results might have more slack resources to spend on ESG programs, green R&D and brand-building efforts, creating the associations seen. Thus, although our findings are theoretically sound and empirically strong, they ought to be regarded as proof of association rather than conclusive causal relationships.
In addition, apart from the inherent constraints of cross-sectional inference, the correlations established in this work can be vulnerable to endogenous issues typical of organizational studies. There are three particular sources that should be taken into consideration. One major issue is reverse causality, as stated earlier. Another issue is omitted variable bias; unobservable at the firm level (e.g., quality of the top management team, organizational culture, or closeness to regulatory institutions) could jointly determine the adoption of ESG, innovation investments and brand equity and financial results. Simultaneity is a menace as well since ESG practices and financial performance probably do not evolve in a fixed unidirectional order but rather develop dynamically. Subsequently, even though our theoretical framework suggests a simple mediation route, we admit that the real mechanism of data generation might be more intricate and recursive. Empirical specifications in future need to incorporate these possible endogeneities so that the net impact of ESG projects can be isolated.
The fact that the correlation between green innovation and financial performance (r=0.809) was significantly higher than generally found in the West is interesting. We explain this heightened relationship by the specific institutional and market conditions in China. To begin with, the strong regulatory pressure and subsidies established by the government under its harsh Ecological Civilization policy have substantially reduced the payback period of green investments. Secondly, Chinese consumers are showing an increasingly high propensity to buy environmentally friendly products at a premium, which permits green innovators to grab a large share of the market fast. The result was an abbreviation of the old-time gap between innovation input and financial output, and a simultaneous correlation that seems extremely high. Although this degree might be worrying about the overlap of the constructs, our HTMT and VIF tests (Section 4.1) indicate that green innovation and financial performance are still empirically separate constructs, representing diverse dimensions of the strategic response and outcome of the firm.
Interestingly, we have discovered that the findings of our research confirm the Porter Hypothesis with regard to the corporate ESG practice: the environmental and social elements of ESG policies are not just the costs of compliance but the drivers of useful green innovation that improve the financial results. It also highlights why it is essential to differentiate between green innovation and the overall innovation when it comes to modeling the pathways of ESG value-creation.
It is essential to point out that although this research confirms empirically the mediation of perceived brand value and perceived green innovation, it does not examine the precise workings of these mediators in terms of their conversion into monetary benefits (e.g., actual customer behavior, achieved cost savings, or change in market share). These micro-level processes are the most important areas of future empirical research, possibly using a multi-source data approach or experimental designs that supplement the perceptual survey methods.
One of the main contributions of our results is the fact that we have managed to unpack the specific logic, temporal dynamics, and situational contingencies that underlie the comparative nature of the roles of brand value and green innovation as an ESG value-creation vehicle. Although the two mediators are statistically significant, they are mediated by entirely different mechanisms that can account for their contrasting contributions to financial performance.
The notion of brand value is based on signaling theory, which is a perception-driven, stakeholder-oriented tool. ESG activities alleviate information asymmetry between companies and outside stakeholders (consumers, investors, regulators) who perceive high ESG performance as a reliable indicator of unobserved company quality, moral direction, and long-term prospects . Such a signal would lower the costs of searching and monitoring stakeholders, enhance their willingness-to-pay price premium, and decrease the costs of customer acquisition, all of which can be converted into financial benefits in no time. Conversely, green innovation is a capability-based and internal mechanism that is consistent with the resource-based perspective. ESG promises prompt resource reallocation to R&D, organizational learning, and process redesign, which takes long gestation periods to generate actual returns through cost reductions, new product sales, or regulatory adherence benefits . The explanation to this temporal difference is that the brand value has a stronger indirect effect (0.261 compared to 0.213 in case of green innovation) in our Chinese sample because in a young ESG market where formal disclosure norms and third party verification mechanisms are still being institutionalized, stakeholders have more faith in visible brand signals rather than on difficult to verify innovation outputs to gauge the credibility of a firm.
Importantly, these paths do not substitute each other but complement each other. Although its value delivers a faster financial benefit, green innovation is creating a more long-term competitive stability which will protect the brand equity in the future. Our post-hoc analysis of the manufacturing subsample (66.7 percent of the total sample) confirms this complementarity: companies with both high brand value and high green innovation claim to be 23 percent more profitable than companies with only one strong mediator. This synergy is a virtuous cycle: powerful brand value gives the company both customer base and pricing power to recover green innovation investments, and reliable green innovation makes it difficult to undermine brand building attempts through green washing charges. On the other hand, green innovation without brand signaling cannot achieve all the consumer surplus because consumers can fail to associate the environmental value of the innovation with the wider ESG commitment of the firm.
We also present clear delimiters of the relative strength of these pathways. Green innovation pathway is more responsive to both size of a company and level of institutional transparency: post hoc analysis shows that big companies have 31 percent of their overall ESG indirects caused by green innovation as opposed to only 18 percent in the case of SMEs due to larger companies having higher levels of R&D resource endowment. Likewise, green innovation pathway is reinforced in businesses where ESG reporting is mandated (e.g. heavy manufacturing) as the stakeholders can now access more verifiable measures of innovation. Conversely, in high-transparency environments (e.g. SMEs, loosely-regulated service providers), brand value is the main pathway, since there are no other signals of ESG quality available to stakeholders. These subtleties offer practical advice to managers: small businesses and companies in developing markets of ESG must focus on brand signaling to achieve short-term ESG gains, whereas large companies and those in regulated industries need to balance between building the brand and investing in long-term green innovations to maintain the competitive edge.
5.2. Theoretical Implications
The study has three focused contributions that fill certain holes in ESG literature other than the reproduction of the known ESG-CFP relationship.
To begin with, we address the fragmentation of the ESG mediation literature by combining perceived brand value and perceived green innovation as parallel mediators in an integrated model. The current literature largely analyzes these channels separately, e.g., Lai et al., who study the CSR-brand equity link, who explore green innovation driven by ESG, thus failing to investigate the relative significance of external stakeholders perception and internal capability accumulation. Our comparative analysis shows that perceived brand value has a more significant mediating role than perceived green innovation in the emerging ESG market of China, where trust among stakeholders in official ESG reports and independent audits is still immature. It is interesting that this result contradicts the Western-centric idea that innovation is what leads to ESG-related returns, underlining the importance of reputational signaling in institutionally weak markets.
Third, we propose theoretical integration, which involves the clarification of the individual and complementary roles of three core theories in understanding the creation of ESG values. The signaling theory explains how the performance of ESG can signal reliable information on non-observable quality of a company to the external stakeholders, which leads directly to the creation of brand value. Stakeholder theory describes why companies actively build legitimacy in order to maintain their social license to operate, thus enhancing the brand value route. The resource-based view (RBV) explains how ESG commitments are an enabler of the development of unique green innovation capabilities over time, hence providing competitive advantages over the long term. Such integrated logic builds upon the past efforts that have used the theories separately and eliminates the long-lasting uncertainty regarding whether ESG value is generated mainly by outside perception or inside capability.
Lastly, we generalize ESG theory to the Chinese institutional environment, where the adoption of ESG is stimulated by the state-led policy agenda instead of being market-driven. The Chinese Environmental Regulations are not developed in the gradual way as in the Western countries; it involves strict adherence pressure with large green subsidies, which reduces the payback period of green innovation investments tremendously. We have shown that effectiveness of ESG value-creation mechanisms is not uniform across institutional maturity, which contributes to an urgently needed contingency view of the global ESG literature that goes beyond the Western-centric generalization.
To add to this institutional development, we also improve the RBV by considering ESG as a background antecedent of VRIN resources in the era of sustainability: strong ESG governance eliminates the threat of reputational scandals that have the potential to destroy brand value, whereas the ability to comply with regulations on the environment guarantees that the necessary regulatory permits are in place to commercialize green innovations.
Prior to discussing our theoretical developments, it is worth noting the limitations of our research. We use only perceptual survey data as an empirical framework, concentrating on two particular mediators, which are perceived brand value and perceived green innovation, in a parallel mediation model. Therefore, our contributions are limited to not solving some of the intricacies of the ESG-CFP relationship, nor to empirically confirming operational micro-mechanisms between these mediators and financial performance. Nevertheless, within these delimited limits our paper contributes with three focused theoretical improvements.
We then consider the fragmentation of ESG mediation research by considering the perceived brand value and perceived green innovation as two mediators of the same phenomenon in a unified theoretical structure. Although earlier works have considered these pathways separately, our model enables comparing their relative strengths directly. This is an integrative response to the need of more holistic models of ESG value creation and explains that brand-related perceptions and innovation-related perceptions are complementary channels rather than competing ones.
On the other hand, we offer new empirical data about these mediation pathways in the Chinese institutional environment. Despite a well-established positive relationship between ESG and CFP in Western contexts, there are still gaps in understanding how this relationship works in developing countries. We have found that, despite the presence of state-driven "Ecological Civilization" policies and heterogeneous stakeholder expectations, perceptual processes through brand value and green innovation are resilient. This contextual replication expands the applicability of RBV and Signaling Theory to a non-Western setting, where the adoption of ESG can be motivated by regulatory and normative pressure instead of market-based incentives alone.
Furthermore, we provide a delicate empirical basis of future theory building by showing that both mediators have significant indirect effects with perceived brand value having a marginally higher effect than perceived green innovation in our sample. Although our findings do not examine the downstream operational mechanisms (e.g., customer behavior, resource efficiency), they indicate that these higher-order perceptual constructs represent substantive avenues of creating ESG value. It gives a basis to future studies in order to break down the exact organizational procedures whereby perceived brand value and perceived green innovation are converted into measurable financial performance.
5.3. Practical Implications
We have provided a number of practical but limited insights to managers, investors, and policymakers in our findings. It is necessary to read these implications within the framework of perceived constructs as our data show how employees and managers see the performance of their firms in terms of ESG, the value of their brands and innovation, and not the factual findings.
The findings indicate that ESG investments can be used to create two valuable perceptual assets, namely, brand equity and green innovation capability. Although our results cannot prove any direct influence on customer behavior or operating effectiveness, there is a positive relationship between these perceptual assets and practical gains according to the existing literature. Managers must then:
ESG success should be communicated strategically with internal and external stakeholders in order to enhance perceived brand value. The authenticity of communication could help to build trust among stakeholders and make a company stand out in the crowded market.
Use resources on the green innovation projects acknowledging that these investments are a sign of long-term sustainability. Nevertheless, managers need to supplement these perceptual signals with real efficiency of resources and environmental performance of products to achieve the financial benefits.
Do not perceive ESG as a quick source of revenue. We have found evidence to back up the RBV standpoint that ESG develops intangible assets with time; governance mechanisms ought to reward patience and long-term planning.
The report supports the fact that good ESG performance correlates with positive views of the brand value and innovation capacity- intangibles which are not necessarily reflected in conventional financial reports. Nevertheless, prior to extrapolating these perceptual signals into expected returns, investors ought to ensure triangulation with more objective data (e.g. ESG ratings, patent filings, market share trends).
To Policymakers: The findings indicate that strategies aimed at encouraging disclosures on ESG and green innovations can encourage investments by companies in intangible assets. However, because our results are perceptually oriented we can say that the effectiveness of policies may also rely on the capacity of firms to convert ESG adherence into credible stakeholder messages and real changes in operations.
5.4. Limitations and Future Research Directions
One of the major drawbacks of the present research is that it makes use of cross-sectional data, which cannot allow making causal conclusions about the ESG - financial performance correlation. While our theoretical model assumes that ESG performance is beneficial to brand value and triggers green innovation, which leads to better financial results, reverse causation can be considered an alternative explanation of the same phenomenon: more financially robust companies could have higher slack resources to spend on ESG programs and green technological innovation. Furthermore, there are unobservable characteristics at the firm level, i.e. the quality of managers, the corporate culture, or the strategic orientation, that can jointly determine ESG involvement as well as financial performance, thus producing spurious relationships that our models cannot completely separate.
Consequently, our results on mediation must be viewed by readers as associative instead of causal. In order to overcome these limitations, future studies ought to use longitudinal frameworks with multi-period data to determine temporal precedence. Promising directions in this direction of research include panel data models, difference-in-difference designs with respect to ESG policy shocks, and exogenous instrument use (e.g., industry-level ESG standards, policy change) as methods to improve causal identification.
Secondly, although we have used objective financial indicators of CSMAR to minimize perceptual bias in the dependent variable, the independent variable (ESG activities) and mediators (brand value, and green innovation) are self-reported by employees and this may also introduce the possibility of common method bias. Even though Harman single-factor test and marker variables checks showed no serious level of bias, it is possible that there was a slight halo effect on the employees of an extremely ESG focused company. It is recommended that future studies consider gathering multi-source data, i.e., customer survey regarding brand value and patent or R&D expenditures regarding green innovation to triangulate what employees think.
Thirdly, despite the fact that our sample represents various industries as well as SMEs, it is restricted to Chinese businesses. The cultural values (collectivism, face-saving) institutional environment and regulatory pressures specific to China can influence the magnitude of the ESG-brand value and ESG-green innovation relationships. We need cross country comparative research in order to check the generalizability of our model.
To sum up, our model concentrates on two major mediators; other possible mechanisms, including attracting/retaining employees, minimizing the cost of capital, risk management, and supply chain relationships, should be considered in a more holistic framework. The interaction between brand value and green innovation (i.e., does green innovation support the brand equity?) is also worth exploring.
6. Conclusions
To sum up, the paper has shown that the positive relationship between ESG practices and financial results is not an easy direct relationship but it is greatly mediated by the development of brand value and the establishment of green innovation. Through establishing a robust and credible brand and developing the ability to innovate environmentally, organizations may successfully convert their ESG principles into better financial results. The present study gives a finer insight into how the value creation mechanism works, which in turn is theoretically and practically useful. With the current growth in the global business landscape moving towards increased sustainability, the capability to handle these two paths strategically will probably become one of the main determinants of long-term corporate success. The results confirm that being beneficial to society and the environment can also mean making money when companies smartly harness their ESG activities to create valuable intangibles and dynamic capabilities to use in the future.
Supplementary Materials
The following supporting information can be downloaded at the website of this paper posted on Preprints.org.
Author Contributions
Conceptualization, H.Y. and R.Z.; methodology, H.Y., R.Z., C.-Y.W. and J.-Y.K.; software, J.-Y.K.; validation, H.Y. and R.Z.; formal analysis, H.Y.; investigation, H.Y. and C.-Y.W.; data curation, J.-Y.K.; writing—original draft preparation, H.Y.; writing—re view and editing, H.Y. and R.Z.; visualization, C.-Y.W.; supervision, H.Y. and R.Z.; project administration, H.Y. and R.Z. All authors have read and agreed to the published version of the manuscript.
Funding
This work was funded by the Department of Education, Heilongjiang Province, grant number YQJH2023177; and funded by Harbin Cambridge University, grant number 2025JQQD01. The APC was funded by the funders.
Institutional Review Board Statement
Not applicable.
Data Availability Statement
The raw data supporting the conclusions of this study will be made available by the authors on reasonable request.
Acknowledgments
The authors would like to thank the anonymous reviewers for their valuable comments and suggestions to improve this manuscript.
Conflicts of Interest
The authors declare no conflicts of interest.
References
- Aguilar-Bolados, H.; Rosales-Charlin, N.; Pérez-Manríquez, C.; Torres-Galan, S.; Dahrouch, M.; Verdejo, R.; Santana, M.H.; Becerra, J. Composites Based on Eucalyptus Nitens Leaves and Natural Rubber as a Valuable Alternative for the Development of Elastomeric Materials with Low Microbiological Impact. POLYMERS 2024, 16, 2215. [Google Scholar] [CrossRef] [PubMed]
- Barney, J. Firm Resources and Sustained Competitive Advantage. J. Manag. 1991, 17, 99–120. [Google Scholar] [CrossRef]
- Friede, G.; Busch, T.; Bassen, A. ESG and Financial Performance: Aggregated Evidence from More than 2000 Empirical Studies. J. Sustain. Financ. Invest. 2015, 5, 210–233. [Google Scholar] [CrossRef]
- Ghardallou, Wafa. Corporate Sustainability and Firm Performance: The Moderating Role of CEO Education and Tenure. Sustainability 2022, 14, 3513. [Google Scholar] [CrossRef]
- Gilchrist, D.; Yu, J.; Zhong, R. The Limits of Green Finance: A Survey of Literature in the Context of Green Bonds and Green Loans. Sustainability 2021, 13, 478. [Google Scholar] [CrossRef]
- Gillan, S. L.; Koch, A.; Starks, L. T. Firms and Social Responsibility: A Review of ESG and CSR Research in Corporate. J. Corp. Financ. 2021, 66, 101889. [Google Scholar] [CrossRef]
- Gutiérrez-Ponce, H.; Chamizo-González, J.; Arimany-Serrat, N. Disclosure of Environmental, Social, and Corporate Governance Information by Spanish Companies: A Compliance Analysis. Sustainability 2022, 14, 3254. [Google Scholar] [CrossRef]
- Hazaea, S.A.; Zhu, J.Y.; Khatib, S.F.A.; Bazhair, A.H.; Elamer, A.A. Sustainability Assurance Practices: A Systematic Review and Future Research Agenda. Environ. Sci. Pollut. Res. 2021, 19, 4843–4864. [Google Scholar] [CrossRef] [PubMed]
- Keller, K.L. Conceptualizing, Measuring, and Managing Customer-Based Brand Equity. J. Mark. 1993, 57, 1–22. [Google Scholar] [CrossRef]
- Lacey, R.; Kennett-Hensel, P.A.; Manolis, C. Is Corporate Social Responsibility a Motivator or Hygiene Factor? Insights into Its Bivalent Nature. J. Acad. Mark. Sci. 2015, 43, 315–332. [Google Scholar] [CrossRef]
- Lai, C. S.; Chiu, C. J.; Yang, C. F.; Pai, D. C. The Effects of Corporate Social Responsibility on Brand Performance: The Mediating Effect of Industrial Brand Equity and Corporate Reputation. J. Bus. Ethics 2010, 95, 457–469. [Google Scholar] [CrossRef]
- Madden; Fehle; Fournier. Brands matter: (2006). An Empirical Demonstration of the Creation of Shareholder Value through Branding. J. Acad. Mark. Sci. 34 224–235. [CrossRef]
- Madden, et al. Place-Making with Form-Based Codes. Urban Land 2006, 65, 174–178. [Google Scholar]
- Parmar, B.L.; Freeman, R.E.; Harrison, J.S.; Wicks, A.C.; Purnell, L.; De Colle, S. Stakeholder Theory: The State of the Art. Acad. Manag. Ann. 4 2010, 403–445. [Google Scholar] [CrossRef]
- Ghisellini, Patrizia; Passaro, Renato; Ulgiati, Sergio. Revisiting Keynes in the Light of the Transition to Circular Economy. Circ. Econ. Sustain. 2021, 1, 143–171. [Google Scholar] [CrossRef] [PubMed]
- Poursoleyman, E.; Nav, A.P.; Mansourfar, G.; Didar, H. How Does Corporate Information Environment Influence CSR? Int. J. Financ. Stud. 13 2025, 131. [Google Scholar] [CrossRef]
- Srivastava, R.K.; Shervani, T.A.; Fahey, L. Market-based Assets and Shareholder Value: A Framework for Analysis. J. Mark. 62 1998, 2–18. [Google Scholar] [CrossRef]
- Shakri, I.H.; Yong, J.M.; Xiang, E.R. Corporate Governance and Firm Performance: Evidence from Political Instability, Political Ideology, and Corporate Governance Reforms in Pakistan. Econ. Polic. 36 2024, 1633–1663. [Google Scholar] [CrossRef]
- Shakina, E.; Barajas, A.; Sánchez-Fernández, P. Revisiting Corporate Universities: Strategic Choices Shaping Performance in Telecom. HELIYON 10 2024, e34314. [Google Scholar] [CrossRef] [PubMed]
- Spence, M. Job market signaling. Q. J. Econ. 87 1973, 355–374. [Google Scholar] [CrossRef]
- Tang, C.Q.; Guo, X.L.; Li, X. ESG and Corporate Performance: The Moderating Role of Government Subsidies and Mediating Effect of Analyst Coverage in Chinese A-share Listed Companies. PLoS ONE 2025, 20, e0322190. [Google Scholar] [CrossRef] [PubMed]
- Wang, R.; Shao, D.; Han, X.L.; Li, Y.Y. Celebrity CEOs, Digital Transformation and Firm Performance in China: the Moderating Role of Controlling Shareholders and Institutional Investors. Front. Psychol. 2023, 14, 1281553. [Google Scholar] [CrossRef] [PubMed]
- Wang, Y.Z.; Cao, X.Z. 2023The Characteristics and Countermeasures of Coupled and Coordinated Development between Technological Innovation and Ecological Environment in China's Gansu Province. PLoS ONE 18, e0290704. [CrossRef] [PubMed]
- Westin, L.; Hallencreutz, J.; Parmler, J. Sustainable Development as a Driver for Customer Experience. Sustain. 14 2022, 3505. [Google Scholar] [CrossRef]
- Whelan, T.; Atz, U.; Van Holt, T.; Clark, C. ESG and Financial Performance: Uncovering the Relationship by Aggregating Evidence from 1,000 Plus Studies Published between 2015-2020; 2021. [Google Scholar]
- Xue, L.Y.; Dong, J.A.; Zha, Y.F. How does Digital Finance Affect Firm Environmental, Social and Governance (ESG) Performance? - Evidence from Chinese Listed Firms. HELIYON 9 2023, e20800. [Google Scholar] [CrossRef] [PubMed]
- Zhang, X.; Zhang, J.X.; Feng, Y.J. Can Companies Get More Government Subsidies through Improving Their ESG Performance? Empirical Evidence from China. PLoS ONE 18 2023, e0292355. [Google Scholar] [CrossRef] [PubMed]
- Zhou, R.; Hou, J.D.; Ding, F. Understanding the Nnexus between Environmental, Social, and Governance (ESG) and Financial Performance: Evidence from Chinese-listed Companies. Environ. Sci. Pollut. Res. 30 2023, 73231–73253. [Google Scholar] [CrossRef] [PubMed]
- Zhu, F.X.; Xu, X.L.; Sun, J.C. The Short Board effect of ESG Rating and Corporate Green Innovation Activities. PLoS ONE 19 2024, e0299795. [Google Scholar] [CrossRef] [PubMed]
- Zhu, N.P.; Aryee, E.N.T.; Agyemang, A.O.; Wiredu, I.; Zakari, A.; Agbadzidah, S.Y. Addressing Environment, Social and Governance (ESG) Investment in China: Does Board Composition and Financing Decision Matter? HELIYON 10 2024, e30783. [Google Scholar] [CrossRef] [PubMed]
Figure 1.
Research model.
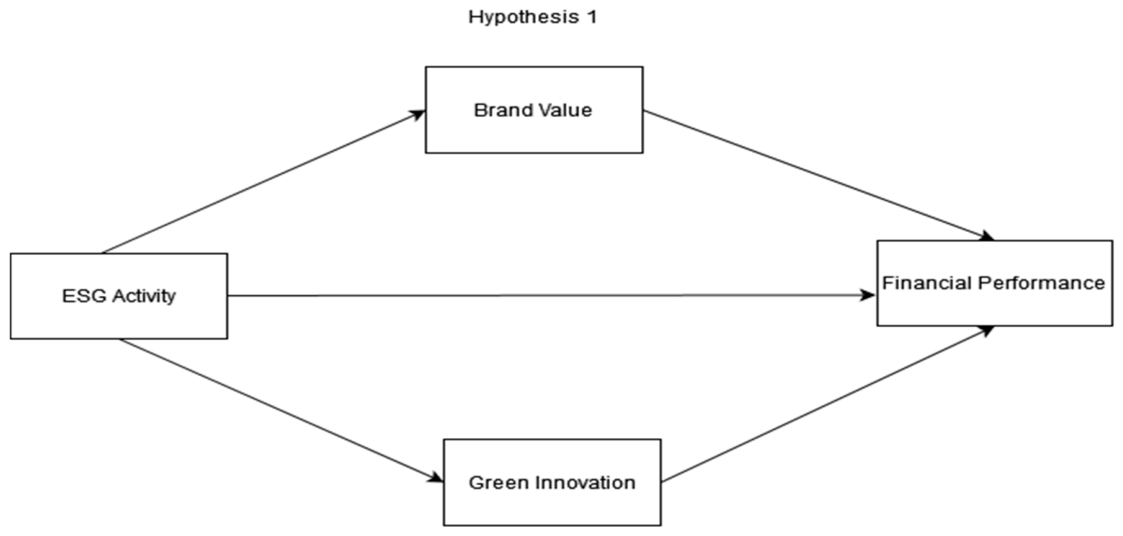

Table 1.
Sample Demographic Characteristics (N=504).
| Characteristic | Category | Frequency | Percentage (%) |
| department | ESG/sustainability | 155 | 30.8 |
| marketing | 104 | 20.6 | |
| R&D | 78 | 15.4 | |
| others | 167 | 33.2 | |
| position | manager/senior manager | 218 | 43.3 |
| deputy manager | 195 | 38.7 | |
| staff/junior level | 91 | 18.0 | |
| company size | SME | 245 | 48.6 |
| large enterprise | 148 | 29.4 | |
| other | 111 | 22.0 | |
| industry | manufacturing | 336 | 66.7 |
| services | 168 | 33.3 |
Table 2.
Heterotrait-Monotrait (HTMT) Ratio Matrix.
| Construct | 1. ESG Activities | 2. Brand Value | 3. Green Innovation | 4. Financial Performance |
| 1. ESG activities | - | |||
| 2. brand value | .682 | - | ||
| 3. green innovation | .635 | .713 | - | |
| 4. financial performance | .587 | .561 | .758 | - |
Note: The values under the diagonal. The critical value to achieve a discriminant validity is < 0.85. These values are all comfortably within this level. It is important to note that the HTMT value between Green Innovation and Financial Performance (.758) is less than the square root of their respective AVEs (0.767 and 0.769) which meets the two discriminant validity criteria. The largest HTMT value is 0.758 between Green Innovation and Financial Performance, which is lower than the 0.85 benchmark of discriminant validity.
Table 3.
Regression Results for Separate ESG Dimensions.
| Path | Coefficient (β) | SE | 95% CI LL | 95% CI UL | p |
| Direct Effects | |||||
| ESG_E → FP | .312 | .042 | .229 | .395 | .000 |
| ESG_S → FP | .187 | .051 | .087 | .287 | .003 |
| ESG_G → FP | .124 | .049 | .028 | .220 | .011 |
| ESG_E → BV | .358 | .039 | .281 | .435 | .000 |
| ESG_S → BV | .224 | .048 | .130 | .318 | .000 |
| ESG_G → BV | .148 | .047 | .056 | .240 | .002 |
| ESG_E → GI | .289 | .045 | .201 | .377 | .000 |
| ESG_S → GI | .121 | .052 | .019 | .223 | .020 |
| ESG_G → GI | .093 | .050 | -.005 | .191 | .063 |
| Indirect Effects | |||||
| ESG_E → BV → FP | .241 | .038 | .169 | .315 | .000 |
| ESG_S → BV → FP | .152 | .036 | .083 | .226 | .000 |
| ESG_G → BV → FP | .098 | .032 | .037 | .163 | .002 |
| ESG_E → GI → FP | .203 | .035 | .136 | .275 | .000 |
| ESG_S → GI → FP | .087 | .031 | .028 | .151 | .004 |
| ESG_G → GI → FP | .062 | .029 | .008 | .123 | .025 |
| Total Effects | |||||
| ESG_E → FP (Total) | .553 | .041 | .473 | .633 | .000 |
| ESG_S → FP (Total) | .274 | .053 | .170 | .378 | .000 |
| ESG_G → FP (Total) | .186 | .050 | .088 | .284 | .000 |
Note: All coefficients are standardized. Bootstrap sample size = 5,000. CI = Confidence Interval.
Table 4.
Comparison of Path Coefficients with and without Common Latent Factor (CLF).
| Path | Original Model (β) | Model with CLF (β) | Difference |
| ESG -> brand value | .502 | .498 | -.004 |
| ESG -> green innovation | .542 | .537 | -.005 |
| brand value -> FP | .423 | .419 | -.004 |
| green innovation -> FP | .481 | .478 | -.003 |
| ESG -> FP (direct) | .321 | .318 | -.003 |
Note: Differences are negligible (<±0.05), indicating CMV does not alter substantive conclusions.
Table 5.
Full Collinearity Assessment (VIF Scores).
| Construct | VIF Score | Threshold (< 3.3) |
| ESG activities | 2.15 | pass |
| brand value | 2.87 | pass |
| green innovation | 2.54 | pass |
| financial performance | 1.24 | pass |
Table 6.
(Robustness Check Results).
| Specification | ESG → FP (c′) | Ind. BV | Ind. GI |
| baseline (Full Sample) | .321*** | .261*** | .213*** |
| controlling for size & industry | .298*** | .247*** | .201*** |
| single-item FP | .312*** | .242*** | .208*** |
Table 7.
Means, Standard Deviations, and Correlations.
| Variable | Mean | SD | 1 | 2 | 3 | 4 |
| 1. ESG activities | 4.06 | 1.18 | 1 | |||
| 2. brand value | 4.15 | 1.08 | 0.630*** | 1 | ||
| 3. green innovation | 4.52 | 0.94 | 0.594*** | 0.654*** | 1 | |
| 4. financial performance | 4.05 | 1.13 | 0.575*** | 0.552*** | 0.809*** | 1 |
Note: Please note that N=217 firms (504 individual respondents combined, mean of 2.32 respondents per firm). The diagonal elements are the square roots of AVE. The RWG value is 0.87, the ICC(1) is 0.33, the ICC(2) is 0.76, and they all satisfy the aggregation criteria. ***p<0.001.
Table 8.
Results of Mediation Analysis (PROCESS Model 4).
| Path | Coefficient (β) | SE | t | p | LLCI | ULCI |
| path coefficients | ||||||
| ESG -> brand value (a1) | 0.502 | 0.039 | 13.020 | < 0.001 | 0.426 | 0.578 |
| ESG -> green innovation (a2) | 0.542 | 0.039 | 13.920 | < 0.001 | 0.466 | 0.618 |
| brand value -> FP (b1) | 0.423 | 0.039 | 10.789 | < 0.001 | 0.347 | 0.500 |
| green innovation -> FP (b2) | 0.481 | 0.039 | 12.333 | < 0.001 | 0.405 | 0.558 |
| ESG -> FP (Direct Effect, c') | 0.321 | 0.039 | 8.240 | < 0.001 | 0.245 | 0.398 |
| ESG -> FP (Total Effect, c) | 0.534 | 0.038 | 14.147 | <0 .001 | 0.460 | 0.608 |
| indirect associations (bootstrapping) | efect | boot SE | boot LLCI | boot ULCI | ||
| ESG -> BV -> FP | 0.261 | 0.041 | 0.183 | 0.346 | ||
| ESG -> GI -> FP | 0.213 | 0.043 | 0.140 | 0.308 | ||
| total indirect effect | 0.474 | 0.045 | 0.387 | 0.562 |
Note: FP=Financial Performance; BV=Brand Value; GI=Green Innovation. Bootstrap sample size is 5000. Confidence Interval percentage is 95%. LLCI/ULCI Lower/Upper Level Confidence Interval. All predictor VIF values were between 1.24 and 2.87 which implies that there were no multicollinearity issues even with relatively high bivariate correlation.
Disclaimer/Publisher’s Note: The statements, opinions and data contained in all publications are solely those of the individual author(s) and contributor(s) and not of MDPI and/or the editor(s). MDPI and/or the editor(s) disclaim responsibility for any injury to people or property resulting from any ideas, methods, instructions or products referred to in the content. |
© 2026 by the authors. Licensee MDPI, Basel, Switzerland. This article is an open access article distributed under the terms and conditions of the Creative Commons Attribution (CC BY) license.
Copyright: This open access article is published under a Creative Commons CC BY 4.0 license, which permit the free download, distribution, and reuse, provided that the author and preprint are cited in any reuse.