

Submitted:
11 August 2026
Posted:
13 August 2026
You are already at the latest version
Abstract
This study explored how rural children cluster in physical activity (PA) profiles and their psychological differences, to inform tailoring PA interventions to different types of children. The primary objective was to identify PA-based profiles, and the secondary objective was to examine the differences in basic psychological needs across profiles. A 1-year exploratory prospective cohort study was conducted with 83 6th-8th grade students from an under-resourced rural middle school. The sport-based PA intervention was implemented by college students in an undergraduate service-learning course. PA was assessed using Axivity AX3 accelerometers, and included light, moderate, vigorous, and total PA minutes/week. Psychological measures included the Basic Psychological Needs Satisfaction and Frustration. K-cluster analysis identified PA profiles based on light, moderate, and vigorous PA levels (minutes/week). Multivariate analysis of variance (MANOVA) assessed profile differences based on (a) needs satisfaction, (b) needs frustration, (c) autonomy, (d) competence, (e) relatedness. Three PA profiles emerged: a Low activity (n=21), Medium activity (n=22), and High activity cluster (n=5). These clusters differed significantly in PA levels (p<0.001). Children differ based on their PA profiles. As such, interventions may be well served to consider tailoring PA interventions to different types of children, based on PA and/or psychological profile differences.
Keywords:
sport-based youth development
; basic psychological needs
; Self-Determination Theory
; rural youth
; cluster analysis
1. Introduction
Physical activity (PA) is vitally important to long-term health, yet the percent of adolescents who meet the PA guidelines is falling [1]. This lack of PA is associated with numerous negative health outcomes (e.g., cardiovascular disease, earlier all-cause mortality, metabolic syndrome, poor mental wellbeing) [1,2]. Modern lifestyle shifts in technological and transportation advancements foster sedentary lifestyles, resulting in less than 30% of adolescents meeting daily PA requirements [2]. These concerns may be particularly pronounced among rural populations due to structural barriers such as limited access to facilities, transportation, and organized programming [3]. Because childhood represents a critical developmental period in which health behaviors are formed, interventions aimed at increasing PA activity during this stage may have long-term benefits [4].
Beyond the external facilitators and barriers of PA, the experience of being physically active is highly individualized. These experiences include variance in motivation, confidence, and enjoyment [5,6]. Differences in psychological characteristics as a result of these experiences influence PA engagement [7]. The variance in psychological characteristics is especially relevant for adolescents as perspectives toward PA establishes the basis for attitudes and behaviors that persist into adulthood [6]. Understanding these psychological differences may help explain why some youth remain active while others do not, and suggests that adolescents may exhibit distinct psychological profiles characterized by motivational processes that support sustained PA engagement.
Because adolescents vary in their experiences of PA, Self-Determination Theory (SDT) may help explain why some youth engage in PA more consistently than others. Basic psychological needs (BPN), a mini-theory within SDT, posits that three needs—autonomy, competence, and relatedness—are essential for optimal functioning and wellbeing. When these needs are satisfied, individuals are more likely to experience autonomous motivation, resilience, and enhanced wellbeing [8,9,10]. Importantly, need frustration is not simply the absence of need satisfaction; rather, it reflects the active thwarting of these three needs within social contexts (e.g., pressure, exclusion, or experiences of incompetence). Such need-thwarting environments can debilitate motivation, diminish resilience, and reduce engagement in activities like PA [8]. As such, BPN theory may provide an effective lens to understand psychological differences across PA profiles. Satisfaction of each of these three needs has been positively associated with PA engagement, whereas need frustration may help explain poorer motivational and behavioral outcomes [11]. Previous research grounded in Self-Determination Theory has consistently shown that satisfaction of the basic psychological needs of autonomy, competence, and relatedness is associated with greater physical activity participation, more autonomous motivation, and improved psychological functioning among adolescents [12,13]. Furthermore, longitudinal evidence suggests that satisfaction of these needs predicts positive changes in autonomous motivation over time, reinforcing their importance in supporting sustained engagement in PA [14]. Thus, examining differences in need satisfaction and frustration across PA profiles may provide a deeper understanding of how psychological needs support or hinder PA engagement.
Despite the knowledge that not all youth experience PA the same, most youth sport research intervenes and explores these relationships at the group level. These analyses may mask meaningful differences between participants. An approach that focuses on the naturally occurring differences within a sample – like cluster analysis – may reveal patterns that are not apparent when observing averages alone. Once these profiles are identified, examining whether they differ in various psychological needs (both satisfaction and frustration) may provide valuable insight into the ways in which psychology differs across different activity patterns [11,15]. Although the BPNs have been linked to PA engagement, little is known about how these needs differ across naturally occurring PA profiles in rural youth.
To examine the way in which psychological characteristics differ across PA profiles, we conducted a 1-year prospective longitudinal study of middle school children in the rural Midwest. The primary objective of the study was to identify child profiles based on differing levels of PA. The secondary objective was to assess how the PA profiles differ on psychological needs. The results of the present study may inform future intervention tailoring efforts among various children's profiles based on their psychological needs.
2. Materials and Methods
2.1. Sample and Setting
A total of 83 children were enrolled in the study. Complete PA data was available for 48 students, and analyses were conducted using completed data. Participants attended a middle school in Greene County, Indiana, which is classified as rural-distant. There were 41 females and 42 males ranging from 6th to 8th grade that participated in the data collection, which was carried out during physical education class in a school setting.
2.1.1. Hoosier Sport
Hoosier Sport is a sport-based youth development program committed to increasing PA levels among rural youth populations. Based at a Midwestern university, the program partners with local school districts to deliver sports-based PA interventions. These interventions, which occur one to two times per week during physical education class, integrate specific sport-based curriculum with life-skill development. The program is facilitated by college students as part of a service-learning course that prepares them to serve as coaches and student role models. Through this course, the college students receive training for program delivery, as well as data collection for this study [16].
2.2. Procedures and Design
Recruitment was conducted via flyers, handouts, and parent emails. Following initial interest, researchers contacted parents to discuss study details and receive verbal consent, then proceeded with completing a PA Readiness Questionnaire (PAR-Q) for their child, as well as submitting a written consent form. Once consent was received, students participated in the first day of the intervention for data collection. Participants completed psychological surveys and fitness assessments in a controlled PE setting, overseen by trained research assistants from the Hoosier Sport implementation team during the pre- and post-intervention time points; additionally, Axivity AX3 (Axivity Ltd, Newcastle, UK) accelerometer data was collected at the midpoint. Further discussion of this design is in Callahan et al. and Kwaiser et al [16,17].
2.3. Measures
2.3.1. Physical Activity
PA levels were assessed across four intensity categories: total PA, light PA, moderate PA, and vigorous PA. The Axivity AX3 is a research-grade, continuous logging triaxial accelerometer designed for PA monitoring. AX3 accelerometers are validated in assessing PA in youth [14]. Activity AX3 was used to assess participants’ PA levels during the previous seven-day period. Total PA scores were calculated using the duration (minutes) and frequency (days) of participation in activities such as sitting, walking, moderate-intensity PA, and vigorous PA.
2.3.2. Psychological Needs Satisfaction and Frustration
Psychological needs satisfaction and frustration were assessed using the BPNs satisfaction and frustration scale (BPNSFS), measures grounded in SDT [11,19]. The following constructs were included in the study: satisfaction of autonomy, relatedness, and competence as well as the frustration of autonomy, relatedness, and competence. Psychological need satisfaction was assessed to evaluate the extent to which the participants experienced fulfillment of the three psychological needs identified in SDT. Psychological need frustration was measured to assess the extent to which participants actively thwart these needs, characterized by feelings of pressure, exclusion, or experiences of incompetence. The autonomy subscale assessed perceptions of personal choice and self-direction. The competence subscale measured feelings of effectiveness and capability. The relatedness subscale evaluated feelings of connection and belonging with others.
2.4. Data Analysis
All statistical analyses were conducted using R Software 4.5.1 [20]. Descriptive statistics, including means, standard deviations, medians, and ranges, were computed for all variables. Variables included total PA, light PA, moderate PA, vigorous PA, psychological need satisfaction, psychological need frustration, autonomy, competence, and relatedness. Pearson correlations were used to examine relationships among study variables. Correlations were categorized as weak, moderate, and strong (r=0.10, 0.30, and 0.50, respectively). Screening procedures were conducted prior to analysis to assess missing data, outliers, and assumptions of normality. Missing data were assumed to be missing at random. Statistical significance was set at p < 0.05 for all analyses.
Cluster analyses were conducted to identify participant profiles based on PA and psychological variables. Variables included in the clustering procedures were total PA, light PA, moderate PA, vigorous PA, psychological need satisfaction, psychological need frustration, autonomy, competence, and relatedness. Prior to clustering, variables were standardized to account for differences in measurement scales. The k-means clustering procedure was conducted to define cluster membership and improve cluster stability, with a cluster number of 3 chosen as the final cluster. Sample size adequacy was evaluated using G*Power. Based on a moderate effect size (Cohen’s f=0.25), an alpha level of 0.05, and statistical power of 0.80, a minimum sample size of 54 participants was required. To account of potential attrition, recruitment efforts targeted at least 60 participants.
A total of 83 participants were enrolled in the study, with 48 children providing baseline PA data for the cluster analysis. A sensitivity analysis was performed using multiple imputation to assign a PA cluster to the excluded students (n=35) from the primary analysis. A total of 42 imputed datasets were analyzed using ANOVA and pooling the results using Rubin’s rules [21]. We conducted a sensitivity analysis and determined that students included in the final sample (n=48) did not differ significantly from excluded students (n=35) on PA or psychological indicators. Descriptive statistics were used to summarize participant characteristics and study variables across clusters. Linear mixed models were conducted to examine differences between clusters on outcomes variables over time. Outcome variables included PA indicators and psychological need variables. Statistical significance was evaluated at an alpha level of p < 0.05. Effect sizes were reported using Cohen’s dz. When significant effects were identified, post-hoc analyses were conducted to determine group differences.
3. Results
3.1. Overall Participant Characteristics
The final sample size had 48 participants from a rural middle school in a Midwestern state. The participant sample was 50.0% (n=24) female. Eighth graders made up the largest percent of the group at 37.5% followed by 6th graders (33.3%) and 7th graders (29.2%). Further breakdown of sample size can be observed in Table 1. Beyond the participant characteristics in Table 1, a correlation between participant PA levels and psychological needs can be seen in Table 2.
3.2. Identification of Physical Activity Profiles
Cluster analysis identified three distinct PA profiles among the 48 participants based on weekly minutes of light, moderate, and vigorous, and total PA. The clusters were characterized as low PA (n=21, 43.7%), moderate PA (n=22, 45.8%), and high PA (n=5, 10.4%).
3.2.1. PA Profiles
Participants in the low PA profile accumulated an average of 146 (SD = 45.8) minutes/week of light PA, 73.2 (32.6) minutes/week of moderate PA, 5.8 (5.5) minutes/week of vigorous PA, and 225 (79.5) minutes of total PA/week. The moderate PA profile participants had a mean of 259 (69.8) minutes/week of light PA, 167 (35.1) minutes/week of moderate PA, 19.9 (8.81) minutes of vigorous PA/week, and an overall of 446 (90.3) minutes of PA/week. The high PA profile cluster logged an average of 197 (37.5) minutes/week of light PA, 184 (44.6) minutes/week of moderate PA, 67 (18.1) minutes/week of vigorous PA, and 447 (82.8) minutes total of PA/week. Mean values for each PA intensity and total PA across the three profiles are presented in Figure 1.
3.3. Psychological Differences Across Physical Activity Profiles
3.3.1. Needs Satisfaction
A linear mixed model was conducted to determine differences in competence, autonomy, and relatedness satisfaction across the PA clusters (low, moderate, high) and timepoints (pre, mid, post). Overall, there were no significant effects of PA clusters on needs satisfaction. Despite the lack of statistically significant effects, descriptive trends indicated slight increases over time in all three psychological needs. As seen in Table 1, mean scores for competence, autonomy, and relatedness satisfaction all increased.
A noticeable finding emerged for relatedness and competence satisfaction, where a significant relationship was found between the high PA cluster and the mid timepoint (p = 0.043, 0.004, respectively). This indicates a temporary increase in relatedness and competence for participants in the high activity cluster at mid-intervention compared to pre-intervention. No other significant relationships were found between the PA clusters and needs satisfaction variables.
3.3.2. Needs Frustration
To determine patterns of psychological need frustration, a linear mixed model test was conducted examining competence, autonomy, and relatedness frustration across PA clusters (low, moderate, high) and timepoints (pre, mid, post). Overall, frustration levels did not significantly differ by PA cluster; however, trends and time-based changes were observed. Competence frustration was generally lowest in the high PA cluster but showed an increasing trend over time, becoming comparatively higher by the post timepoint. Similarly, relatedness frustration was initially lowest in the high PA cluster, suggesting more favorable social experiences among more active participants at baseline.
Timepoint was found to be significantly associated with relatedness frustration (p = 0.036), indicating that frustration levels shifted across the pre, mid, and post timepoints but independent of PA cluster.
4. Discussion
This study’s findings expand upon previous research aimed at tailoring PA interventions through the identification of distinct PA and psychological profiles of youth [9,15]. The main objectives were to identify these youth profiles based on different levels of PA and psychological needs and assess how the profiles differed on psychological patterns. There were three key findings: (1) three distinct PA profiles emerged, (2) need satisfaction demonstrated more significant profile-specific associations than need frustration, and (3) need frustration changed across timepoints. Collectively, these findings suggest that considering naturally occurring differences in PA and psychological needs may help inform more tailored approaches to youth PA.
The first key finding was that three distinct PA profiles emerged among rural middle school adolescents. Specifically, adolescents clustered into low, moderate, and high PA profiles based on their overall weekly PA patterns. These findings reinforce that rural adolescents are a heterogeneous population suggesting that future interventions may benefit from considering these differences during intervention design. Similar observations have been reported previously in a recent study who found that participants with lower baseline PA responded more favorably to a school-based intervention than their more active peers [22]. Although cluster analysis was not the statistical means used, their findings suggest that PA interventions may be most effective when they account for differences in activity levels among youth. The present study extends past work by identifying three distinct PA profiles among rural middle school students in the Midwest, whereas others examined adolescents attending Norwegian schools participating in large-scale PA intervention [22]. Together, these findings highlight the importance of recognizing differences in youth PA behaviors that may provide a foundation for designing interventions that address the needs of different youth rather than assuming a one-size-fits-all approach. For example, future interventions could consider adapting opportunities across the interventions that support autonomy, competence, and relatedness according to participants’ baseline PA patterns.
The second key finding of our study was that need satisfaction demonstrated greater evidence of profile-specific differences than need frustration. A significant positive difference was found within the highest PA group at midpoint for both relatedness and competence satisfaction. However, the highest PA group did not show overall significant differences across all timepoints. This relative stability is consistent with previous research which demonstrates that individuals naturally segment into distinct, stable motivational clusters that resist sample-wide changes over time [23]. This baseline stability may suggest that youth enter sport programs with different prior experiences and motivational orientations that influence how they respond to programming. Thus, a one-size-fits-all approach may not fully address the differing needs of rural youth. The emergence of relatedness and competence differences at midpoint may suggest that these psychological experiences become more salient as youth participate in the intervention. If psychological needs fluctuate through participation, future interventions may benefit from considering when different types of motivational support are provided. This gradual development may suggest that future interventions consider how psychological needs evolve across participation and adapt to meet youth where they are in their development. These adaptations throughout a program are supported by previous literature indicating that midpoint competence and relatedness satisfaction serve as critical drivers for later developmental outcomes [24]. This study similarly applied SDT to measure the effectiveness of physical education classes for middle school students. Together, these findings suggest that competence and relatedness may be particularly meaningful psychological experiences during PA participation, although future studies are needed to better understand how these relationships develop over time.
Independent of PA groups, timepoint showed significant association with relatedness frustration, implying that frustration levels shifted across the pre, mid, and post timepoints. Although needs frustration did not differ significantly across PA profiles, the observed changes across timepoints suggest that frustration may be more sensitive to temporal or contextual influences than to baseline activity level. When needs frustration is experienced, it opposes the sense of autonomy, competence, and relatedness, while diminishing confidence and motivation within PA. The active thwarting of satisfaction by needs frustration makes it particularly relevant for understanding changes in motivation and engagement during PA interventions. Fluctuations in needs frustration (regardless of which psychological needs) may be reflective of environmental or developmental changes. Namely, middle school is a time of significant developmental changes with the onset of puberty and navigating new socioemotional experiences [20]. These changes may result in wavering needs frustration [25]. It is possible that this instability in relatedness frustration may impact youth perception of competence and autonomy within various relationships as well [26]. Future studies may benefit from examining day-to-day variability in psychological needs frustration across adolescence to better understand how developmental and contextual experiences influence motivational processes [25].
This study included three primary limitations. First, only 48 of the 83 participants completed the baseline PA portion of this study, which reduced the overall sample size and limited the ability to detect statistically significant trends among equal clusters. To address this limitation, analyses were conducted using participants with complete data, with sensitivity analyses performed to evaluate the influence of missing data. Although the smaller sample size and varied cluster sizes limited results, the findings still revealed emerging patterns that highlighted the potential importance of tailoring PA interventions for students. Additionally, despite the sample being small, the use of cluster analysis is recommended as an exploratory technique, which is a valuable method during this stage of research. A second limitation of this study is that the psychological measures for both satisfaction and frustration were assessed using self-report measures. As with all self-perceived scales, these measures introduce the potential for response bias, as participants may interpret and report their experiences in different ways. Third, the sample of this study is composed of predominantly white youth from the Midwest, which reflects the demographic context of the school district; however, the lack of diversity restricts the generalizability of the results. This can make it difficult to apply the results to different racial or ethnic backgrounds, and while the sample limits generalizability, it provides a baseline understanding of this specific demographic and can serve as a comparison point for future studies. Taken together, the overall findings of this study provide preliminary evidence that recognizing naturally occurring differences in PA and psychological needs may represent a promising direction for designing future youth PA interventions.
Author Contributions
JK: Data curation, Formal Analysis, Writing – original draft, Writing – review & editing, Supervision. MM: Data curation, Formal Analysis, Visualization, Writing – original draft, Writing – review & editing. SH: Data Curation, Writing – original draft, Writing – reviewing & editing. BO: Data Analysis, Resources, Writing – original draft, Writing – reviewing & editing. KK: Conceptualization, Supervision, Formal Analysis, Methodology, Software, Visualization, Writing – original draft, Writing – review & editing. VMK: Conceptualization, Methodology, Resources, Supervision, Writing – reviewing & editing.
Funding
This research was funded by the American Heart Association (award ID: 24CDA1038890).
Institutional Review Board Statement
The Indiana University Institutional Review Board approved the study protocol (#24272).
Informed Consent Statement
Informed consent was obtained from all subjects involved in the study. Assent was received from all adolescent participants following informed consent being obtained from their legal guardian.
Data Availability Statement
All data generated or analyzed during this study are included in this published article.
Conflicts of Interest
The authors declare no conflicts of interest. The funders had no role in the design of the study; in the collection, analyses, or interpretation of data; in the writing of the manuscript; or in the decision to publish the results.
Abbreviations
The following abbreviations are used in this manuscript:
| PA | Physical Activity |
| MANOVA | Multivariate analysis of variance |
| SDT | Self-Determination Theory |
| BPN | Basic Psychological Needs |
| PAR-Q | PA Readiness Questionnaire |
| PE | Physical Education |
| ANOVA | Analysis of Variance |
References
- Increase the Proportion of Adolescents Who Do Enough Aerobic and Muscle-Strengthening Activity — Data - Healthy People 2030 | Odphp.Health.Gov. Available online: https://odphp.health.gov/healthypeople/objectives-and-data/browse-objectives/physical-activity/increase-proportion-adolescents-who-do-enough-aerobic-and-muscle-strengthening-activity-pa-08/data (accessed on 19 June 2026).
- Neil-Sztramko, S.E.; Caldwell, H.; Dobbins, M. School-Based Physical Activity Programs for Promoting Physical Activity and Fitness in Children and Adolescents Aged 6 to 18. Cochrane Database Syst. Rev. 2021, 9, CD007651. [Google Scholar] [CrossRef] [PubMed]
- Ostermeier, E.; Gilliland, J.; Irwin, J.D.; Seabrook, J.A.; Tucker, P. Developing Community-Based Physical Activity Interventions and Recreational Programming for Children in Rural and Smaller Urban Centres: A Qualitative Exploration of Service Provider and Parent Experiences. BMC Health Serv. Res. 2024, 24, 1017. [Google Scholar] [CrossRef] [PubMed]
- Telama, R. Tracking of Physical Activity from Childhood to Adulthood: A Review. Obes. Facts 2009, 2, 187–195. [Google Scholar] [CrossRef] [PubMed]
- Chung, K.; Cabral, M.; Ntoumanis, N.; Vazou, S. A Systematic Scoping Review of Peer Motivational Climate in Youth Sports and Physical Activity: A Bi-Decennial Update. Front. Psychol. 2026, 17. [Google Scholar] [CrossRef] [PubMed]
- Martins, J.; Costa, J.; Sarmento, H.; Marques, A.; Farias, C.; Onofre, M.; Valeiro, M.G. Adolescents’ Perspectives on the Barriers and Facilitators of Physical Activity: An Updated Systematic Review of Qualitative Studies. Int. J. Environ. Res. Public. Health 2021, 18. [Google Scholar] [CrossRef] [PubMed]
- Babic, M.J.; Morgan, P.J.; Plotnikoff, R.C.; Lonsdale, C.; White, R.L.; Lubans, D.R. Physical Activity and Physical Self-Concept in Youth: Systematic Review and Meta-Analysis. Sports Med. 2014, 44, 1589–1601. [Google Scholar] [CrossRef] [PubMed]
- Vansteenkiste, M.; Ryan, R.M. On Psychological Growth and Vulnerability: Basic Psychological Need Satisfaction and Need Frustration as a Unifying Principle. J. Psychother. Integr. 2013, 23, 263–280. [Google Scholar] [CrossRef]
- Matias, T.S.; de Jesus, E.E.D.; Andrade, A. Clusters of Psychological Needs and Motivational Profiles in School Physical Education and Their Impacts on Adolescents’ Mental Health. Rev. Bras. Atividade Física E Saúde 2025, 30, e0389. [Google Scholar] [CrossRef]
- Leisterer, S.; Gramlich, L. Having a Positive Relationship to Physical Activity: Basic Psychological Need Satisfaction and Age as Predictors for Students’ Enjoyment in Physical Education. Sports 2021, 9, 90. [Google Scholar] [CrossRef] [PubMed]
- Chen, B.; Vansteenkiste, M.; Beyers, W.; Boone, L.; Deci, E.L.; Van der Kaap-Deeder, J.; Duriez, B.; Lens, W.; Matos, L.; Mouratidis, A.; et al. Basic Psychological Need Satisfaction, Need Frustration, and Need Strength across Four Cultures. Motiv. Emot. 2014, 39, 216–236. [Google Scholar] [CrossRef]
- Sebire, S.J.; Jago, R.; Fox, K.R.; Edwards, M.J.; Thompson, J.L. Testing a Self-Determination Theory Model of Children’s Physical Activity Motivation: A Cross-Sectional Study. Int. J. Behav. Nutr. Phys. Act. 2013, 10, 111. [Google Scholar] [CrossRef] [PubMed]
- Ciydem, E.; Avci, D.; Uyar, M.; Seyhan, A. The Relationship between Basic Psychological Needs and Emotional and Behavioral Problems in Middle School Students. J. Child Adolesc. Psychiatr. Nurs. 2023, 36, 179–187. [Google Scholar] [CrossRef] [PubMed]
- Yun, S.; Jaakkola, T.; Huhtiniemi, M.; Gråstén, A.; Park, J.; Yli-Piipari, S. Psychological Needs Satisfaction in Physical Education Predicts a Positive Development of Motivation in Early Adolescence: A Latent Growth Modeling Study. Eur. Phys. Educ. Rev. 2025, 31, 295–313. [Google Scholar] [CrossRef]
- Laxer, R.E.; Brownson, R.C.; Dubin, J.A.; Cooke, M.; Chaurasia, A.; Leatherdale, S.T. Clustering of Risk-Related Modifiable Behaviours and Their Association with Overweight and Obesity among a Large Sample of Youth in the COMPASS Study. BMC Public Health 2017, 17, 102. [Google Scholar] [CrossRef] [PubMed]
- Kwaiser, M.M.; Medellin, A.M.; Watkins, J.M.; Goss, J.M.; Hobson, J.M.; Kercher, V.M.M.; Kercher, K.A. Evaluation of a Pilot College Student-Based Physical Activity Implementation Strategy in a Rural Middle School. Int. J. Environ. Res. Public. Health 2024, 21. [Google Scholar] [CrossRef] [PubMed]
- Callahan, S.H.; King, J.F.; Ortyl, B.K.; Cumming, N.G.; Watkins, J.M.; Goss, J.M.; Martinez Kercher, V.M.; Kercher, K.A. Feasibility and Physical Health Outcomes of a 1-Year Sport-Based Physical Activity Intervention in Rural Middle School Children. BMC Sports Sci. Med. Rehabil. 2026, 18, 56. [Google Scholar] [CrossRef] [PubMed]
- Hedayatrad, L.; Stewart, T.; Duncan, S. Concurrent Validity of ActiGraph GT3X+ and Axivity AX3 Accelerometers for Estimating Physical Activity and Sedentary Behavior. J. Meas. Phys. Behav. 2021, 4, 1–8. [Google Scholar] [CrossRef]
- Deci, E.L.; Ryan, R.M. Intrinsic Motivation and Self-Determination in Human Behavior; Springer US: Boston, MA, 1985; ISBN 978-1-4899-2273-1. [Google Scholar]
- R Core Team R: A Language and Environment for Statistical Computing. 2025.
- Austin, P.C.; White, I.R.; Lee, D.S.; Buuren, S. van Missing Data in Clinical Research: A Tutorial on Multiple Imputation. [CrossRef] [PubMed]
- Grydeland, M.; Bergh, I.H.; Bjelland, M.; Lien, N.; Andersen, L.F.; Ommundsen, Y.; Klepp, K.-I.; Anderssen, S.A. Intervention Effects on Physical Activity: The HEIA Study - a Cluster Randomized Controlled Trial. Int. J. Behav. Nutr. Phys. Act. 2013, 10, 17. [Google Scholar] [CrossRef] [PubMed]
- Friederichs, S.A.; Oenema, A.; Bolman, C.; Lechner, L. Long Term Effects of Self-Determination Theory and Motivational Interviewing in a Web-Based Physical Activity Intervention: Randomized Controlled Trial. Int. J. Behav. Nutr. Phys. Act. 2015, 12, 101. [Google Scholar] [CrossRef] [PubMed]
- Cronin, L.; Marchant, D.; Johnson, L.; Huntley, E.; Kosteli, M.C.; Varga, J.; Ellison, P. Life Skills Development in Physical Education: A Self-Determination Theory-Based Investigation across the School Term. Psychol. Sport Exerc. 2020, 49, 101711. [Google Scholar] [CrossRef]
- Liu, X.; Zhang, Y.; Zeng, J.; Lu, Z.; Liu, Y. Developmental Trajectories of Basic Psychological Need Frustration in Early and Middle Adolescence and Their Associations with Mental Health. J. Youth Adolesc. 2026, 55, 1560–1576. [Google Scholar] [CrossRef] [PubMed]
- Chen, L.; Xia, M. Adolescent Psychological Adaptation: The Impact of Daily Levels and Instability in Psychological Need Satisfaction and Frustration. J. Adolesc. 2025, 97, 1272–1283. [Google Scholar] [CrossRef] [PubMed]
Figure 1.
PA Profiles and Average Minutes of PA per Intensity.
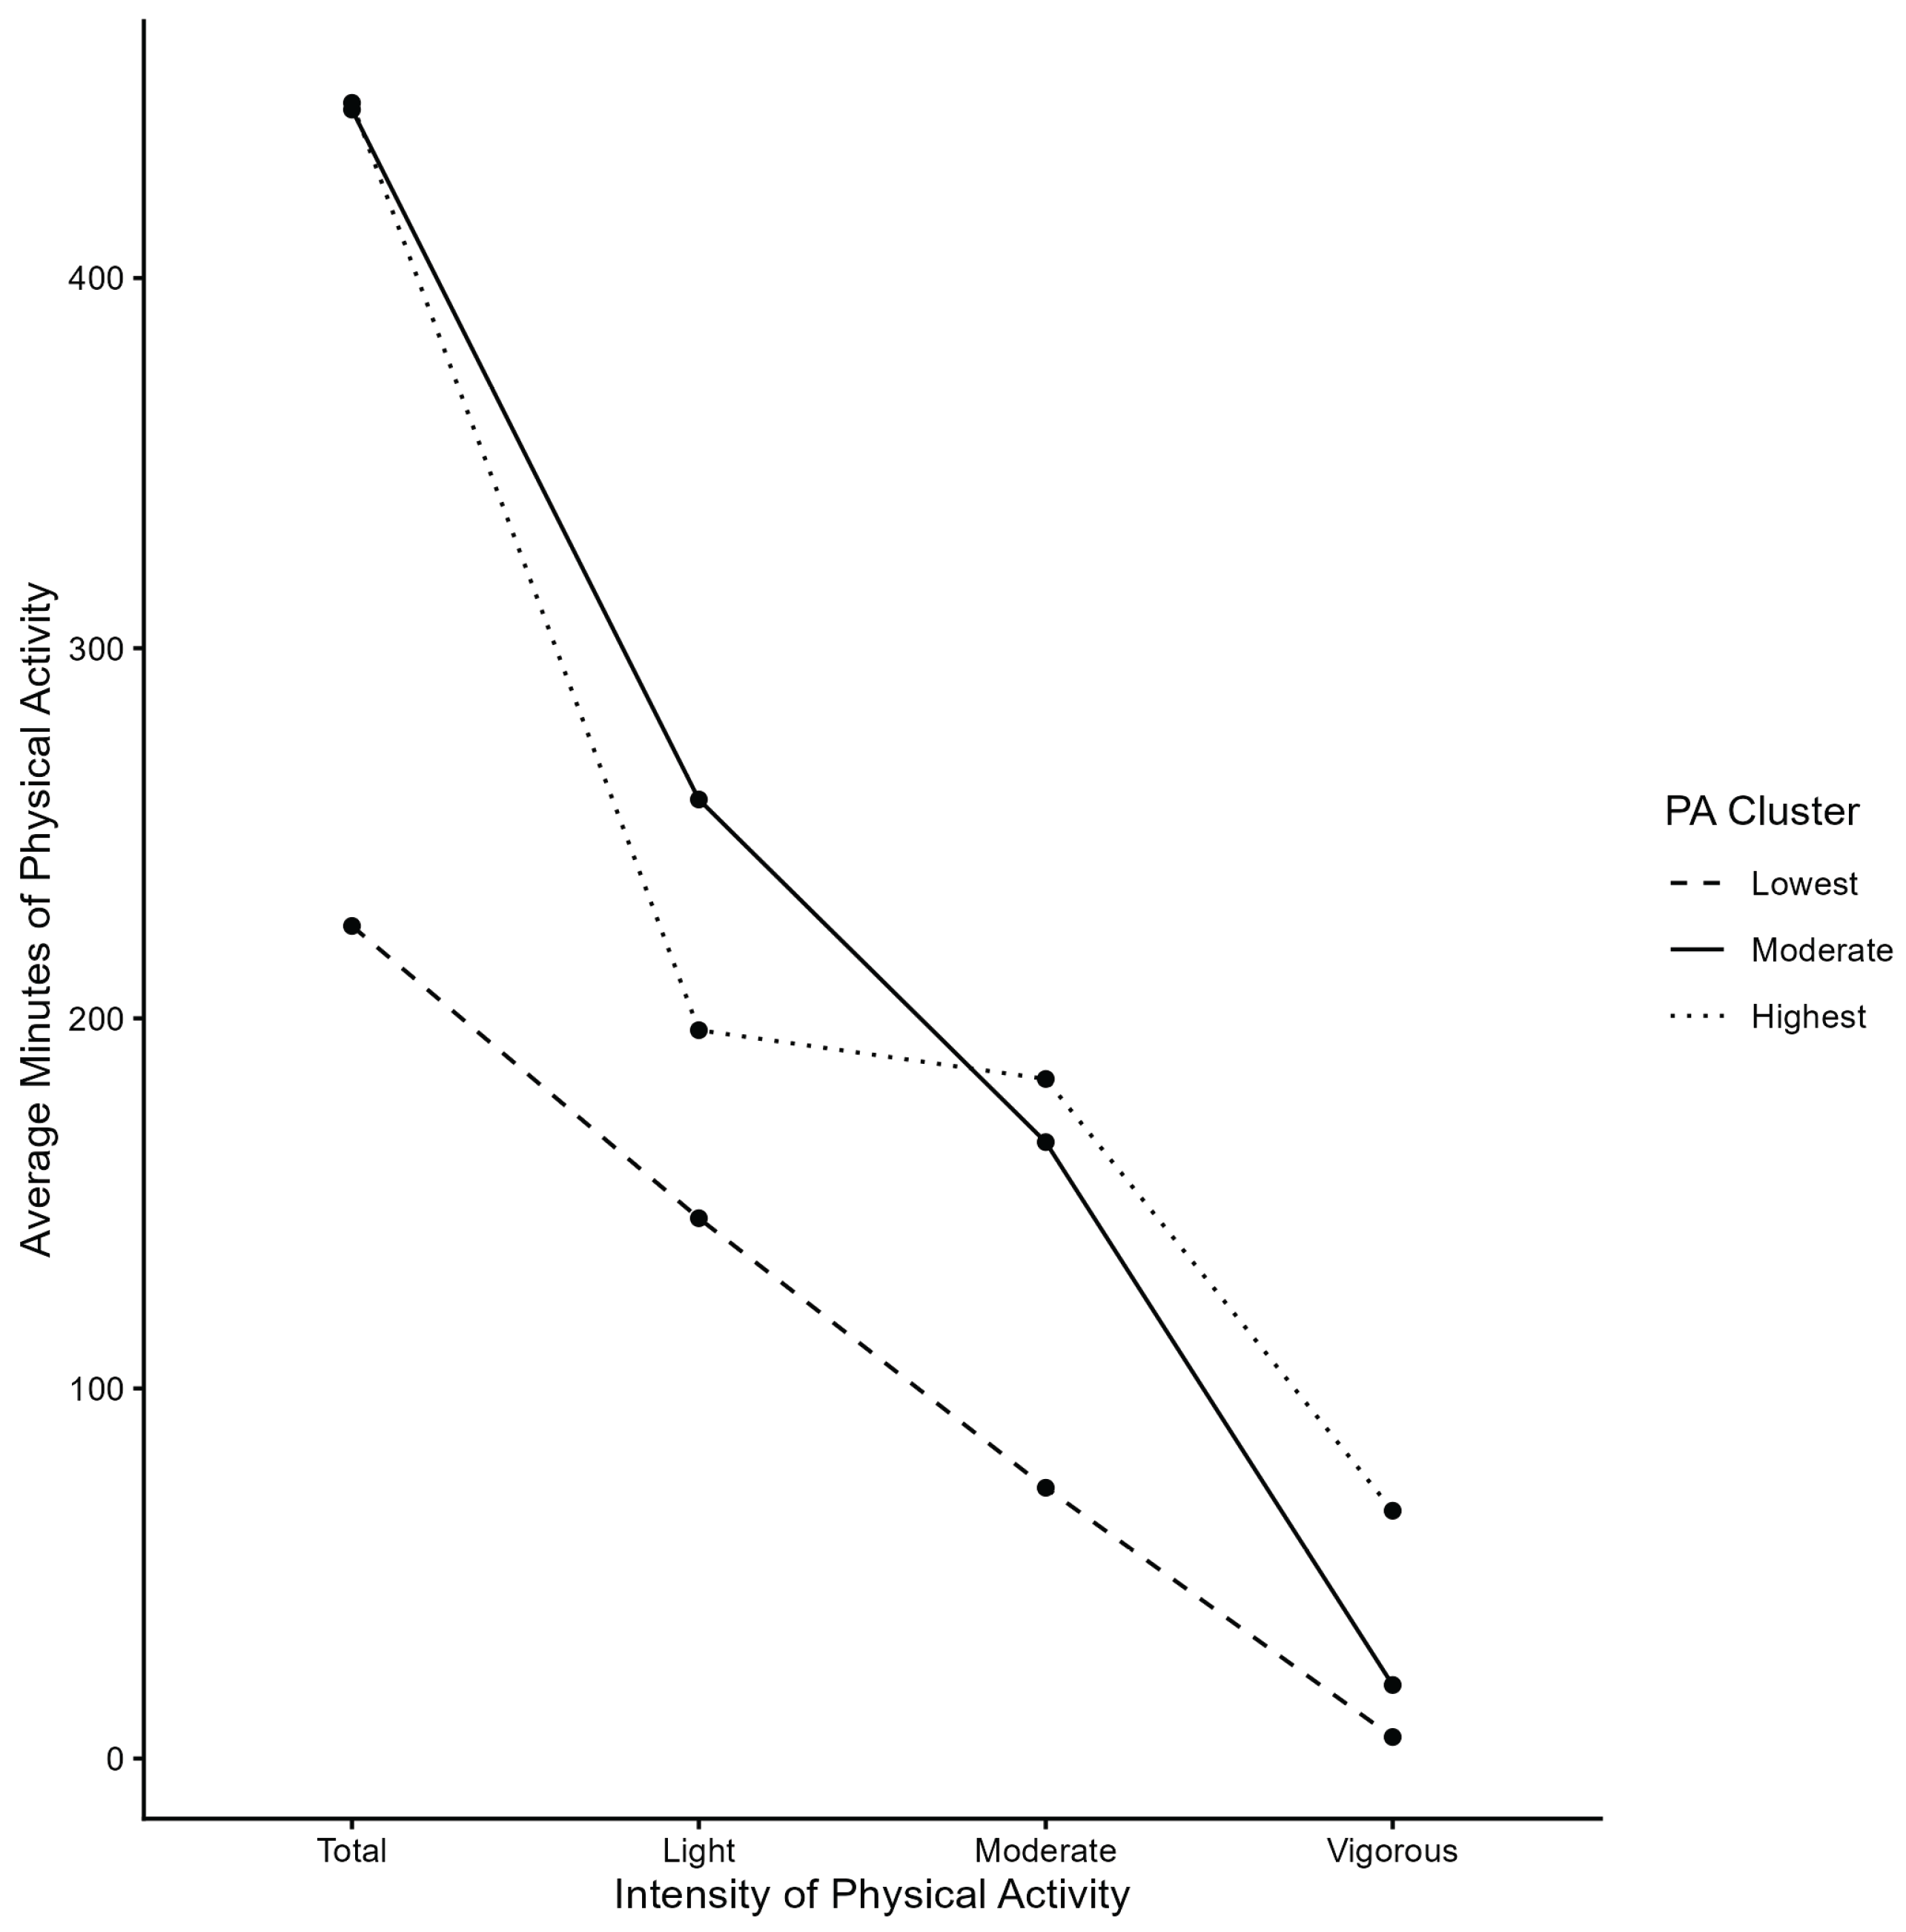

Table 1.
Participant Characteristics Summary.
| Lowest (n=21) |
Moderate (n=22) |
Highest (n=5) |
Overall (N=48) |
|||||
|---|---|---|---|---|---|---|---|---|
| Demographic Characteristics | ||||||||
| Gender, n (%) | ||||||||
| Boy | 7 (33.3%) | 12 (54.5%) | 5 (100%) | 24 (50.0%) | ||||
| Girl | 14 (66.7%) | 10 (45.5%) | 0 (0%) | 24 (50.0%) | ||||
| Grade, n (%) | ||||||||
| 6th Grade | 4 (19.0%) | 10 (45.5%) | 2 (40.0%) | 16 (33.3%) | ||||
| 7th Grade | 7 (33.3%) | 7 (31.8%) | 0 (0%) | 14 (29.2%) | ||||
| 8th Grade | 10 (47.6%) | 5 (22.7%) | 3 (60.0%) | 18 (37.5%) | ||||
| Psychological Variables | ||||||||
| Satisfaction | Pre | Post | Pre | Post | Pre | Post | Pre | Post |
| Relatedness | 15.8 (2.79) | 16.2 (2.70) | 15.5 (3.43) | 15.9 (3.26) | 13.4 (7.92) | 16.4 (5.37) | 15.4 (3.80) | 16.1 (3.23) |
| Competence | 14.8 (3.27) | 15.9 (2.78) | 15.9 (2.96) | 16.4 (3.53) | 12.6 (7.77) | 15.4 (5.41) | 15.0 (3.82) | 16.1 (3.40) |
| Autonomy | 15.9 (2.23) | 16.5 (2.34) | 16.2 (3.18) | 16.7 (3.19) | 13.2 (7.82) | 15.8 (5.50) | 15.8 (3.56) | 16.5 (3.11) |
| Frustration | Pre | Post | Pre | Post | Pre | Post | Pre | Post |
| Relatedness | 7.14 (2.57) | 8.11 (3.80) | 7.32 (3.00) | 9.37 (3.34) | 4.80 (3.27) | 8.00 (4.64) | 6.98 (2.88) | 8.65 (3.66) |
| Competence | 9.67 (3.71) | 9.79 (3.85) | 8.86 (3.75) | 9.63 (3.65) | 7.00 (5.24) | 8.80 (4.60) | 9.02 (3.88) | 9.60 (3.77) |
| Autonomy | 8.10 (2.79) | 8.47 (2.55) | 7.55 (4.77) | 9.00 (3.07) | 6.40 (4.72) | 8.80 (3.90) | 7.67 (3.95) | 8.74 (2.89) |
Table 2.
Correlations of physical activity and psychological needs.
| Characteristics/Variables | 1. | 2. | 3. | 4. | 5. | 6. | 7. | 8. | 9. | 10. | 11. | 12. |
| PA Levels | ||||||||||||
| 1. Total | 1.0 | 0.92 | 0.94 | 0.51 | -0.21 | -0.07 | -0.20 | -0.13 | -0.34 | -0.10 | -0.25 | -0.15 |
| 2. Light | - | 1.0 | 0.76 | 0.23 | -0.12 | 0.09 | -0.09 | -0.08 | -0.33 | 0.01 | -0.20 | 0.00 |
| 3. Moderate | - | - | 1.0 | 0.56 | -0.27 | -0.21 | -0.26 | -0.16 | -0.32 | -0.14 | -0.28 | -0.25 |
| 4. Vigorous | - | - | - | 1.0 | -0.17 | -0.21 | -0.26 | -0.09 | -0.13 | -0.29 | -0.15 | -0.29 |
| Psychological Needs | ||||||||||||
| 5.Autonomy Satisfaction | - | - | - | - | 1.0 | 0.26 | 0.17 | 0.80 | 0.66 | 0.14 | 0.91 | 0.23 |
| 6.Autonomy Frustration | - | - | - | - | - | 1.0 | 0.69 | 0.14 | 0.07 | 0.46 | 0.17 | 0.87 |
| 7.Competence Frustration | - | - | - | - | - | - | 1.0 | 0.17 | 0.25 | 0.57 | 0.22 | 0.90 |
| 8.Competence Satisfaction | - | - | - | - | - | - | - | 1.0 | 0.65 | 0.13 | 0.91 | 0.18 |
| 9.Relatedness Satisfaction | - | - | - | - | - | - | - | - | 1.0 | 0.08 | 0.86 | 0.16 |
| 10.Relatedness Frustration | - | - | - | - | - | - | - | - | - | 1.0 | 0.13 | 0.76 |
| 11.Needs Satisfaction | - | - | - | - | - | - | - | - | - | - | 1.0 | 0.21 |
| 12.Needs Frustration | - | - | - | - | - | - | - | - | - | - | - | 1.0 |
Note. *PA = objective physical activity measures based on minutes/week.
Disclaimer/Publisher’s Note: The statements, opinions and data contained in all publications are solely those of the individual author(s) and contributor(s) and not of MDPI and/or the editor(s). MDPI and/or the editor(s) disclaim responsibility for any injury to people or property resulting from any ideas, methods, instructions or products referred to in the content. |
© 2026 by the authors. Licensee MDPI, Basel, Switzerland. This article is an open access article distributed under the terms and conditions of the Creative Commons Attribution (CC BY) license (http://creativecommons.org/licenses/by/4.0/).
Copyright: This open access article is published under a Creative Commons CC BY 4.0 license, which permit the free download, distribution, and reuse, provided that the author and preprint are cited in any reuse.