

Submitted:
12 August 2026
Posted:
12 August 2026
You are already at the latest version
Abstract
Aberrant systemic IgG responses to the gut microbiota may be implicated in the pathogenesis of ulcerative colitis (UC). In this study, we investigated IgG-targeted bacteria and their predicted functional characteristics in UC. Using fecal samples and autologous sera from 37 patients with UC and 4 healthy controls, we profiled IgG-targeted bacteria under in vitro conditions using 16S rRNA gene sequencing. To correct for background bacterial abundance, we calculated the IgG+ Probability Score (IPS), which integrates the sample-specific IgG-binding rate to isolate taxa explicitly targeted by IgG. Systemic IgG responses were selectively targeted at specific bacterial taxa rather than uniformly directed toward the entire gut microbiota. Active UC and elevated systemic inflammatory markers were associated with increased IPS in oral-associated commensals, including Granulicatella, as well as mucin-degrading taxa. Functional profiling indicated the enrichment of pathways related to host-derived mucin degradation, capsular polysaccharide biosynthesis, and amino acid biosynthesis. Furthermore, Random Forest machine learning models utilizing optimized IPS features achieved an area under the curve of 0.817 for predicting UC exacerbation and 0.843 for predicting C-reactive protein elevation. In conclusion, systemic IgG responses in UC were selectively directed toward specific bacterial taxa associated with disease activity and systemic inflammation. Analyzing the IgG-targeted microbiota via IPS profiling deepens our understanding of host-microbiota interactions in UC and provides a valuable framework for evaluating immune-targeted bacteria that fluctuate across different disease phases.
Keywords:
IgG+ probability score
; ulcerative colitis
; gut microbiota
; 16S rRNA gene analysis
1. Introduction
Inflammatory bowel disease (IBD) is a refractory condition characterized by chronic inflammation of the intestinal mucosa, with alternating periods of relapse and remission. Its pathogenesis is considered to be multifactorial, involving aberrant host immune responses to changes in the gut microbiota (dysbiosis), driven by genetic predisposition and environmental factors such as diet, smoking, and stress [1]. The prevalence of ulcerative colitis (UC), a major phenotype of IBD, continues to increase globally [2,3,4]. In Japan, over 310,000 patients were reported as of 2023, representing a critical public health issue [5]. Current therapeutic strategies primarily focus on inducing and maintaining remission using 5-aminosalicylic acid, corticosteroids, immunosuppressants, and biologics; however, a curative treatment has yet to be established [6,7].
The disruption of the intestinal mucosal barrier is deeply implicated in the pathophysiology of UC [8,9]. Compromised barrier function facilitates the approximation and translocation of luminal bacteria into the mucosa, thereby inducing excessive inflammatory responses. This mucosal fragility is closely associated with structural and functional abnormalities of the gut microbiota. More recently, the relationship between the oral and gut microbiota, known as the oral–gut axis, has attracted considerable attention. Hajishengallis et al. reported that oral-derived bacteria can migrate to the gut via saliva and establish ectopic colonization, potentially contributing to intestinal inflammation and endotoxemia [10,11]. Moreover, periodontitis and IBD are considered to share a common pathophysiological foundation as chronic inflammatory diseases [12,13], and a growing body of evidence supports their epidemiological and immunological associations [14,15,16,17,18,19,20,21,22].
The breakdown of intestinal mucosal homeostasis is accompanied by dramatic alterations in humoral immune responses against the gut microbiota. In the healthy gut, secretory IgA plays a pivotal role in the compartmentalization of luminal bacteria and the maintenance of mucosal homeostasis [23,24,25,26]. Conversely, in UC, the collapse of this immune tolerance leads to aberrant IgA and IgG responses targeting the commensal microbiota. It is well documented that the proportion of IgA- and IgG-coated bacteria in the feces of IBD patients significantly increases during the active phase compared to remission [27]. Furthermore, flow cytometric analyses of fecal samples from IBD patients have demonstrated that the expansion of these IgA- and IgG-coated bacterial populations dynamically correlates with disease severity and clinical course [28]. In particular, the potential involvement of bacteria targeted by systemic IgG responses in IBD pathogenesis has become a major focus of interest. In UC patients, specific IgG responses to commensal bacteria are markedly enhanced, and the resulting IgG-bacteria immune complexes drive pro-inflammatory cytokine production and Th17 responses via macrophage Fcγ receptors [29]. Additionally, IgG-coated bacteria are characteristically observed in IBD patients, and the proportion of bacteria coated by specific IgG subclasses positively correlates with disease activity [30]. These findings suggest that IgG-coated bacteria are not merely a byproduct of barrier dysfunction but actively drive the inflammatory process itself.
Recent advances in IgG-seq technology have enabled the comprehensive profiling of antibody-targeted bacterial populations. Studies utilizing this approach have revealed that IBD patients exhibit pronounced serum IgG responses against specific gut bacterial genera [31]. Moreover, profiling the systemic antimicrobial IgG repertoire has successfully identified specific bacterial taxa capable of breaching the intestinal barrier and translocating into tissues (translocators) [32]. These reports underscore that analyzing bacterial targets of systemic IgG provides crucial insights into host-microbe interactions in IBD.
However, comprehensive analyses of antibody-coated bacteria, including conventional IgG-seq, remain susceptible to confounding by bacterial abundance. When evaluating only the relative abundance within the IgG-bound fraction, highly prevalent taxa that simply increase during inflammation may be overestimated, regardless of their true affinity for IgG [33]. Consequently, the importance of normalization using unfractionated (input) samples to correct for this abundance bias has been advocated [34]. Recently, Jackson et al. and Olm et al. have also highlighted the necessity of incorporating pre-sorted input fractions into downstream analyses [33,35]. These approaches serve as highly valuable frameworks for assessing the relative enrichment of taxa within the IgG-bound fraction while mitigating the influence of dominant commensals in the gut environment [36].
In the present study, we profiled bacterial populations targeted by systemic IgG utilizing an in vitro assay with feces and autologous sera derived from UC patients and healthy controls. To correct for the confounding influence of baseline bacterial abundance, we introduced the IgG+ Probability Score (IPS), a metric that mathematically integrates the sample-specific IgG binding rate to isolate taxa explicitly targeted by systemic IgG. Using this robust framework, we aimed to identify specifically IgG-targeted microbiota and evaluate their associations with disease activity and systemic inflammation in UC.
2. Results
2.1. Clinical Characteristics of the UC Cohort and Evaluation of Autologous Serum IgG Binding Rates
To elucidate the relationship between host autoantibody responses directed against the gut microbiota and clinical characteristics in patients with UC, we utilized fecal samples and autologous sera collected from 37 patients with UC (24 in the active phase and 13 in remission) and 4 healthy participants (HPs) (Table 1 and Table S1). To determine the reactivity of autologous serum IgG with the gut microbiota (IgG binding rate), 4% paraformaldehyde-fixed fecal samples were incubated with autologous patient sera in vitro and subsequently stained with an APC-conjugated anti-human IgG Fc antibody. The proportion of IgG-bound gut bacteria was then quantified via flow cytometry. The results revealed that, despite considerable inter-individual variability, the overall IgG binding rates in the active UC group tended to be higher than those in both the remission and HP groups (A, S1B, S1C).
1 Data are expressed as median (range).
2 Data are expressed as mean (range).
3 Statistical significances between two groups (Disease activity) were evaluated using the Wilcoxon rank-sum test (Mann-Whitney U test). Differences among three groups (Disease extension) were analyzed using the Kruskal–Wallis test. A p-value < 0.05 was considered statistically significant.
* For categorical data (Gender), Fisher's exact test was performed.
Abbreviation: CAI, Clinical Activity Index; CRP, C-reactive protein; WBC, White blood cell; RBC, Red blood cell; PLT, Platelets; Hb, Hemoglobin; Ht, Hematocrit; ALB, Albumin; Tcho, Total cholesterol; Tbil, Total bilirubin; AST, Aspartate aminotransferase; ALT, Alanine aminotransferase; ALP, Alkaline phosphatase; γGTP, γ-glutamyl transpeptidase; LDH, Lactate dehydrogenase; AMY, Amylase.
To further investigate the relationship between clinical characteristics and the IgG binding rate, we performed a correlation network analysis incorporating the expanded panels of clinical parameters. The analysis demonstrated that systemic inflammatory markers, including the Clinical Activity Index (CAI), C-reactive protein (CRP), white blood cell (WBC) count, and platelet (PLT) count, exhibited positive correlations with one another, with the IgG binding rate parallel to these indices of disease activity (Figure 1A, 1B). Conversely, these inflammatory and disease activity indices showed inverse correlations with hemoglobin (Hb), hematocrit (Ht), red blood cell (RBC) count, and albumin (ALB) levels. Robust positive correlation clusters were also observed among liver-associated enzymes, specifically aspartate aminotransferase (AST), alanine aminotransferase (ALT), γ-glutamyl transpeptidase (γGTP), and alkaline phosphatase (ALP). Additionally, the IgG binding rate on gut microbiota displayed positive correlations with serum immunoglobulin levels, including IgG, IgA, and IgM. These findings indicate that the host humoral immune response directed against the gut microbiota is integrated into a broader network of systemic inflammation, anemia, and altered protein metabolism characteristic of UC pathogenesis.
2.2. Microbiome Diversity and Structure in Feces and IgG-Bound Fractions
We performed α- and β-diversity analyses to compare the ecological characteristics of the microbiota in the feces and IgG-bound (IgG+) fractions. First, to evaluate intra-community species diversity, α diversity was analyzed using the Chao1 index (Figure 2A). In the overall analysis, the α diversity of the IgG+ fraction was significantly lower than that of the feces fraction (p < 0.0001). Similar trends were observed within both the HP and UC groups, with a significant decrease in diversity confirmed in the IgG+ fraction (HP group: p < 0.05; UC group: p < 0.0001). These results indicate that the entire fecal microbiota is not uniformly recognized by IgG; rather, a relatively restricted subset of bacterial taxa is selectively enriched in the IgG-bound fraction. Furthermore, intergroup comparisons revealed a trend toward decreased diversity in the UC group compared to the HP group.
We next analyzed β-diversity using principal coordinate analysis (PCoA) and PERMANOVA to assess differences in overall community structure (Figure 2B–D). The results demonstrated that the feces and IgG+ fractions formed clearly distinct clusters, indicating a significant difference in community structure between the two fractions (p = 0.0001, B, 2C). Additionally, comparisons based on disease status revealed significant differences in the microbiota structure between the HP and UC groups (p = 0.0279, D). Taken together, these findings suggest that the IgG-bound fraction exhibits a microbiota structure distinct from that of the whole feces, reflecting the characteristics of the specific bacterial populations selectively targeted by host IgG.
2.3. Profiling of Clinically Associated Bacteria in Fecal and IgG-Bound Fractions
To identify bacterial taxa associated with clinical parameters and the autologous serum IgG binding rate, we conducted statistical analyses using MaAsLin2. In this study, we evaluated both the unfractionated whole feces (Feces) and the IgG-bound (IgG+) fractions. Initially, univariate analyses were performed to comprehensively assess the associations between clinical parameters and bacterial taxa (Figure 3A and 4A). In the analysis of the feces fraction (A), lactic acid bacteria such as Ligilactobacillus, along with Enterococcus, exhibited positive associations with the high IgG binding rate group (> 40%), whereas taxa such as Faecalibacterium and Subdoligranulum displayed negative associations. In the IgG+ fraction (Figure 4A), taxa including Limosilactobacillus and Streptococcus, as well as recognized oral commensals such as Aggregatibacter, Neisseria, and Granulicatella, demonstrated positive associations with the high IgG binding rate group. Furthermore, in both fractions, we identified taxa that correlated not only with disease activity (e.g., CAI, Activity Index) but also with host background factors such as age and sex.
However, the associations identified in these univariate analyses may be subject to confounding by factors such as age, sex, and disease activity. To adjust for these potential confounders, we subsequently conducted multivariable analyses incorporating the CAI, age, and sex as covariates. In the multivariable analysis of the feces fraction, lactic acid bacteria including Ligilactobacillus, Pediococcus, and Lactobacillus exhibited significant positive associations with the IgG binding rate. Conversely, short-chain fatty acid-producing bacteria (SCFA-producing bacteria) such as Faecalibacterium, Anaerostipes, and Subdoligranulum demonstrated negative associations (B). Furthermore, multivariable analysis of the IgG+ fraction revealed positive associations between the IgG binding rate and Pediococcus, Limosilactobacillus, Bifidobacterium, the [Ruminococcus] gnavus group, and oral-associated bacteria such as Aggregatibacter (B). These results suggest that specific bacterial taxa remain strongly associated with the host humoral immune response, independent of potential confounding by age, sex, and clinical disease activity.
2.4. Disease-Associated IgG-Targeted Bacterial Taxa Identified by IgG+ Probability Score (IPS) Profiling
In approaches that isolate and analyze the antibody-bound fraction of the gut microbiota, conventional methods that simply compare relative abundances within the recovered fraction are susceptible to abundance bias. Specifically, bacterial taxa that are highly abundant in the unfractionated whole microbiota (input sample) are frequently overrepresented in the IgG-bound fraction, while low-abundance taxa can cause mathematical inflation when using simple ratio-based indices [33]. To correct for the confounding influence of this baseline abundance and rigorously evaluate taxa explicitly targeted by IgG, we utilized the IgG+ Probability Score (IPS). As described in the methods, this metric incorporates the sample-specific IgG binding rate and an upper-limit clipping method to minimize false positives and compositional artifacts. We subsequently analyzed the associations between the IPS of individual taxa and clinical characteristics.
First, we compared the Log2 Fold Change in the IPS of each bacterial taxon between dichotomized clinical parameter groups (e.g., active phase vs. remission, high vs. low CAI, high vs. low CRP) (Figure 5). The analysis revealed that during the active phase of the disease and in groups with high CAI (an indicator of local mucosal inflammation), the IPS was significantly elevated for taxa belonging to the family Lachnospiraceae (e.g., the [Ruminococcus] gauvreauii group and Dorea) as well as the family Ruminococcaceae (e.g., Ruminococcus, UBA1819, Incertae Sedis, and DTU089). Recognized oral commensals such as Granulicatella, along with the [Eubacterium] hallii group, also showed elevated IPS in these active groups. Interestingly, Butyricicoccus, which is generally considered to contribute to the maintenance of intestinal homeostasis, also exhibited an increased IPS during the active phase. Furthermore, in patients with elevated CRP levels (a systemic inflammatory marker), there was a marked increase in the IPS of taxa including the butyrate-producing bacterium Subdoligranulum, and mucin-degrading taxa such as Lachnoclostridium and the [Ruminococcus] torques group. Conversely, in groups with low inflammatory markers (low CAI and low CRP), taxa such as Lactococcus, Lachnospira, and Peptostreptococcaceae_UKG demonstrated a tendency to be relatively enriched as IgG targets. These results suggest that the profile of bacterial populations specifically targeted by host IgG responses dynamically fluctuates in accordance with the disease phase and systemic inflammatory status.
To further evaluate the direct continuous associations between the IPS of individual taxa and clinical metadata, we performed Spearman's rank correlation analysis and generated a clinical correlation heatmap (Figure 6). This analysis identified Subdoligranulum, Incertae Sedis, Granulicatella, and Butyricicoccus as taxa exhibiting significant positive correlations with the CAI. Moreover, the IPS of the [Clostridium] innocuum group and Subdoligranulum demonstrated significant positive correlations with CRP. Additionally, taxa such as Butyricicoccus, the [Eubacterium] fissicatena group, and the [Ruminococcus] gauvreauii group exhibited significant positive correlations with platelet (PLT) counts, another crucial marker of systemic inflammation. Notably, lactic acid bacteria such as Levilactobacillus, which exhibited increased relative abundances in both the feces and IgG+ fractions in the earlier multivariable analyses (Figs. 3 and 4), demonstrated negative correlations with the CAI, CRP, and PLT when evaluated using the IPS. This discrepancy underscores that while these taxa expand in relative abundance within the inflammatory milieu, they are not the primary, specific targets of the systemic IgG response. These findings suggest that integrating standard abundance profiling with the robust IPS metric effectively isolates the specific bacterial populations most strongly linked to the local and systemic inflammatory pathogenesis of UC.
2.5. Functional Characteristics of IgG-Targeted Bacterial Taxa and Their Association with Disease Activity
To investigate the functional potential of the bacterial taxa explicitly targeted by IgG, we conducted predictive metabolic pathway profiling using PICRUSt2. We compared the functional IPS of metabolic pathways between dichotomized clinical parameter groups (e.g., active phase vs. remission, high vs. low CAI, high vs. low CRP) (Figure 7A and 7B). The analysis revealed that groups with high disease activity and elevated inflammatory markers (active, high CAI, and high CRP) exhibited a marked upregulation of pathways associated with the degradation of host-derived glycoproteins (Figure 7A). Specifically, the superpathway of fucose and rhamnose degradation, fucose degradation, and the superpathway of N-acetylglucosamine, N-acetylmannosamine, and N-acetylneuraminate degradation were significantly enriched. Given that fucose and N-acetylneuraminate (sialic acid) are core components of intestinal mucins, this functional profile strongly aligns with the IgG-targeting of mucin-degrading taxa observed during the active phase of the disease. Furthermore, a broad array of de novo amino acid biosynthesis pathways was prominently upregulated in the inflammatory state, specifically those for L-threonine, L-methionine, L-isoleucine, branched-chain amino acids, and aromatic amino acids. Additionally, pathways related to cell surface polysaccharide and capsular biosynthesis, such as dTDP-L-rhamnose biosynthesis I and colanic acid building blocks biosynthesis, were relatively enriched, indicating a potential adaptation to environmental stress and immune pressure within the inflammatory milieu.
Conversely, in the remission phase and low-index groups, a distinct, constrained set of metabolic pathways was enriched as IgG targets (B). These included bacterial protein N-glycosylation, CMP-pseudaminate biosynthesis, creatinine degradation II, and the superpathway of demethylmenaquinol-6 biosynthesis II. The preservation of these specific pathways suggests a shift in the metabolic requirements of IgG-targeted microbial communities under less inflammatory conditions. Taken together, these findings demonstrate that the predicted functional capabilities of IgG-targeted bacterial populations dynamically shift in response to disease activity and systemic inflammation, specifically highlighting a heightened capacity for host mucin degradation and extensive amino acid synthesis during UC exacerbation.
2.6. Construction of UC Disease Prediction Models Based on IPS Profiles and Identification of Key Bacterial Taxa
To evaluate the potential utility of IgG-targeted bacterial profiles as diagnostic biomarkers, machine learning models were constructed using the Random Forest algorithm, and predictive accuracy was assessed by receiver operating characteristic (ROC) analysis. Three clinical outcomes were used as prediction targets: UC exacerbation (active vs. remission), local mucosal inflammation (CAI), and systemic inflammation (CRP) (Figure 8). We compared model accuracies across a stepwise feature-selection strategy. An unbiased model incorporating the IPS of all bacterial taxa (1. Unbiased All-IPS Panel) exhibited limited predictive accuracy, yielding area under the curve (AUC) values of 0.644 for exacerbation (A), 0.497 for CAI (C), and 0.443 for CRP (E). To improve diagnostic performance, we refined the features to a Target IPS Panel comprising the top 15 taxa identified by variable importance in the initial unbiased models. This refinement markedly improved predictive accuracy, increasing the AUC values to 0.792, 0.689, and 0.743, respectively. Furthermore, iterative feature selection optimization generated highly efficient models (3. Top Mini Panel) requiring only 3 to 8 predictive taxa (Figure S2). These optimized panels achieved the highest diagnostic performances, with AUCs of 0.817 for exacerbation (Top 8 Mini Panel), 0.804 for CAI (Top 3 Mini Panel), and 0.843 for CRP (Top 5 Mini Panel).
Analysis of variable importance (Mean Decrease in Gini impurity) within the Target IPS Panels revealed distinct profiles of predictive taxa depending on the clinical target (B, 8D, and 8F). In the model predicting UC exacerbation (B), taxa such as Erysipelatoclostridium, Escherichia-Shigella, and the [Ruminococcus] gauvreauii group demonstrated the highest contributions. In the model predicting the CAI (D), Eggerthella, Lachnospira, and Incertae Sedis emerged as the top-ranking important variables. For the prediction of systemic inflammation represented by CRP levels (F), Subdoligranulum was identified as the strongest predictor, followed by the [Ruminococcus] torques group and Turicibacter. These findings indicate that assessing specific IgG responses (IPS) directed against a limited, highly targeted set of bacterial taxa, selected according to distinct disease dimensions such as local intestinal or systemic inflammation, provides a more accurate and efficient approach for characterizing disease status than evaluating the overall gut microbiota profile.
3. Discussion
In the present study, we investigated bacterial taxa explicitly targeted by systemic IgG responses and their predicted metabolic pathways using fecal samples and autologous sera from patients with UC. Our results revealed that the relative abundance of gut bacteria did not necessarily align with their probability of being bound by IgG, indicating that systemic humoral immune responses are selectively directed toward specific bacterial taxa. Indeed, lactic acid bacteria such as Levilactobacillus and Lactiplantibacillus, which demonstrated significant increases in relative abundance within both the unfractionated feces and IgG-bound fractions (Figure 3 and Figure 4), exhibited negative correlations with systemic inflammatory markers when evaluated by the IgG+ Probability Score (IPS) (Figure 5 and Figure 6). Conversely, we identified distinct taxa that exhibited a high IPS despite not being highly abundant in the overall microbial community. These findings are consistent with previous reports demonstrating that IgG responses in patients with IBD are not uniformly directed across the entire gut microbiota, but rather selectively target specific bacterial taxa [31,32,33]. Furthermore, the conventional evaluation of IgG-bound fractions is inherently susceptible to abundance bias driven by the background population [33]. By integrating the sample-specific IgG binding rate and an upper-limit clipping method, the IPS utilized in this study mitigates the mathematical inflation of simple ratio-based metrics and the confounding influence of baseline abundance, providing a robust method for isolating bacterial populations explicitly targeted by systemic humoral immunity.
The experimental system employed in this study was designed to evaluate bacterial taxa targeted by systemic IgG responses through an in vitro reaction between patient-derived fecal bacteria and autologous serum. Previous studies have demonstrated that the systemic antimicrobial IgG repertoire reflects bacterial taxa that have translocated across the intestinal barrier into host tissues [32]. Accordingly, profiling serum IgG responses serves as an approach for identifying bacterial taxa immunologically exposed to the host. In the present study, an increased IPS against recognized oral commensals was observed; specifically, the IPS of Granulicatella was elevated in patients with active UC and high CAI, while Atopobium and Corynebacterium demonstrated significant positive correlations with CRP (Figure 5 and Figure 6). These bacterial populations may induce systemic IgG responses through ectopic colonization of the intestinal tract and increased immune exposure resulting from impaired mucosal barrier function. Similar observations have been reported by Rengarajan et al. and Bourgonje et al., who demonstrated that systemic and local IgG responses in patients with IBD are not uniformly directed toward the entire gut microbiota but are preferentially targeted toward specific bacterial taxa [28,31]. In their studies, IgG responses against dominant anaerobic commensals in the colon, such as Faecalibacterium and Roseburia, were relatively limited, whereas robust IgG binding was observed against oral-associated taxa, including Veillonella, Gemella, and Peptostreptococcus. These insights suggest that alterations in microbial community structure, together with the intestinal colonization of bacteria outside their native ecological niches, contribute to changes in host humoral immune responses. Recently, oral- and upper gastrointestinal tract-derived bacteria have been reported to become enriched within the mucosa-associated microbiota (MAM) of pediatric UC patients in parallel with increasing disease activity and mucosal inflammation [37]. The influx and colonization of oral bacteria in the gut have been implicated in IBD pathogenesis under the concept of the oral-gut axis [11,13,20,21,22]. In this context, the elevated systemic IgG targeting of oral-associated taxa observed in our study indicates that these taxa may be linked not only to alterations in the local mucosal environment but also to the elicitation of systemic humoral immunity.
Impaired mucosal barrier function is considered a key factor facilitating bacterial translocation into host tissues. In this study, mucin-degrading taxa such as Lachnoclostridium and the [Ruminococcus] torques group, along with specific members of the family Lachnospiraceae (e.g., Dorea and the [Ruminococcus] gauvreauii group), exhibited significantly elevated IPS in the active UC, high CAI, and high CRP groups (Figure 5). These specific taxa are known to possess mucin-foraging capabilities, enabling them to utilize host-derived mucins as a nutrient source [38,39,40]. Recent studies have demonstrated that the thinning of the mucus layer and alterations in the mucus environment influence host-microbe interactions by increasing epithelial permeability and promoting bacterial contact with the mucosal surface [41]. Desai et al. showed that the expansion of mucin-utilizing bacteria under conditions of dietary fiber deficiency leads to the erosion of the mucus barrier and facilitates closer bacterial proximity to the intestinal epithelium [41]. The enhanced IgG responses against these mucin-degrading bacteria observed in the present study likely reflect alterations in mucosal barrier integrity that increase systemic immune exposure to these specific bacterial taxa.
It is also crucial to note that systemic IgG responses against the gut microbiota reflect a complex interplay between immune defense and mucosal homeostasis. Recent large-scale metagenomic analyses have reported that Eggerthella lenta encompasses not only disease-adapted strains that proliferate in the inflammatory environment of IBD but also health-associated strains that inversely correlate with disease severity [42]. In the present study, Eggerthella exhibited an elevated IPS in the high CRP group. Although strain-level resolution was not available, this finding suggests that during exacerbation, the systemic IgG response is actively and specifically directed against the disease-adapted lineages proliferating within the inflammatory milieu. Conversely, systemic IgG targeting does not exclusively signify disease exacerbation. In the remission phase and low inflammatory marker groups, distinct taxa such as Lactococcus and Lachnospira demonstrated a tendency to be relatively enriched as IgG targets. Systemic IgG and intestinal secretory IgA are known to share certain commensal bacteria as common targets; given that anti-commensal IgG responses are augmented in selective IgA deficiency, it has been proposed that IgG functions as a compensatory defense mechanism complementing mucosal immunity [43]. In addition, autologous serum IgG derived from patients with UC exhibits high reactivity toward specific commensals, including Lactobacillaceae (e.g., Lacticaseibacillus paracasei) [44]. IgG binding to these bacteria has been suggested to influence complement activation associated with immune complex formation involving other species (e.g., Escherichia coli) [44]. Taken together, these findings suggest that systemic IgG responses are not solely responsible for neutralizing pathogenic bacteria but are also actively involved in maintaining homeostatic interactions with the gut microbiota. Therefore, the specific IgG-targeted taxa identified in this study reflect a dynamic, adaptive host immune response shifting between inflammatory defense and immune homeostasis. Because the absolute pathogenic or protective roles of individual bacterial taxa cannot be directly determined solely from the IgG binding patterns observed herein, future studies incorporating strain-level analyses and mechanistic investigations are warranted to further elucidate the precise roles of these IgG-targeted populations in UC pathogenesis.
The observed association between the IgG response against the genus Subdoligranulum and systemic inflammatory markers (CRP) aligns with previous studies demonstrating a relationship between this taxon and host immune responses [45,46]. Subdoligranulum is generally recognized as a butyrate-producing bacterium that contributes to the maintenance of intestinal homeostasis [47], but certain lineages have been reported to exhibit cross-reactivity with autoantibodies and have been implicated in autoimmune pathogenesis [46]. Furthermore, our analysis revealed that Butyricicoccus, another critical butyrate-producing commensal, exhibited an increased IPS during the active phase and significantly correlated with the CAI and platelet counts. Butyricicoccus is a butyrate-producing genus that has been reported to enhance intestinal epithelial barrier integrity and is consistently depleted in patients with IBD, making it a promising next-generation probiotic candidate. [48,49]. Despite their well-established protective roles, the increased IgG targeting of both Subdoligranulum and Butyricicoccus in highly active and inflammatory states may reflect an altered relationship in mucosal immune tolerance. One possible explanation is that disruption of the mucosal barrier during UC exacerbation increases the exposure of these mucosa-associated, beneficial commensals to the systemic immune system, resulting in enhanced systemic IgG recognition. These findings suggest that systemic IgG responses in active UC are not restricted to putative pathobionts but may also target commensal bacteria with established beneficial functions.
Consistent with these taxonomic shifts, our predictive functional profiling corroborated a marked upregulation of metabolic pathways associated with the degradation of host-derived mucin glycoproteins (e.g., fucose and sialic acid) during UC exacerbation (A). The functional enrichment of these specific pathways directly aligns with the elevated systemic IgG targeting of mucin-degrading taxa observed in our IPS analysis. Additionally, pathways involved in cell surface polysaccharide and capsular biosynthesis, including colanic acid building blocks and dTDP-L-rhamnose biosynthesis, were significantly enriched. Capsular polysaccharides are well-recognized virulence determinants that protect bacteria from host immune defenses, including phagocytosis and complement-mediated killing, while enhancing survival under inflammatory conditions. The enrichment of these pathways may therefore reflect adaptive remodeling of bacterial surface structures in response to the inflammatory and oxidative microenvironments. [50,51,52]. Furthermore, multiple de novo amino acid biosynthesis pathways were enriched in the IgG-targeted microbiota of patients with highly active disease. This observation may reflect metabolic adaptation of these bacterial populations to the altered nutrient environment associated with intestinal inflammation, which is known to profoundly reshape microbial metabolic activity in IBD [53,54]. However, it must be acknowledged that this analysis relies on functional predictions derived from 16S rRNA gene sequencing data and does not directly quantify in vivo metabolic activity or actual virulence factor production. Consequently, further validation utilizing shotgun metagenomic and metabolomic analyses is warranted to definitively confirm these functional characteristics of the IgG-targeted microbial populations.
In the machine learning analysis, the profiles of the IgG-targeted bacterial taxa contributing to the prediction of UC exacerbation (active vs. remission), local mucosal inflammation (CAI), and systemic inflammation (CRP) were distinctly different. This indicates that the bacterial populations specifically targeted by systemic IgG responses reflect different facets of UC pathogenesis, encompassing both local intestinal inflammation and systemic immunological status. The observation that the optimized models (Top Mini Panels) substantially outperformed those incorporating the entire microbiota (Unbiased All-IPS Panel) must be interpreted with caution. This enhanced predictive accuracy likely reflects the effects of noise reduction and dimensionality reduction inherent in the stepwise feature selection process. Therefore, the primary significance of this analysis lies not merely in the predictive performance per se, but rather in the extraction of distinct, pathology-specific IgG-targeted taxa for different clinical parameters, underscoring the potential of these specific immune-microbe interactions to mirror the multifaceted clinical characteristics of UC. However, it should be noted that this study is an exploratory analysis conducted on a relatively small cohort. Because model construction and evaluation were performed within the same dataset, the possibility that the predictive performance is overestimated due to overfitting cannot be excluded. Future studies utilizing independent validation cohorts are essential to rigorously evaluate whether the predictive performance and key diagnostic taxa identified herein are generalizable to broader clinical populations.
Several limitations of this study should be acknowledged. First, while the IPS introduced herein mathematically integrates the sample-specific IgG-binding rate to mitigate background abundance bias, the underlying 16S rRNA gene sequencing data remains compositional [55]. Consequently, the IPS should not be interpreted as an absolute quantitative measure of IgG mass bound to each taxon, but rather as a robust probabilistic index reflecting the relative targeting of bacterial taxa by systemic IgG. Second, our experimental design utilized an in vitro assay reacting patient-derived fecal microbiota with autologous serum. Thus, the identified taxa represent bacteria with the capacity to be targeted by systemic IgG, which does not directly confirm their actual in vivo state of antibody coating or tissue translocation within the intestinal tract at the time of sampling. Third, the functional profiling was predictive, relying on PICRUSt2, and does not directly evaluate true gene expression or metabolic activity. Moreover, recent studies have shown that antibody-targeting patterns can vary substantially not only at the species level but also at the strain level [35]. However, the taxonomic resolution of the present study was insufficient to evaluate such strain-level differences. Future validation using shotgun metagenomic and metatranscriptomic approaches will therefore be required. Fourth, secretory IgA was not evaluated in this study, and thus the relationship between mucosal immune responses and systemic IgG responses remains unclear [27,28,43]. Finally, because this was a relatively small cross-sectional cohort study, it is not possible to determine whether the observed alterations in IgG responses contribute to disease pathogenesis or arise secondary to the inflammatory environment. Furthermore, the specific antigenic molecules recognized by these IgG antibodies remain unidentified. Future longitudinal cohort studies, combined with functional assays for precise antigen identification, are necessary to fully elucidate the specific roles of the IgG-targeted microbiota in the pathogenesis of UC.
In conclusion, the application of the IPS, which statistically integrates the sample-specific IgG-binding rate to mitigate background abundance bias, enabled the precise identification of IgG-targeted bacterial populations that could not be characterized based on relative abundance alone. Our findings suggest that systemic IgG responses in UC are not directed uniformly toward the gut microbiota but are selectively targeted toward specific bacterial taxa depending on the patient's immunological status. In particular, oral-associated bacteria and mucin-degrading taxa were associated with disease activity and systemic inflammation, indicating that they constitute major targets of the aberrant host humoral immune response. These findings provide further insight into host-microbiota interactions in UC and offer a novel analytical framework for evaluating immune-targeted bacterial populations that vary across different phases of disease.
4. Materials and Methods
4.1. Patients
Fecal and serum samples used in this study were collected from 37 patients with UC and 4 healthy controls. The baseline characteristics of the study participants are summarized in Table 1.
4.2. Flow Cytometric Analysis of IgG-Bound Bacteria
Fecal samples (0.5 g) were suspended in phosphate-buffered saline (PBS, pH 7.4). After allowing large debris to settle, the supernatant was filtered through a 100-μm cell strainer. The filtrate was diluted with PBS to a final fecal concentration of 2 mg/mL, and the bacterial fraction was harvested by centrifugation at 6,000 × g for 5 min at 4°C. The resulting pellet was resuspended in 4% paraformaldehyde (PFA) in PBS and stored at 4°C for fixation until subsequent analysis. The fixed fecal bacterial fraction (equivalent to 20 mg of feces) was washed with PBS, resuspended in 1% bovine serum albumin (BSA)/PBS, and incubated with diluted autologous patient serum for 1 h at room temperature. After washing with PBS, an APC-conjugated anti-human IgG (Fc-specific) antibody was added, and the mixture was incubated for 30 min at room temperature. Following another PBS wash, propidium iodide (PI) was added, and the samples were stained on ice for 15 min. All incubations subsequent to the serum reaction were performed in the dark. The prepared samples were analyzed using a flow cytometer (Guava easyCyte 6-2L, Millipore). Using an Escherichia coli culture as a reference, the bacterial population was gated based on forward scatter (FSC) and side scatter (SSC) plots. The population positive for both PI (total bacteria) and APC was quantified as IgG-bound gut bacteria.
4.3. Purification of Autologous Serum IgG
Frozen serum samples from UC patients were thawed, heat-inactivated at 57°C for 30 min, and incubated overnight at 4°C. Following centrifugation at 10,000 × g for 5 min at 4°C, 200 μL of the serum fraction was collected for IgG purification. IgG was purified using Micro Bio-Spin Chromatography Columns (Bio-Rad) packed with Protein G Sepharose 4 Fast Flow (GE Healthcare). The serum was loaded onto the column pre-equilibrated with PBS, incubated for 5 min at room temperature, and then washed with PBS. Bound IgG was eluted using 0.1 M Glycine-HCl (pH 2.7) and immediately neutralized with 1 M Tris-HCl (pH 9.5). The eluate was concentrated and buffer-exchanged into PBS via centrifugal ultrafiltration using a Microcon YM-30 (Millipore). The recovered purified IgG solution was centrifuged at 20,000 × g for 5 min to remove aggregates. The protein concentration of the resulting supernatant was determined using the BCA assay, and the solution was adjusted to a final concentration of 5 mg/mL with PBS prior to subsequent analyses.
4.4. Reaction and Magnetic Recovery of IgG-Bound Fecal Bacteria
Fecal samples (0.2 g) were suspended in PBS, and large debris was removed by two repeated low-speed centrifugations (200 × g, 4°C, 5 min). The resulting supernatant was centrifuged at 10,000 × g for 5 min at 4°C, and the harvested bacterial fraction was washed three times with PBS. This bacterial fraction was resuspended in PBS to a final fecal concentration of 0.1 g/mL. Purified autologous serum IgG (100 μg) was added to the bacterial suspension, and the mixture was gently incubated with end-over-end rotation for 30 min at 4°C. After the reaction, bacteria were recovered by centrifugation at 10,000 × g for 5 min at 4°C and washed a total of four times with PBS. Subsequently, 10 μL of Protein G Mag Sepharose Xtra (GE Healthcare) was added to the resulting pellet, and the mixture was incubated with rotation for 30 min at 4°C. Finally, the supernatant was removed using a magnetic stand, and the beads were magnetically washed six times using 1 mL of PBS per wash to isolate and recover the IgG-bound bacterial fraction. DNA extraction from the recovered beads (IgG-bound bacterial fraction) was performed using the PowerViral Environmental RNA/DNA Isolation Kit (QIAGEN) according to the manufacturer's protocol to purify DNA for 16S rRNA gene analysis. The concentration of the extracted DNA was quantified using the Qubit dsDNA BR Assay Kit (Thermo Fisher Scientific).
4.5. 16S rRNA Gene Analysis
Sequencing libraries were prepared by amplifying the V3-V4 hypervariable region of the 16S rRNA gene using the 341F and 805R primer set with Illumina MiSeq adaptor sequences, as previously reported. Libraries were sequenced on the Illumina MiSeq platform using 300-bp paired-end V3 chemistry (Illumina) with the addition of 5% PhiX. Sequence denoising and the generation of amplicon sequence variants (ASVs) were performed using the DADA2 plugin within QIIME2. Taxonomic assignment of the resulting ASVs was conducted using a pre-trained Naive Bayes classifier based on the SILVA database (release 138).
4.6. Calculation of the IgG+ Probability Score (IPS)
To evaluate the extent of IgG targeting for each bacterial taxon while accounting for its baseline relative abundance in the gut microbiota, we calculated the IgG+ Probability Score (IPS). A simple ratio-based index is susceptible to compositional bias, particularly where low-abundance taxa in the input feces result in mathematical inflation. To mitigate this bias and reduce false positives, we applied an adjusted formula incorporating the sample-specific IgG binding rate (derived from flow cytometry) and an upper-limit clipping method, based on the approach described by Jackson et al. [33]. For each bacterial taxon (ASV), the adjusted IgG abundance (Aadj) was calculated by multiplying its relative abundance in the IgG-bound (IgG+) fraction by the overall IgG binding rate of the sample. The denominator was defined as the maximum value between its relative abundance in the unfractionated whole feces and the Aadj. Finally, the IPS was calculated with a pseudocount of 10-6 added to both terms to prevent division-by-zero errors. The index was calculated as follows:
where Abundance(IgG+) and Abundance(Feces) represent the relative abundance (%) of a specific taxon in the IgG+ fraction and the whole feces fraction, respectively. This normalization method reduces ratio inflation caused by baseline low abundance, allowing for an objective assessment of IgG coating within each sample.
4.7. Predictive Functional Profiling
To predict the functional potential of the gut microbiota, we utilized the PICRUSt2 (Phylogenetic Investigation of Communities by Reconstruction of Unobserved States 2) plugin implemented within the QIIME2 environment. The analysis pipeline was executed using the representative sequences and feature tables derived from the 16S rRNA amplicon sequencing data as input, generating predicted abundance profiles of MetaCyc metabolic pathways for each sample. The resulting profile data were subjected to downstream analyses (calculation of functional IPS and statistical comparisons) in the R environment.
4.8. Statistical Analysis
Statistical analyses were performed in the R software environment (v.4.4.2). Microbiome data processing and diversity calculations were conducted using the phyloseq (v.1.50.0) and MicrobiotaProcess (v.1.18.0) packages. The Wilcoxon test was used for intergroup comparisons of α-diversity. β-diversity (Bray-Curtis dissimilarity) between samples was calculated based on the relative abundance of observed ASVs using the vegan package (v.2.7-2) and visualized via principal coordinate analysis (PCoA). Differences in community structure were statistically evaluated by permutational multivariate analysis of variance (PERMANOVA, 9,999 permutations) using the adonis function within the same package. The Wilcoxon signed-rank test was used for paired comparisons between the whole feces fraction and the autologous serum IgG-bound (IgG+) fraction, whereas the Wilcoxon rank-sum test (Mann-Whitney U test) was applied for comparisons between two independent groups (e.g., active phase vs. remission).
The IPS, a robust quantitative metric of IgG targeting, was calculated for each taxon. A functional IPS was similarly calculated for the metabolic pathway profiles predicted by PICRUSt2, and specific enrichment was evaluated by log2 fold change between groups and the Wilcoxon rank-sum test. Continuous correlations between clinical parameters (e.g., CAI, CRP, IgE) and relative abundances (Figure 1) or IPS's (Figure 6) were evaluated using Spearman's rank correlation analysis and visualized with network plots (corrr package, v.0.4.5) and heatmaps (pheatmap package, v.1.0.13). Independent associations between clinical metadata and bacterial taxa were analyzed using the MaAsLin2 package (v.1.20.0). Multivariate models were constructed incorporating potential confounding factors, such as age, sex, and disease activity, as covariates. The generated regression coefficients were used to evaluate the direction and effect size of the associations. A machine learning algorithm using the randomForest package (v.4.7-1.2) was applied to construct a predictive model for UC pathogenesis based on the IPS profiles. Variable importance was evaluated based on the Mean Decrease in Gini impurity. To construct optimized diagnostic panels, we initially selected the top 15 taxa (Target Panel) from the unbiased all-taxa model. Subsequently, we performed a feature selection optimization by iteratively calculating the area under the curve (AUC) across varying numbers of top-ranked taxa (from 1 to 15) to identify the most efficient "Mini Panel" that achieved plateau performance with the minimum number of predictive features. The diagnostic performance of these models was evaluated by receiver operating characteristic (ROC) analysis using the pROC package (v.1.19.0.1), and the AUC and 95% confidence intervals based on the bootstrap method were calculated.
For analyses involving multiple comparisons, such as those performed with MaAsLin2, p-values were adjusted to the false discovery rate (FDR) using the Benjamini-Hochberg method to control for false positives. Across all statistical tests, a two-sided p-value or an FDR-adjusted p-value (q-value) of < 0.05 was considered statistically significant.
Supplementary Materials
The following supporting information can be downloaded at the website of this paper posted on Preprints.org, Table S1: Clinical characteristics and laboratory parameters of the participants enrolled in this study.; Figure S1: Evaluation of autologous serum IgG binding rates against the gut microbiota in the ulcerative colitis cohort.; Figure S2: Determination of the optimal number of predictor variables for the Random Forest predictive models.
Author Contributions
K.T., H.N.-I., H.I. and T.K. conceptualized and designed the study. H.I. collected the clinical samples and laboratory data. K.T. performed the FACS analysis. K.T., H.N.-I., A.T., and E.M. conducted the isolation of IgG-bound bacteria, DNA extraction, metagenomic data analysis, and associated statistical analyses. K.T., H.N.-I., Y. M., and T.K. interpreted the results and wrote the manuscript. All authors have read and agreed to the published version of the manuscript.
Funding
This study was supported by JSPS KAKENHI Grant Number 17K08833.
Institutional Review Board Statement
This study was conducted according to the protocol approved by the Ethics Committees of Kagawa University (Approval No: H23-054, Approved date: December 7, 2011).
Informed Consent Statement
We obtained written informed consent from the guardians for of all the participants.
Data Availability Statement
The 16S rRNA gene sequencing read data have been deposited into DDBJ (Accession number: DRR1082041-DRR1082122). Data used to generate the figures and tables can be provided upon reasonable request to the corresponding author.
Acknowledgments
We are thankful to Chihiro Morieda and Kyoko Horiuchi for her technical assistance.
Conflicts of Interest
The authors declare no conflicts of interest.
Abbreviations
The following abbreviations are used in this manuscript:
| ALB | Albumin |
| ALP | Alkaline phosphatase |
| ALT | Alanine aminotransferase |
| AMY | Amylase |
| APC | Allophycocyanin |
| AST | Aspartate aminotransferase |
| ASV | Amplicon sequence variant |
| AUC | Area under the curve |
| CAI | Clinical Activity Index |
| CRP | C-reactive protein |
| FSC | Forward scatter |
| γGTP | γ-glutamyl transpeptidase |
| Hb | Hemoglobin |
| HP | Healthy participant |
| Ht | Hematocrit |
| IBD | Inflammatory bowel disease |
| IgA | Immunoglobulin A |
| IgE | Immunoglobulin E |
| IgG | Immunoglobulin G |
| IgM | Immunoglobulin M |
| IPS | IgG+ Probability Score |
| LDH | Lactate dehydrogenase |
| MaAsLin2 | Microbiome Multivariable Association with Linear Models |
| PCoA | Principal coordinate analysis |
| PERMANOVA | Permutational multivariate analysis of variance |
| PFA | Paraformaldehyde |
| PI | Propidium iodide |
| PICRUSt2 | Phylogenetic Investigation of Communities by Reconstruction of Unobserved States 2 |
| PLT | Platelets |
| RBC | Red blood cell |
| ROC | Receiver operating characteristic |
| SSC | Side scatter |
| Tbil | Total bilirubin |
| Tcho | Total cholesterol |
| UC | Ulcerative colitis |
| WBC | White blood cell |
References
- Chang, J.T. Pathophysiology of Inflammatory Bowel Diseases. N Engl. J. Med. 2020, 383, 2652–2664. [Google Scholar] [CrossRef] [PubMed]
- Ng, S.C.; Shi, H.Y.; Hamidi, N.; Underwood, F.E.; Tang, W.; Benchimol, E.I.; Panaccione, R.; Ghosh, S.; Wu, J.C.Y.; Chan, F.K.L.; et al. Worldwide Incidence and Prevalence of Inflammatory Bowel Disease in the 21st Century: A Systematic Review of Population-Based Studies. The Lancet 2017, 390, 2769–2778. [Google Scholar] [CrossRef] [PubMed]
- Kaplan, G.G. The Global Burden of Inflammatory Bowel Disease: From 2025 to 2045. Nat. Rev. Gastroenterol. Hepatol. 2025, 22, 708–720. [Google Scholar] [CrossRef] [PubMed]
- Molodecky, N.A.; Soon, I.S.; Rabi, D.M.; Ghali, W.A.; Ferris, M.; Chernoff, G.; Benchimol, E.I.; Panaccione, R.; Ghosh, S.; Barkema, H.W.; et al. Increasing Incidence and Prevalence of the Inflammatory Bowel Diseases With Time, Based on Systematic Review. Gastroenterology 2012, 142, 46–54.e42. [Google Scholar] [CrossRef] [PubMed]
- Tsutsui, A.; Murakami, Y.; Nishiwaki, Y.; Asakura, K.; Ohfuji, S.; Fukushima, W.; Matsuoka, K.; Hisamatsu, T. Nationwide Estimates of Patient Numbers and Prevalence Rates of Ulcerative Colitis and Crohn’s Disease in Japan in 2023. J. Gastroenterol. 2025, 60, 1513–1522. [Google Scholar] [CrossRef] [PubMed]
- Le Berre, C.; Honap, S.; Peyrin-Biroulet, L. Ulcerative Colitis. The Lancet 2023, 402, 571–584. [Google Scholar] [CrossRef] [PubMed]
- Rubin, D.T.; Ananthakrishnan, A.N.; Siegel, C.A.; Sauer, B.G.; Long, M.D. ACG Clinical Guideline: Ulcerative Colitis in Adults. Am. J. Gastroenterol. 2019, 114, 384–413. [Google Scholar] [CrossRef] [PubMed]
- Odenwald, M.A.; Turner, J.R. The Intestinal Epithelial Barrier: A Therapeutic Target? Nat. Rev. Gastroenterol. Hepatol. 2017, 14, 9–21. [Google Scholar] [CrossRef] [PubMed]
- Martini, E.; Krug, S.M.; Siegmund, B.; Neurath, M.F.; Becker, C. Mend Your Fences. Cell. Mol. Gastroenterol. Hepatol. 2017, 4, 33–46. [Google Scholar] [CrossRef] [PubMed]
- Hajishengallis, G. Periodontitis: From Microbial Immune Subversion to Systemic Inflammation. Nat. Rev. Immunol. 2015, 15, 30–44. [Google Scholar] [CrossRef] [PubMed]
- Hajishengallis, G.; Chavakis, T. Local and Systemic Mechanisms Linking Periodontal Disease and Inflammatory Comorbidities. Nat. Rev. Immunol. 2021, 21, 426–440. [Google Scholar] [CrossRef] [PubMed]
- Pietropaoli, D.; Del Pinto, R.; Corridoni, D.; Rodriguez-Palacios, A.; Di Stefano, G.; Monaco, A.; Weinberg, A.; Cominelli, F. Occurrence of Spontaneous Periodontal Disease in the SAMP1/YitFc Murine Model of Crohn Disease. J. Periodontol. 2014, 85, 1799–1805. [Google Scholar] [CrossRef] [PubMed]
- Byrd, K.M.; Gulati, A.S. The “Gum–Gut” Axis in Inflammatory Bowel Diseases: A Hypothesis-Driven Review of Associations and Advances. Front. Immunol. 2021, 12, 620124. [Google Scholar] [CrossRef] [PubMed]
- Brito, F.; Barros, F.C.D.; Zaltman, C.; Pugas Carvalho, A.T.; De Vasconcellos Carneiro, A.J.; Fischer, R.G.; Gustafsson, A.; De Silva Figueredo, C.M. Prevalence of Periodontitis and DMFT Index in Patients with Crohn’s Disease and Ulcerative Colitis. J. Clin. Periodontol. 2008, 35, 555–560. [Google Scholar] [CrossRef] [PubMed]
- Habashneh, R.A.; Khader, Y.S.; Alhumouz, M.K.; Jadallah, K.; Ajlouni, Y. The Association between Inflammatory Bowel Disease and Periodontitis among Jordanians: A Case-Control Study. J. Periodontal Res. 2012, 47, 293–298. [Google Scholar] [CrossRef] [PubMed]
- Grössner-Schreiber, B.; Fetter, T.; Hedderich, J.; Kocher, T.; Schreiber, S.; Jepsen, S. Prevalence of Dental Caries and Periodontal Disease in Patients with Inflammatory Bowel Disease: A Case-Control Study. J. Clin. Periodontol. 2006, 33, 478–484. [Google Scholar] [CrossRef] [PubMed]
- Flemmig, T.F.; Shanahan, F.; Miyasaki, K.T. Prevalence and Severity of Periodontal Disease in Patients with Inflammatory Bowel Disease. J. Clin. Periodontol. 1991, 18, 690–697. [Google Scholar] [CrossRef] [PubMed]
- Vavricka, S.R.; Manser, C.N.; Hediger, S.; Vögelin, M.; Scharl, M.; Biedermann, L.; Rogler, S.; Seibold, F.; Sanderink, R.; Attin, T.; et al. Periodontitis and Gingivitis in Inflammatory Bowel Disease: A Case-Control Study. Inflamm. Bowel Dis. 2013, 19, 2768–2777. [Google Scholar] [CrossRef] [PubMed]
- Koutsochristou, V.; Zellos, A.; Dimakou, K.; Panayotou, I.; Siahanidou, S.; Roma-Giannikou, E.; Tsami, A. Dental Caries and Periodontal Disease in Children and Adolescents with Inflammatory Bowel Disease: A Case-Control Study. Inflamm. Bowel Dis. 2015, 21, 1839–1846. [Google Scholar] [CrossRef] [PubMed]
- Kitamoto, S.; Nagao-Kitamoto, H.; Jiao, Y.; Gillilland, M.G.; Hayashi, A.; Imai, J.; Sugihara, K.; Miyoshi, M.; Brazil, J.C.; Kuffa, P.; et al. The Intermucosal Connection between the Mouth and Gut in Commensal Pathobiont-Driven Colitis. Cell 2020, 182, 447–462.e14. [Google Scholar] [CrossRef] [PubMed]
- Atarashi, K.; Suda, W.; Luo, C.; Kawaguchi, T.; Motoo, I.; Narushima, S.; Kiguchi, Y.; Yasuma, K.; Watanabe, E.; Tanoue, T.; et al. Ectopic Colonization of Oral Bacteria in the Intestine Drives TH1 Cell Induction and Inflammation. Science 2017, 358, 359–365. [Google Scholar] [CrossRef] [PubMed]
- Schmidt, T.S.; Hayward, M.R.; Coelho, L.P.; Li, S.S.; Costea, P.I.; Voigt, A.Y.; Wirbel, J.; Maistrenko, O.M.; Alves, R.J.; Bergsten, E.; et al. Extensive Transmission of Microbes along the Gastrointestinal Tract. eLife 2019, 8, e42693. [Google Scholar] [CrossRef] [PubMed]
- Kawamoto, S.; Tran, T.H.; Maruya, M.; Suzuki, K.; Doi, Y.; Tsutsui, Y.; Kato, L.M.; Fagarasan, S. The Inhibitory Receptor PD-1 Regulates IgA Selection and Bacterial Composition in the Gut. Science 2012, 336, 485–489. [Google Scholar] [CrossRef] [PubMed]
- Nagaishi, T.; Watabe, T.; Kotake, K.; Kumazawa, T.; Aida, T.; Tanaka, K.; Ono, R.; Ishino, F.; Usami, T.; Miura, T.; et al. Immunoglobulin A–Specific Deficiency Induces Spontaneous Inflammation Specifically in the Ileum. Gut 2022, 71, 487–496. [Google Scholar] [CrossRef] [PubMed]
- Macpherson, A.J.; McCoy, K.D. Stratification and Compartmentalisation of Immunoglobulin Responses to Commensal Intestinal Microbes. Semin. Immunol. 2013, 25, 358–363. [Google Scholar] [CrossRef] [PubMed]
- Fagarasan, S.; Muramatsu, M.; Suzuki, K.; Nagaoka, H.; Hiai, H.; Honjo, T. Critical Roles of Activation-Induced Cytidine Deaminase in the Homeostasis of Gut Flora. Science 2002, 298, 1424–1427. [Google Scholar] [CrossRef] [PubMed]
- van der Waaij, L.A.; Kroese, F.G.M.; Visser, A.; Nelis, G.F.; Westerveld, B.D.; Jansen, P.L.M.; Hunter, J.O. Immunoglobulin Coating of Faecal Bacteria in Inflammatory Bowel Disease. Eur. J. Gastroenterol. Hepatol. 2004, 16, 669–674. [Google Scholar] [CrossRef] [PubMed]
- Rengarajan, S.; Vivio, E.E.; Parkes, M.; Peterson, D.A.; Roberson, E.D.O.; Newberry, R.D.; Ciorba, M.A.; Hsieh, C.-S. Dynamic Immunoglobulin Responses to Gut Bacteria during Inflammatory Bowel Disease. Gut Microbes 2020, 11, 405–420. [Google Scholar] [CrossRef] [PubMed]
- Castro-Dopico, T.; Dennison, T.W.; Ferdinand, J.R.; Mathews, R.J.; Fleming, A.; Clift, D.; Stewart, B.J.; Jing, C.; Strongili, K.; Labzin, L.I.; et al. Anti-Commensal IgG Drives Intestinal Inflammation and Type 17 Immunity in Ulcerative Colitis. Immunity 2019, 50, 1099–1114.e10. [Google Scholar] [CrossRef] [PubMed]
- Masu, Y.; Kanazawa, Y.; Kakuta, Y.; Shimoyama, Y.; Onodera, M.; Naito, T.; Moroi, R.; Kuroha, M.; Kimura, T.; Shiga, H.; et al. Immunoglobulin Subtype-Coated Bacteria Are Correlated with the Disease Activity of Inflammatory Bowel Disease. Sci. Rep. 2021, 11, 16672. [Google Scholar] [CrossRef] [PubMed]
- Bourgonje, A.R.; Roo-Brand, G.; Lisotto, P.; Sadaghian Sadabad, M.; Reitsema, R.D.; de Goffau, M.C.; Faber, K.N.; Dijkstra, G.; Harmsen, H.J.M. Patients With Inflammatory Bowel Disease Show IgG Immune Responses Towards Specific Intestinal Bacterial Genera. Front Immunol. 2022, 13, 842911. [Google Scholar] [CrossRef] [PubMed]
- Vujkovic-Cvijin, I.; Welles, H.C.; Ha, C.W.Y.; Huq, L.; Mistry, S.; Brenchley, J.M.; Trinchieri, G.; Devkota, S.; Belkaid, Y. The Systemic Anti-Microbiota IgG Repertoire Can Identify Gut Bacteria That Translocate across Gut Barrier Surfaces. Sci. Transl. Med. 2022, 14, eabl3927. [Google Scholar] [CrossRef] [PubMed]
- Jackson, M.A.; Pearson, C.; Ilott, N.E.; Huus, K.E.; Hegazy, A.N.; Webber, J.; Finlay, B.B.; Macpherson, A.J.; Powrie, F.; Lam, L.H. Accurate Identification and Quantification of Commensal Microbiota Bound by Host Immunoglobulins. Microbiome 2021, 9, 33. [Google Scholar] [CrossRef] [PubMed]
- Palm, N.W.; de Zoete, M.R.; Cullen, T.W.; Barry, N.A.; Stefanowski, J.; Hao, L.; Degnan, P.H.; Hu, J.; Peter, I.; Zhang, W.; et al. Immunoglobulin A Coating Identifies Colitogenic Bacteria in Inflammatory Bowel Disease. Cell 2014, 158, 1000–1010. [Google Scholar] [CrossRef] [PubMed]
- Olm, M.R.; Spencer, S.P.; Takeuchi, T.; Silva, E.L.; Sonnenburg, J.L. Metagenomic Immunoglobulin Sequencing Reveals IgA Coating of Microbial Strains in the Healthy Human Gut. Nat. Microbiol. 2025, 10, 112–125. [Google Scholar] [CrossRef] [PubMed]
- van Gogh, M.; Louwers, J.M.; Celli, A.; Gräve, S.; Viveen, M.C.; Bosch, S.; de Boer, N.K.H.; Verheijden, R.J.; Suijkerbuijk, K.P.M.; Brand, E.C.; et al. Next-Generation IgA-SEQ Allows for High-Throughput, Anaerobic, and Metagenomic Assessment of IgA-Coated Bacteria. Microbiome 2024, 12, 211. [Google Scholar] [CrossRef] [PubMed]
- Kondo, T.; Kondo, S.; Nakayama-Imaohji, H.; Tada, A.; Tabassum, N.; Munyeshyaka, E.; Koyano, K.; Nakamura, S.; Kusaka, T.; Kuwahara, T. Comparative Analysis of Mucosa-Associated and Luminal Gut Microbiota in Pediatric Ulcerative Colitis. Int. J. Mol. Sci. 2025, 26, 10775. [Google Scholar] [CrossRef] [PubMed]
- Png, C.W.; Lindén, S.K.; Gilshenan, K.S.; Zoetendal, E.G.; McSweeney, C.S.; Sly, L.I.; McGuckin, M.A.; Florin, T.H.J. Mucolytic Bacteria with Increased Prevalence in IBD Mucosa Augment in Vitro Utilization of Mucin by Other Bacteria. Am. J. Gastroenterol. 2010, 105, 2420–2428. [Google Scholar] [CrossRef] [PubMed]
- Tailford, L.E.; Crost, E.H.; Kavanaugh, D.; Juge, N. Mucin Glycan Foraging in the Human Gut Microbiome. Front Genet 2015, 6, 81. [Google Scholar] [CrossRef] [PubMed]
- Crost, E.H.; Coletto, E.; Bell, A.; Juge, N. Ruminococcus gnavus: Friend or Foe for Human Health. FEMS Microbiol. Rev. 2023, 47, fuad014. [Google Scholar] [CrossRef] [PubMed]
- Desai, M.S.; Seekatz, A.M.; Koropatkin, N.M.; Kamada, N.; Hickey, C.A.; Wolter, M.; Pudlo, N.A.; Kitamoto, S.; Terrapon, N.; Muller, A.; et al. A Dietary Fiber-Deprived Gut Microbiota Degrades the Colonic Mucus Barrier and Enhances Pathogen Susceptibility. Cell 2016, 167, 1339–1353.e21. [Google Scholar] [CrossRef] [PubMed]
- Kumbhari, A.; Cheng, T.N.H.; Ananthakrishnan, A.N.; Kochar, B.; Burke, K.E.; Shannon, K.; Lau, H.; Xavier, R.J.; Smillie, C.S. Discovery of Disease-Adapted Bacterial Lineages in Inflammatory Bowel Diseases. Cell Host Microbe 2024, 32, 1147–1162.e12. [Google Scholar] [CrossRef] [PubMed]
- Fadlallah, J.; Sterlin, D.; Fieschi, C.; Parizot, C.; Dorgham, K.; El Kafsi, H.; Autaa, G.; Ghillani-Dalbin, P.; Juste, C.; Lepage, P.; et al. Synergistic Convergence of Microbiota-Specific Systemic IgG and Secretory IgA. J. Allergy Clin. Immunol. 2019, 143, 1575–1585.e4. [Google Scholar] [CrossRef] [PubMed]
- Tabassum, N.; Nakayama-Imaohji, H.; Munyeshyaka, E.; Tada, A.; Kondo, T.; Kondo, S.; Kusaka, T.; Kuwahara, T. Reactivity of Autologous Serum IgG to Gut Microbes in Pediatric Ulcerative Colitis. Int. J. Mol. Sci. 2025, 26, 8196. [Google Scholar] [CrossRef] [PubMed]
- Shen, L.; Zhao, Y.; Liu, S.; Li, S.; Li, Q.; Tung, T.-H.; Shen, B. Changes in the Subdoligranulum Genus in Patients with Autoimmune Disease: A Systematic Review and Meta-Analysis. Front Immunol. 2025, 16, 1619160. [Google Scholar] [CrossRef] [PubMed]
- Chriswell, M.E.; Lefferts, A.R.; Clay, M.R.; Hsu, A.R.; Seifert, J.; Feser, M.L.; Rims, C.; Bloom, M.S.; Bemis, E.A.; Liu, S.; et al. Clonal IgA and IgG Autoantibodies from Individuals at Risk for Rheumatoid Arthritis Identify an Arthritogenic Strain of Subdoligranulum. Sci. Transl. Med. 2022, 14, eabn5166. [Google Scholar] [CrossRef] [PubMed]
- Van Hul, M.; Le Roy, T.; Prifti, E.; Dao, M.C.; Paquot, A.; Zucker, J.-D.; Delzenne, N.M.; Muccioli, G.; Clément, K.; Cani, P.D. From Correlation to Causality: The Case of Subdoligranulum. Gut Microbes 2020, 12, 1–13. [Google Scholar] [CrossRef] [PubMed]
- Eeckhaut, V.; Machiels, K.; Perrier, C.; Romero, C.; Maes, S.; Flahou, B.; Steppe, M.; Haesebrouck, F.; Sas, B.; Ducatelle, R.; et al. Butyricicoccus pullicaecorum in Inflammatory Bowel Disease. Gut 2013, 62, 1745–1752. [Google Scholar] [CrossRef] [PubMed]
- Boesmans, L.; Valles-Colomer, M.; Wang, J.; Eeckhaut, V.; Falony, G.; Ducatelle, R.; Van Immerseel, F.; Raes, J.; Verbeke, K. Butyrate Producers as Potential Next-Generation Probiotics: Safety Assessment of the Administration of Butyricicoccus pullicaecorum to Healthy Volunteers. mSystems 2018, 3. [Google Scholar] [CrossRef] [PubMed]
- Whitfield, C. Biosynthesis and Assembly of Capsular Polysaccharides in Escherichia coli. Annu. Rev. Biochem. 2006, 75, 39–68. [Google Scholar] [CrossRef] [PubMed]
- Comstock, L.E.; Kasper, D.L. Bacterial Glycans: Key Mediators of Diverse Host Immune Responses. Cell 2006, 126, 847–850. [Google Scholar] [CrossRef] [PubMed]
- Giraud, M.-F.; Naismith, J.H. The Rhamnose Pathway. Curr. Opin. Struct. Biol. 2000, 10, 687–696. [Google Scholar] [CrossRef] [PubMed]
- Franzosa, E.A.; Sirota-Madi, A.; Avila-Pacheco, J.; Fornelos, N.; Haiser, H.J.; Reinker, S.; Vatanen, T.; Hall, A.B.; Mallick, H.; McIver, L.J.; et al. Gut Microbiome Structure and Metabolic Activity in Inflammatory Bowel Disease. Nat. Microbiol. 2018, 4, 293–305. [Google Scholar] [CrossRef] [PubMed]
- Adolph, T.E.; Meyer, M.; Schwärzler, J.; Mayr, L.; Grabherr, F.; Tilg, H. The Metabolic Nature of Inflammatory Bowel Diseases. Nat. Rev. Gastroenterol. Hepatol. 2022, 19, 753–767. [Google Scholar] [CrossRef] [PubMed]
- Gloor, G.B.; Macklaim, J.M.; Pawlowsky-Glahn, V.; Egozcue, J.J. Microbiome Datasets Are Compositional: And This Is Not Optional. Front Microbiol. 2017, 8, 2224. [Google Scholar] [CrossRef] [PubMed]
Figure 1.
Correlation analysis between clinical parameters and autologous serum IgG binding rates against the gut microbiota. (A) Heatmap displaying Spearman's rank correlation coefficients (Rho) between various clinical parameters and the autologous serum IgG binding rate across the study cohort (n = 41). Values within the cells represent the corresponding correlation coefficients. The evaluated parameters include an Activity Index stratifying disease severity (Healthy = 1, Remission = 2, Active = 3). Cell colors indicate the direction and magnitude of the correlations: red represents positive correlations and blue represents negative correlations, with color intensity reflecting the strength of the association. (B) Correlation network plot of the clinical parameters. Nodes represent individual clinical parameters, and edges indicate pairwise correlations between variables (displayed only for |Rho| > 0.2). Edge colors (red lines for positive; blue lines for negative) and line thickness correspond to the magnitude of the correlation coefficients. The network demonstrates that disease activity-associated parameters, including the IgG binding rate, form a highly interconnected cluster centered on markers of clinical activity and systemic inflammation, such as CAI and CRP. Abbreviations: CAI, Clinical Activity Index; CRP, C-reactive protein; WBC, White blood cell; RBC, Red blood cell; PLT, Platelets; Hb, Hemoglobin; Ht, Hematocrit; ALB, Albumin; Tcho, Total cholesterol; Tbil, Total bilirubin; AST, Aspartate aminotransferase; ALT, Alanine aminotransferase; ALP, Alkaline phosphatase; γGTP, γ-glutamyl transpeptidase; LDH, Lactate dehydrogenase; AMY, Amylase.
Figure 1.
Correlation analysis between clinical parameters and autologous serum IgG binding rates against the gut microbiota. (A) Heatmap displaying Spearman's rank correlation coefficients (Rho) between various clinical parameters and the autologous serum IgG binding rate across the study cohort (n = 41). Values within the cells represent the corresponding correlation coefficients. The evaluated parameters include an Activity Index stratifying disease severity (Healthy = 1, Remission = 2, Active = 3). Cell colors indicate the direction and magnitude of the correlations: red represents positive correlations and blue represents negative correlations, with color intensity reflecting the strength of the association. (B) Correlation network plot of the clinical parameters. Nodes represent individual clinical parameters, and edges indicate pairwise correlations between variables (displayed only for |Rho| > 0.2). Edge colors (red lines for positive; blue lines for negative) and line thickness correspond to the magnitude of the correlation coefficients. The network demonstrates that disease activity-associated parameters, including the IgG binding rate, form a highly interconnected cluster centered on markers of clinical activity and systemic inflammation, such as CAI and CRP. Abbreviations: CAI, Clinical Activity Index; CRP, C-reactive protein; WBC, White blood cell; RBC, Red blood cell; PLT, Platelets; Hb, Hemoglobin; Ht, Hematocrit; ALB, Albumin; Tcho, Total cholesterol; Tbil, Total bilirubin; AST, Aspartate aminotransferase; ALT, Alanine aminotransferase; ALP, Alkaline phosphatase; γGTP, γ-glutamyl transpeptidase; LDH, Lactate dehydrogenase; AMY, Amylase.
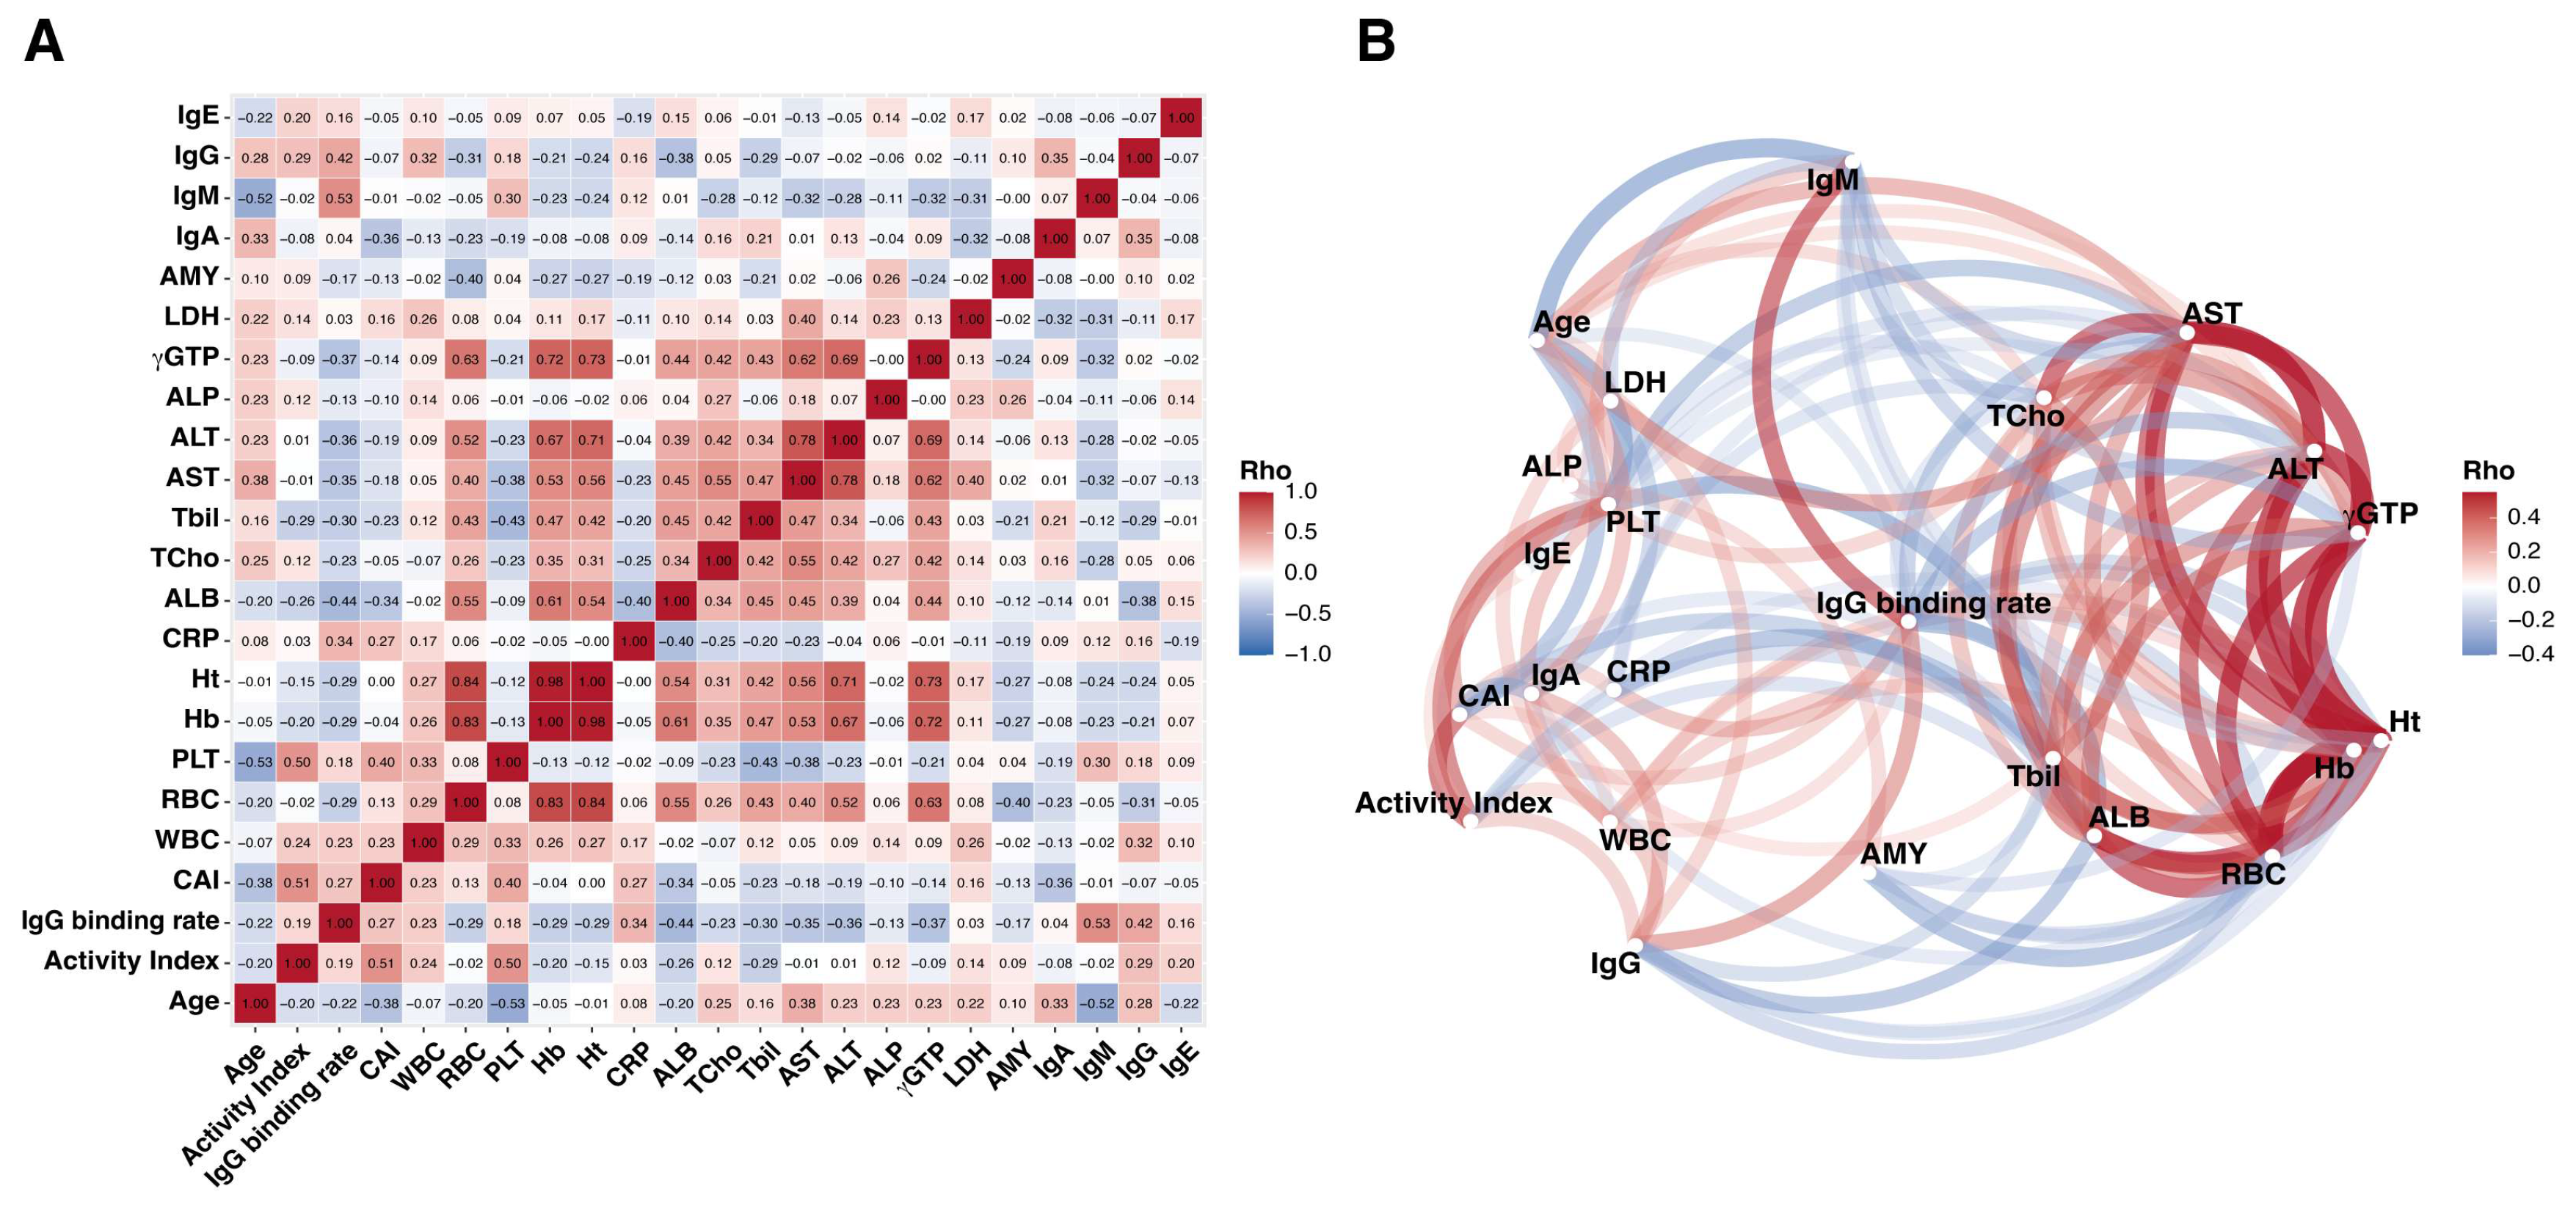
Figure 2.
Comparative analysis of gut microbiota diversity and community structure between the feces and autologous serum IgG-bound fractions. (A) Comparison of α-diversity, assessed via the Chao1 index, among healthy participants (HP_F: healthy feces fraction, n = 4; HP_IgG+: healthy IgG-bound fraction, n = 4) and patients with ulcerative colitis (UC_F: UC feces fraction, n = 37; UC_IgG+: UC IgG-bound fraction, n = 37). Data are presented as violin plots and box plots (indicating the median and interquartile range), overlaid with dots representing individual sample measurements. Statistical significance between groups was evaluated using the Wilcoxon test (Wilcoxon signed-rank test for paired comparisons between fractions, and Wilcoxon rank-sum test for independent group comparisons). Asterisks denote statistical significance (*p < 0.05, **p < 0.01, ***p < 0.001, ****p < 0.0001). (B–D) Principal coordinate analysis (PCoA) plots illustrating the β-diversity of the gut microbiota. The p-values within each plot indicate the results of statistical testing for differences in community structure using permutational multivariate analysis of variance (PERMANOVA). The circles indicate 95% confidece range for each group, respectively. (B) Comparison of community structure between the fractions (Feces vs. IgG+) across all samples (total n = 82) from healthy participants (HP_F: n = 4, HP_IgG+: n = 4) and patients with UC (UC_F: n = 37, UC_IgG+: n = 37). Each dot is color-coded according to the disease group (HP or UC) and fraction type (Feces or IgG+). (C) Comparison of community structure between the feces and IgG-bound fractions (Feces vs. IgG+). Each dot is color-coded according to the fraction type (Feces or IgG+). (D) Comparison of community structure based on disease status (HP vs. UC). Each dot is color-coded according to the disease group (HP or UC).
Figure 2.
Comparative analysis of gut microbiota diversity and community structure between the feces and autologous serum IgG-bound fractions. (A) Comparison of α-diversity, assessed via the Chao1 index, among healthy participants (HP_F: healthy feces fraction, n = 4; HP_IgG+: healthy IgG-bound fraction, n = 4) and patients with ulcerative colitis (UC_F: UC feces fraction, n = 37; UC_IgG+: UC IgG-bound fraction, n = 37). Data are presented as violin plots and box plots (indicating the median and interquartile range), overlaid with dots representing individual sample measurements. Statistical significance between groups was evaluated using the Wilcoxon test (Wilcoxon signed-rank test for paired comparisons between fractions, and Wilcoxon rank-sum test for independent group comparisons). Asterisks denote statistical significance (*p < 0.05, **p < 0.01, ***p < 0.001, ****p < 0.0001). (B–D) Principal coordinate analysis (PCoA) plots illustrating the β-diversity of the gut microbiota. The p-values within each plot indicate the results of statistical testing for differences in community structure using permutational multivariate analysis of variance (PERMANOVA). The circles indicate 95% confidece range for each group, respectively. (B) Comparison of community structure between the fractions (Feces vs. IgG+) across all samples (total n = 82) from healthy participants (HP_F: n = 4, HP_IgG+: n = 4) and patients with UC (UC_F: n = 37, UC_IgG+: n = 37). Each dot is color-coded according to the disease group (HP or UC) and fraction type (Feces or IgG+). (C) Comparison of community structure between the feces and IgG-bound fractions (Feces vs. IgG+). Each dot is color-coded according to the fraction type (Feces or IgG+). (D) Comparison of community structure based on disease status (HP vs. UC). Each dot is color-coded according to the disease group (HP or UC).
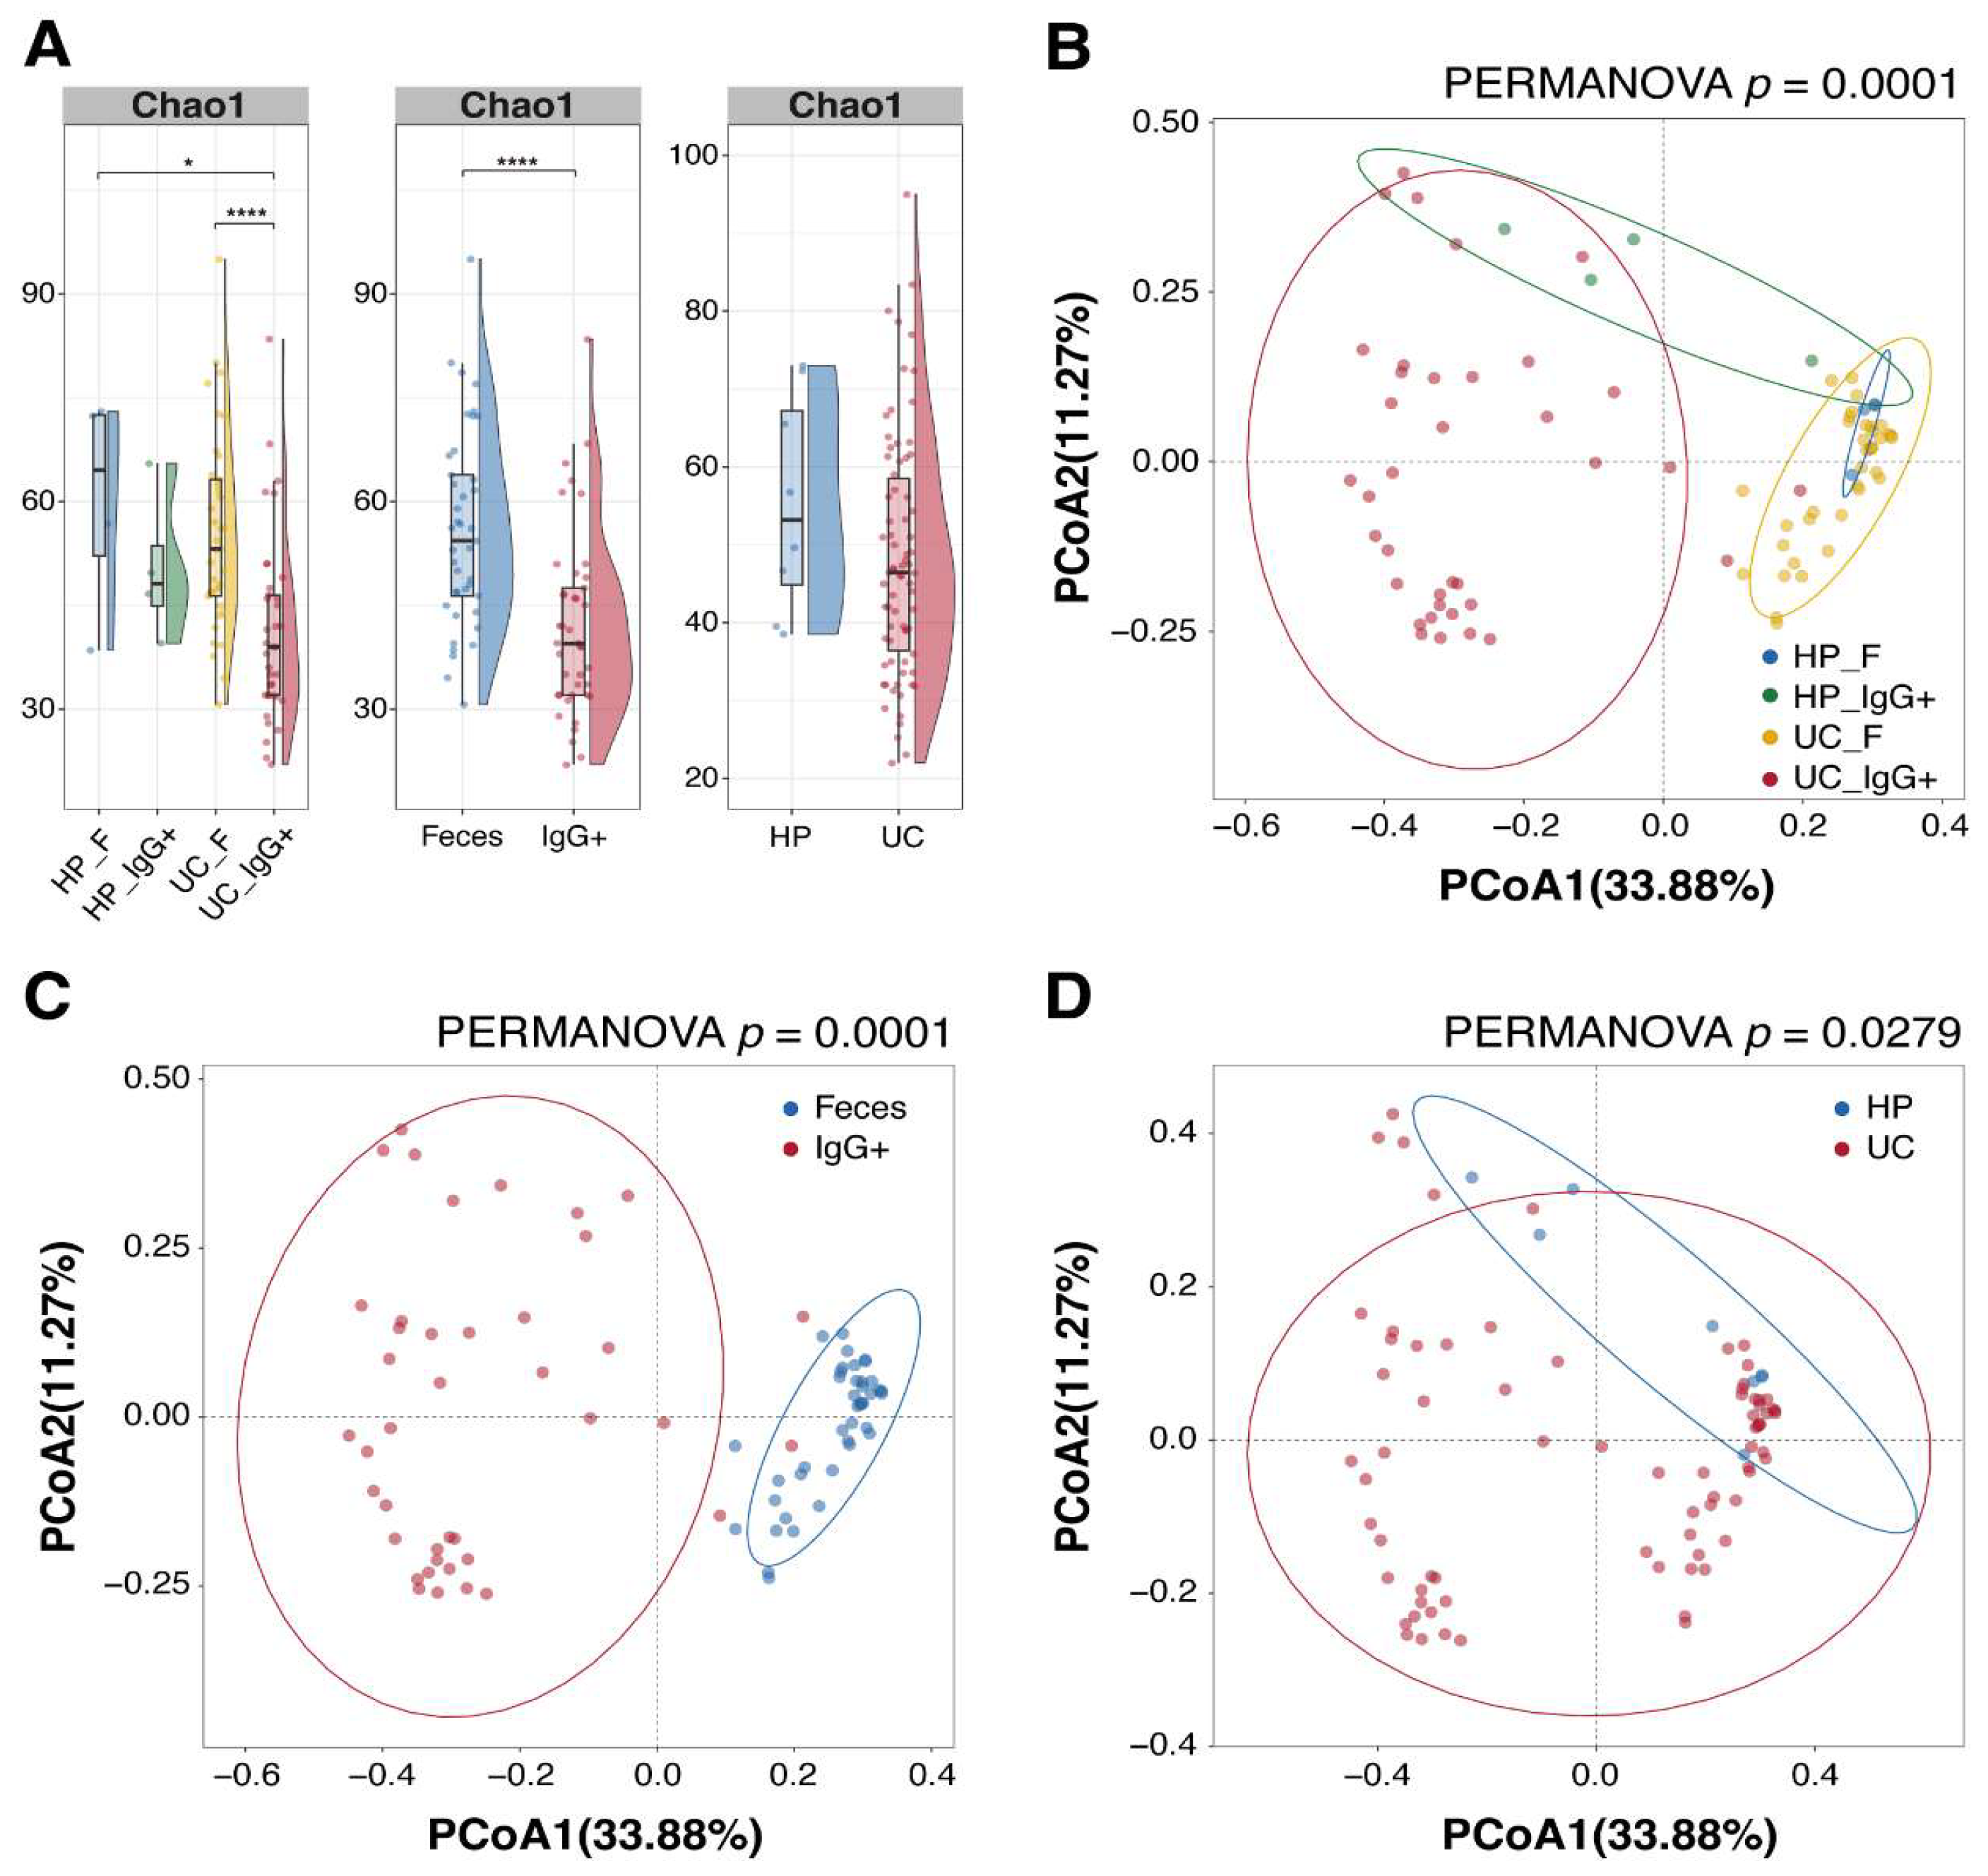
Figure 3.
Association analysis of clinical parameters and the IgG binding rate with gut bacterial taxa in the feces fraction. (A) Heatmap illustrating the results of univariate association analyses (MaAsLin2) between various clinical parameters and the relative abundance of bacterial genera in the feces fraction. Only bacterial taxa exhibiting a statistically significant association (p < 0.05) with at least one clinical variable are included. Cell colors denote the regression coefficients derived from the MaAsLin2 models, with red indicating a positive association and blue indicating a negative association; color intensity reflects the effect size. Rows (bacterial genera) and columns (clinical metadata) are ordered via hierarchical clustering based on the similarity of their abundance profiles. The definitions of the clinical parameters presented in the columns and the reference levels used for categorical contrasts are as follows: Activity index represents an index stratifying disease severity (Healthy = 1, Remission = 2, Active = 3). For categorical contrasts, Gender evaluates the association in males relative to females; IgG binding rate 20-40% and IgG binding rate >40% evaluate associations relative to the <20% reference group among the three IgG binding rate strata (<20%, 20-40%, and >40%); and UC/HP evaluates the association in patients with ulcerative colitis relative to healthy controls. Additionally, IgG binding rate represents the measured total IgG binding rate as a continuous variable. Abbreviations: CAI, Clinical Activity Index; CRP, C-reactive protein; WBC, White blood cell; RBC, Red blood cell; PLT, Platelets; Hb, Hemoglobin; Ht, Hematocrit; ALB, Albumin; Tcho, Total cholesterol; Tbil, Total bilirubin; AST, Aspartate aminotransferase; ALT, Alanine aminotransferase; ALP, Alkaline phosphatase; γGTP, γ-glutamyl transpeptidase; LDH, Lactate dehydrogenase; AMY, Amylase. (B) Forest plot illustrating bacterial taxa that exhibited significant associations (p < 0.05) with the IgG binding rate in the feces fraction, based on multivariable models adjusted for confounding variables. In this analysis, local clinical activity (CAI) and patient demographics (age and sex) were incorporated into the models as covariates. Each dot represents a regression coefficient (effect size), and horizontal error bars denote 95% confidence intervals. Red indicates an independent positive association with the IgG binding rate, whereas blue indicates a negative association.
Figure 3.
Association analysis of clinical parameters and the IgG binding rate with gut bacterial taxa in the feces fraction. (A) Heatmap illustrating the results of univariate association analyses (MaAsLin2) between various clinical parameters and the relative abundance of bacterial genera in the feces fraction. Only bacterial taxa exhibiting a statistically significant association (p < 0.05) with at least one clinical variable are included. Cell colors denote the regression coefficients derived from the MaAsLin2 models, with red indicating a positive association and blue indicating a negative association; color intensity reflects the effect size. Rows (bacterial genera) and columns (clinical metadata) are ordered via hierarchical clustering based on the similarity of their abundance profiles. The definitions of the clinical parameters presented in the columns and the reference levels used for categorical contrasts are as follows: Activity index represents an index stratifying disease severity (Healthy = 1, Remission = 2, Active = 3). For categorical contrasts, Gender evaluates the association in males relative to females; IgG binding rate 20-40% and IgG binding rate >40% evaluate associations relative to the <20% reference group among the three IgG binding rate strata (<20%, 20-40%, and >40%); and UC/HP evaluates the association in patients with ulcerative colitis relative to healthy controls. Additionally, IgG binding rate represents the measured total IgG binding rate as a continuous variable. Abbreviations: CAI, Clinical Activity Index; CRP, C-reactive protein; WBC, White blood cell; RBC, Red blood cell; PLT, Platelets; Hb, Hemoglobin; Ht, Hematocrit; ALB, Albumin; Tcho, Total cholesterol; Tbil, Total bilirubin; AST, Aspartate aminotransferase; ALT, Alanine aminotransferase; ALP, Alkaline phosphatase; γGTP, γ-glutamyl transpeptidase; LDH, Lactate dehydrogenase; AMY, Amylase. (B) Forest plot illustrating bacterial taxa that exhibited significant associations (p < 0.05) with the IgG binding rate in the feces fraction, based on multivariable models adjusted for confounding variables. In this analysis, local clinical activity (CAI) and patient demographics (age and sex) were incorporated into the models as covariates. Each dot represents a regression coefficient (effect size), and horizontal error bars denote 95% confidence intervals. Red indicates an independent positive association with the IgG binding rate, whereas blue indicates a negative association.
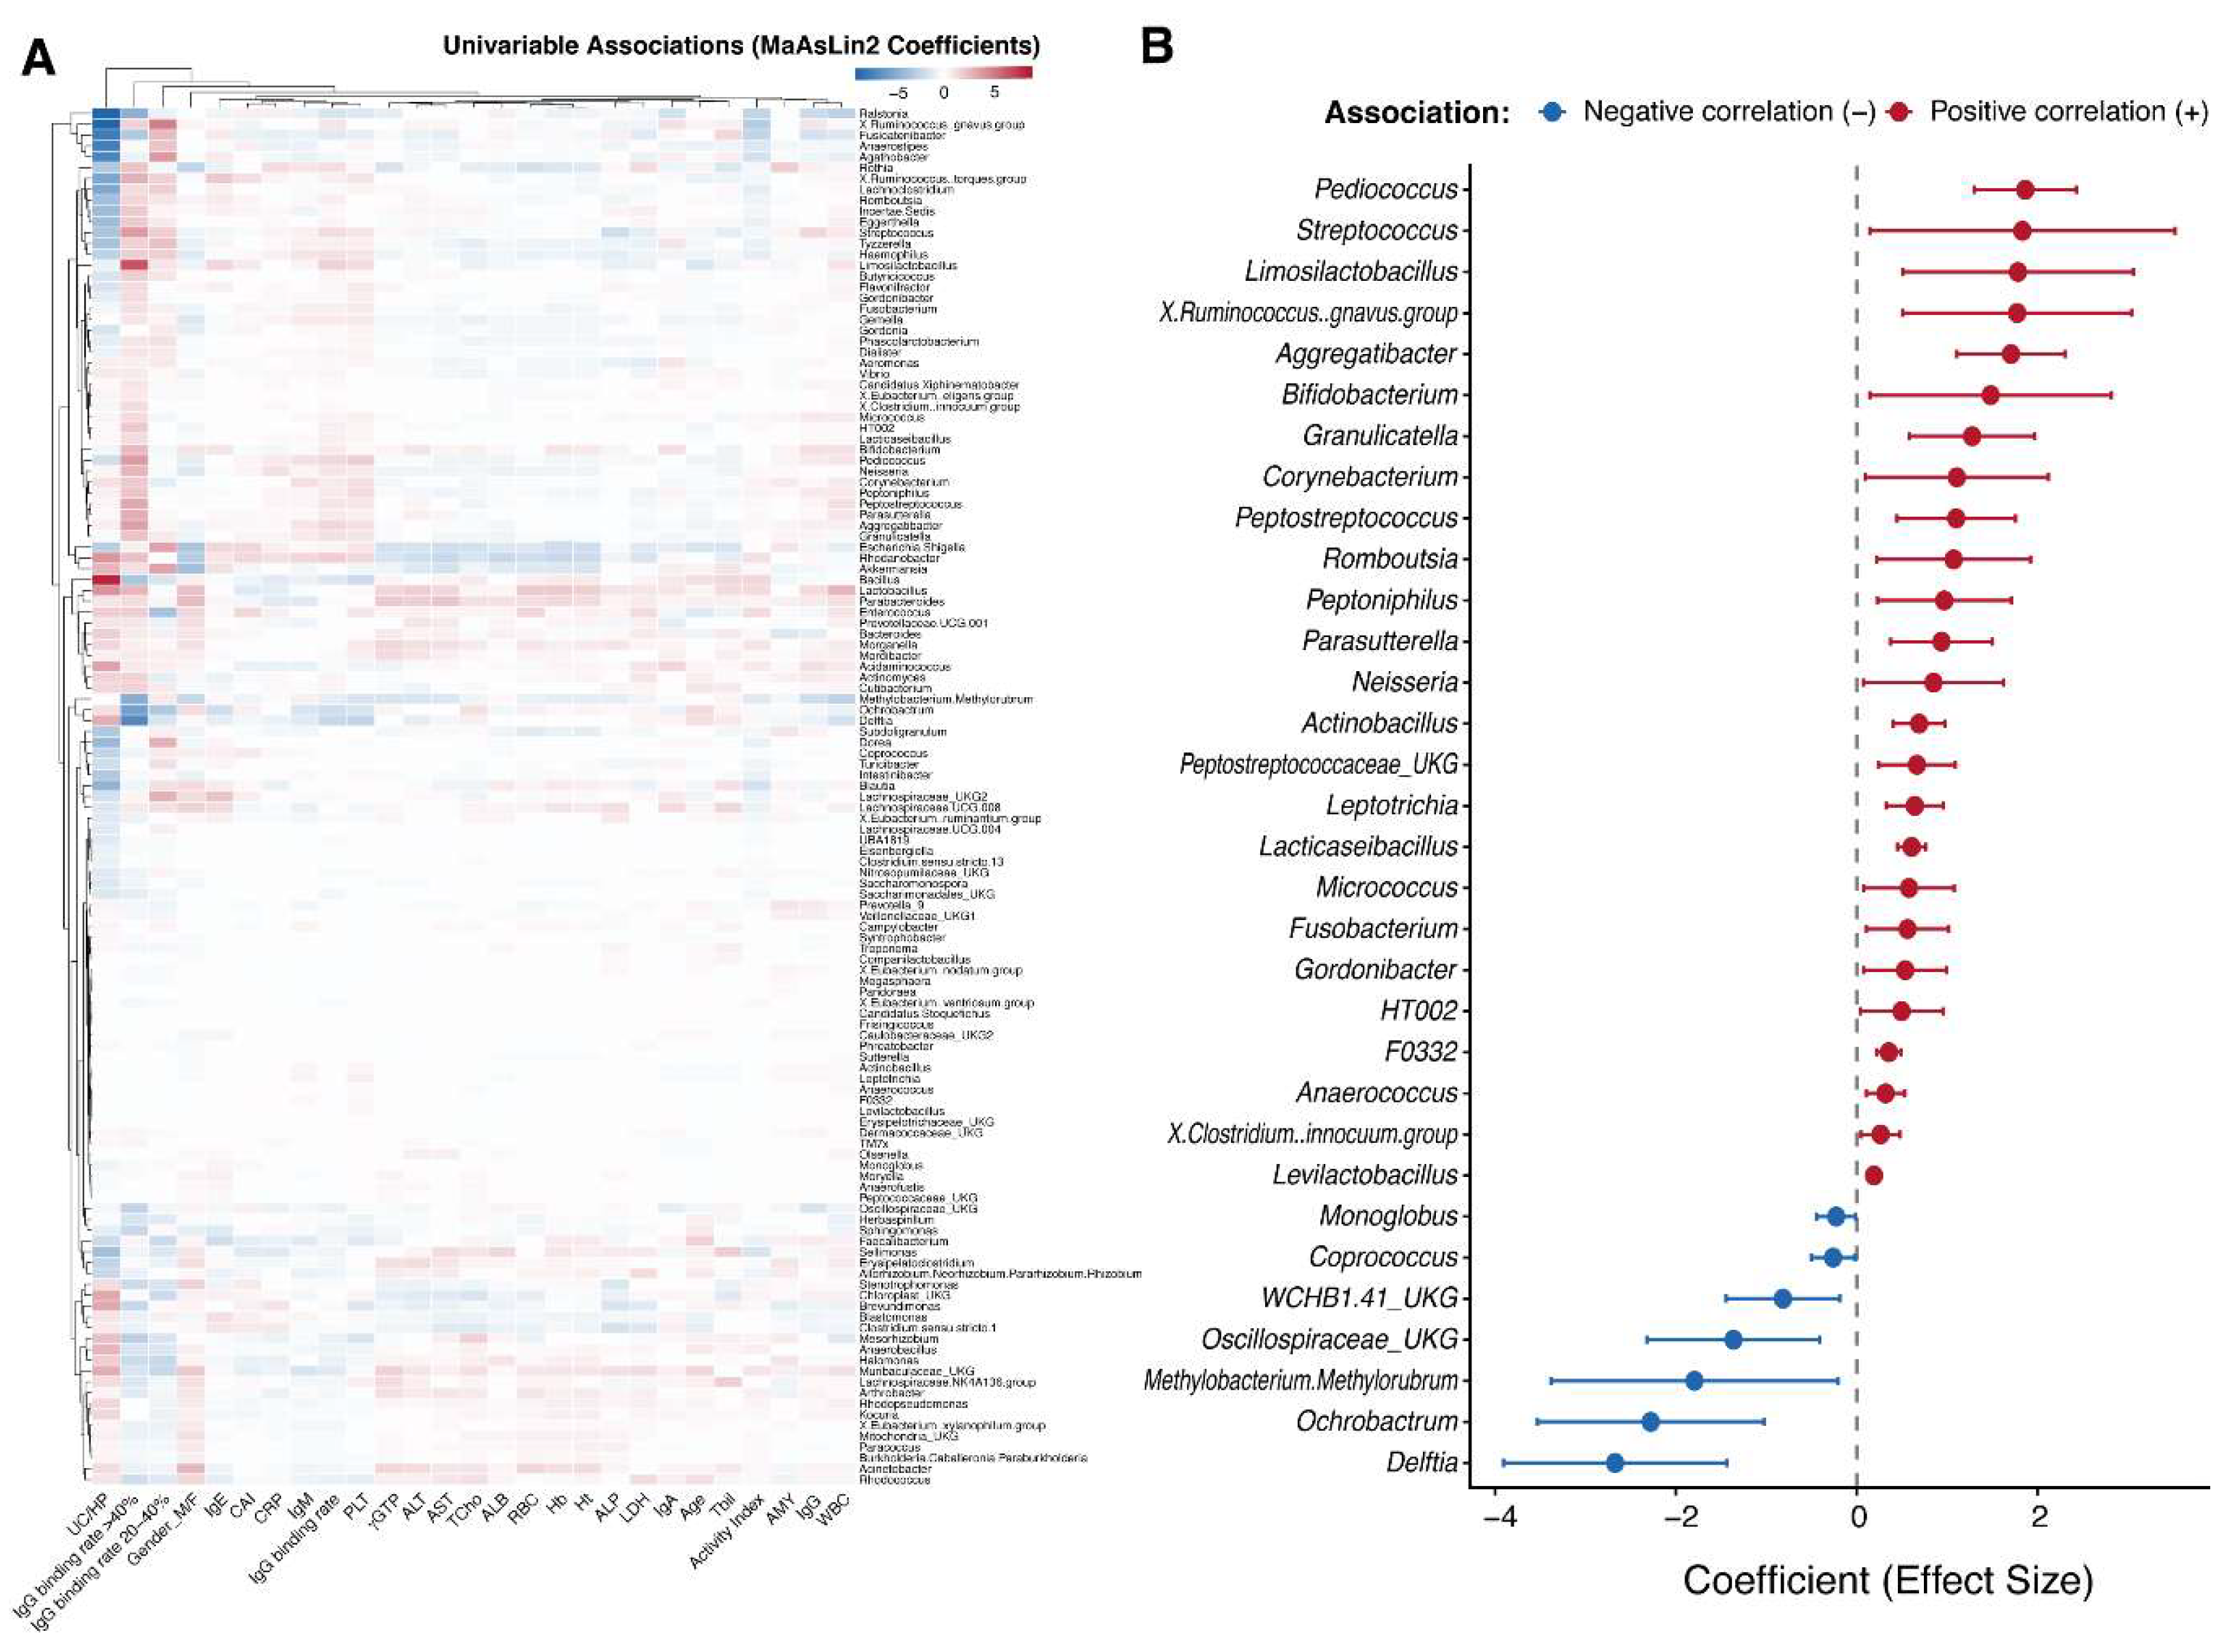
Figure 4.
Association analysis of clinical parameters and the IgG binding rate with gut bacterial taxa in the autologous serum IgG-bound (IgG+) fraction. (A) Heatmap illustrating the results of univariate association analyses (MaAsLin2) between various clinical parameters and the enrichment of specific bacterial taxa in the IgG-bound fraction. Only bacterial taxa exhibiting a statistically significant association (p < 0.05) with at least one clinical variable are included. Cell colors denote the regression coefficients, with red indicating a positive association and blue indicating a negative association. Rows and columns are ordered via hierarchical clustering. The definitions of the clinical parameters presented in the columns and the reference levels used for categorical contrasts are as follows: Activity index represents an index stratifying disease severity (Healthy = 1, Remission = 2, Active = 3). For categorical contrasts, Gender evaluates the association in males relative to females; IgG binding rate 20-40% and IgG binding rate >40% evaluate associations relative to the <20% reference group among the three IgG binding rate strata (<20%, 20-40%, and >40%); and UC/HP evaluates the association in patients with ulcerative colitis relative to healthy controls. Additionally, IgG binding rate represents the measured total IgG binding rate as a continuous variable. Abbreviations: CAI, Clinical Activity Index; CRP, C-reactive protein; WBC, White blood cell; RBC, Red blood cell; PLT, Platelets; Hb, Hemoglobin; Ht, Hematocrit; ALB, Albumin; Tcho, Total cholesterol; Tbil, Total bilirubin; AST, Aspartate aminotransferase; ALT, Alanine aminotransferase; ALP, Alkaline phosphatase; γGTP, γ-glutamyl transpeptidase; LDH, Lactate dehydrogenase; AMY, Amylase. (B) Forest plot illustrating bacterial genera that exhibited significant associations (p < 0.05) with the IgG binding rate in the IgG-bound fraction, based on multivariable models adjusted for confounding factors. Similar to the analysis of the feces fraction (B), local clinical activity (CAI), age, and sex were incorporated as covariates. Each dot represents a regression coefficient (effect size), and horizontal error bars denote 95% confidence intervals. Red indicates an independent positive association with the IgG binding rate, whereas blue indicates a negative association.
Figure 4.
Association analysis of clinical parameters and the IgG binding rate with gut bacterial taxa in the autologous serum IgG-bound (IgG+) fraction. (A) Heatmap illustrating the results of univariate association analyses (MaAsLin2) between various clinical parameters and the enrichment of specific bacterial taxa in the IgG-bound fraction. Only bacterial taxa exhibiting a statistically significant association (p < 0.05) with at least one clinical variable are included. Cell colors denote the regression coefficients, with red indicating a positive association and blue indicating a negative association. Rows and columns are ordered via hierarchical clustering. The definitions of the clinical parameters presented in the columns and the reference levels used for categorical contrasts are as follows: Activity index represents an index stratifying disease severity (Healthy = 1, Remission = 2, Active = 3). For categorical contrasts, Gender evaluates the association in males relative to females; IgG binding rate 20-40% and IgG binding rate >40% evaluate associations relative to the <20% reference group among the three IgG binding rate strata (<20%, 20-40%, and >40%); and UC/HP evaluates the association in patients with ulcerative colitis relative to healthy controls. Additionally, IgG binding rate represents the measured total IgG binding rate as a continuous variable. Abbreviations: CAI, Clinical Activity Index; CRP, C-reactive protein; WBC, White blood cell; RBC, Red blood cell; PLT, Platelets; Hb, Hemoglobin; Ht, Hematocrit; ALB, Albumin; Tcho, Total cholesterol; Tbil, Total bilirubin; AST, Aspartate aminotransferase; ALT, Alanine aminotransferase; ALP, Alkaline phosphatase; γGTP, γ-glutamyl transpeptidase; LDH, Lactate dehydrogenase; AMY, Amylase. (B) Forest plot illustrating bacterial genera that exhibited significant associations (p < 0.05) with the IgG binding rate in the IgG-bound fraction, based on multivariable models adjusted for confounding factors. Similar to the analysis of the feces fraction (B), local clinical activity (CAI), age, and sex were incorporated as covariates. Each dot represents a regression coefficient (effect size), and horizontal error bars denote 95% confidence intervals. Red indicates an independent positive association with the IgG binding rate, whereas blue indicates a negative association.
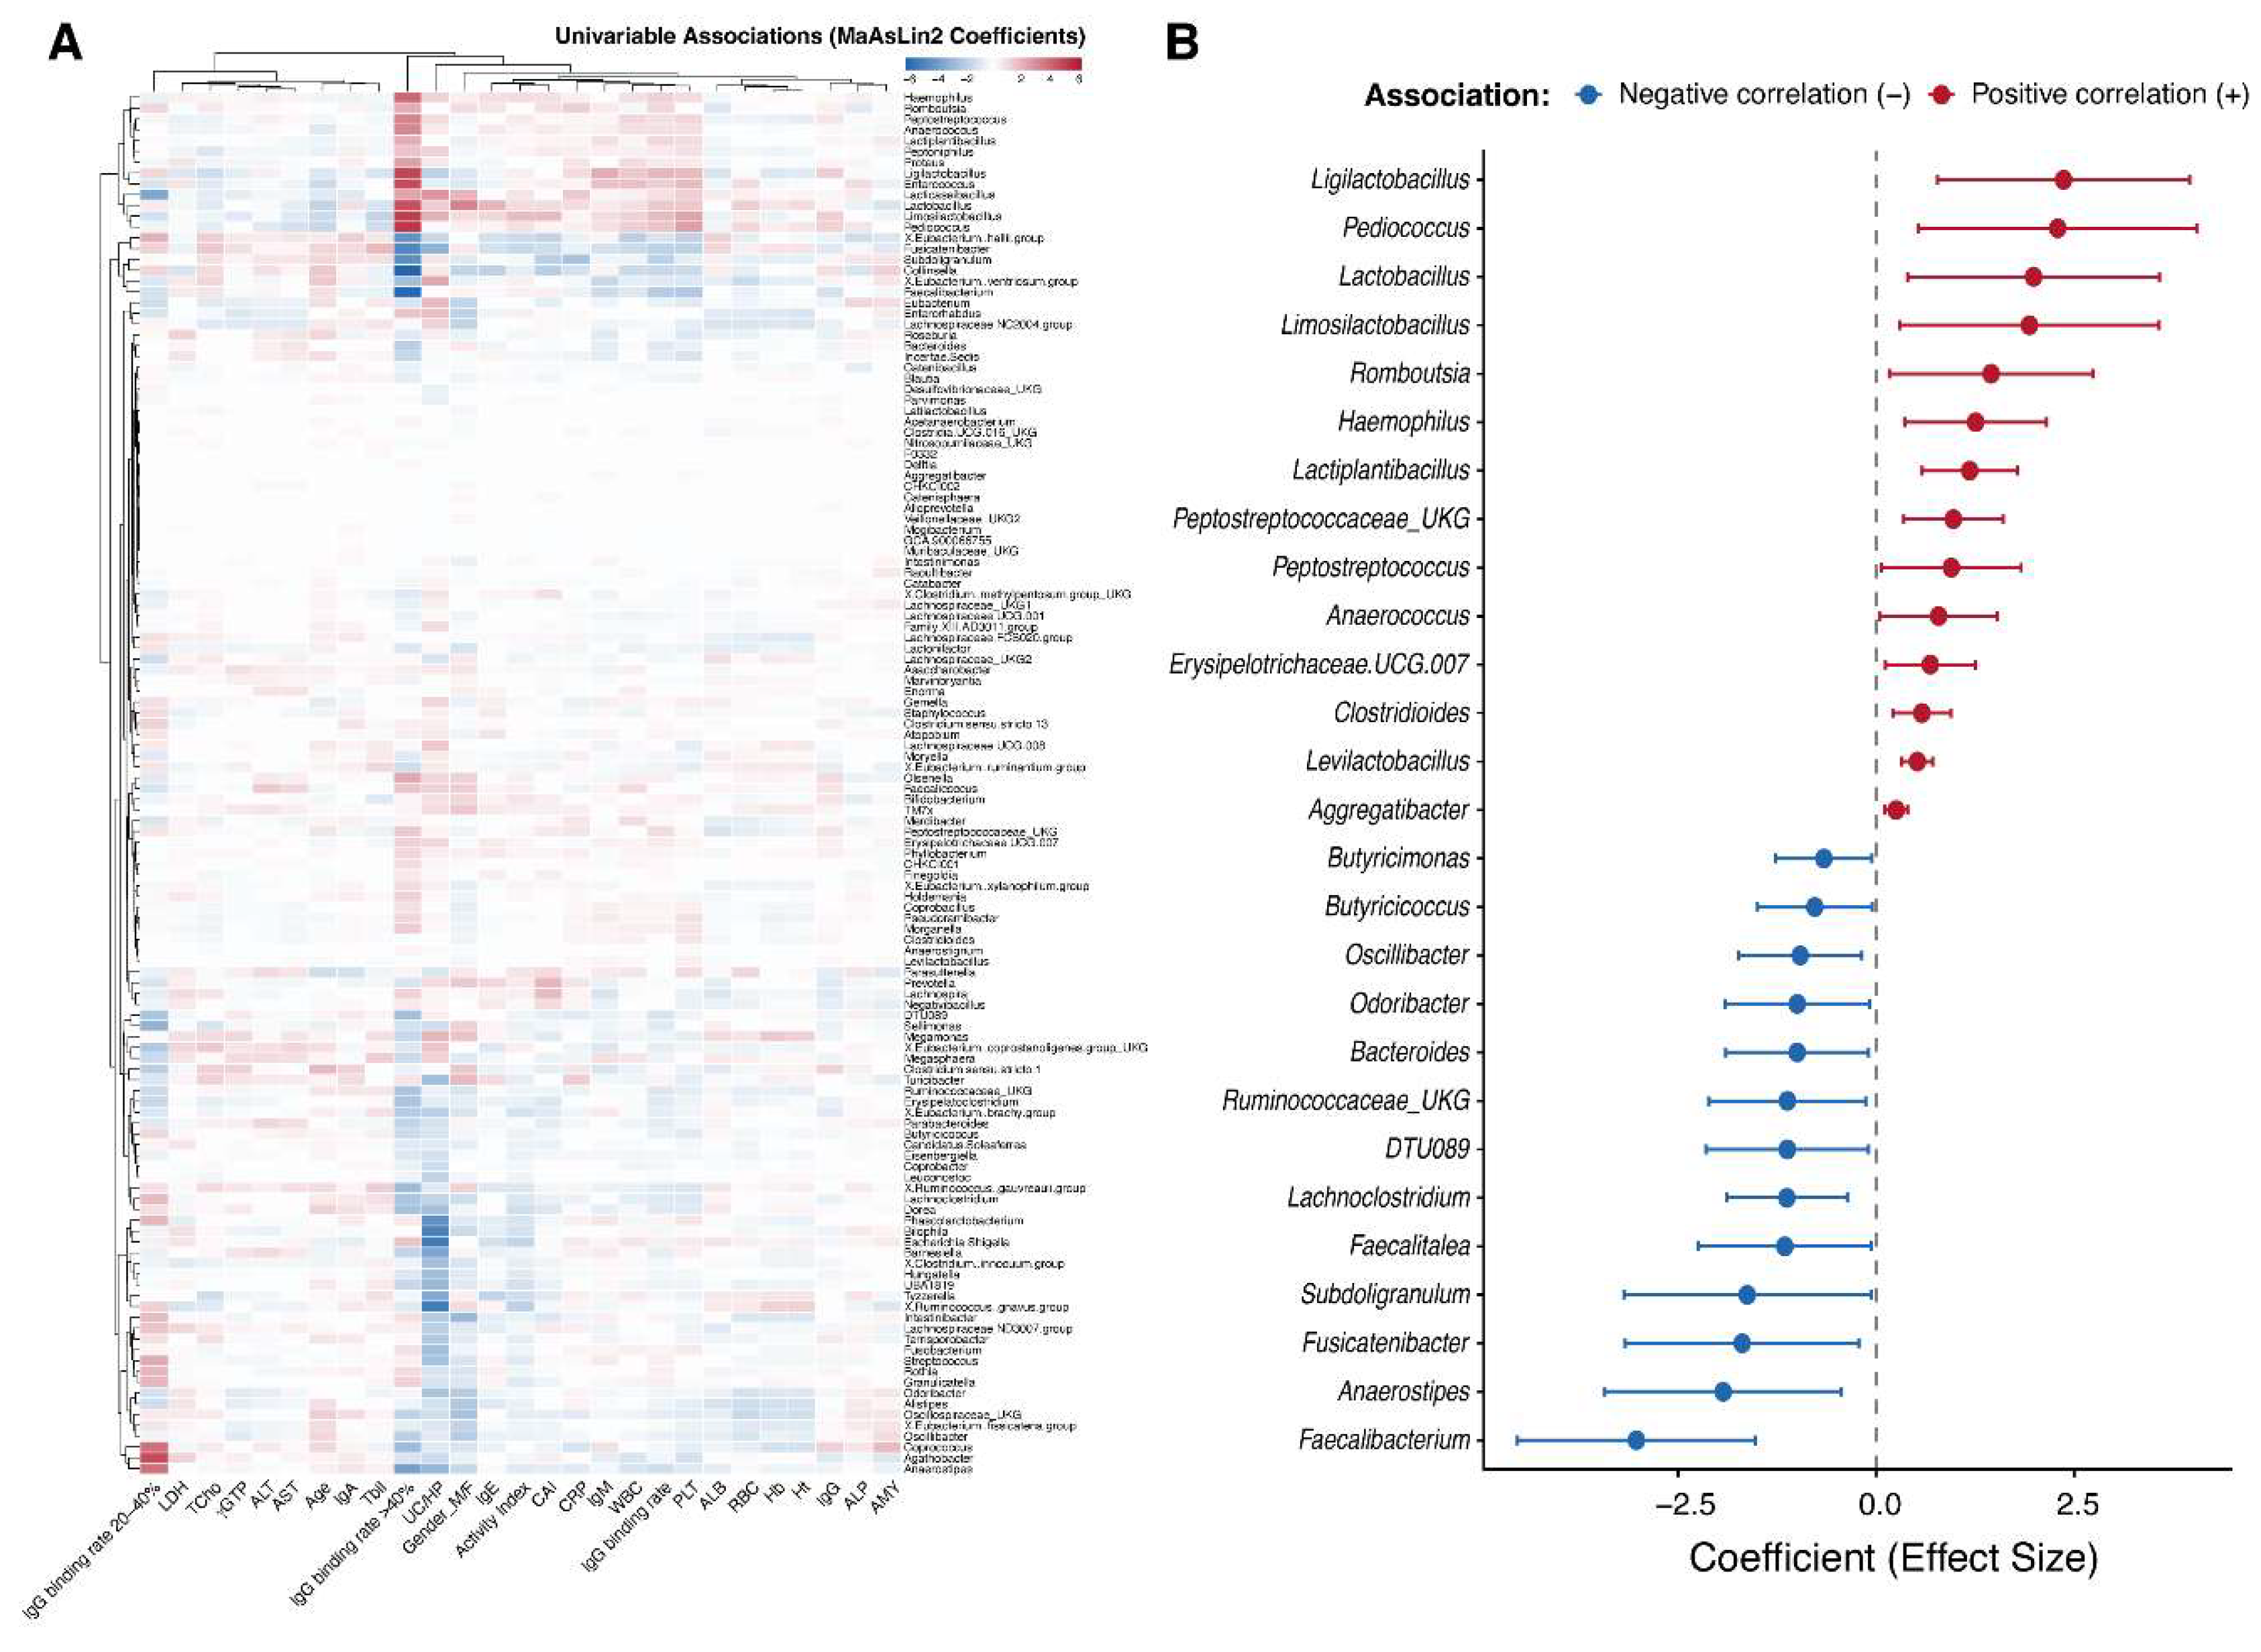
Figure 5.
Variations in the IgG+ Probability Score (IPS) of gut bacterial taxa based on the stratification of clinical parameters. Log2 fold changes of the IPS for each bacterial taxon between the two groups in the UC cohort, stratified by clinical parameters. The IPS mathematically integrates the sample-specific IgG binding rate to correct for background bacterial abundance bias, robustly reflecting the relative targeting of each taxon by systemic IgG. On the x-axis, a positive log2 fold change (right side) indicates a higher IPS in the corresponding exacerbation or high-value group, whereas a negative value (left side) indicates a higher IPS in the control (remission or low-value) group. The criteria used for the dichotomous stratification of the evaluated clinical parameters are as follows: disease activity was classified into active and remission phases; the Clinical Activity Index (CAI) was divided into high (> 3) and low (≤ 3) groups; and C-reactive protein (CRP) was divided into high (> 0.3 mg/dL) and low (≤ 0.3 mg/dL) groups based on the clinical reference value. Statistical significance between groups was evaluated using the Wilcoxon rank-sum test, with the size of each dot reflecting the level of significance (-log10 p-value). Taxa exhibiting statistically significant variations (p < 0.05 and |log2 fold change| ≥ 1) are highlighted in colors corresponding to their direction of change, whereas those lacking significant differences under a given condition are shown in gray.
Figure 5.
Variations in the IgG+ Probability Score (IPS) of gut bacterial taxa based on the stratification of clinical parameters. Log2 fold changes of the IPS for each bacterial taxon between the two groups in the UC cohort, stratified by clinical parameters. The IPS mathematically integrates the sample-specific IgG binding rate to correct for background bacterial abundance bias, robustly reflecting the relative targeting of each taxon by systemic IgG. On the x-axis, a positive log2 fold change (right side) indicates a higher IPS in the corresponding exacerbation or high-value group, whereas a negative value (left side) indicates a higher IPS in the control (remission or low-value) group. The criteria used for the dichotomous stratification of the evaluated clinical parameters are as follows: disease activity was classified into active and remission phases; the Clinical Activity Index (CAI) was divided into high (> 3) and low (≤ 3) groups; and C-reactive protein (CRP) was divided into high (> 0.3 mg/dL) and low (≤ 0.3 mg/dL) groups based on the clinical reference value. Statistical significance between groups was evaluated using the Wilcoxon rank-sum test, with the size of each dot reflecting the level of significance (-log10 p-value). Taxa exhibiting statistically significant variations (p < 0.05 and |log2 fold change| ≥ 1) are highlighted in colors corresponding to their direction of change, whereas those lacking significant differences under a given condition are shown in gray.
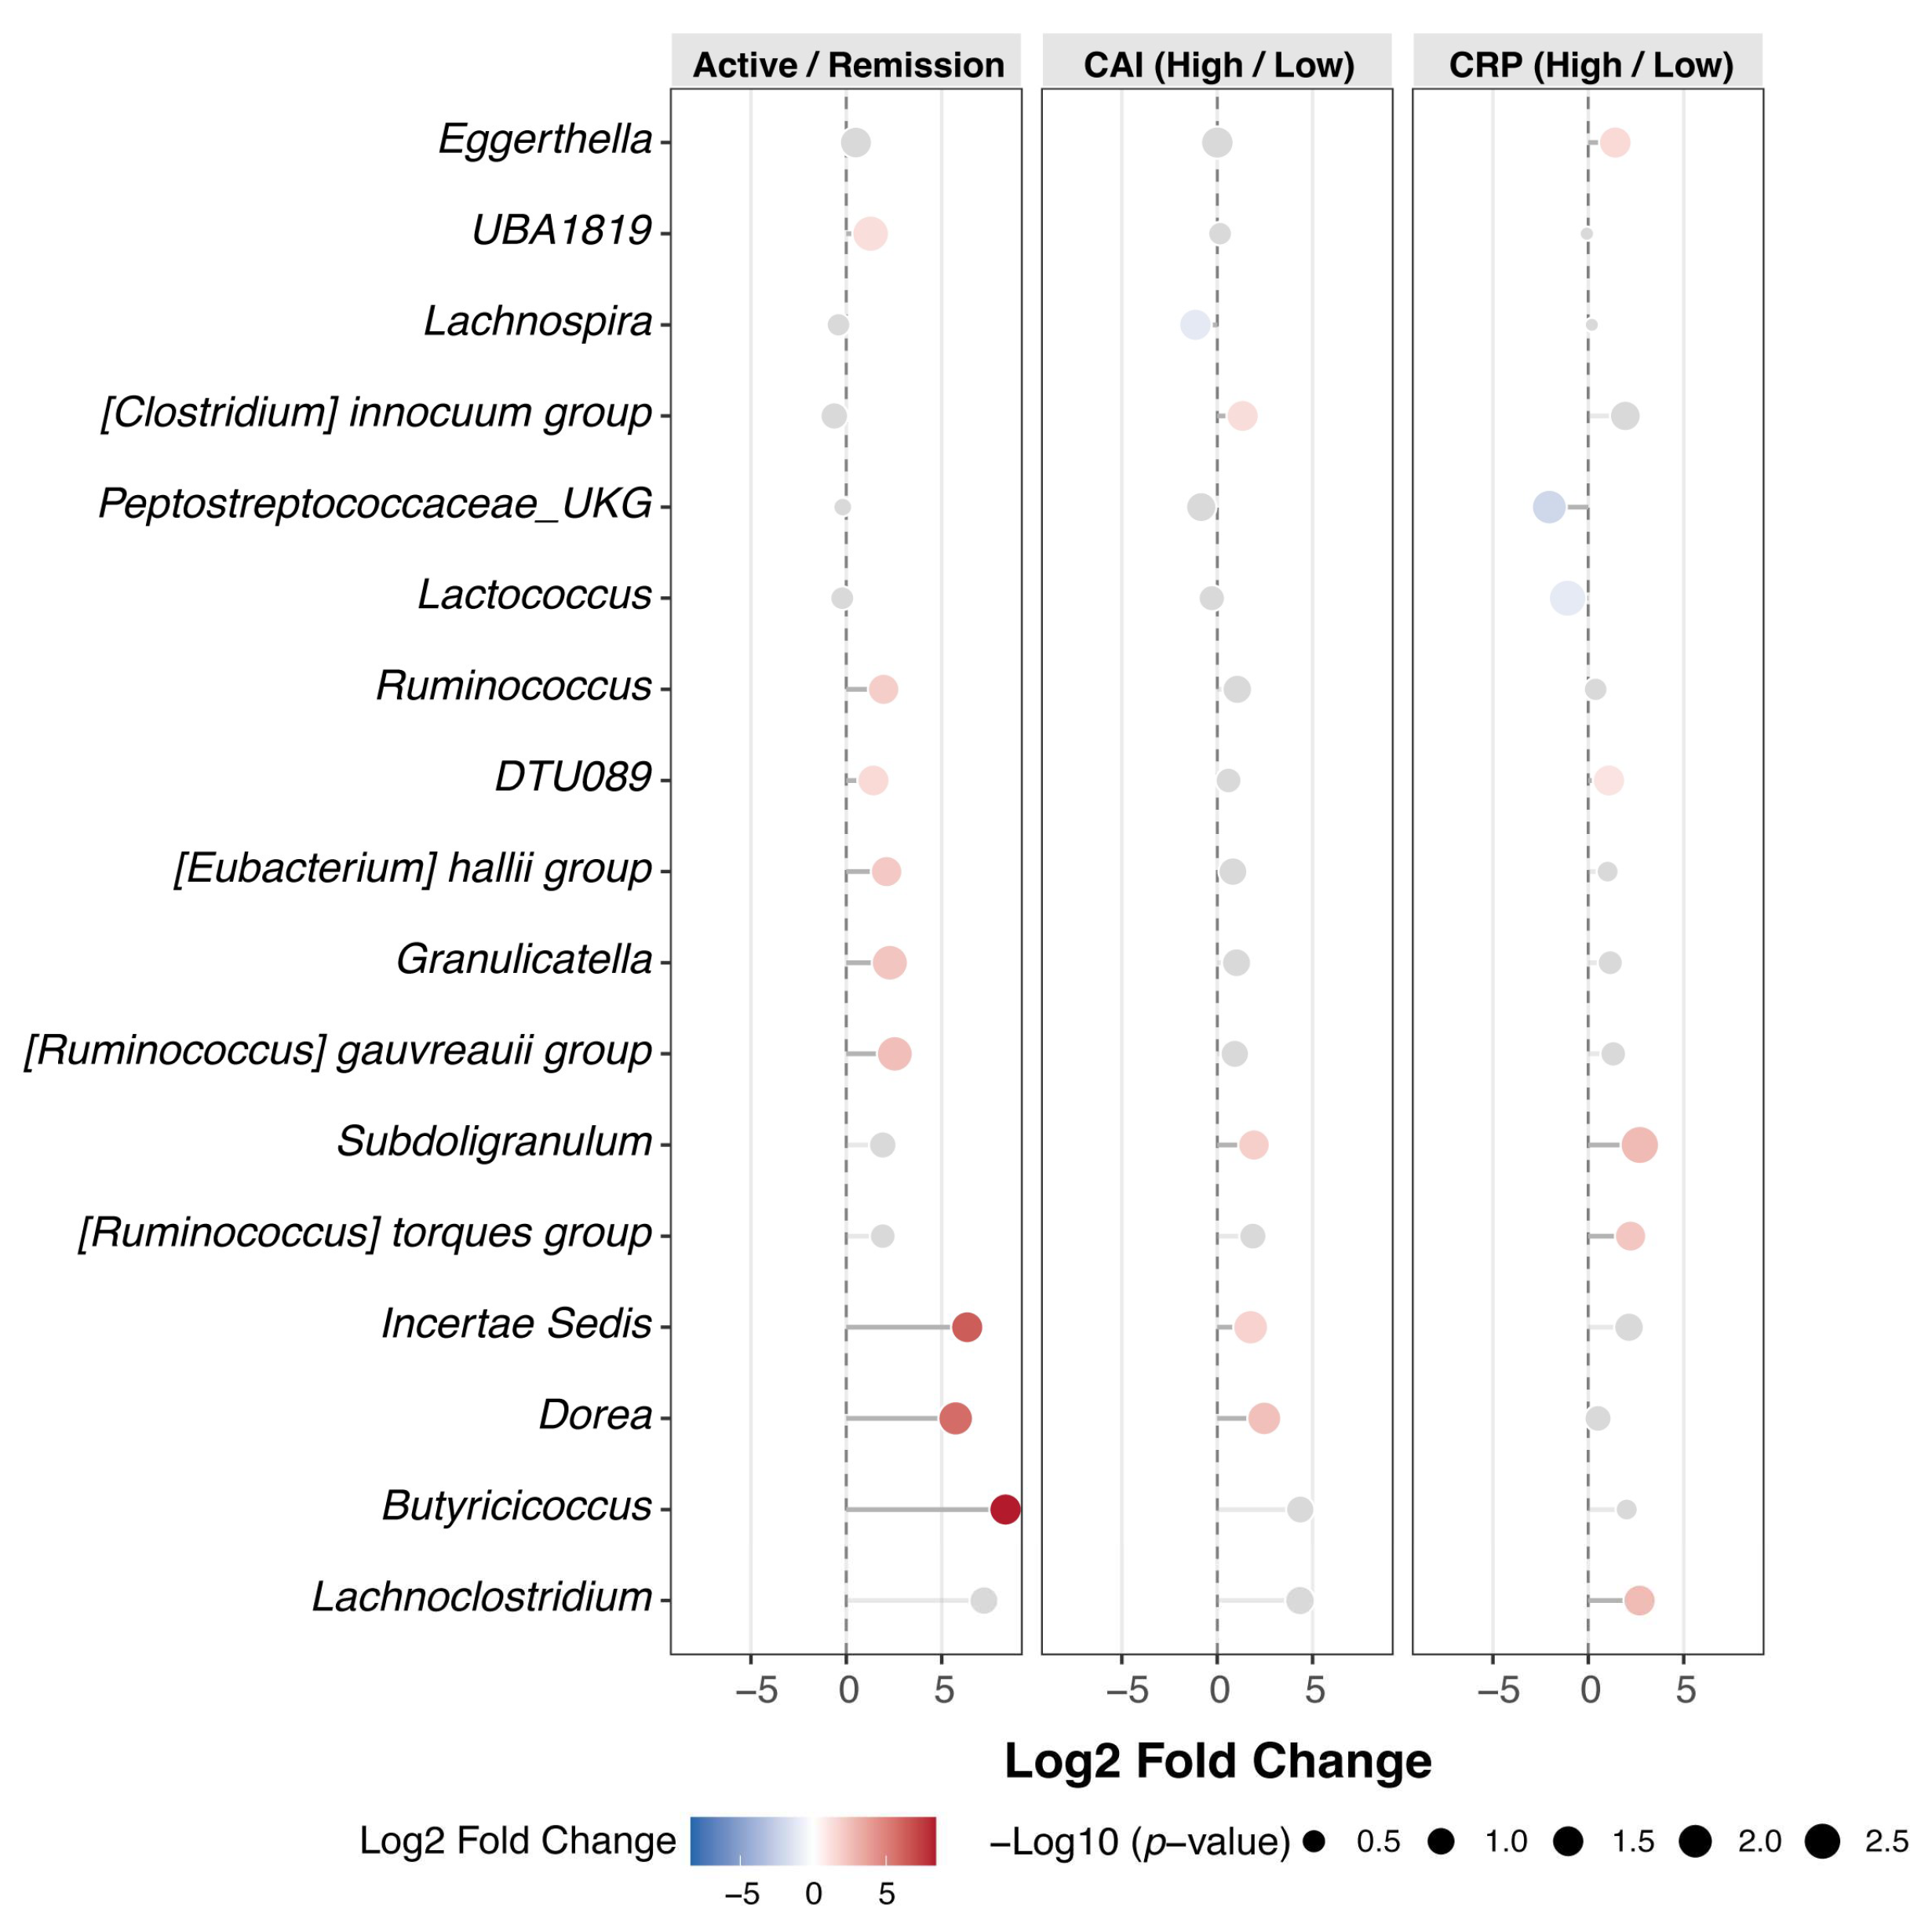
Figure 6.
Correlation analysis between the IgG+ Probability Score (IPS) of bacterial taxa and continuous clinical parameters. Heatmap illustrating the Spearman's rank correlation coefficients (Rho) between the IPS of individual bacterial taxa and various clinical parameters evaluated as continuous variables (WBC, PLT, CAI, CRP, IgE, IgM, IgG, and IgA) in patients with UC. Following a comprehensive pairwise correlation analysis across all taxa, the plot displays the bacterial taxa exhibiting the strongest significant correlations with at least one clinical parameter. Cell colors indicate the direction and magnitude of the correlation coefficient (Rho), with red representing a positive correlation and blue representing a negative correlation. Rows (bacterial taxa) and columns (clinical metadata) are ordered via hierarchical clustering based on the similarity of their correlation patterns. Asterisks within the cells denote the levels of statistical significance for the correlations (*p < 0.05, p < 0.01, ***p < 0.001). Abbreviations: CAI, Clinical Activity Index; CRP, C-reactive protein; WBC, White blood cell; PLT, Platelets.
Figure 6.
Correlation analysis between the IgG+ Probability Score (IPS) of bacterial taxa and continuous clinical parameters. Heatmap illustrating the Spearman's rank correlation coefficients (Rho) between the IPS of individual bacterial taxa and various clinical parameters evaluated as continuous variables (WBC, PLT, CAI, CRP, IgE, IgM, IgG, and IgA) in patients with UC. Following a comprehensive pairwise correlation analysis across all taxa, the plot displays the bacterial taxa exhibiting the strongest significant correlations with at least one clinical parameter. Cell colors indicate the direction and magnitude of the correlation coefficient (Rho), with red representing a positive correlation and blue representing a negative correlation. Rows (bacterial taxa) and columns (clinical metadata) are ordered via hierarchical clustering based on the similarity of their correlation patterns. Asterisks within the cells denote the levels of statistical significance for the correlations (*p < 0.05, p < 0.01, ***p < 0.001). Abbreviations: CAI, Clinical Activity Index; CRP, C-reactive protein; WBC, White blood cell; PLT, Platelets.
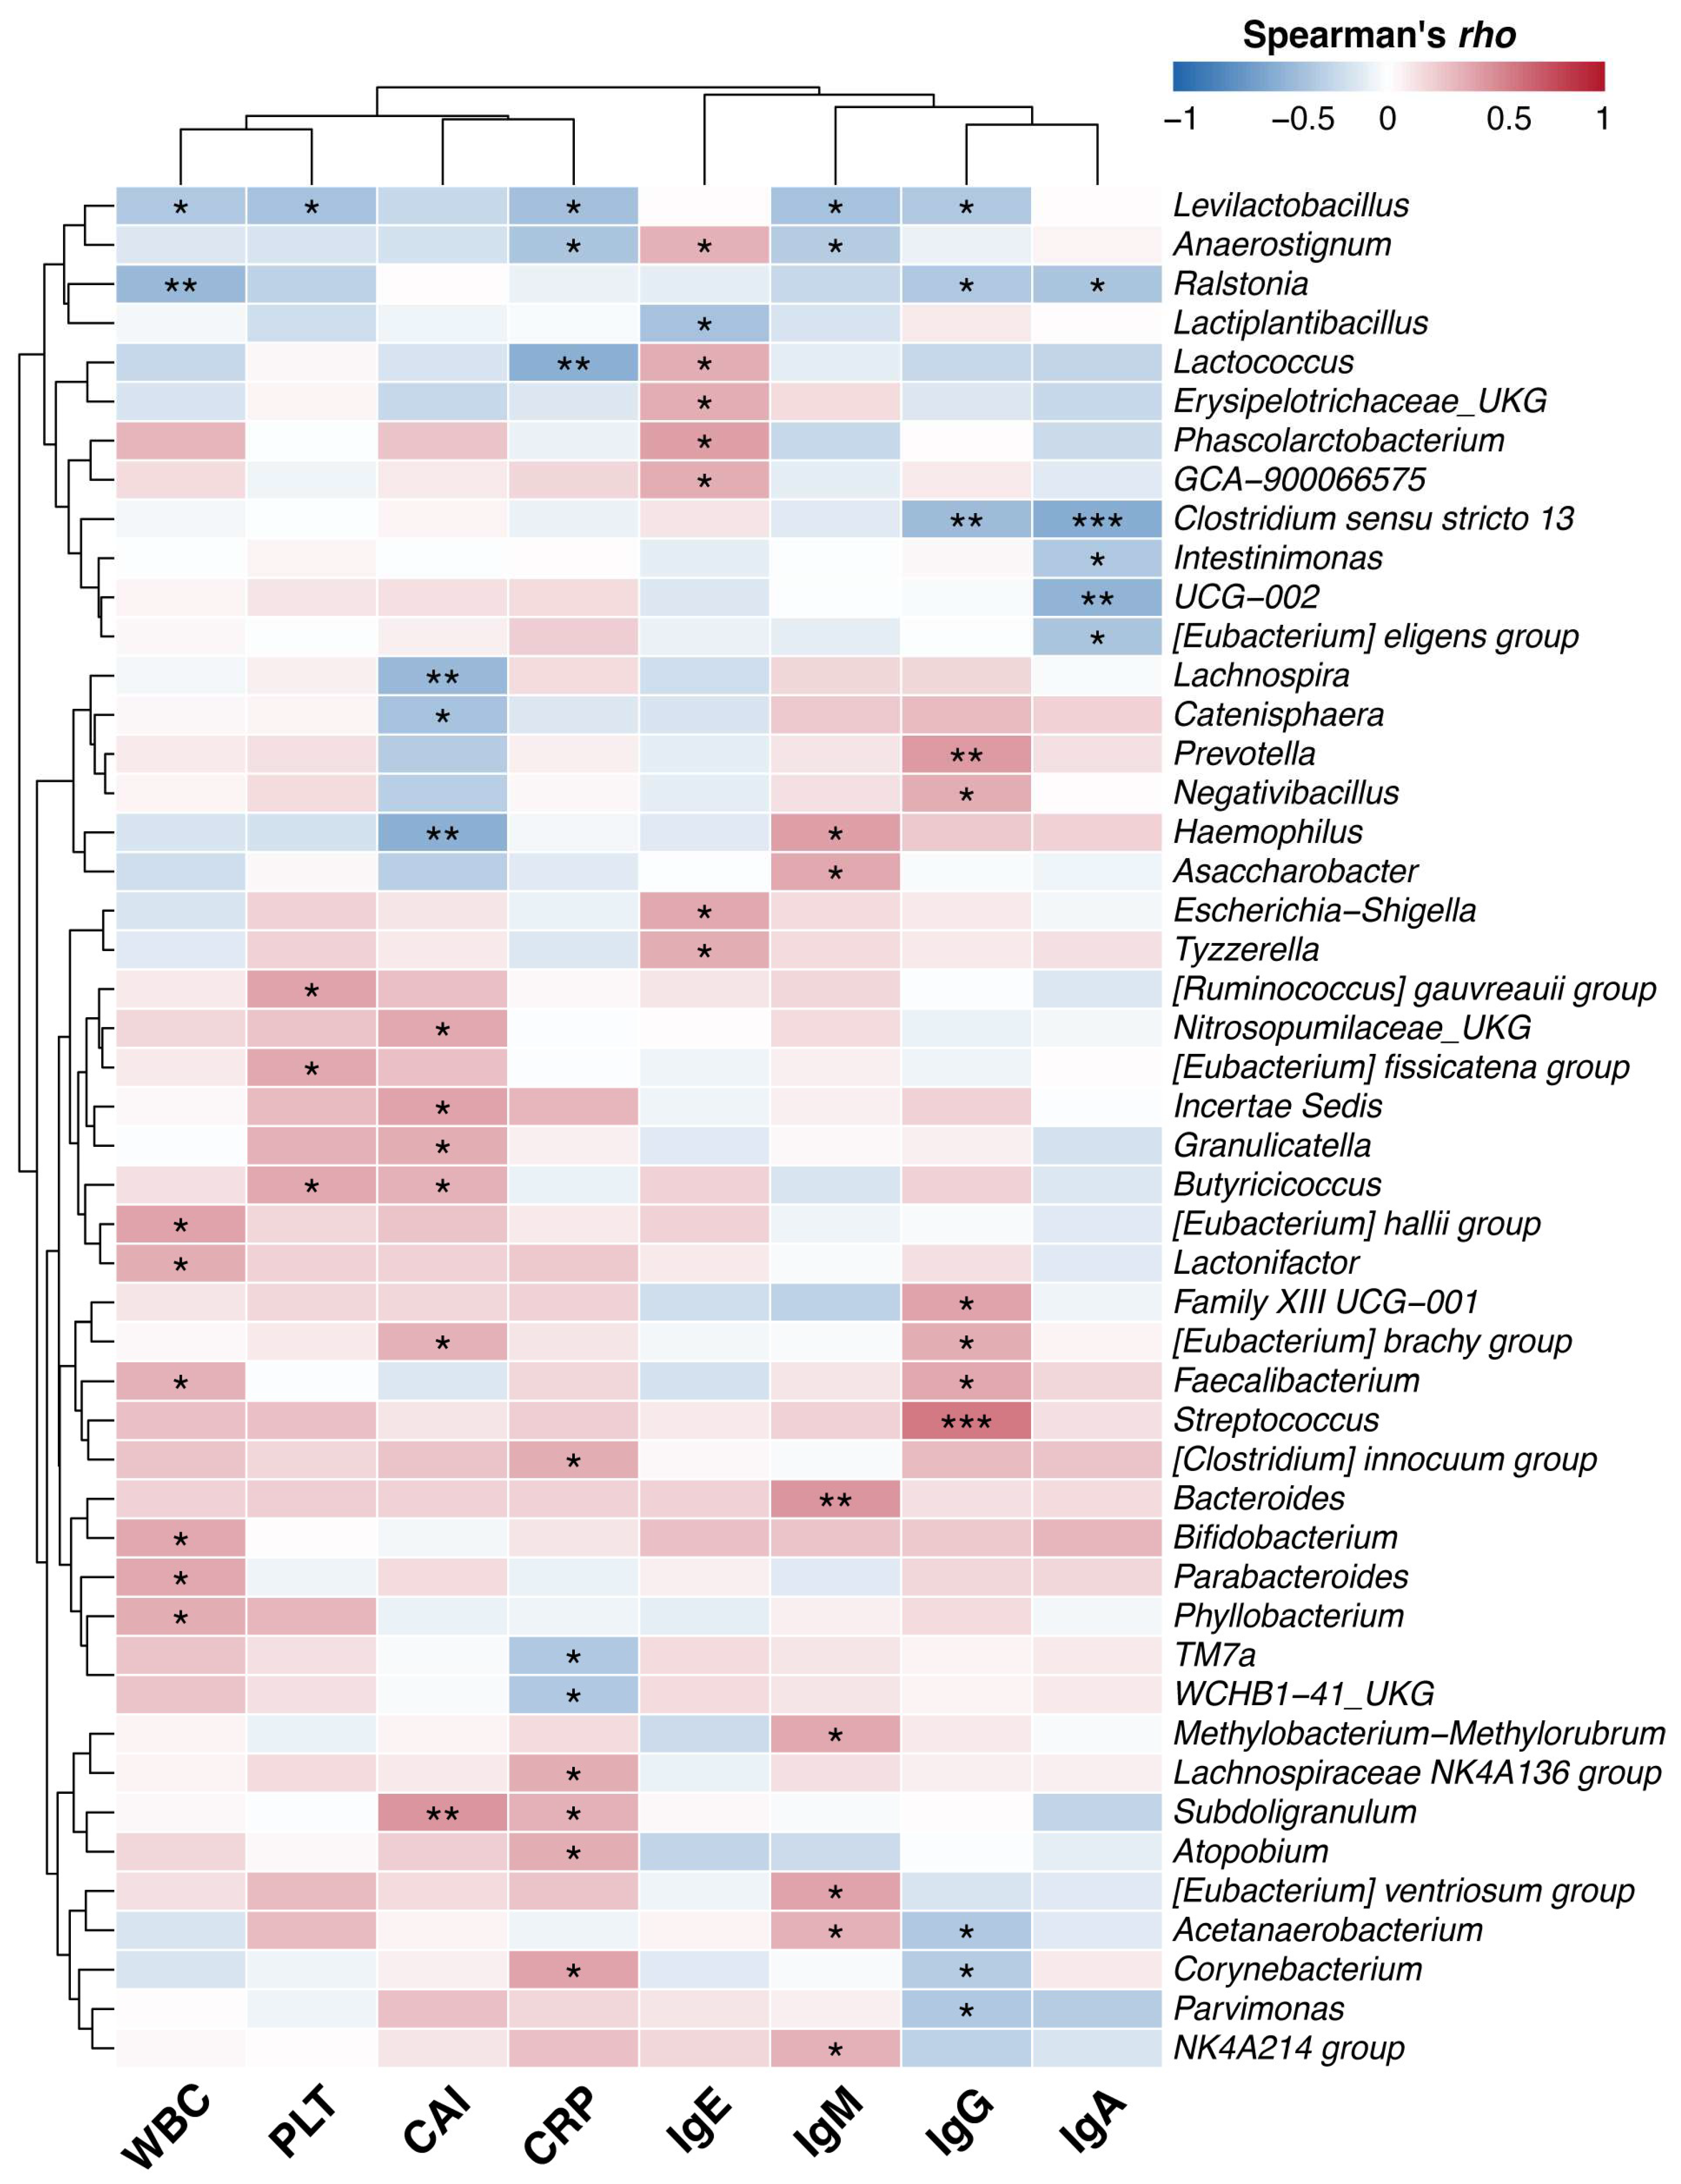
Figure 7.
Variation profile of the functional IgG+ Probability Score (IPS) in predicted metabolic pathways based on clinical parameters. Bubble heatmap illustrating variations in the functional IPS of predicted metabolic pathways across dichotomous comparisons for each clinical phenotype. Metabolic pathway profiles were predicted using PICRUSt2 based on 16S rRNA gene sequencing data. The evaluated clinical parameters comprise disease activity (active vs. remission phase), as well as the Clinical Activity Index (CAI) and C-reactive protein (CRP) levels (high vs. low groups for each). The functional IPS mathematically integrates the sample-specific IgG binding rate to correct for background abundance bias, robustly reflecting the relative targeting of each predicted metabolic pathway by systemic IgG. Among the pathways exhibiting statistically significant variations (p < 0.05, Wilcoxon rank-sum test) in each two-group comparison, the top 30 pathways with the highest absolute log2 fold changes were extracted and plotted for each direction of variation. Pathways on the y-axis are ordered via hierarchical clustering based on the similarity of their variation patterns. The color of the dot in each cell represents the log2 fold change, with red indicating a relative increase (upregulation) of the functional IPS in the exacerbated groups (active phase or high-value groups) and blue indicating a relative increase in the control groups (remission phase or low-value groups). The size of each dot reflects the magnitude of statistical significance (-log10 p-value) for each comparison. Abbreviations: CAI, Clinical Activity Index; CRP, C-reactive protein. (A) The top 30 metabolic pathways specifically upregulated in the clinically exacerbated and high immune response groups. (B) The top 30 metabolic pathways specifically enriched (downregulated) in the remission and low immune response groups.
Figure 7.
Variation profile of the functional IgG+ Probability Score (IPS) in predicted metabolic pathways based on clinical parameters. Bubble heatmap illustrating variations in the functional IPS of predicted metabolic pathways across dichotomous comparisons for each clinical phenotype. Metabolic pathway profiles were predicted using PICRUSt2 based on 16S rRNA gene sequencing data. The evaluated clinical parameters comprise disease activity (active vs. remission phase), as well as the Clinical Activity Index (CAI) and C-reactive protein (CRP) levels (high vs. low groups for each). The functional IPS mathematically integrates the sample-specific IgG binding rate to correct for background abundance bias, robustly reflecting the relative targeting of each predicted metabolic pathway by systemic IgG. Among the pathways exhibiting statistically significant variations (p < 0.05, Wilcoxon rank-sum test) in each two-group comparison, the top 30 pathways with the highest absolute log2 fold changes were extracted and plotted for each direction of variation. Pathways on the y-axis are ordered via hierarchical clustering based on the similarity of their variation patterns. The color of the dot in each cell represents the log2 fold change, with red indicating a relative increase (upregulation) of the functional IPS in the exacerbated groups (active phase or high-value groups) and blue indicating a relative increase in the control groups (remission phase or low-value groups). The size of each dot reflects the magnitude of statistical significance (-log10 p-value) for each comparison. Abbreviations: CAI, Clinical Activity Index; CRP, C-reactive protein. (A) The top 30 metabolic pathways specifically upregulated in the clinically exacerbated and high immune response groups. (B) The top 30 metabolic pathways specifically enriched (downregulated) in the remission and low immune response groups.
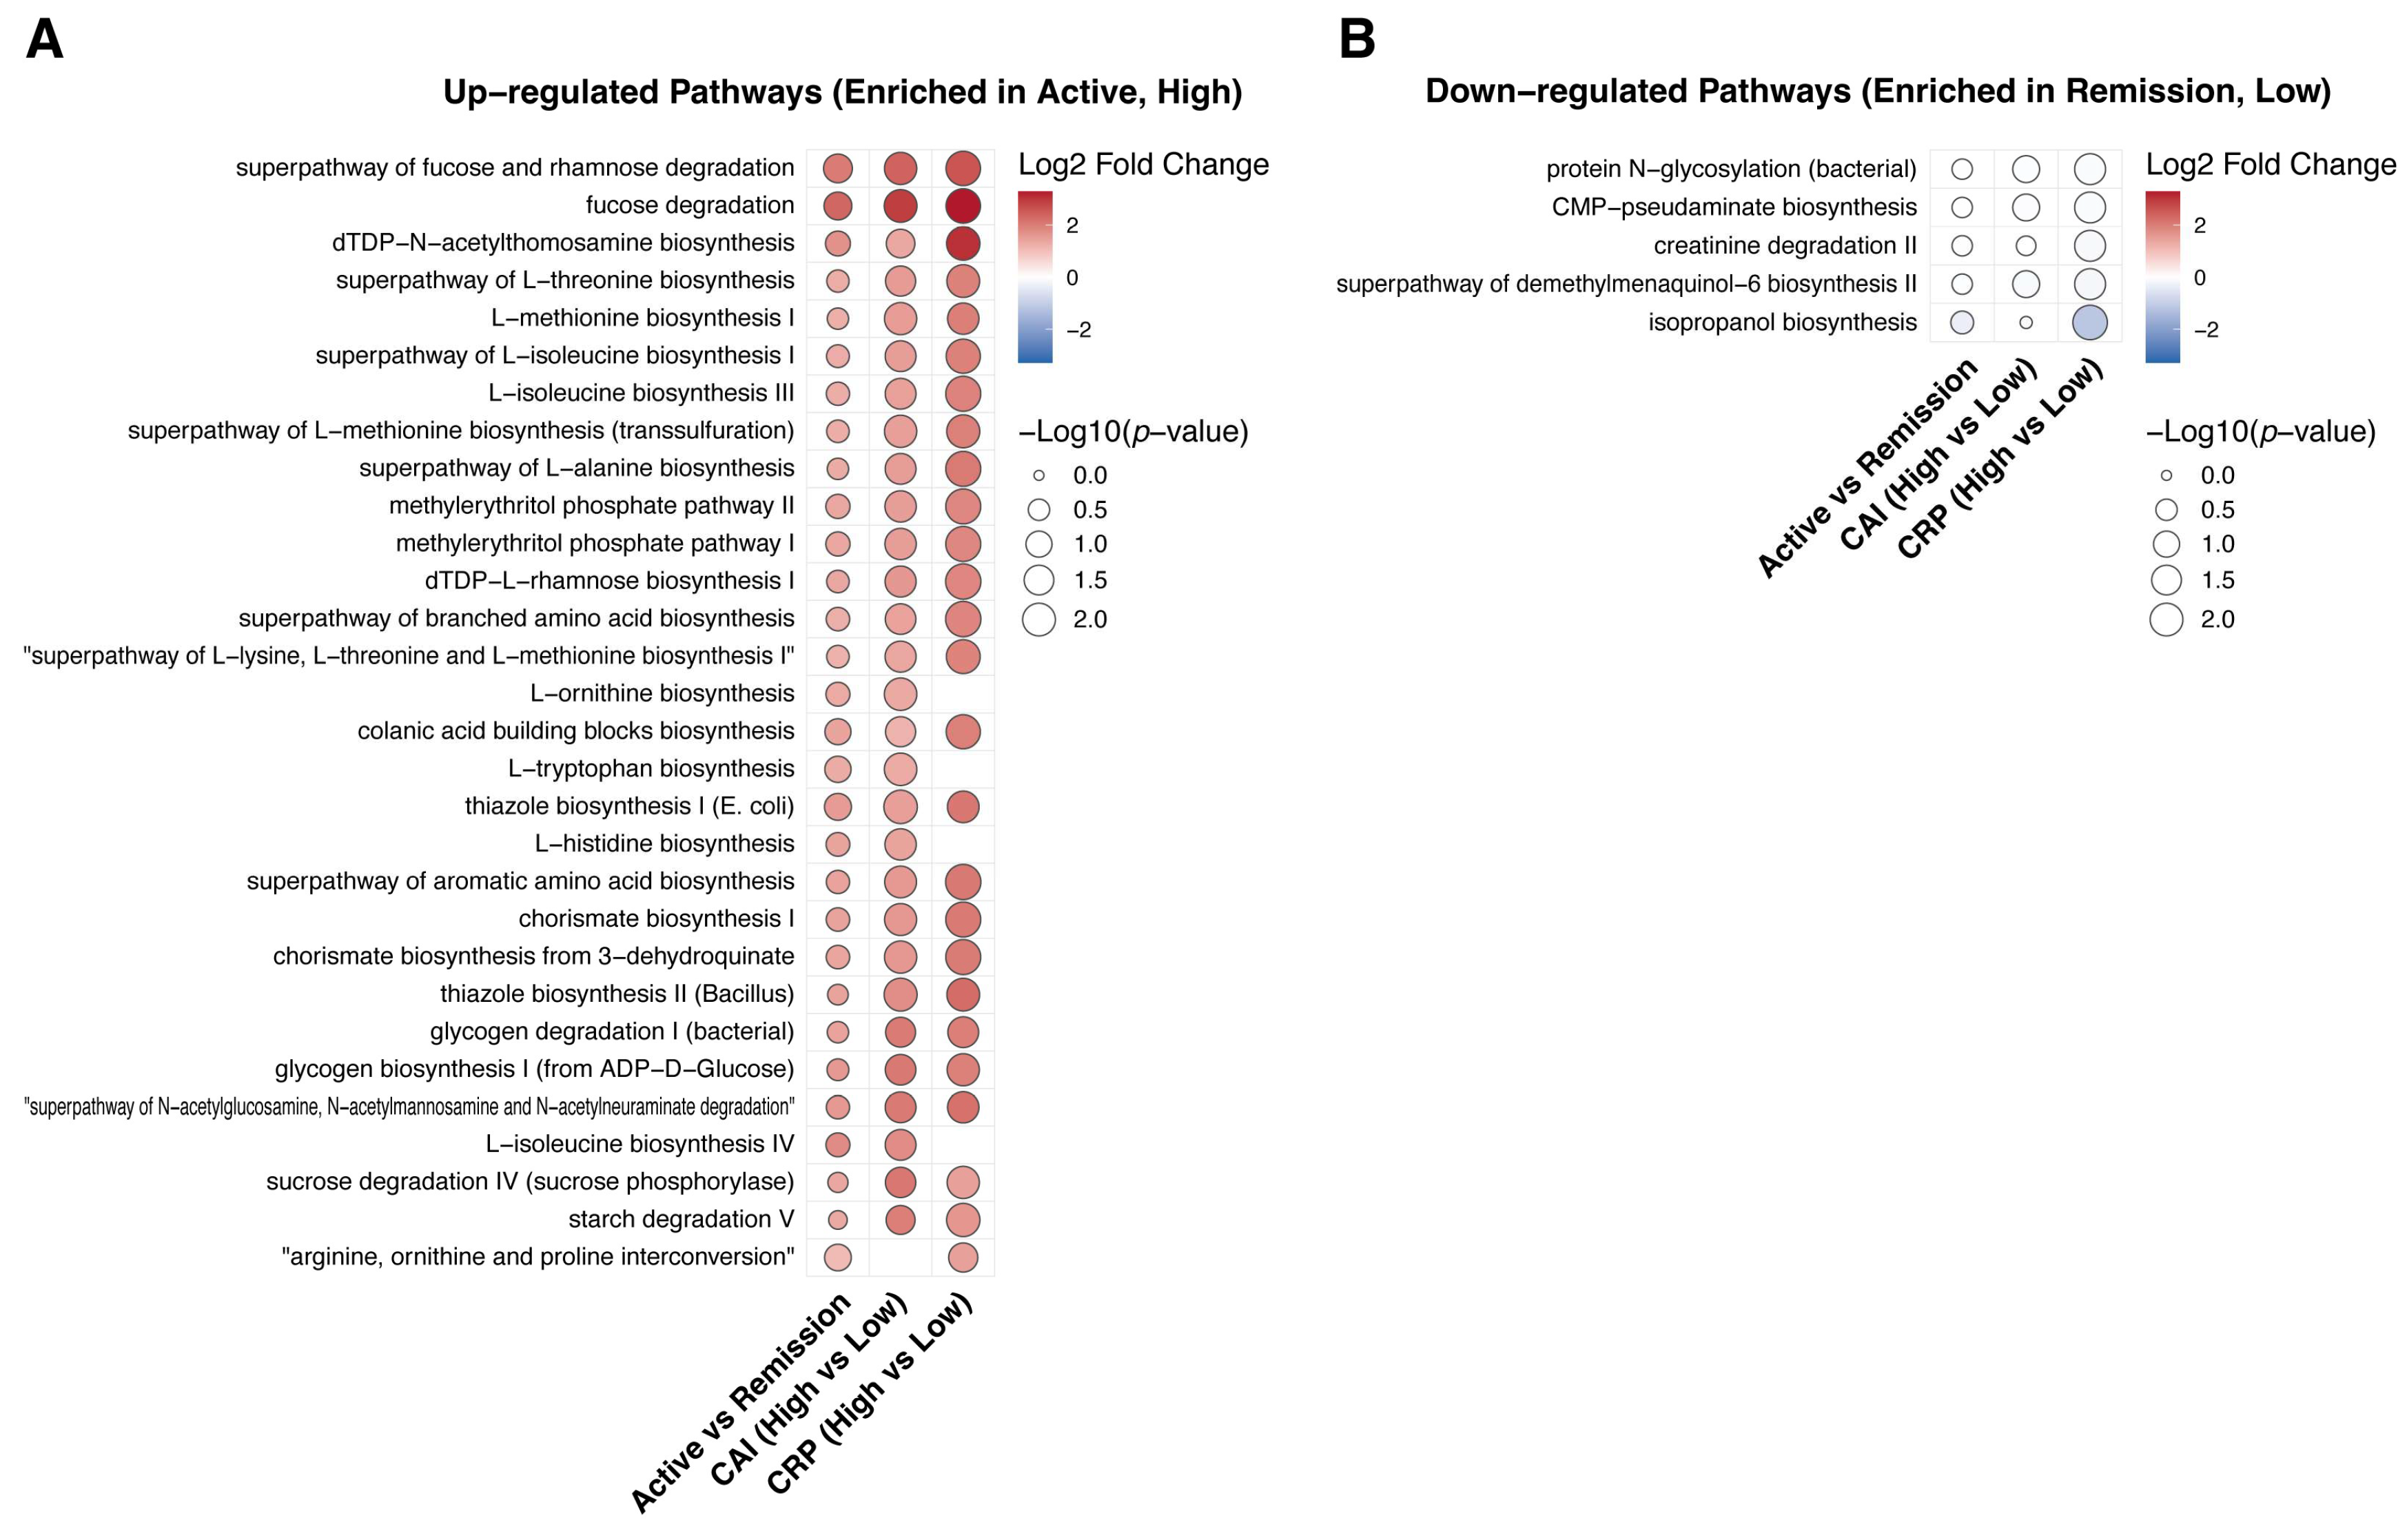
Figure 8.
Predictive modeling of ulcerative colitis clinical outcomes and identification of key taxa based on IgG+ Probability Score (IPS) profiling. (A, C, E) ROC curves of predictive models for three distinct clinical outcomes, constructed using the Random Forest algorithm. The prediction targets comprise disease exacerbation (Active vs. Remission) in (A), local clinical activity (high vs. low CAI) in (C), and systemic inflammation (high vs. low CRP) in (E). Each plot compares the predictive accuracy (AUC) among three models: a model incorporating the IPS of all bacterial taxa as input variables (1. Unbiased All-IPS Panel, green); a model restricted to pre-selected taxa (2. Target IPS Panel, blue); and an optimized model reconstructed using only the top 5 to 8 taxa extracted from the Target IPS Panel based on variable importance (3. Top Mini Panel, red). The shaded regions surrounding each ROC curve denote the 95% confidence intervals for sensitivity, calculated via bootstrapping. (B, D, F) Bar plots illustrating the top-ranking taxa based on variable importance (Mean Decrease Gini) within the Target IPS Panel models for each prediction target. Plot (B) corresponds to the predictive model for disease exacerbation, (D) for CAI, and (F) for CRP. The color of each bar indicates the directional clinical phenotype in which the IPS of the respective taxon was relatively enriched in prior analyses: red reflects specific enrichment in the exacerbated groups (active phase or high-value groups), whereas blue reflects specific enrichment in the control groups (remission phase or low-value groups). Abbreviations: CAI, Clinical Activity Index; CRP, C-reactive protein.
Figure 8.
Predictive modeling of ulcerative colitis clinical outcomes and identification of key taxa based on IgG+ Probability Score (IPS) profiling. (A, C, E) ROC curves of predictive models for three distinct clinical outcomes, constructed using the Random Forest algorithm. The prediction targets comprise disease exacerbation (Active vs. Remission) in (A), local clinical activity (high vs. low CAI) in (C), and systemic inflammation (high vs. low CRP) in (E). Each plot compares the predictive accuracy (AUC) among three models: a model incorporating the IPS of all bacterial taxa as input variables (1. Unbiased All-IPS Panel, green); a model restricted to pre-selected taxa (2. Target IPS Panel, blue); and an optimized model reconstructed using only the top 5 to 8 taxa extracted from the Target IPS Panel based on variable importance (3. Top Mini Panel, red). The shaded regions surrounding each ROC curve denote the 95% confidence intervals for sensitivity, calculated via bootstrapping. (B, D, F) Bar plots illustrating the top-ranking taxa based on variable importance (Mean Decrease Gini) within the Target IPS Panel models for each prediction target. Plot (B) corresponds to the predictive model for disease exacerbation, (D) for CAI, and (F) for CRP. The color of each bar indicates the directional clinical phenotype in which the IPS of the respective taxon was relatively enriched in prior analyses: red reflects specific enrichment in the exacerbated groups (active phase or high-value groups), whereas blue reflects specific enrichment in the control groups (remission phase or low-value groups). Abbreviations: CAI, Clinical Activity Index; CRP, C-reactive protein.
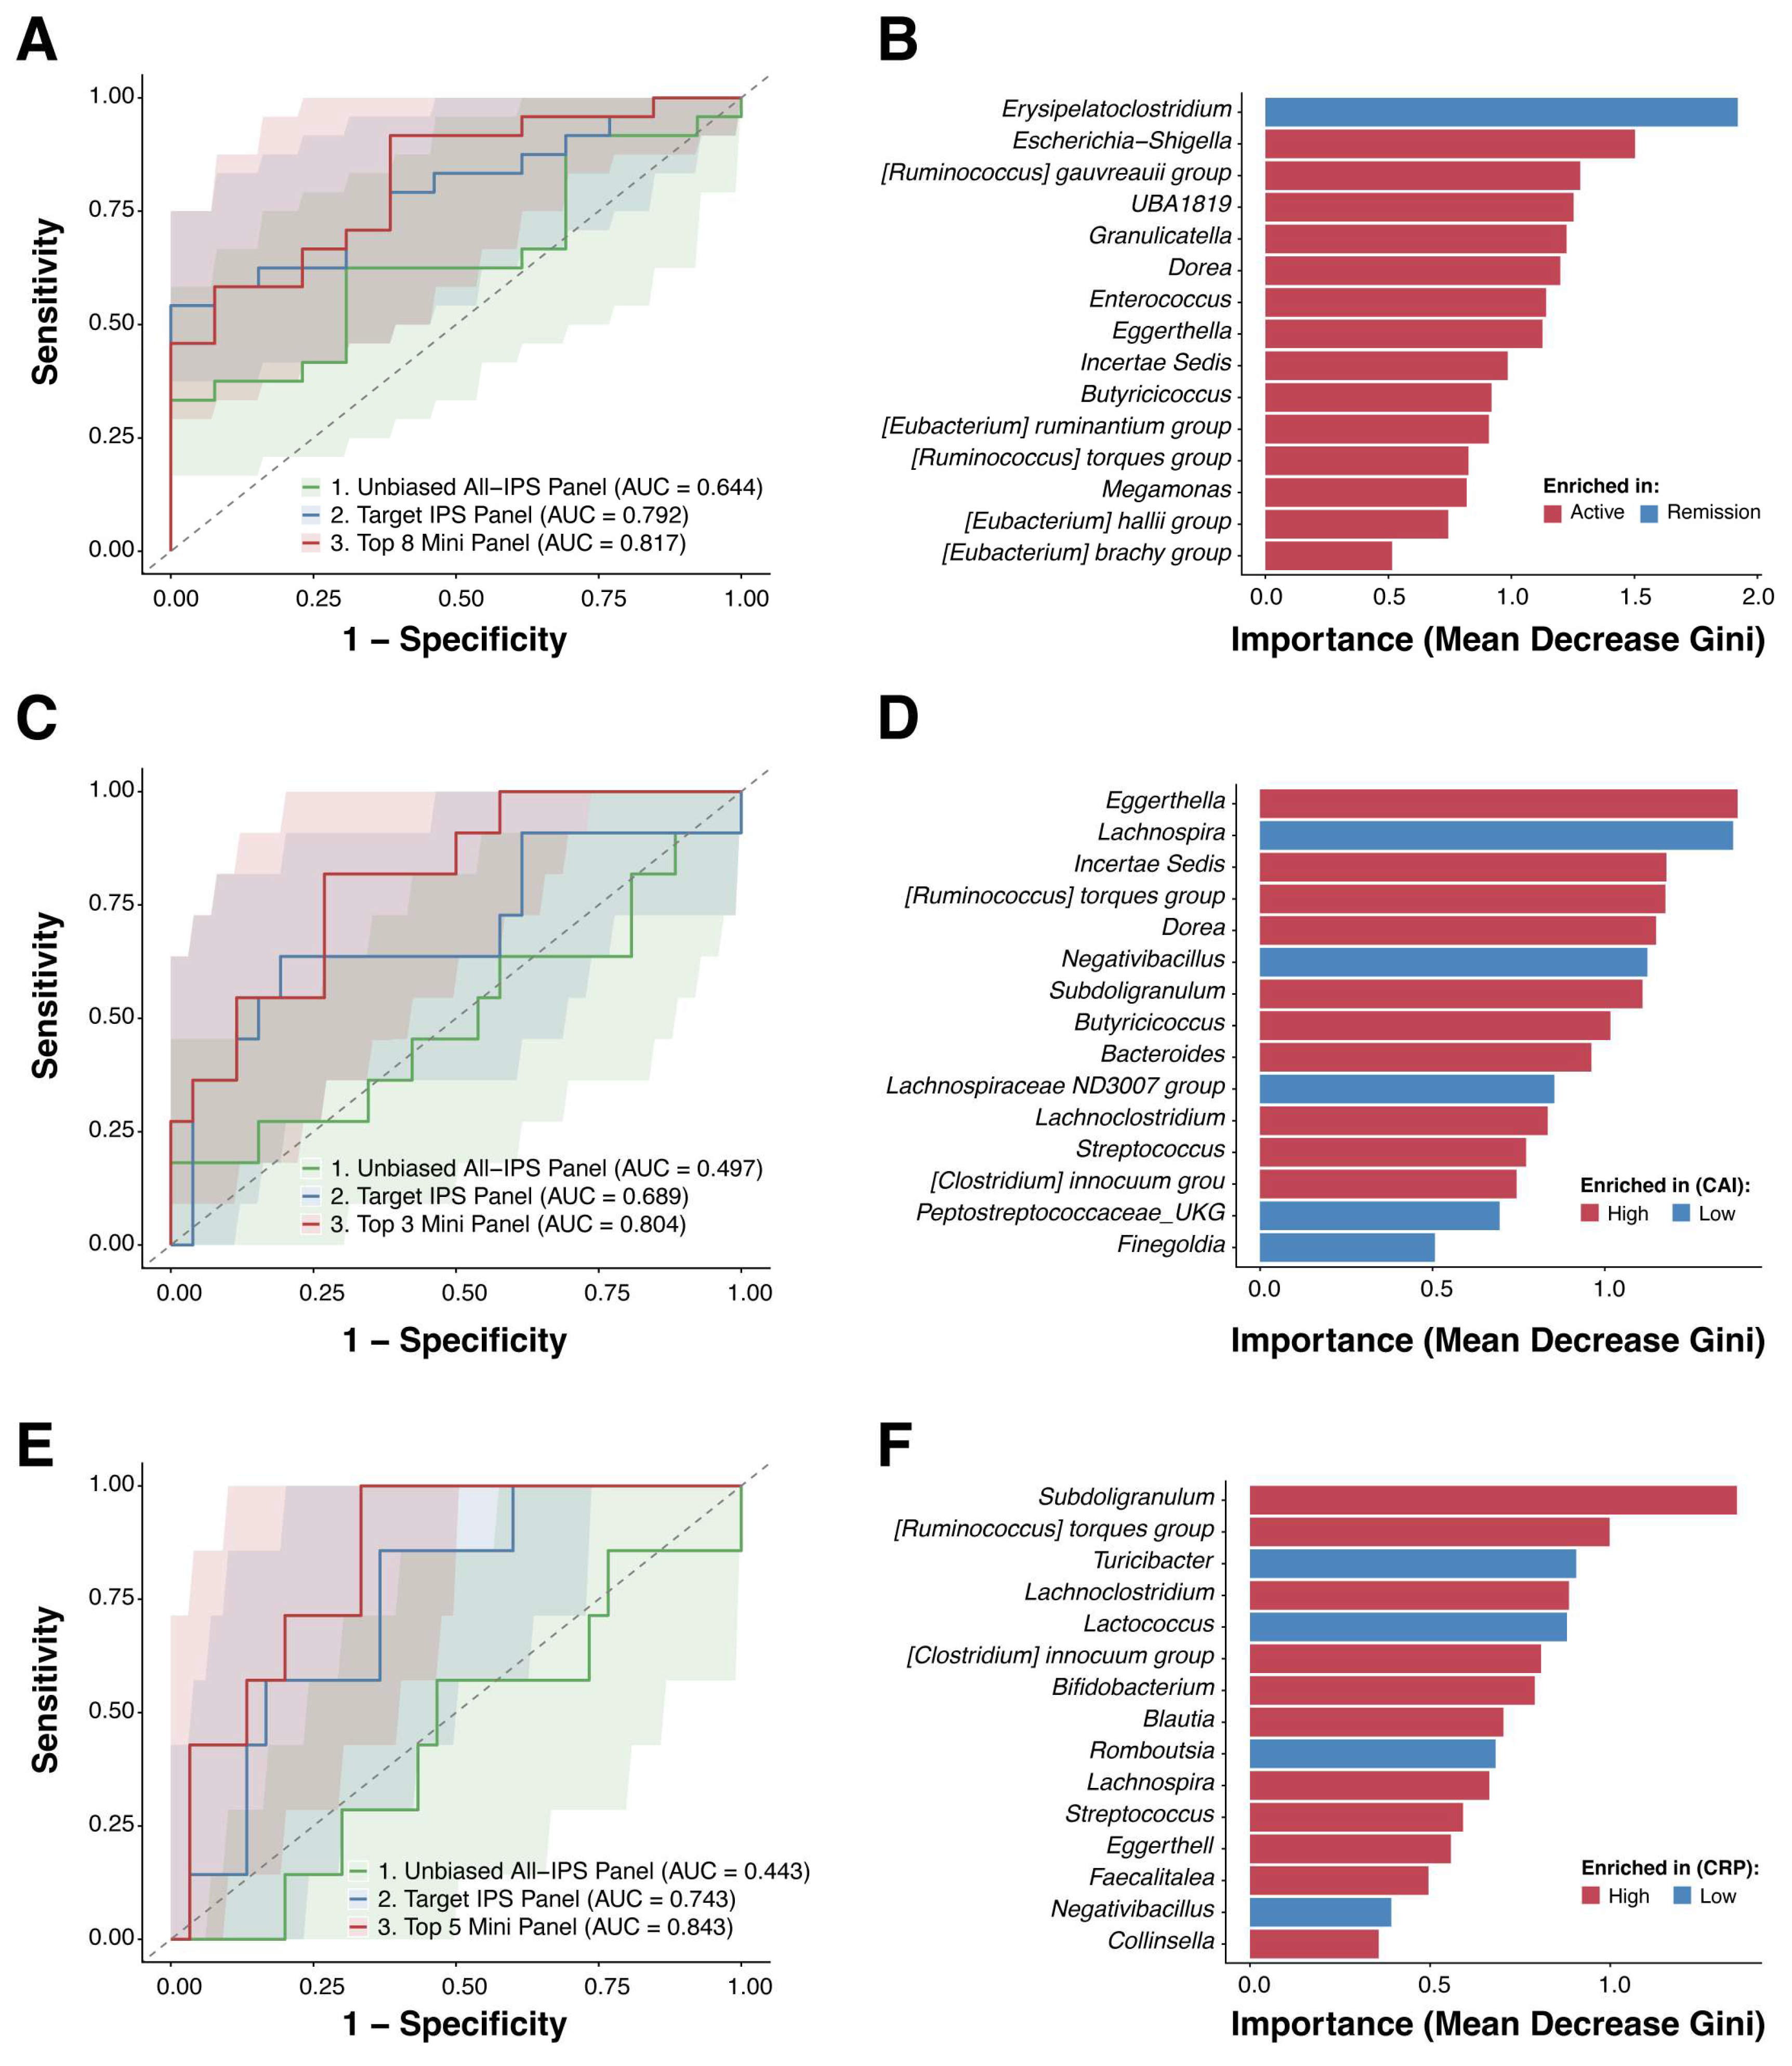

Table 1.
Clinical characteristics of the UC patients.
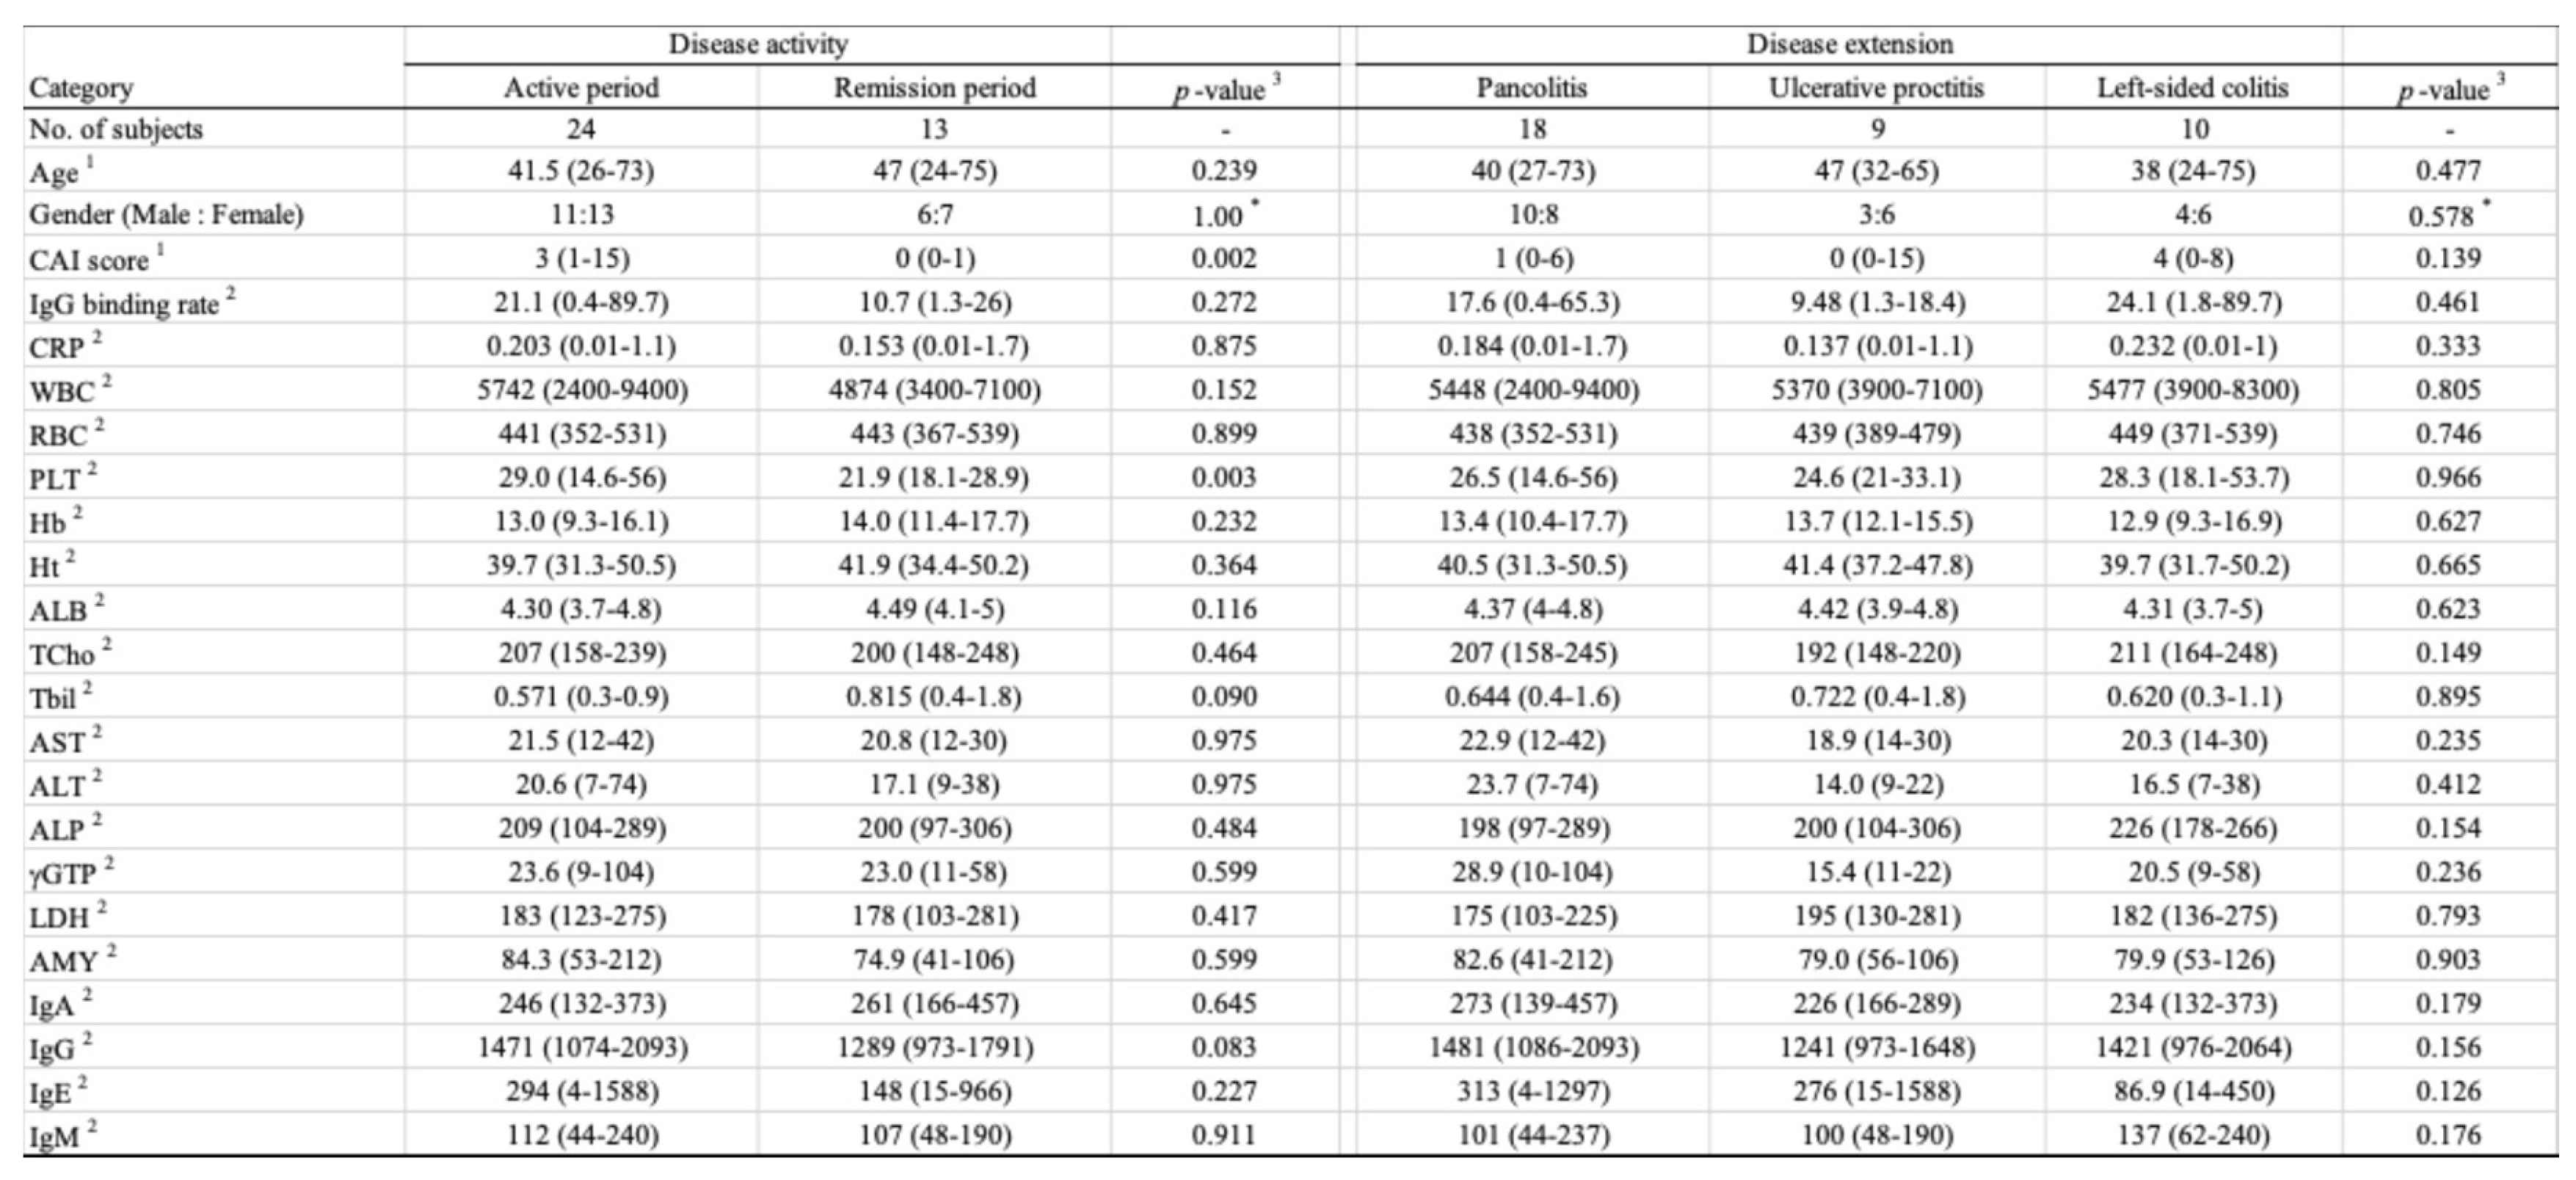
Disclaimer/Publisher’s Note: The statements, opinions and data contained in all publications are solely those of the individual author(s) and contributor(s) and not of MDPI and/or the editor(s). MDPI and/or the editor(s) disclaim responsibility for any injury to people or property resulting from any ideas, methods, instructions or products referred to in the content. |
© 2026 by the authors. Licensee MDPI, Basel, Switzerland. This article is an open access article distributed under the terms and conditions of the Creative Commons Attribution (CC BY) license.
Copyright: This open access article is published under a Creative Commons CC BY 4.0 license, which permit the free download, distribution, and reuse, provided that the author and preprint are cited in any reuse.